
Abstract
The question remains whether reduced cerebral blood flow (CBF) leads to brain atrophy or vice versa. We studied the longitudinal relation between CBF and brain volume in a community-dwelling population. In the Rotterdam Study, 3011 participants (mean age 59.6 years (s.d. 8.0)) underwent repeat brain magnetic resonance imaging to quantify brain volume and CBF at two time points. Adjusted linear regression models were used to investigate the bidirectional relation between CBF and brain volume. We found that smaller brain volume at baseline was associated with a steeper decrease in CBF in the whole population (standardized change per s.d. increase of total brain volume (TBV) = 0.296 (95% confidence interval (CI) 0.200; 0.393)). Only in persons aged ≥ 65 years, a lower CBF at baseline was associated with steeper decline of TBV (standardized change per s.d. increase of CBF = 0.003 (95% CI −0.004; 0.010) in the whole population and 0.020 (95% CI 0.004; 0.036) in those aged ≥65 years of age). Our results indicate that brain atrophy causes CBF to decrease over time, rather than vice versa. Only in persons aged >65 years of age did we find lower CBF to also relate to brain atrophy.
INTRODUCTION
Brain atrophy is an important hallmark of dementia but is also frequently observed in normal aging.1–5 The process of brain atrophy occurs over a period of many years and is partly determined by the accumulation of cardiovascular pathology.2,5–7 It has been shown that vascular risk factors such as hypertension, diabetes mellitus, and smoking are associated with accelerated brain atrophy.6,8–10 In parallel, several studies have shown that a smaller brain volume is often accompanied by a lower cerebral blood flow (CBF).11,12 One proposed mechanism is that a smaller brain volume leads to reduced metabolic demand, which in turn may lead to a lower CBF. 13 Conversely, it has been hypothesized that, at older age, CBF tends to decline, possibly because of impaired auto-regulation. 14 As a result of cerebral hypoperfusion, brain atrophy may occur.15,16 Experimental evidence from animal models indeed suggests that cerebral hypoperfusion leads to cerebral microvascular damage, neuropathologic processes, and cognitive dysfunction, supporting the concept that cerebral hypoperfusion causes neurodegeneration.17,18 Yet, the majority of studies in human subjects linking CBF to brain atrophy had a cross-sectional design, precluding unraveling cause and effect in the association. The question therefore remains whether reduced CBF leads to brain atrophy or vice versa. Understanding the longitudinal and bidirectional relationship between reduced CBF and brain atrophy in elderly, free of a clinical diagnosis of dementia, will increase insight into the pathophysiologic role of cerebral perfusion in the development of dementia. Against this background, the aim of the present study was to study the inter-relationship between CBF and brain volume on magnetic resonance imaging (MRI) in community-dwelling middle-aged and elderly persons during an average follow-up of 4 years. Furthermore, we investigated the effect of age on this bidirectional longitudinal association.
MATERIALS AND METHODS
Study Population
The Rotterdam Study is an ongoing prospective population-based cohort designed to investigate chronic diseases in the middle-aged and elderly population. The study started in 1990 and comprised 7,983 participants aged ≥ 55 years. In 2000 and 2006, the study was expanded and at present comprises 14,926 participants aged ≥45 years. 19 Brain MRI was implemented from 2005 onwards, including a measurement of CBF. 20 All participants are invited every 3 to 4 years for repeat study examinations. Demented subjects were excluded based on a three-step protocol described in detail previously. 21 For the present study, we included all non-demented participants who had at least two complete brain MRI examinations, between August 2005 and August 2013. This resulted in 3,263 study participants, with an average scan interval of 3.9 years (range 1.9 to 6.5 years). The Rotterdam Study has been approved by the institutional review board of Erasmus MC University Medical Center (Medical Ethics Committee), in accordance with the Helsinki Declaration of 1975 (and revised in 1983), and in accordance with the Population Study Act Rotterdam Study, executed by the Ministry of Health, Welfare and Sports of the Netherlands. A written informed consent was obtained from all participants.
Magnetic Resonance Imaging Acquisition and Postprocessing
Brain MRI at both time points was identical and was performed on a 1.5-T MRI scanner (Signa Excite II, General Electric Healthcare, Milwaukee, WI, USA) using an eight-channel head coil. Briefly, the protocol included the following high-resolution sequences: T1-weighted sequence (T1), proton density-weighted sequence, and a T2-weighted fluid-attenuated inversion recovery sequence. Detailed information regarding scanning protocol has been described elsewhere. 20 For CBF measurement, 2D phase-contrast imaging was performed as described previously. 22
For the assessment of brain volume measurements, we used an automated tissue segmentation that has been described elsewhere. 23 It is based on a k-nearest-neighbor brain tissue classifier extended with white matter lesion (WML) segmentation. Total brain volume (TBV) was defined as the sum of gray matter (GM) volume and total white matter (WM) volume. Total WM volume was a summation of normal appearing WM and WML. Intracranial volume was calculated by summing the TBV and the volumes of the sulcal and ventricular cerebrospinal fluid. All automatically obtained tissue segmentations were visually inspected and manually corrected if needed. All scans were rated by one of five trained research-physicians to determine the presence and location of infarcts. 20 Infarcts showing involvement of GM were classified as cortical infarcts.
Cerebral Blood Flow Measurements
Flow was calculated from the phase-contrast images using interactive data language-based custom software (Cinetool version 4; General Electric Healthcare). In short, blood flow velocity (mm/sec) was measured using manually drawn regions of interest on the 2D phase-contrast images in both carotids and the basilar artery at a level just under the skull base. 22 Flow rates were calculated from the velocity and cross-sectional area of the vessels. Total cerebral blood flow (tCBF) was determined by adding flow rates for the carotid arteries and the basilar artery and expressed in ml/min. 22
Two independent, experienced technicians drew all the manual regions of interest and performed subsequent flow measurements. Reproducibility of the flow measurements has been reported previously, with inter-rater correlations of >0.94 (N = 533) for all vessels, indicating excellent agreement. 22
Covariates
Information on cardiovascular determinants was obtained by interview, physical examination, and blood sampling. 19 Systolic and diastolic blood pressure (mm Hg) were measured twice with a random-zero sphygmomanometer (Hawksley, Sussex, UK) and the average of the two measurements was used. Hypertension was defined as systolic blood pressure ≥ 140 mm Hg and/or diastolic blood pressure ≥ 90 mm Hg or the use of antihypertensive medication. 24 Information on use of antihypertensive medication was obtained by interview. Based on weight and height, the body mass index was calculated. Diabetes mellitus was defined as a fasting serum glucose level ≥7.0 mmol/l, or non-fasting serum glucose level ≥ 11.1 mmol/l, or use of anti-diabetic medication. 25 Serum glucose, total cholesterol, and high-density lipoprotein-cholesterol levels were acquired by an automated enzymatic procedure (Roche Diagnostics GmbH, Mannheim, Germany). Information on use of lipid-lowering medication was obtained by interview. Smoking habits were assessed by interview and categorized as ‘never’ or ‘ever’. Apolipoprotein E (APOE) genotyping was done on coded genomic DNA samples, 26 with allele frequencies being in Hardy–Weinberg equilibrium. APOE-ɛ4 carrier status was defined as carrier of one or two ɛ4 alleles. Assessment of significant carotid stenosis (>50%) was performed using 5-MHz pulsed Doppler ultrasonography through interpretation of velocity profiles according to standard criteria. 27 Apart from APOE-ɛ4 carrier status, we used the measurements of the covariates that were assessed at the baseline of this study (2005 to 2009).
Statistical Analysis
We excluded persons with MRI-defined cortical infarcts (n = 66) from analyses, as cortical infarcts may greatly affect brain volume measurements. Subjects with artifacts in the brain tissue segmentation of either baseline or follow-up scan (e.g., because of motion) that resulted in unusable brain volume estimates were excluded (n = 186), leaving a total of 3,011 persons in our analysis who had complete and useable baseline and follow-up CBF and brain volume measurements. Brain volume measurements and CBF measurements were Z-standardized (subtracting the mean and dividing by the s.d.). We applied linear regression to model the association between determinants at baseline and change in outcomes. We modeled change by using the follow-up value of the outcome as dependent variable while adjusting for its baseline value. This approach has shown to yield more statistical power than calculating change as difference in baseline and follow-up values. 28 Models were further adjusted for age, age × age, sex, scan interval, and intracranial volume (model I). GM volume and WM volume were also adjusted for each other both at baseline and follow-up to account for the intercorrelation. The analyses were repeated after additional adjustment for cardiovascular risk factors, and APOE-ɛ4 status (model II). As potential confounders, systolic and diastolic blood pressure, antihypertensive medication, body mass index, diabetes mellitus, total and high-density lipoprotein-cholesterol levels, lipid-lowering medication, smoking, and presence of carotid stenosis were taken into account. Moreover, we stratified by age at baseline (dichotomized at 65 years of age), and we repeated all analyses for both strata without adjustment for age × age in both the models.
We further explored the role of the presence of hypertension, diabetes mellitus, and smoking on the association between CBF and brain volume measurements bidirectionally. For this, we stratified by hypertension, diabetes mellitus, and smoking, and all analyses were repeated. To correct for multiple testing, we applied Sidak correction. 29 The Sidak corrected significance level to maintain α-level = 0.05 for testing four correlated values (TBV, GM volume, total WM volume, and tCBF (mean correlation ρ = 0.61)) was determined at P < 0.029.
Finally, we carried out the following sensitivity analyses: (1) excluding those participants with a significant carotid stenosis, and (2) replacing total WM volume in analyses for normal appearing WM, and thus excluding WML. All analyses were performed using the statistical software package SPSS (Chicago, IL, USA), version 21 for Windows, using an α value of 0.05 as threshold for statistical significance.
RESULTS
Baseline characteristics of the study population are shown in Table 1. The mean age of the population at time of baseline MRI was 59.6 years (s.d. 8.0; age range = 45.7 to 96.7 years), and 54.6% of the participants were women. The mean tCBF at baseline was 543 ml/min (s.d. 100), and a mean decrease of 2.7 ml/min/year (s.d. 25) was found during a mean scan interval of 3.9 years (s.d. 0.4). The mean TBV at baseline was 955 ml (s.d. 98), and mean change in TBV was a 2.0-ml decrease/year (s.d. 4) observed during the same scan interval.
Characteristics of the study population
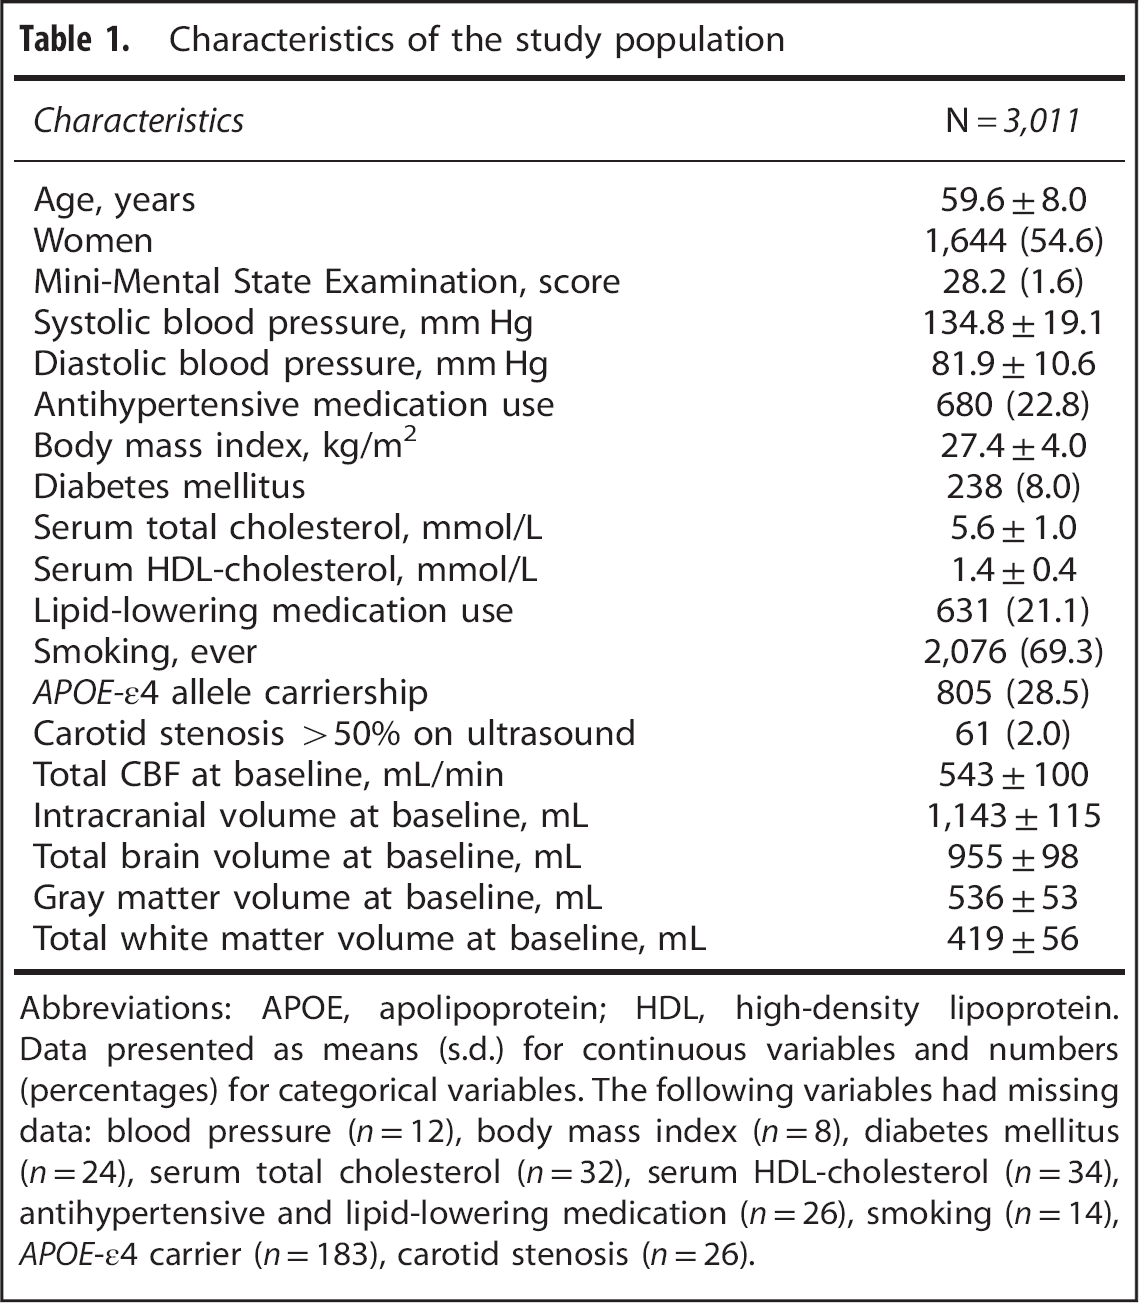
Abbreviations: APOE, apolipoprotein; HDL, high-density lipoprotein. Data presented as means (s.d.) for continuous variables and numbers (percentages) for categorical variables. The following variables had missing data: blood pressure (n = 12), body mass index (n = 8), diabetes mellitus (n = 24), serum total cholesterol (n = 32), serum HDL-cholesterol (n = 34), antihypertensive and lipid-lowering medication (n = 26), smoking (n = 14), APOE-ɛ4 carrier (n = 183), carotid stenosis (n = 26).
In Table 2, we show the associations between baseline TBV, GM volume and WM volume and change in tCBF. In the whole population, a smaller TBV, GM volume, and WM volume were significantly associated with steeper decrease in tCBF over 3.9 years of follow-up (standardized change per s.d. increase in TBV = 0.296 (95% confidence interval (CI) 0.200; 0.393), in GM volume = 0.177 (95% CI 0.110; 0.244), and in WM volume = 0.161 (95% CI 0.099; 0.222)). After additional adjustment for cardiovascular risk factors and APOE-ɛ4 status, the associations became slightly stronger (model II). The age-stratified analyses (< 65 years vs. ≥65 years of age) did not alter the associations.
Association between brain volumes and change in tCBF
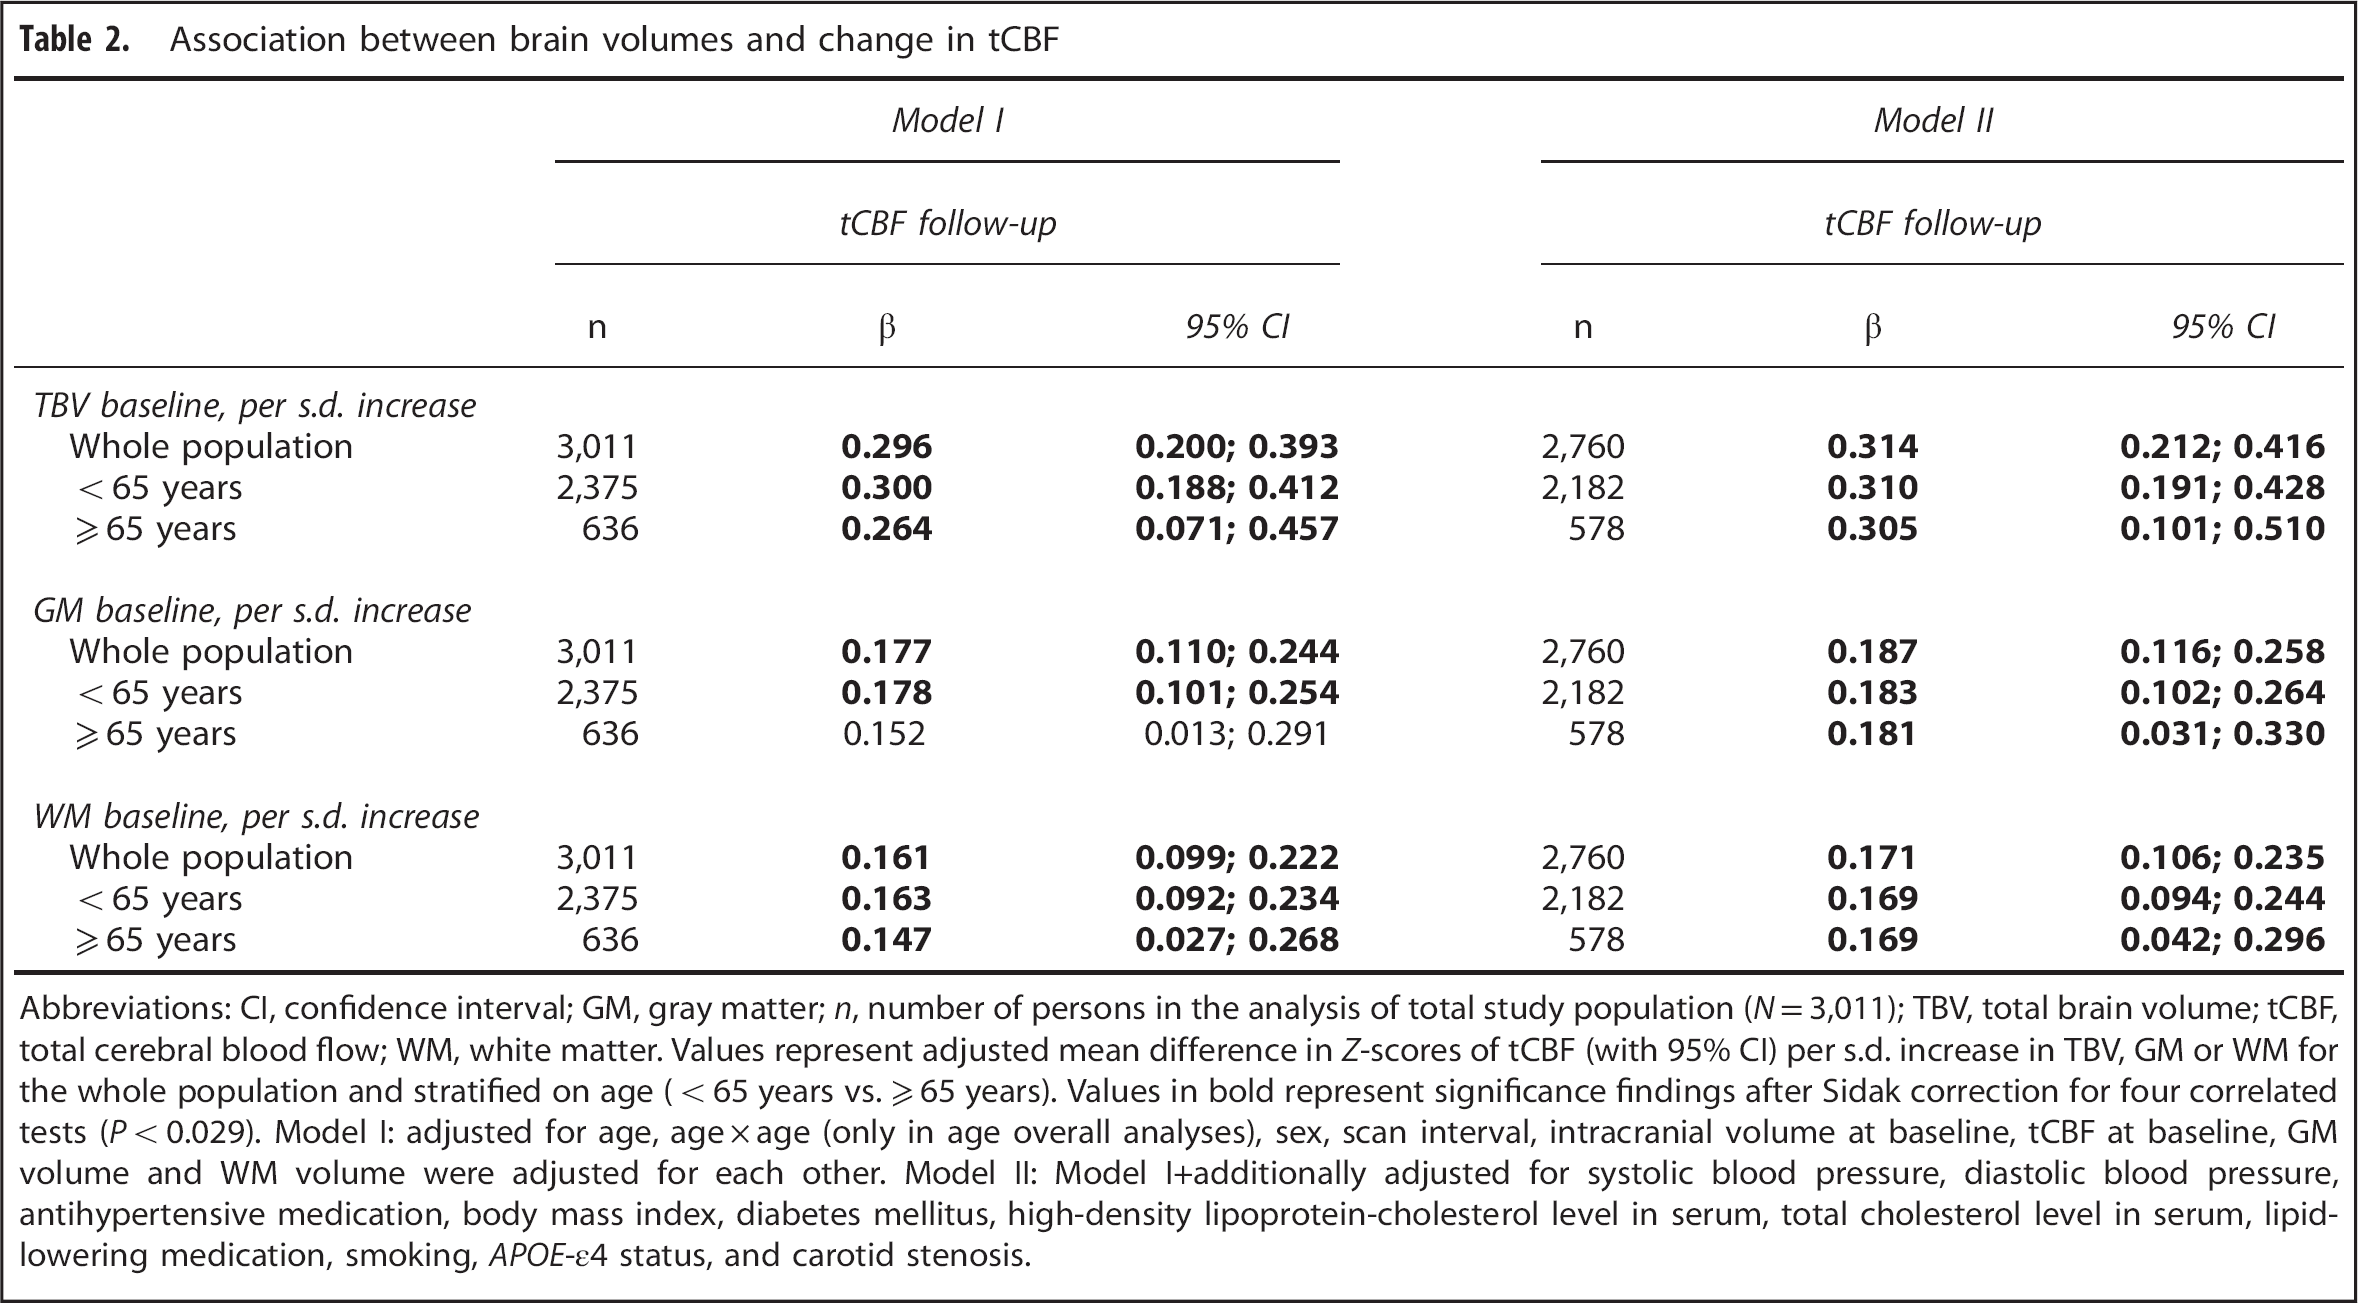
Abbreviations: CI, confidence interval; GM, gray matter; n, number of persons in the analysis of total study population (N = 3,011); TBV, total brain volume; tCBF, total cerebral blood flow; WM, white matter. Values represent adjusted mean difference in Z-scores of tCBF (with 95% CI) per s.d. increase in TBV, GM or WM for the whole population and stratified on age (< 65 years vs. ≥ 65 years). Values in bold represent significance findings after Sidak correction for four correlated tests (P < 0.029). Model I: adjusted for age, age × age (only in age overall analyses), sex, scan interval, intracranial volume at baseline, tCBF at baseline, GM volume and WM volume were adjusted for each other. Model II: Model I+additionally adjusted for systolic blood pressure, diastolic blood pressure, antihypertensive medication, body mass index, diabetes mellitus, high-density lipoprotein-cholesterol level in serum, total cholesterol level in serum, lipid-lowering medication, smoking, APOE-ɛ4 status, and carotid stenosis.
Table 3 represents the associations between baseline tCBF and change in TBV, GM volume, and WM volume. A lower tCBF at baseline was not significantly associated with steeper decline in TBV, GM volume, or WM volume over 3.9 years of follow-up in the whole population. These results remained essentially unchanged when additionally adjusted for cardiovascular risk factors and APOE-ɛ4 status (model II). However, age-stratified analyses showed that, in persons ≥65 years of age, lower tCBF was significantly associated with steeper decline in TBV, GM volume, and WM volume (standardized change per s.d. increase of tCBF 0.020 (95% CI 0.004; 0.036), 0.037 (95% CI 0.008; 0.066), 0.029 (95% CI 0.004; 0.053) respectively). Also, the P-value for interaction (tCBF × age continuously) was significant in all (non-stratified) analyses.
Association between tCBF and change in brain volumes
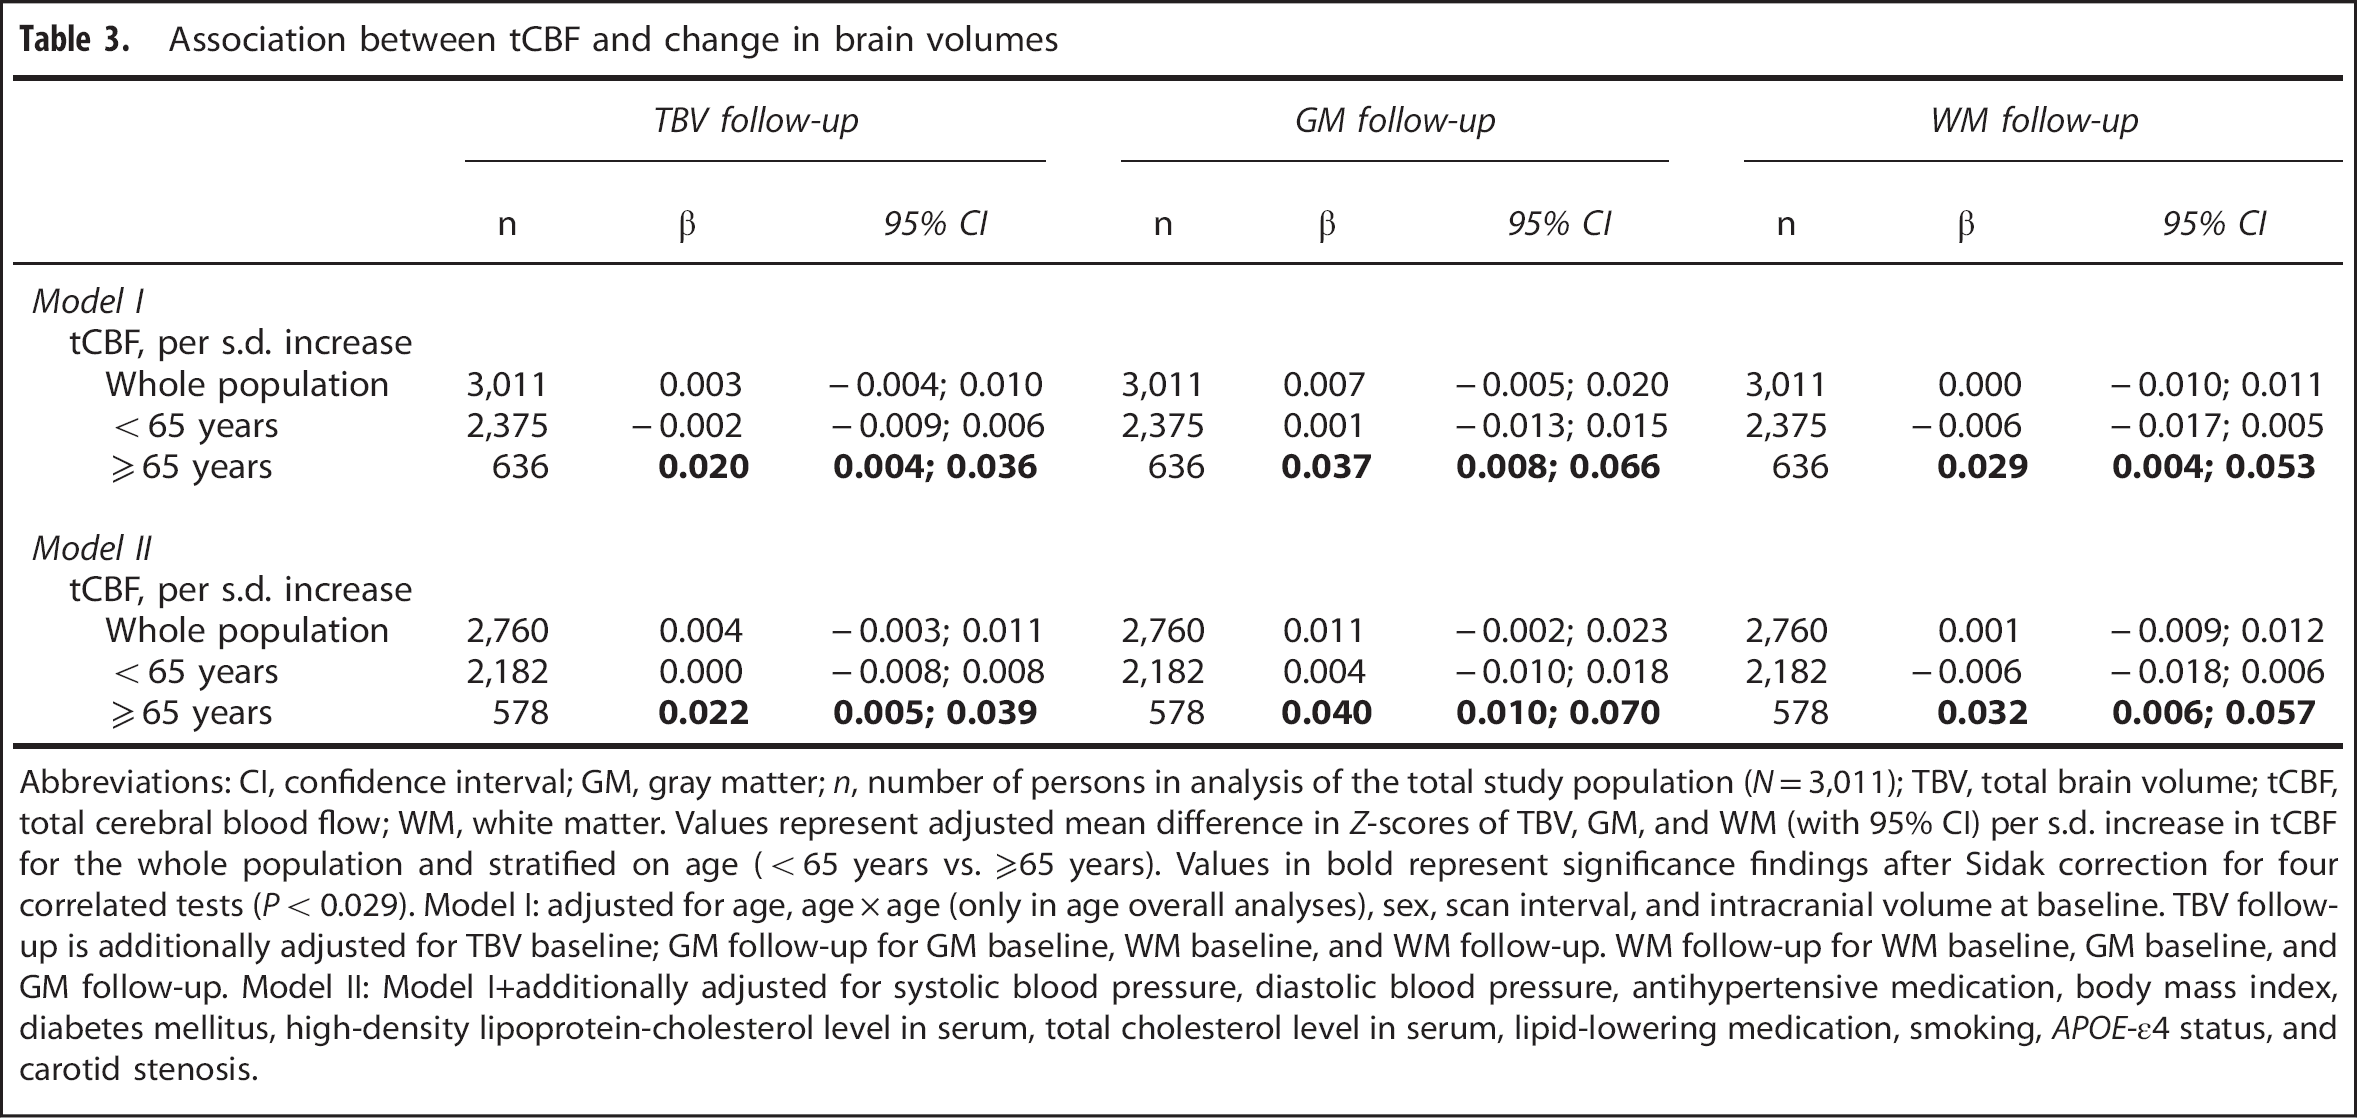
Abbreviations: CI, confidence interval; GM, gray matter; n, number of persons in analysis of the total study population (N = 3,011); TBV, total brain volume; tCBF, total cerebral blood flow; WM, white matter. Values represent adjusted mean difference in Z-scores of TBV, GM, and WM (with 95% CI) per s.d. increase in tCBF for the whole population and stratified on age (<65 years vs. ≥65 years). Values in bold represent significance findings after Sidak correction for four correlated tests (P < 0.029). Model I: adjusted for age, age × age (only in age overall analyses), sex, scan interval, and intracranial volume at baseline. TBV follow-up is additionally adjusted for TBV baseline; GM follow-up for GM baseline, WM baseline, and WM follow-up. WM follow-up for WM baseline, GM baseline, and GM follow-up. Model II: Model I+additionally adjusted for systolic blood pressure, diastolic blood pressure, antihypertensive medication, body mass index, diabetes mellitus, high-density lipoprotein-cholesterol level in serum, total cholesterol level in serum, lipid-lowering medication, smoking, APOE-ɛ4 status, and carotid stenosis.
In Supplementary Tables S1 and S2, the abovementioned analyses are shown for strata of hypertension, diabetes mellitus, and smoking. We did not find any differences in the associations between tCBF and TBV or GM (data not shown) and WM (data not shown) values for strata of the three cardiovascular determinants. Moreover, the interaction for hypertension, diabetes mellitus, and smoking with tCBF was not significant for all analyses.
Also, excluding those persons with carotid stenosis (n = 61) did not change any of the abovementioned results (data not shown). Moreover, repeating all analyses with normal appearing WM substituted for total WM volume did not change any of the results (data not shown).
DISCUSSION
In this large population-based longitudinal study with 3.9 years follow-up in middle-aged and elderly persons, we found that a smaller TBV, GM volume, and total WM volume at baseline were associated with a steeper decrease in tCBF. Conversely, a lower tCBF flow at baseline was found not to be associated with a steeper decline in any of the brain volume measures. However, in persons aged >65 years, a lower tCBF was significantly associated with a steeper decline in TBV, GM volume, and total WM volume.
Strengths of our study are its population-based setting with large sample size and the longitudinal design with CBF and brain volume measurements at two time points, enabling us to assess change in these measurements over time. At both time points, our MRI protocol was identical to optimize comparability between scans over time. There are also some limitations that need to be considered. First, from an epidemiologic point of view, it is a given that correlation does not necessarily imply causation. 30 Nevertheless, we think that our longitudinal design is one step in the right direction to draw conclusions regarding cause and effect in the association between CBF and brain volume. Second, assessment of both brain volume and CBF measurements is associated with variability, rendering our analyses less sensitive to detect small changes. Indeed, in a third of participants on average, brain volume increased slightly over 3.9 years of follow-up, which is improbable from a biologic perspective, but likely results from variability in the image acquisition and measurement process. Third, cross-sectional studies have shown that regions of CBF reduction may not overlap with corresponding regions of GM atrophy.31,32 Therefore it might be possible that global CBF does not accurately reflect the amount of CBF that is going to the tissue on a regional level. Subsequently, we cannot exclude that regional CBF may be reduced at specific regions while global CBF remains unaltered.
Direct comparison of our findings with previous studies is only possible to a limited extent. Studies that reported a relation between lower CBF and smaller brain volume5,33 are mostly based on cross-sectional data, which are hampered in understanding cause and effect. Still some remarks can be made. One cross-sectional study demonstrated that in non-demented elderly cerebral hypoperfusion as measured with arterial spin labeling MRI was associated with smaller TBV. 12 Another cross-sectional study in controls without objective memory complaints found no association between normalized brain volume with whole brain CBF as measured with arterial spin labeling. 34 In patients who suffer from arterial disease, a lower CBF was found to be associated with ventricular enlargement (a proxy for brain atrophy) but only in the presence of moderate-to-severe WML volume. 35 In general, previous studies interpreted their data largely as that a lower CBF precedes brain atrophy. Interestingly, our data suggest the opposite: a smaller brain volume at baseline precedes a decrease in CBF. A possible explanation for these findings could be that a decrease in brain volume is due to neuronal shrinkage and neuronal apoptosis occurring in aging. 36 A smaller brain volume would then require a lower CBF to maintain normal brain function. 13
However, in persons aged ≥65 years, we did find that a lower CBF at baseline was associated with brain atrophy. There is evidence that aging affects the auto-regulatory capacity of the cerebrovascular system to respond to cerebral hypoperfusion. 14 Disruptions in CBF are buffered in healthy individuals through auto-regulatory mechanisms, such as baroreflex-mediated blood pressure. 15 These mechanisms become compromised at old age and could, therefore, via hypoperfusion, contribute to the process of brain atrophy. 15 Even though previous studies did not find large effects of aging on cerebral auto-regulation in persons aged 50–75 years, 14 our results suggest that low CBF may nevertheless have more detrimental effects at older age than in those aged <65 years. Reduced auto-regulatory mechanisms is one of the potential explanations, perhaps primarily acting in the oldest old, but dynamic data would be needed to further confirm this.
Our finding that reduced CBF may drive brain atrophy at old age has potential clinical implications, in particular for cognitive and motor function. Studies have shown associations between GM atrophy and worse memory performance. 37 In addition, executive function, information processing speedm and motor speed are cognitive domains that are known to be affected by WM atrophy.37,38 In that respect, our current data are in line with our previous finding that lower CBF relates to worse performance on several domains of cognitive function and that this association seems to be mediated by brain atrophy. 39 Also, larger (sub)cortical GM volumes and better WM quality have been associated with better gait,40,41 which is increasingly considered as an important indicator of health. Finally, global brain atrophy relates to an increased risk of all-cause mortality in non-demented elderly. 42
We did not find an effect modification of hypertension, diabetes mellitus, and smoking on the above described association between reduced CBF and brain atrophy. However, we cannot exclude that a follow-up of 3.9 years is too short to find (small) effects. Also, it might be possible that the bidirectional relationship between change in CBF and brain atrophy is not modified by the presence of cardiovascular risk factors although these cardiovascular risk factors could be determinants for reduced CBF and brain atrophy separately.33,43–46 Finally, the possibility of residual confounding because of an unknown confounder cannot be completely ruled out.
In conclusion, we show the bidirectional longitudinal relationship between reduced CBF and brain atrophy over 3.9 years of follow-up. Our results indicate that brain atrophy causes CBF to decrease over time, rather than vice versa. Only in persons aged >65 years did we find lower CBF to also relate to brain atrophy over time. Further research needs to be carried out to elucidate the role of dynamic cerebral auto-regulatory capacity of the brain in the association between brain atrophy and reduced CBF. Furthermore, a useful next step could be to investigate the potential mediating role of (global and regional) CBF in the pathophysiology of dementia.
Footnotes
HZ: Drafting/revising the manuscript, design or conceptualization of the study, acquisition of data, analysis or interpretation of data, accepts responsibility for conduct of research, and gave final approval. EL: Drafting/revising the manuscript, acquisition of data, accepts responsibility for conduct of research, and gave final approval. AH: Drafting/revising the manuscript, design or conceptualization of the study, accepts responsibility for conduct of research, gave final approval, supervised the study, and obtained funding. WN: Drafting/revising the manuscript, design or conceptualization of the study, analysis or interpretation of data, accepts responsibility for conduct of research, gave final approval, supervised the study, and obtained funding. AvdL: Drafting/revising the manuscript, design or conceptualization of the study, acquisition of data, accepts responsibility for conduct of research, and gave final approval. GK: Drafting/revising the manuscript, accepts responsibility for conduct of research, gave final approval, and obtained funding. MAI: Drafting/revising the manuscript, design or conceptualization of the study, acquisition of data, analysis or interpretation of data, accepts responsibility for conduct of research, gave final approval, supervised the study, and obtained funding. MWV: Drafting/revising the manuscript, design or conceptualization of the study, acquisition of data, analysis or interpretation of data, accepts responsibility for conduct of research, gave final approval, supervised the study, and obtained funding.
The authors declare no conflict of interest.
References
Supplementary Material
Please find the following supplemental material available below.
For Open Access articles published under a Creative Commons License, all supplemental material carries the same license as the article it is associated with.
For non-Open Access articles published, all supplemental material carries a non-exclusive license, and permission requests for re-use of supplemental material or any part of supplemental material shall be sent directly to the copyright owner as specified in the copyright notice associated with the article.