
Abstract
Recent clinical trials of new revascularization therapies in acute ischemic stroke have highlighted the importance of physiological imaging to identify optimal treatments for patients. Oxygen extraction fraction (OEF) is a hallmark of at-risk tissue in stroke, and can be quantified from the susceptibility effect of deoxyhemoglobin molecules in venous blood on MRI phase scans. We measured OEF within cerebral veins using advanced quantitative susceptibility mapping (QSM) MRI reconstructions in 20 acute stroke patients. Absolute OEF was elevated in the affected (29.3 ± 3.4%) versus the contralateral hemisphere (25.5 ± 3.1%) of patients with large diffusion–perfusion lesion mismatch (P = 0.032). In these patients, OEF negatively correlated with relative CBF measured by dynamic susceptibility contrast MRI (P = 0.004), suggesting compensation for reduced flow. Patients with perfusion–diffusion match or no hypo-perfusion showed less OEF difference between hemispheres. Nine patients received longitudinal assessment and showed OEF ratio (affected to contralateral) of 1.2 ± 0.1 at baseline that normalized (decreased) to 1.0 ± 0.1 at follow-up three days later (P = 0.03). Our feasibility study demonstrates that QSM MRI can non-invasively quantify OEF in stroke patients, relates to perfusion status, and is sensitive to OEF changes over time.
Keywords
Introduction
Several positive multi-center, randomized clinical trials1–3 have recently shown that intra-arterial thrombectomy, in place of4,5 or combined with intravenous recombinant tissue plasminogen activator, 6 may improve clinical outcomes of ischemic stroke, even when given beyond the normal therapeutic window. 7 Development of imaging strategies to identify patients who are most likely to benefit from these new treatments is essential, particularly for those falling outside currently established treatment guidelines.
A known hallmark of threatened but potentially salvageable tissue (ischemic penumbra) is elevated oxygen extraction fraction (OEF); however, imaging of brain oxygenation is technically challenging. Positron emission tomography (PET) with [ 15 O]-radiotracers remains the quantitative standard for OEF and oxygen metabolism,8,9 but requires an on-site cyclotron and complex procedures to administer short half-life tracers. While these constraints limit its clinical application, [ 15 O]-PET has been used to identify abnormal, elevated OEF in patients with ischemic stroke 10 and carotid steno-occlusive disease, as an indicator of past ischemic events and predictor of future stroke risk.11,12 In comparison, standard MRI scans, while more accessible than [ 15 O]-PET, have not been able to adequately identify the ischemic penumbra. For instance, the mismatch between areas of compromised tissue perfusion (detected using perfusion MRI) and cytotoxic edema (detected using diffusion-weighted MRI) is often proposed as a surrogate marker for the stroke penumbra, 13 but overestimates the penumbra seen on PET and does not reliably detect the presence of elevated tissue OEF. 14
Nascent, advanced MRI methods that directly measure regional brain oxygenation hold promise for stroke imaging. The quantitative blood level oxygenation dependent (BOLD) technique
15
jointly models T2- and
This MRI study utilized QSM in cortical veins to quantify regional OEF longitudinally in patients with acute ischemic stroke. We tested the hypothesis that absolute OEF is elevated in cortical vessels close to the infarct, compared to the contralateral hemisphere, and that this difference is normalized over the course of recovery. Furthermore, we investigated whether OEF was related to regional perfusion status in these patients, as measured by dynamic susceptibility contrast (DSC) MRI. Spatial profiles of OEF and DSC perfusion were assessed in the ischemic hemisphere of individual stroke patients.
Materials and methods
Patients
Patients with acute ischemic stroke were recruited from the LOBI-BBB study (Longitudinal MRI Examinations of Patients with Brain Ischemia and Blood Brain Barrier Permeability; clinicaltrials.org: NCT02077582) at the Center for Stroke Research in Berlin. Inclusion criteria included age of 18 years or older and a confirmed diagnosis of ischemic stroke based on clinical presentation and admission diffusion-weighted imaging (DWI) MRI. Exclusion criteria included previous intracranial hemorrhage or brain surgery. Across the patients, baseline MRI was acquired a median of 7.5 h after symptom onset. Nine subjects received follow-up MRI, acquired a median of three days after the initial scan (range 1–4 days), and three of these patients received thrombolysis between the two scan sessions. This study was performed with approval from the Ethics Committee of the Charité-Universitätmedizin Berlin (EA1/200/13) and according to the guidelines of the Declaration of Helsinki. All subjects provided informed, written consent before the MRI examination.
MRI acquisition
All subjects underwent scanning on a 3 Tesla MRI (Siemens MAGNETOM Tim Trio, Erlangen, Germany) with a 32-channel phased-array coil. For OEF measurements, axial three-dimensional gradient echo images were acquired with magnitude and phase saved for each receive coil, and first-order flow compensation in all three spatial directions. Scan parameters included repetition time (TR) = 20 ms; echo time (TE) = 14 ms; in-plane resolution = 0.8 × 0.8 mm2; slice thickness = 1 mm; flip angle = 15 °; bandwidth =220 Hz/pixel; generalized auto-calibrating partially parallel acquisition acceleration factor = 2. The total acquisition time was 5 min 18 s to cover the supratentorial brain with 144 slices. Separate multi-echo field maps with lower resolution were acquired to estimate phase offsets between receive channels for optimal coil combination of the phase image. These field maps were not flow compensated and had scan parameters of TR = 20 ms; TEs = 4.8, 9.9, 15 ms; in-plane resolution of 3.1 × 3.1 mm2; matrix = 64 × 64; slice thickness =4 mm; and acquisition time of 36 s.
Imaging was performed as part of a clinical stroke MRI protocol that included T2*-weighted imaging, DWI, time-of-flight MR angiography, fluid-attenuated inversion recovery (FLAIR) imaging, and DSC MRI. The three-dimensional time-of-flight MR angiogram was acquired with 40 slices; TR = 22 ms; TE = 3.9 ms; in-plane resolution = 0.7 × 0.5 mm2; slice thickness =0.7 mm; flip angle = 18 °; and two-fold acceleration for an acquisition time of 3 min. DWI was performed to detect the infarct using a two-dimensional single-shot echo planar sequence with TR = 8200 ms; TE = 93 ms; 6 directions; b-value = 1000 s/mm2; in-plane resolution =1.2 × 1.2 mm2; matrix = 192 × 192; slice thickness =2.5 mm; and acquisition time of 2 min 21 s.
All patients received DSC MRI for perfusion assessment using a bolus administration of 5 mL Gadovist (Gadobutrol, 1 mol/L; Bayer Scherig Pharma AG, Berlin Germany), followed by a saline flush at a flow rate of 5 ml/s. DSC scan parameters included 80 time points; 21 slices; TR = 1390 ms; TE = 29 ms; spatial resolution = 1.8 × 1.8 mm2; matrix = 128 × 128; slice thickness = 5 mm; slice gap = 0.5 mm; flip angle = 60 °; and acquisition time of 2 min. In 12 patients, additional T1-weighted MPRAGE (magnetization prepared rapid gradient echo) scans were acquired after administration of gadolinium to visualize arteries and veins. These sagittal scans were acquired with TR = 1900 ms; TE =2.5 ms; spatial resolution = 1.0 × 1.0 mm2; matrix =256 × 256; slice thickness = 1 mm; flip angle = 9 °; and acquisition time of 4 min 24 s. No patients received gadolinium contrast during the follow-up scan.
Image processing for quantification of OEF
In each patient, the phase offset map for each receive channel (i.e. the phase corresponding to TE = 0) was estimated from the acquired low-resolution field map. 22 The estimated offset maps were then subtracted from the corresponding receive channel of the high-resolution (0.8–mm) gradient echo data. After this correction, coil combination was performed with weighted averaging 23 to generate accurate, combined 0.8-mm phase images with high signal-to-noise ratio (SNR). 24 Background field was then removed from the high-resolution phase images with a Laplacian-based method 25 that explicitly solves boundary value problems and is computationally efficient. Finally, quantitative susceptibility maps were reconstructed from the pre-processed phase images with a truncated k-space division inversion (maximum threshold = 2/3), which corrects for the point-spread function of the dipole convolution kernel to reduce inversion artifacts. 26
For each hemisphere of all patients, four to eight cortical veins were manually identified on the reconstructed QSM maps as hyper-intense signal by one reader (A.P.F.) who was blinded to the patient characteristics. Cortical vessels were included if the bright QSM signal (1) consisted of at least 20 voxels across a minimum of three imaging slices; and (2) corresponded to vasculature depicted on the corresponding susceptibility-weighted magnitude image or the post-contrast T1 image (Figure 1). Vein masks were delineated by one observer (A.P.F.), who was blinded to the location of the infarct in the patients. In cases with follow-up scans, vessel identification was performed independently for each scan session. The susceptibility shift between venous blood and water (Δχvein-water) was determined for each identified vein; χvein was measured from the 10% highest signal within the vein mask to minimize partial volume effects, and χwater was estimated from cerebrospinal fluid within the anterior region of the lateral ventricles.
27
Arterial blood was assumed to be fully oxygenated and OEF for each vessel was quantified through the following equation
18
Susceptibility-weighted magnitude, reconstructed quantitative susceptibility map (QSM), and reformatted, post-contrast T1-weighted MRI in an 86-year-old female patient with right middle cerebral artery (MCA) occlusion. Bright signal on the QSM map corresponded to venous vasculature observed on the post-contrast T1 MRI. Cortical vessels (green arrows) were identified for OEF quantification from magnetic susceptibility values.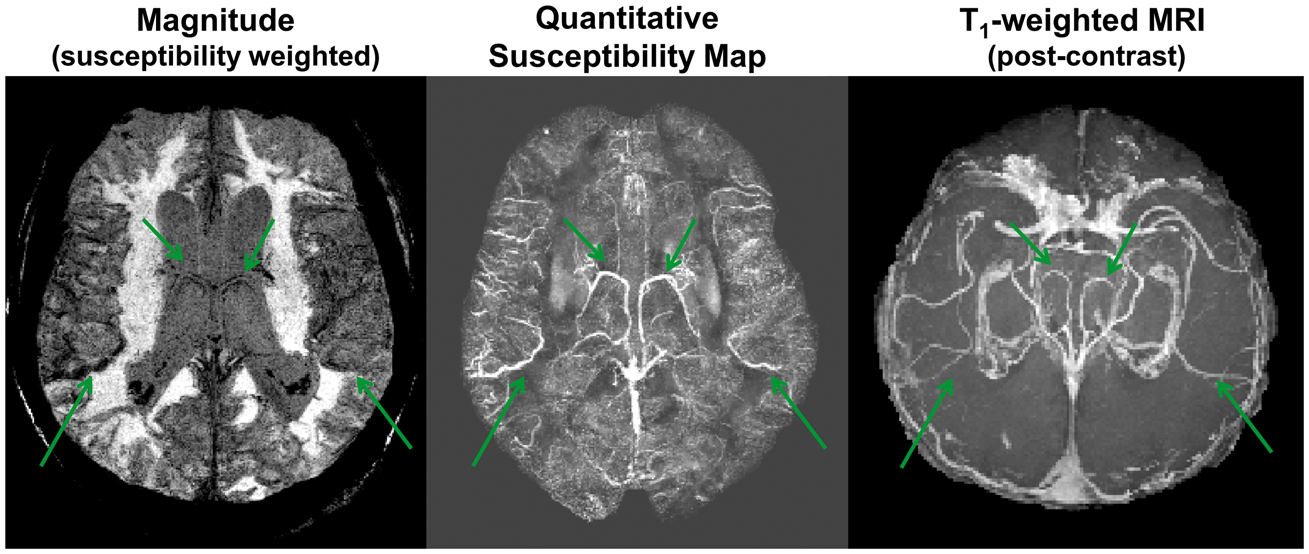

Clinical and perfusion measures
Infarcts were delineated on the diffusion-weighted images (DWIs) for baseline and follow-up scans (when available) using the software AnToNIa (Analysis Tool for Neuro Image Data, Institute for Computational Neuroscience, Hamburg, Germany). 28 This semi-quantitative tool identifies the DWI lesion as voxels with signal intensity greater than two standard deviations of the mean signal of the contralateral hemisphere.
To characterize the patients' baseline perfusion status, DSC MRI data were analyzed with Stroketool version 2.8 (2011 Digital Image Solutions – HJ Wittsack). The arterial input function was estimated from 5 to 10 voxels manually identified in the distal branches of the middle cerebral artery, contralateral to the infarct. 29 Block-circulant singular value decomposition 30 was used to de-convolve the tissue concentration–time curves and derive mean transit time (MTT) and cerebral blood flow (CBF) maps. For mismatch classification, hypo-perfusion was defined as MTT exceeding 6 s. 31 This definition was based on MTT instead of time-to-maximum (Tmax), because MTT has been shown to more strongly correlate with clinical outcomes and better reflect subtle changes in local tissue status than Tmax. 32 Patients were classified by visual inspection of the MTT and DWI maps as having no hypo-perfusion (no voxels with MTT > 6 s); a perfusion–diffusion match; or a perfusion–diffusion mismatch.
To assess the regional relationship between OEF and perfusion, CBF maps from DSC MRI were normalized to signal in the cerebellar gray matter. DSC perfusion maps registered to the same space as the QSM maps and vein masks using the corresponding gradient echo magnitude image, with FMRIB's Linear Image Registration Tool (FLIRT). 33 To estimate mean DSC CBF associated with each vessel, vein masks were dilated by four voxels (3.2 mm) in all dimensions to create regions of interest. In a subset of four patients, DWI lesion masks were also registered to the QSM maps, and the minimum Euclidean distance between each vein in the ischemic hemisphere and the infarct edge was measured. Third-order polynomials were fit to visualize the profile of relative OEF and CBF versus distance from the diffusion lesion.
Statistical analyses
Linear mixed models with varying intercepts for each patient were fit to the OEF measurements to investigate:
The main effects of hemisphere (contralateral/ischemic) and patient group (no hypo-perfusion/match/large mismatch), as well as their interaction term, on the OEF values. Varying intercepts were also used for each hemisphere. The effect of time (baseline/follow-up) on the OEF ratio. The relationship between OEF and relative CBF (from DSC-MRI) in the ischemic hemispheres, with patient group (no hypo-perfusion/match/large mismatch) as a fixed effect. Both absolute OEF and relative OEF (compared to the contralateral hemisphere) were considered. The relationship between distance from the DWI lesion and absolute OEF, with the pattern of hypo-perfusion (match versus large mismatch) as a fixed effect.
Each mixed model was fit separately using the R software package “lme4”. 34 The P-values of the mixed models' coefficients were calculated using Satterthwaite's method for approximating degrees-of-freedom (R software package “lmerTest”). 35 Marginal and conditional R-squared values were calculated using the R software package “MuMIn” (https://CRAN.R-project.org/package=MuMIn). A P-value of less than 0.05 was considered as significant. The data and analysis code are available at https://github.com/ahmedaak/QSM_OEF.
Results
Acute stroke patient characteristics (N = 20).
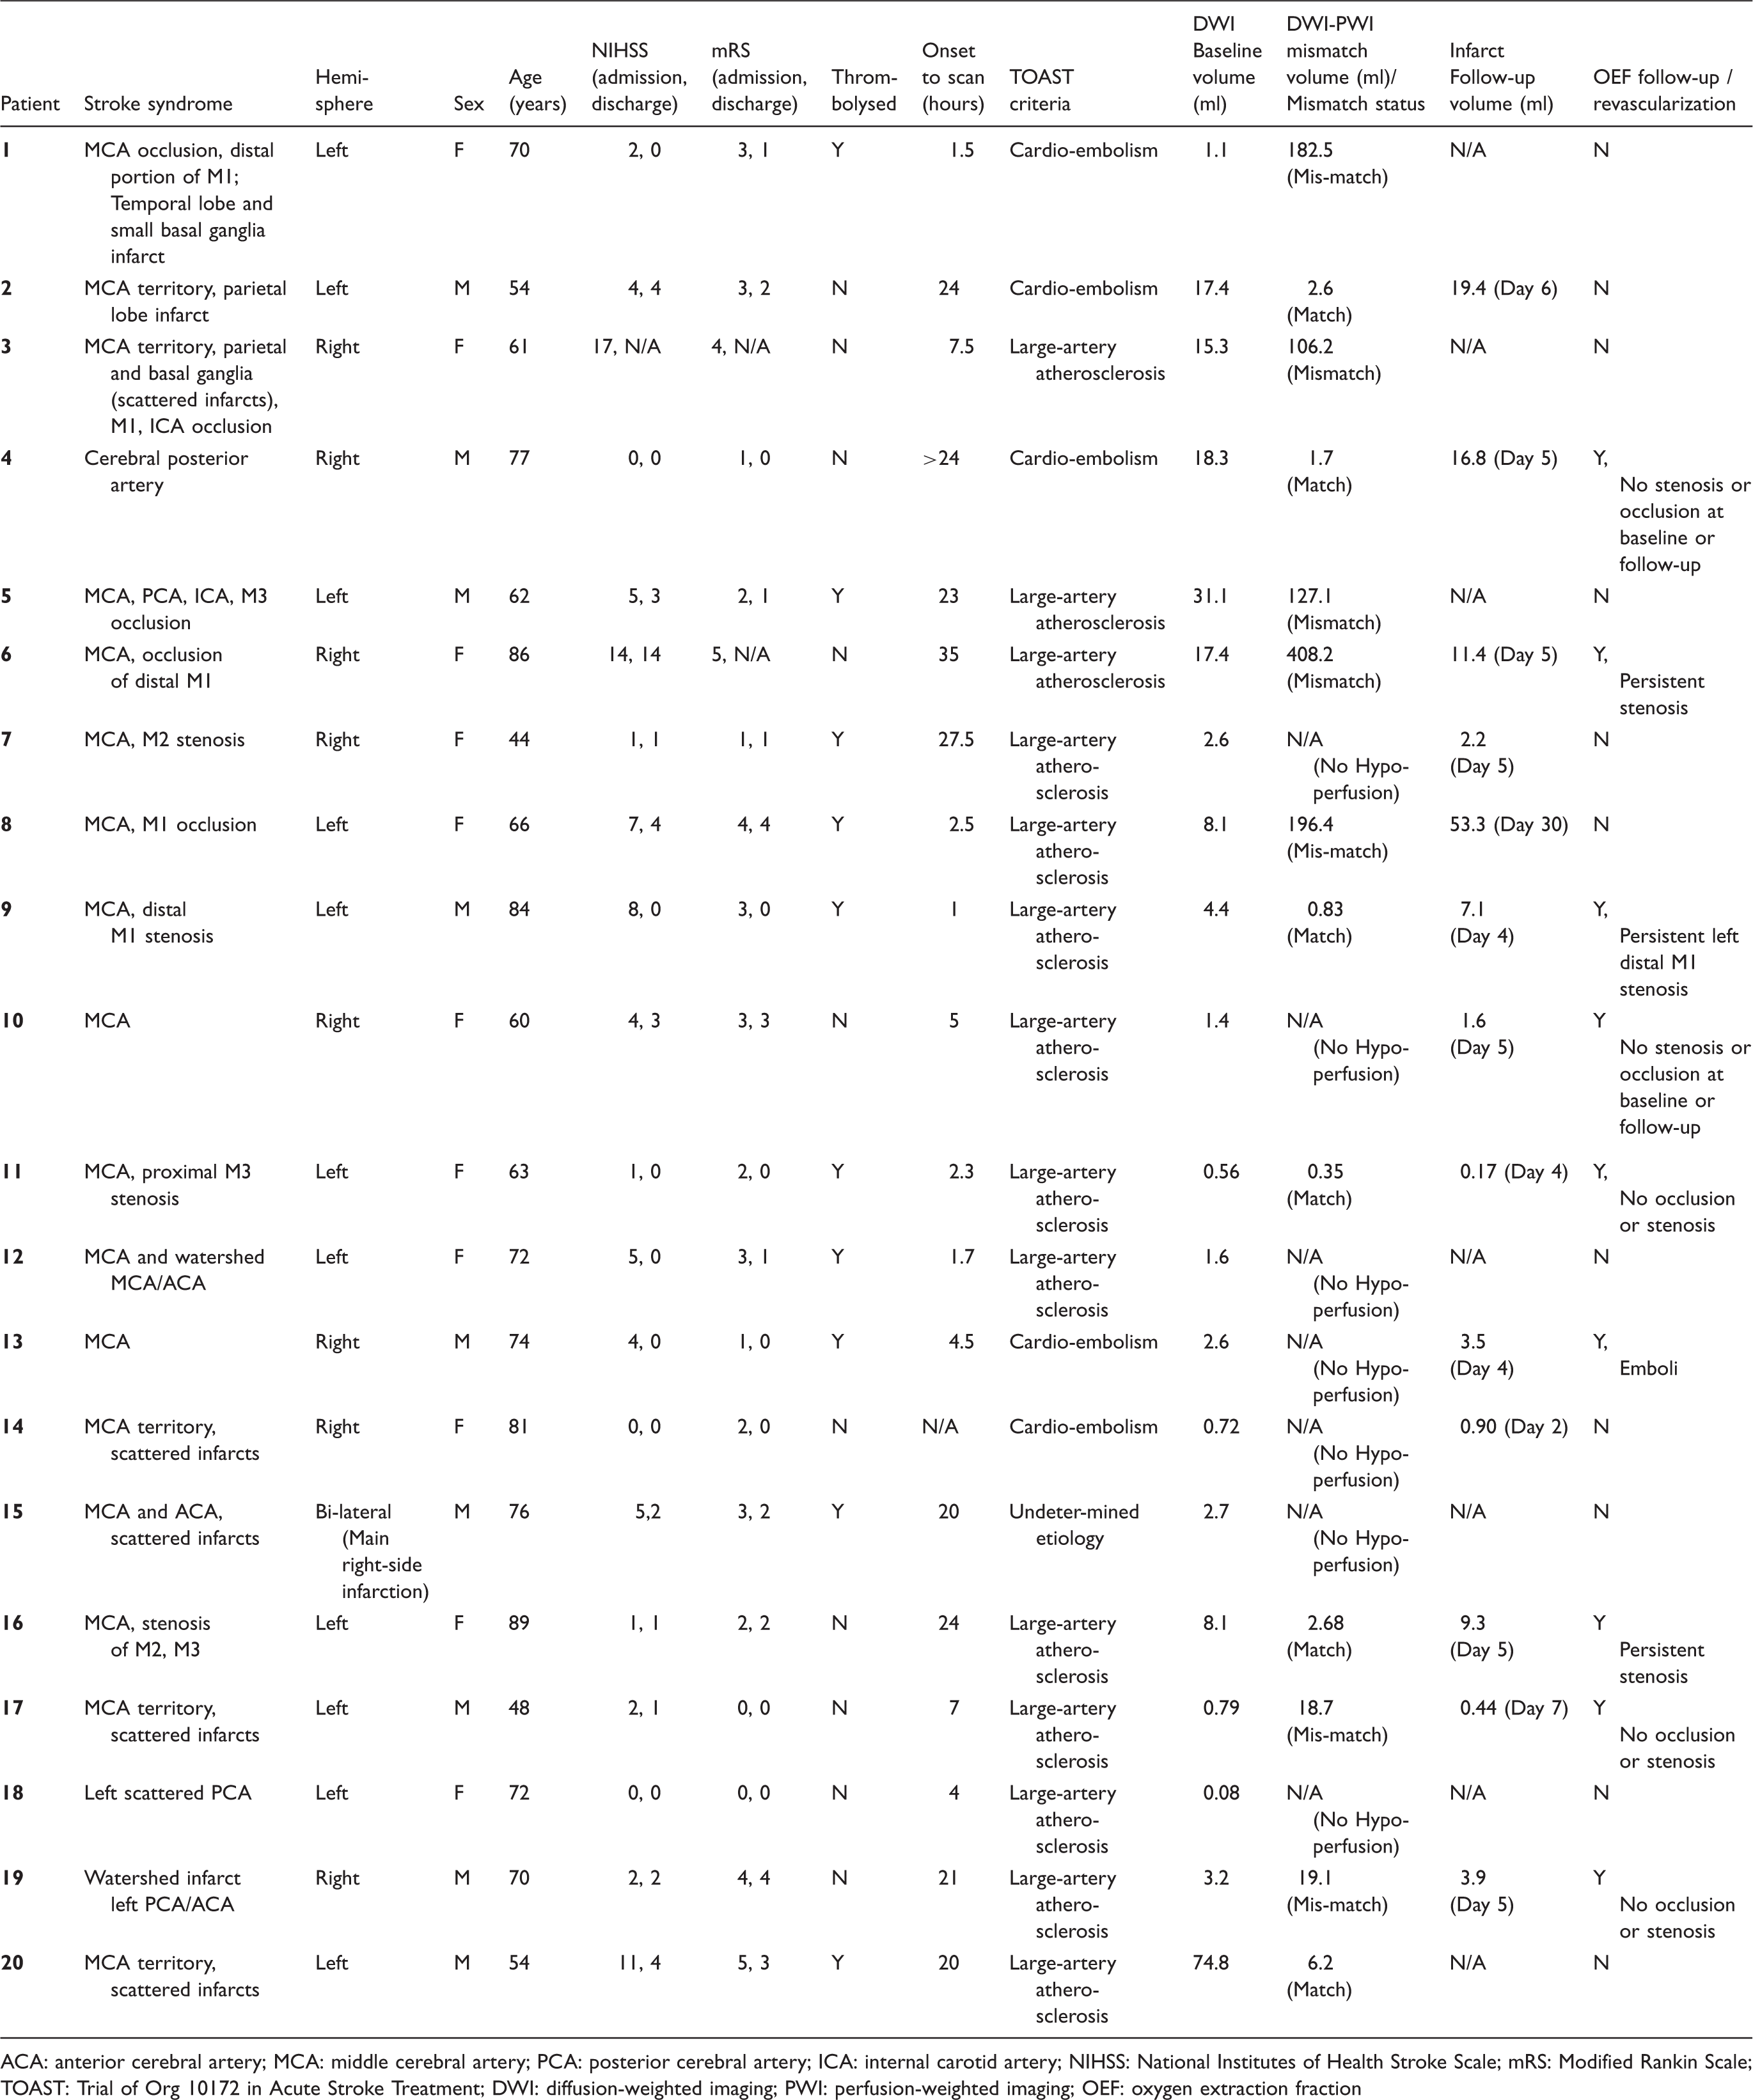
ACA: anterior cerebral artery; MCA: middle cerebral artery; PCA: posterior cerebral artery; ICA: internal carotid artery; NIHSS: National Institutes of Health Stroke Scale; mRS: Modified Rankin Scale; TOAST: Trial of Org 10172 in Acute Stroke Treatment; DWI: diffusion-weighted imaging; PWI: perfusion-weighted imaging; OEF: oxygen extraction fraction
Using a threshold of 6 s for the MTT maps for the remaining subjects, seven patients showed no hypo-perfusion on the baseline scan, six patients had perfusion–diffusion match, and seven patients had a large perfusion–diffusion mismatch volume. The median mismatch volume was 2.2 (0.35–6.2) ml for the “match” patient group, and 127.1 (18.1–408.1) ml for the “mismatch” group. There was no statistically significant main effect of patient group (F = 3.18, P = 0.07) or hemisphere (F = 3.98, P = 0.05) on OEF values. The marginal R-squared (fixed effects only) was 0.15 and the conditional R-squared (fixed +random effects) was 0.42. However, there was a significant interaction between group and hemisphere (F = 5.17, P = 0.008). Specifically, the difference in OEF between hemispheres was prominent in patients with large mismatch (b=0.04, standard error = 0.02, T = 2.2, P = 0.032), where absolute OEF in the ischemic hemisphere (29.6 ± 3.4%) was greater than in the contralateral hemisphere (25.5 ± 3.1%) (Figure 2). No difference in OEF between hemispheres was observed in patients with perfusion–diffusion match (P = 0.28).
Boxplots of absolute oxygen extraction fraction OEF (%) values in the infarcted and contralateral hemispheres of stroke patient groups with different perfusion status. Hypo-perfusion was defined with a threshold of greater than 6 s on mean transit times (MTT) maps from dynamic susceptibility contrast MRI. Patients with large perfusion–diffusion mismatch volume showed pathological OEF elevation compared to the contralateral hemisphere (corrected P = 0.025), but this was not observed in patients with perfusion–diffusion match or no hypo-perfusion.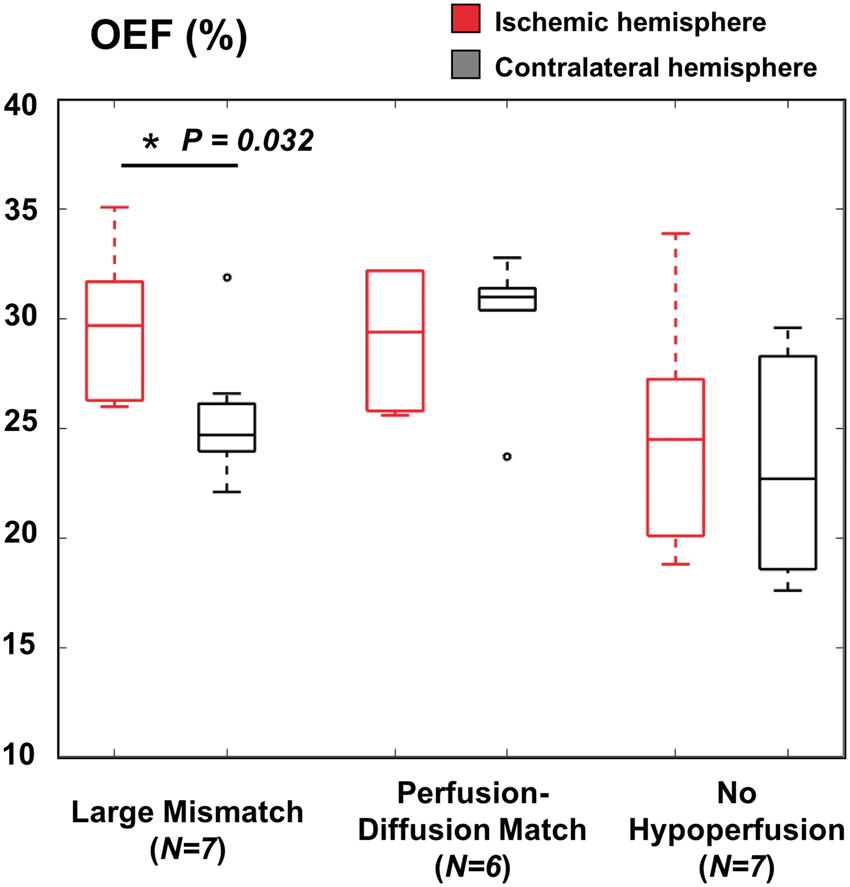
Longitudinal OEF measurements between baseline and follow-up scans corresponded to clinical findings in patients. Figure 3(a) depicts a 66-year-old female patient with right M1 artery occlusion, who exhibited 20% OEF elevation in the perfusion–diffusion mismatch region relative to the contralateral hemisphere. The abnormal, high OEF persisted on the follow-up scan three days later, consistent with lack of recanalization and persistent occlusion observed during the second MRI. Across the nine patients with longitudinal imaging, the OEF ratio (ischemic to contralateral hemisphere) decreased from 1.2 ± 0.1 to 1.0 ± 0.1 between the two scan sessions (Figure 3(b)). These same patients showed a modest improvement in median NIHSS (National Institutes of Health Stroke Scale) from 2 to 0 and a modest improvement in median mRS (Modified Rankin Score) from 2 to 1.
(a) Longitudinal oxygen extraction fraction (OEF) imaging in a 66-year-old female patient with right M1 occlusion. The baseline quantitative susceptibility map (QSM) shows ∼20% OEF increase within the mismatch area between perfusion (red outline) and diffusion (blue) lesions, relative to the contralateral hemisphere. This OEF pathophysiology was also observed in the same vein on the follow-up QSM scan, consistent with lack of recanalization and persistent occlusion at discharge in this patient. (b) Ratio of OEF in ischemic to contralateral hemisphere in nine stroke patients who received baseline and follow-up MRI a median of three days after the initial scan. The OEF ratio decreased (normalized) over time (P = 0.03), and dotted lines indicate patients who received thrombolysis.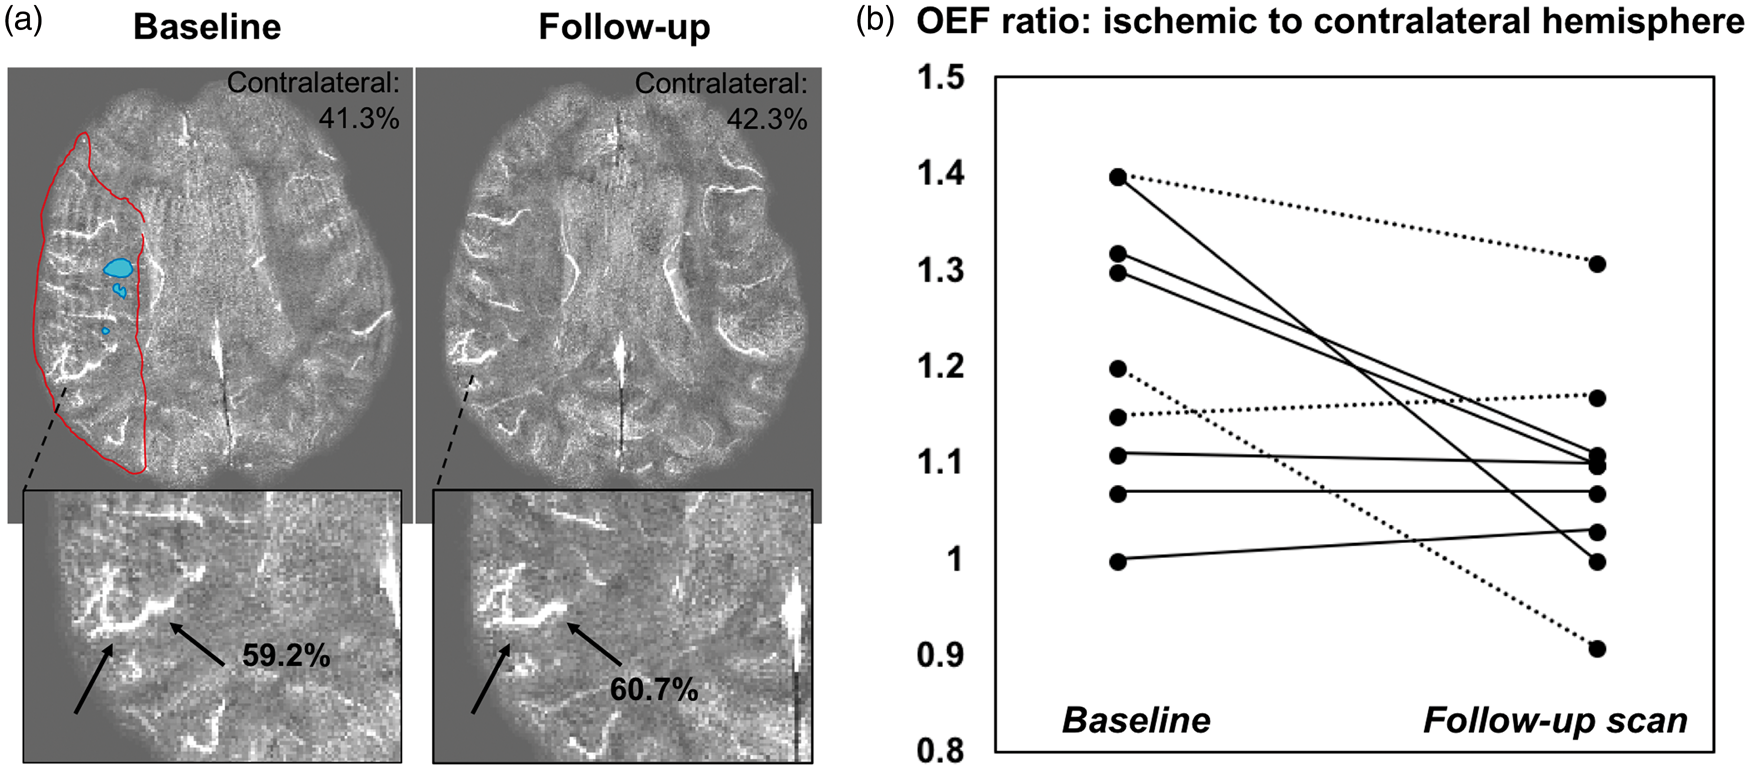
There was a significant association between relative CBF (rCBF) measured by DSC and absolute OEF in the ischemic hemisphere of patients (F = 5.76, P = 0.019), and a significant interaction between rCBF and patient group (F = 5.98, P = 0.004). In patients with large perfusion–diffusion mismatch (Figure 4), the model revealed an inverse relationship between relative CBF and absolute OEF (b = −0.22, standard error = 0.07, T=−3.16, P = 0.002, marginal R-squared = 0.25), as well as between relative CBF and relative OEF (b = −0.61, standard error = 0.23, T=−2.66, P = 0.010, marginal R-squared = 0.21).
Scatter plot between oxygen extraction fraction (OEF) from quantitative susceptibility mapping with relative cerebral blood flow (CBF) from dynamic susceptibility contrast on the baseline MRI. Each data point represents one vein and its corresponding perfusion region of interest from stroke patients classified with large perfusion–diffusion mismatch. In these patients, the linear mixed model revealed a significant inverse relationship between absolute OEF and relative CBF (P = 0.002), as well as between relative OEF and relative CBF (P = 0.010).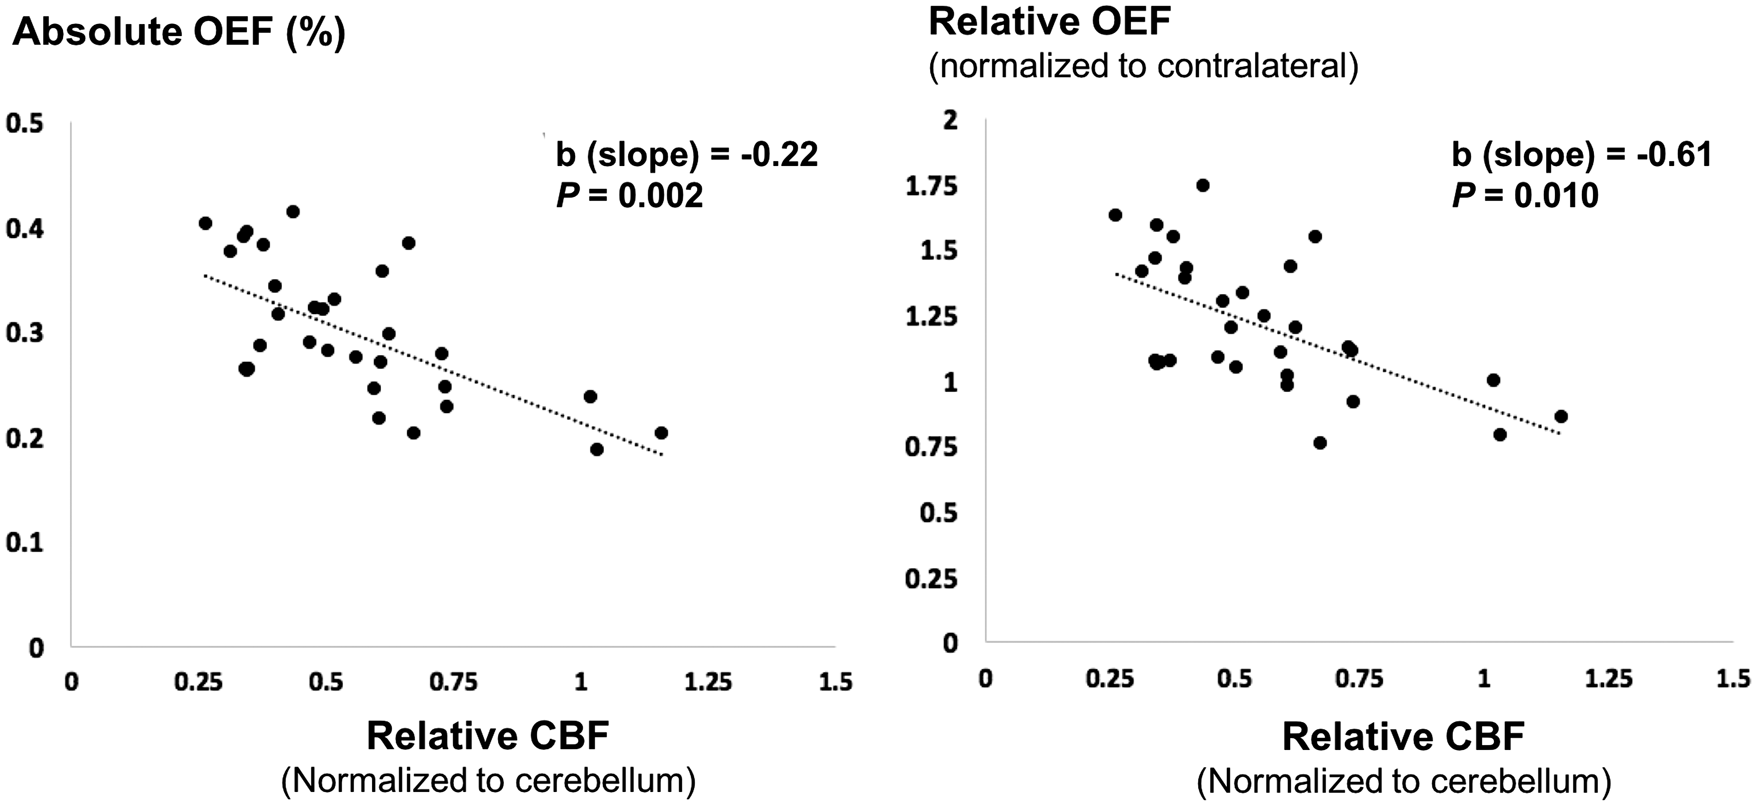
Figure 5 shows the baseline profiles of relative OEF and CBF in the ischemic hemisphere, plotted against the measured distance from the diffusion lesion in four subjects. OEF values are displayed after normalization to the mean OEF in the contralateral hemisphere of the same individual. In patients with large perfusion–diffusion mismatch (Figure 5(a) and (b)), relative OEF was elevated within 2–8 mm of the diffusion lesion edge and became normalized distal to the lesion. Abnormal, high OEF corresponded to reduced relative perfusion close to the diffusion infarct, and was consistent with 800% increase in diffusion lesion volume at follow-up for the patient in Figure 5(a). On the other hand, the two patients with perfusion–diffusion match exhibited fairly uniform OEF profiles across distance from the diffusion lesion (Figure 5(c) and (d)). The relative OEF values were less than or equal to unity, and these patients tended to have minimal growth of the diffusion lesion (−68%, 25% growth respectively) on the follow-up scan session. These visual observations were supported by the mixed model, which revealed a significant interaction effect between the distance from the DWI lesion and the patient group on the OEF values. Specifically, the relationship between OEF elevation and distance was most prominent in patients with large mismatch (b = −0.0056, standard error = 0.0012, T=−ew4.54, P < 0.0001, marginal R-squared = 0.13). Across all patients, no systematic areas of OEF decrease were found; only two patients had a single vein each with OEF value that was two standard deviations below the contralateral hemisphere OEF.
Relative OEF and CBF profiles in the ischemic hemisphere, plotted against distance from the diffusion lesion in four stroke patients at baseline. OEF measurements were normalized to the mean OEF in the contralateral hemisphere of the same individual. Polynomial fit of the physiological profiles and standard deviation (dotted lines) are overlaid onto observed data points. (a, b) In patients with large perfusion–diffusion mismatch volume, OEF was elevated adjacent to the diffusion lesion, corresponding to reduced relative perfusion. This pathophysiology was not observed distal to the lesion. There was a significant relationship between OEF and distance in patients with large mismatch (P < 0.0001). Patient B did not receive follow-up MRI, so percent growth in the diffusion lesion is not displayed. (c, d) On the other hand, in patients with perfusion–diffusion match, the OEF profiles were relatively uniform across distance from the diffusion lesion, with values less than or equal to 1. These patients tended to have minimal growth of the diffusion lesion (−68%, 25% growth respectively) on the follow-up scan.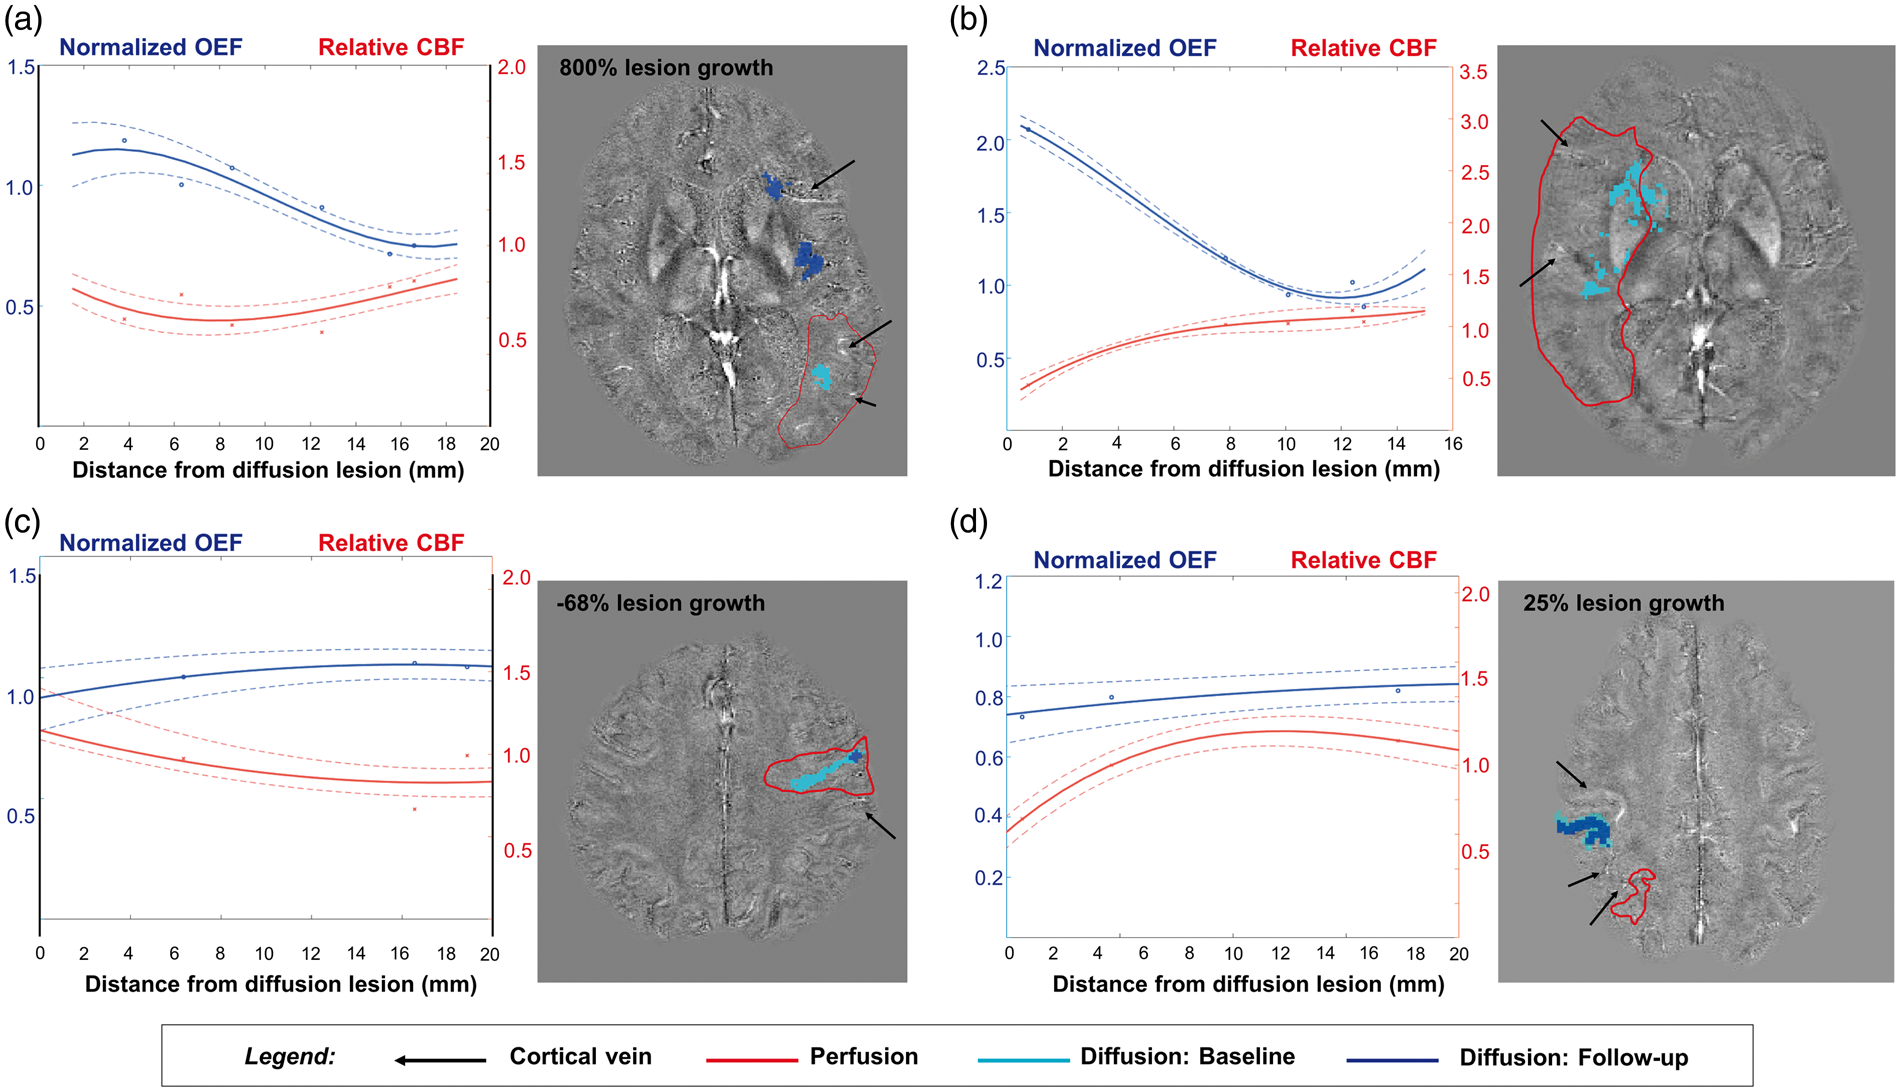
Discussion
This study demonstrates the use of advanced, quantitative susceptibility mapping (QSM) to noninvasively image oxygenation from cerebral vessels in acute ischemic stroke. We observed that OEF is pathologically elevated in the infarcted hemisphere of patients with large perfusion–diffusion mismatch volume, and that OEF inversely correlates with CBF in these patients. OEF elevation was most prominent near the infarct, supporting the concept of a penumbra adjacent to the ischemic core. Furthermore, the noninvasive nature of the proposed MRI method enabled longitudinal imaging, revealing that the ratio of OEF in the ischemic to contralateral hemispheres normalized (decreased) between baseline and follow-up scans several days later in patients who clinically improved.
Although hypo-intense signal on gradient echo magnitude images in the affected stroke area has been associated with clinical status,36,37 few investigations have directly quantified OEF from the corresponding phase images. Two recent studies assessed the accuracy of the susceptibility-based OEF measurements in patients with chronic, unilateral steno-occlusion of the internal carotid artery (ICA) or MCA, through comparison with [ 15 O]-gas PET as a reference standard.38,39 This previous work demonstrated a robust correlation between QSM MRI and [ 15 O]-PET measurements of the ratio of OEF in the ipsilateral to contralateral hemispheres. Based on receiver operating characteristic analysis, an increased QSM OEF ratio of >1.09 was determined to predict the increased OEF ratio on the PET scans, with sensitivity and specificity of 0.82 and 0.86, respectively. 39 This observation is corroborated by our MRI findings in patients with large perfusion–diffusion mismatch, who are expected to have penumbra. These patients exhibited an OEF ratio of 1.16, with greater OEF values in the ischemic versus contralateral hemisphere (P = 0.032). However, mismatch assessment has also been shown to overestimate penumbral volume compared to PET. 14 Additional work is needed to understand the specificity and sensitivity of elevated OEF (on QSM MRI) versus perfusion–diffusion mismatch to detect the true penumbra.
In patients with large mismatch volumes, we further identified an inverse correlation between OEF and DSC CBF in the ischemic hemisphere. This relationship was observed both on the group level, and by visualizing the spatial profile of OEF and CBF along distance from the diffusion lesion in individual patients. Previous use of
Our study used relative CBF measurements from DSC scaled to the cerebellum to avoid known quantification challenges with input function and deconvolution. In a larger cohort of 57 patients with MCA steno-occlusion or acute stroke, Liu and Li 42 acquired absolute CBF measurements with arterial spin labeling (ASL) MRI and OEF measurements with magnetic susceptibility. Similar to our study, elevated OEF and reduced CBF were observed in the affected hemisphere. Liu and Li found that in some patient groups (mild to moderate MCA stenosis), elevated OEF adequately compensated for reduced CBF to maintain a normal level of cerebral metabolic rate of oxygen (CMRO2), while in other groups (MCA occlusion and acute stroke), CMRO2 was overall reduced in the ischemic hemisphere, suggesting OEF had reached a maximal level. 42 In future work, the combination of ASL for quantitative perfusion with susceptibility-based OEF scans will improve understanding of how the stroke penumbra evolves metabolically over time and tissue boundaries. 41 While the application of ASL in stroke is challenging due to pathological arterial transit times, advanced multi-delay 43 and long-delay labeling strategies 44 have shown success in serial imaging of cerebrovascular patients. If acquired with sufficient SNR, ASL MRI may detect perfusion changes more sensitively and accurately than DSC, including subtler CBF changes in mild patients (i.e. our patient group with no hypo-perfusion) that here did not correlate with OEF.
The use of noninvasive QSM imaging to longitudinally evaluate oxygenation in stroke patients is a unique aspect of this study. Across our patients who received longitudinal imaging, we observed an average decrease of 2.8% in absolute OEF, corresponding to a 20% reduction in OEF ratio (ipsilateral to contralateral hemispheres) from baseline to follow-up scans several days later. This OEF change is consistent with historical [ 15 O]-PET data in non-human primates, which observed 46% and 28% elevation in OEF ratio at 1-h and 4-h post middle cerebral artery occlusion, respectively, followed by a similar normalization (reduction) of OEF ratio to 1.04 at the 15-day follow-up session. 45 Past susceptibility MRI studies have also shown that the OEF biomarker has low scan-rescan coefficient of variation (5.9%), 46 and is sensitive to absolute OEF changes of 5.2% during hyperventilation and −3.4% during acetazolamide administration. 47 Our measured longitudinal changes are within this detectable physiological range, and underscore the high sensitivity of QSM to even small oxygenation changes over time. Even with the limited number of follow-up cases in this study, we found a preliminary, positive association between OEF and NIHSS clinical score (P = 0.04). Longitudinal imaging in a larger stroke cohort including patients with poorer NIHSS scores is warranted to determine whether changes in OEF after treatment correlate with infarct growth and clinical outcome.48,49
An appealing feature of the QSM approach is its noninvasive nature and ability to quantitatively and directly estimate OEF. We expect the sensitivity and accuracy of this technique to improve with higher spatial resolution, which increases the visualization of cortical veins and minimizes partial volume effects. The agreement of oxygenation measurements between susceptibility MRI and [ 15 O]-PET, for instance, was greater for susceptibility maps at 7 Tesla (0.5-mm in-plane resolution) versus 3 Tesla field strengths (0.67-mm resolution), based on experiments performed by the same group.38,39 Higher spatial resolution in future work can also be facilitated by accelerated acquisition methods for three-dimensional gradient echo imaging, 50 particularly in acute settings. In this analysis, we used the highest 10% of susceptibility values in each vein to avoid partial volume effects, and thus expect the OEF differences we observed to reflect underlying physiology instead of vein size (e.g., asymmetrically prominent veins in the infarcted hemisphere). Nonetheless, residual partial volume effects would lead to underestimation of magnetic susceptibility, and likely contributed to OEF underestimation by QSM (∼30% absolute OEF in unaffected hemisphere compared to ∼40% in healthy tissues measured by [ 15 O]-PET). More robust OEF assessment from more voxels could be achieved in future analysis through partial volume correction, e.g. by using joint information from the magnitude signal 51 or direct modeling of the vessel shape. 52
Despite the potential of advanced vein segmentation techniques53,54 to automate regional oxygenation assessment, a major limitation of the vein-based QSM method is that it cannot provide voxel-wise information about tissue oxygenation. In individuals with large perfusion–diffusion mismatch, we observed OEF elevation concomitantly with CBF reduction in vessels located within 5–8 mm of the diffusion lesion edge, indicative of penumbra. However, because OEF is measured in veins and not on the tissue level, direct delineation of penumbra tissue volumes (as is the gold standard by [
15
O]-PET55,56) is not possible. Furthermore, a recent
The small patient sample size of our study was driven in part by our exclusion of patients who underwent hemorrhagic transformation. Spontaneous hemorrhagic transformation is observed in up to 43% of CT evaluations of stroke patients 59 and leads to low signal and large susceptibility artifacts that overwhelm the deoxyhemoglobin in veins on QSM maps. A superposed inversion process that iteratively masks the area of hemorrhage and reconstructs susceptibility values in each region can limit streaking artifacts on the resulting QSM maps, 60 and enable inclusion of patients with hemorrhage for OEF evaluation. This analysis also assumed an arterial blood saturation of 100% for all subjects, but this value varies with posture and age, even in healthy people. Stroke patients have been shown to have 5–10% lower arterial blood saturation,61,62 and this parameter should be measured with a pulse oximeter for OEF quantification in future physiological studies of stroke.
Another limitation of the present study is a substantial proportion (14/20) of the patients had large-artery stenosis as the underlying cause of stroke. The OEF elevation near the stenosis in these patients may reflect areas of chronic hypo-perfusion (with less available oxygen) that never progress to infarction, which we cannot distinguish here from acute tissue pathophysiology (i.e. due to small peripheral emboli). The heterogeneity of patients in our cohort also contributed to variable revascularization outcome at follow-up. Although OEF decreased overall in the nine patients with repeat imaging, five of these patients had full recanalization while the others showed persistent stenosis or occlusion. Without separate assessment of collateral flow / reperfusion and with limited number of patients, this study lacked sufficient statistical power to determine an underlying mechanism for the OEF improvement over time. Future studies should test the validity of the QSM method in patients with more acute strokes and comparable vessel pathologies, and carefully document reperfusion status to understand OEF evolution during stroke recovery and its relationship to clinical progress.
Conclusion
This pilot study demonstrates the feasibility of OEF quantification in veins from susceptibility MRI to detect oxygenation changes in 20 patients with acute stroke. We observed elevated OEF in the infarcted hemisphere compared to the contralateral hemisphere, and an inverse relationship between OEF and CBF in patients with large perfusion–diffusion mismatch. Longitudinal imaging also showed that the OEF ratio is normalized between baseline and follow-up scans several days afterward. Quantitative susceptibility mapping is a non-invasive and quantitative MRI approach that provides meaningful information about regional oxygenation with a 5-min scan, even in challenging cases of acute ischemic stroke.
Footnotes
Acknowledgements
The authors thank Dr. Jan Sedlacik of the Universitätsklinikum Hamburg-Eppendorf, as well as Dr. Karin Shmueli and Emma Biondetti of the University College London for their helpful discussion on quantitative susceptibility reconstructions.
Authors' contributions
All authors (APF, AAK, JBF, GZ, AV, KV, CJG) made a substantial contribution to the concept and design, acquisition of data, or analysis and interpretation of the data. All authors also assisted in drafting the article or revising it critically for important intellectual content. Final approval of the submitted manuscript was provided by all authors.
Funding
The author(s) disclosed receipt of the following financial support for the research, authorship, and/or publication of this article: This work was supported by Stanford Neuroscience Institute Interdisciplinary Scholar Award, Heart and Stroke Foundation of Canada New Investigator Award and Henry J.M. Barnett Scholarship, National Institutes of Health (1K99NS102884).
Declaration of conflicting interests
The author(s) declared no potential conflicts of interest with respect to the research, authorship, and/or publication of this article.
*These authors have contributed equally as senior authors.