
Abstract
Relative delays in blood-oxygen-level-dependent (BOLD) signal oscillations can be used to assess cerebral perfusion without using contrast agents. However, little is currently known about the utility of this method in detecting clinically relevant perfusion changes over time. We investigated the relationship between longitudinal BOLD delay changes, vessel recanalization, and reperfusion in 15 acute stroke patients with vessel occlusion examined within 24 h of symptom onset (D0) and one day later (D1). We created BOLD delay maps using time shift analysis of resting-state functional MRI data and quantified perfusion lesion volume changes (using the D1/D0 volume ratio) and severity changes (using a linear mixed model) over time. Between baseline and follow-up, BOLD delay lesions shrank (median D1/D0 ratio = 0.2, IQR = 0.03–0.7) and BOLD delay severity decreased (b = −4.4 s) in patients with recanalization, whereas they grew (median D1/D0 ratio = 1.47, IQR = 1.1–1.7) and became more severe (b = 4.3 s) in patients with persistent vessel occlusion. Clinically relevant changes in cerebral perfusion in early stroke can be detected using BOLD delay, making this non-invasive method a promising option for detecting tissue at risk of infarction and monitoring stroke patients following recanalization therapy.
Keywords
Introduction
Temporal lags between blood-oxygen-level-dependent (BOLD) signal low-frequency oscillations (LFOs) in the brain and in reference regions such as the venous sinuses can be used to assess disturbances in cerebral blood flow 1 without the need for intravenous contrast agents. This method, known as BOLD delay, has been validated against established perfusion imaging techniques in patients with acute stroke,1–3 chronic cerebrovascular disease,2,4–7 and healthy individuals. 8
Monitoring cerebral hemodynamics following treatment aimed at vessel recanalization is an important part of acute stroke management. 9 However, this strategy is currently limited in practice by concerns about contrast agents accumulating in brain tissue following their repeated use for dynamic susceptibility contrast MRI (DSC-MRI). 10 Non-invasive perfusion imaging MR techniques such as arterial spin labeling (ASL) or BOLD delay are promising alternatives to DSC-MRI in both clinical practice and research. ASL’s use has been comprehensively studied in acute stroke, 11 and relevant improvements to the technique have been made recently. 12 Much less is currently known about the practical utility of BOLD delay in this setting, despite its ability to provide multiple types of physiological information with a single scan. 13
In this study, we investigated BOLD delay’s potential for detecting therapeutically and pathophysiologically relevant changes in perfusion over time in acute ischemic stroke patients. In a subset of patients, we compared these changes to those detected using the clinical reference standard, DSC-MRI.
Materials and methods
Patients
Patients were recruited as part of the 1000plus (NCT00715533) and LOBI-BBB (NCT02077582) prospective clinical studies, which were approved by the Ethics Committee of the Charité – Universitätsmedizin Berlin (EA4/026/08 and EA1/200/13, respectively). All patients gave written informed consent and the study was conducted according to the Declaration of Helsinki. Patients with a vessel occlusion on MR angiography examined within 24 h of stroke symptom onset (D0) and about 24 h later (D1) were eligible for this substudy. Patients with severe head motion (mean framewise displacement 14 > 0.4 mm) in either of their resting-state functional MRI (rsfMRI) scans were excluded.
Image acquisition
Imaging was performed on a Siemens (Erlangen, Germany) Tim Trio 3T scanner and included diffusion-weighted imaging (DWI), rsfMRI, MR angiography, and fluid-attenuated inversion recovery (FLAIR) scans. 15 The sequence parameters for rsfMRI were: repetition time (TR) = 2300 ms, echo time (TE) = 30 ms, flip angle (FA) = 90°, matrix = 64 × 64, voxel dimensions = 3 × 3 × 3 mm, 33 slices and 150 volumes (time = 5 min· 50 s). In nine cases, dynamic susceptibility contrast MRI (DSC-MRI) was additionally performed with the following parameters: TR = 1390 ms, TE = 29 ms, FA = 60, matrix = 128 × 128, voxel dimensions = 1.8 × 1.8 × 5 mm, 21 slices and 80 volumes (time = 1 min·58 s) following a bolus of 5 ml Gadobutrol and a saline flush (5 ml/s).
Image processing
Block-circulant singular value decomposition deconvolution of the DSC-MRI data was used to generate maps of time-to-maximum of the tissue concentration-time curve (Tmax) 16 using Stroketool version 2.8 (© 2011 Digital Image Solutions – HJ Wittsack).
Processing of rsfMRI data was performed as previously described, using the mean BOLD signal in the major venous sinuses as a reference and a time shift range of ±16.1 s.3 Each voxel was assigned the value of the time shift step corresponding to the highest cross-correlation between that voxel’s BOLD signal and the reference signal. Positive time shift values represent BOLD delay, which indicates hypoperfused tissue.3 Negative time shift values have been shown to be unrelated to contrast-agent-based delay parameters such as Tmax. 8 Voxels with negative time shift values were therefore excluded from all analyses in which direct comparisons with Tmax were made in this study.
The BOLD delay and Tmax maps were registered to a custom EPI template3 using FMRIB's linear image registration tool (FLIRT). 17
Recanalization was assessed on D1 MR angiography images by an experienced radiologist (K.V.) blinded to the BOLD delay and Tmax maps using the thrombolysis in myocardial infarction (TIMI) score. 18 The TIMI score was dichotomized 19 into:
Persistent vessel occlusion
A TIMI score of 0 (no flow past the initial occlusion) or 1 (flow past the initial occlusion but without filling of the distal branches).
Recanalization
A TIMI score of 2 (flow with incomplete distal branch filling) or 3 (flow with complete filling of distal branches).
Volumetric analysis
DWI, BOLD delay, and Tmax lesions (on D0 and D1) were manually traced by an experienced stroke researcher (A.K., blinded to recanalization status) followed by automated removal of artifacts in the CSF.3 Perfusion lesions derived from a user-independent delineation process (described in more detail in the Online Supplement) were compared to manually delineated lesions to further exclude rater bias.
Lesion volumes were calculated by multiplying the number of voxels in the lesion masks by the voxel size. For each patient, the ratio between lesion volumes at follow-up versus baseline (D1/D0) was calculated.
Changes in BOLD delay and Tmax over time
We correlated mean BOLD delay and Tmax values in a set of regions-of-interest (ROIs) within the affected vascular territory in each individual patient at baseline.3 Vascular territories were defined by an atlas that was manually drawn (based on published templates) in the custom EPI template space.3 Each ROI corresponded to the individual patient's affected vascular territory on a single slice, similar to previous studies that compared BOLD delay to Tmax. 4 Spatial overlap between manually delineated BOLD delay and Tmax lesions was assessed using the Dice similarity coefficient at baseline. 20
Changes over time were quantified by comparing the mean perfusion (BOLD delay and Tmax) values in the same ROIs described above on days 0 and 1. In addition, voxelwise BOLD delay and Tmax values (at both D0 and D1) were extracted from the following areas; the D0 DWI lesion, areas of early infarct growth 21 (defined as regions within the D1 DWI lesion mask but not within the D0 DWI lesion mask), the rest of the affected vascular territory (defined as all voxels within the affected vascular territory belonging to neither the D0 DWI lesion nor the D1 DWI lesion), and the contralateral vascular territory (see Online Supplement).
Statistical analysis
Statistical analyses were performed using R 3.1. 22 Comparisons between recanalizers and non-recanalizers were made using the Wilcoxon rank-sum test. The relationships between the BOLD delay lesion volume ratio and the TIMI score, as well as between Tmax and BOLD delay values, were assessed using Spearman’s rank correlation coefficient. Agreement between manual and automated perfusion lesion volumes was quantified using the intraclass correlation coefficient (two-way random-effects model of absolute agreement).
A linear mixed model (R package “lme4”) was used to investigate the effect of the interaction between recanalization and time (changes between D0 and D1) on the BOLD delay values in areas of infarct growth. The model included a varying intercept for the different patients (random effect) and allowed the slopes of the time and recanalization variables (fixed effects) to vary by patient. P-values of the coefficients in the mixed model were calculated using Satterthwaite's method for approximating degrees-of-freedom, implemented in the R package “lmerTest.” 23 Note that for the mixed model analysis, where no comparison with Tmax was made, both positive and negative BOLD delay values were included. A visualization of the model was created using the R package “effects”.
The code and data used for performing the analysis and visualizing the results are available here: https://github.com/ahmedaak/longBD.
Results
Patients
Clinical characteristics of the study sample.
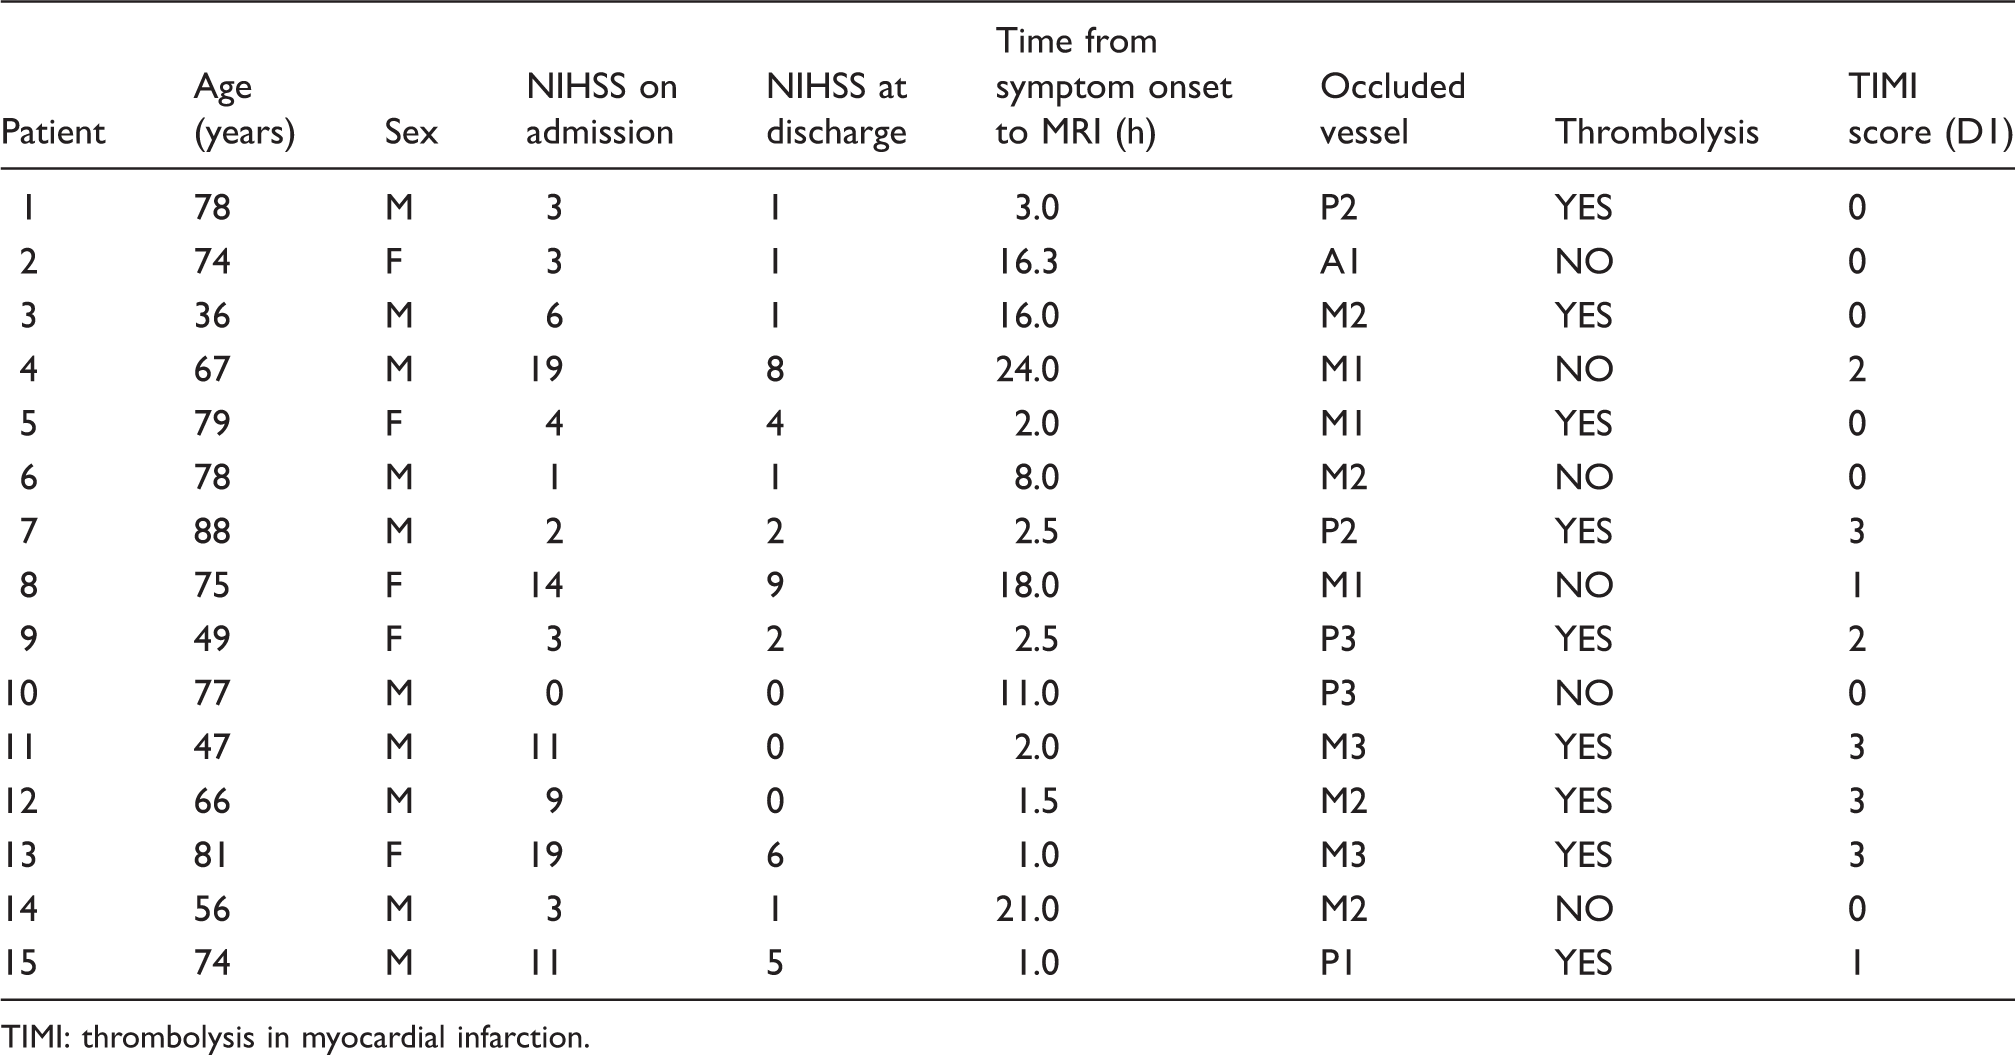
TIMI: thrombolysis in myocardial infarction.
The clinical characteristics (median [IQR]) of the recanalizers and non-recanalizers were as follows: age (67 [53–78] vs. 75 [74–78] years respectively, p = 0.769), time from symptom onset to baseline imaging (2.3 [1.6–2.5] vs. 11 [3–16.3] h, p = 0.215), time from baseline imaging to follow-up imaging (25 [24.3–25] vs. 23 [23–25] h, p = 0.279), NIHSS on admission (10 [4.5–17] vs. 3 [3–6], p = 0.211), and NIHSS at discharge (2 [0.5–5] vs. 1 [1–4], p = 0.856). There was no statistically significant difference in head motion between the D0 and D1 rsfMRI scans (median [IQR] framewise displacement in sample at D0 = 0.2 mm [0.15–0.23 mm]; at D1 = 0.19 mm [0.11–0.25 mm], p = 0.945).
Lesion volumes
Manually delineated DWI, BOLD delay, and Tmax lesion volumes according to recanalization status are shown in Figure 1 (the same is shown for automatically delineated lesions in Supplementary Figure I). Agreement between manually delineated and automated volume change ratios was excellent for BOLD delay (ICC = 0.89, 95% CI = 0.71–0.96) and good for Tmax (ICC = 0.7, 95% CI = 0.18–0.92).
Boxplots (central line; median, box; first and third quartiles, whiskers; ± 1.5*IQR) showing manually delineated DWI (a), BOLD delay (b), and Tmax (c) lesion volumes on day 0 and day 1 according to recanalization status. Changes in perfusion lesion volume in patients who did not recanalize (n = 6) and those who did recanalize (n = 3) at follow-up (d). D1/D0 volume ratios > 1 indicate perfusion lesion growth and values < 1 indicate shrinkage. Note that (a) and (b) show the entire sample, while (c) and (d) only show patients who also received DSC-MRI.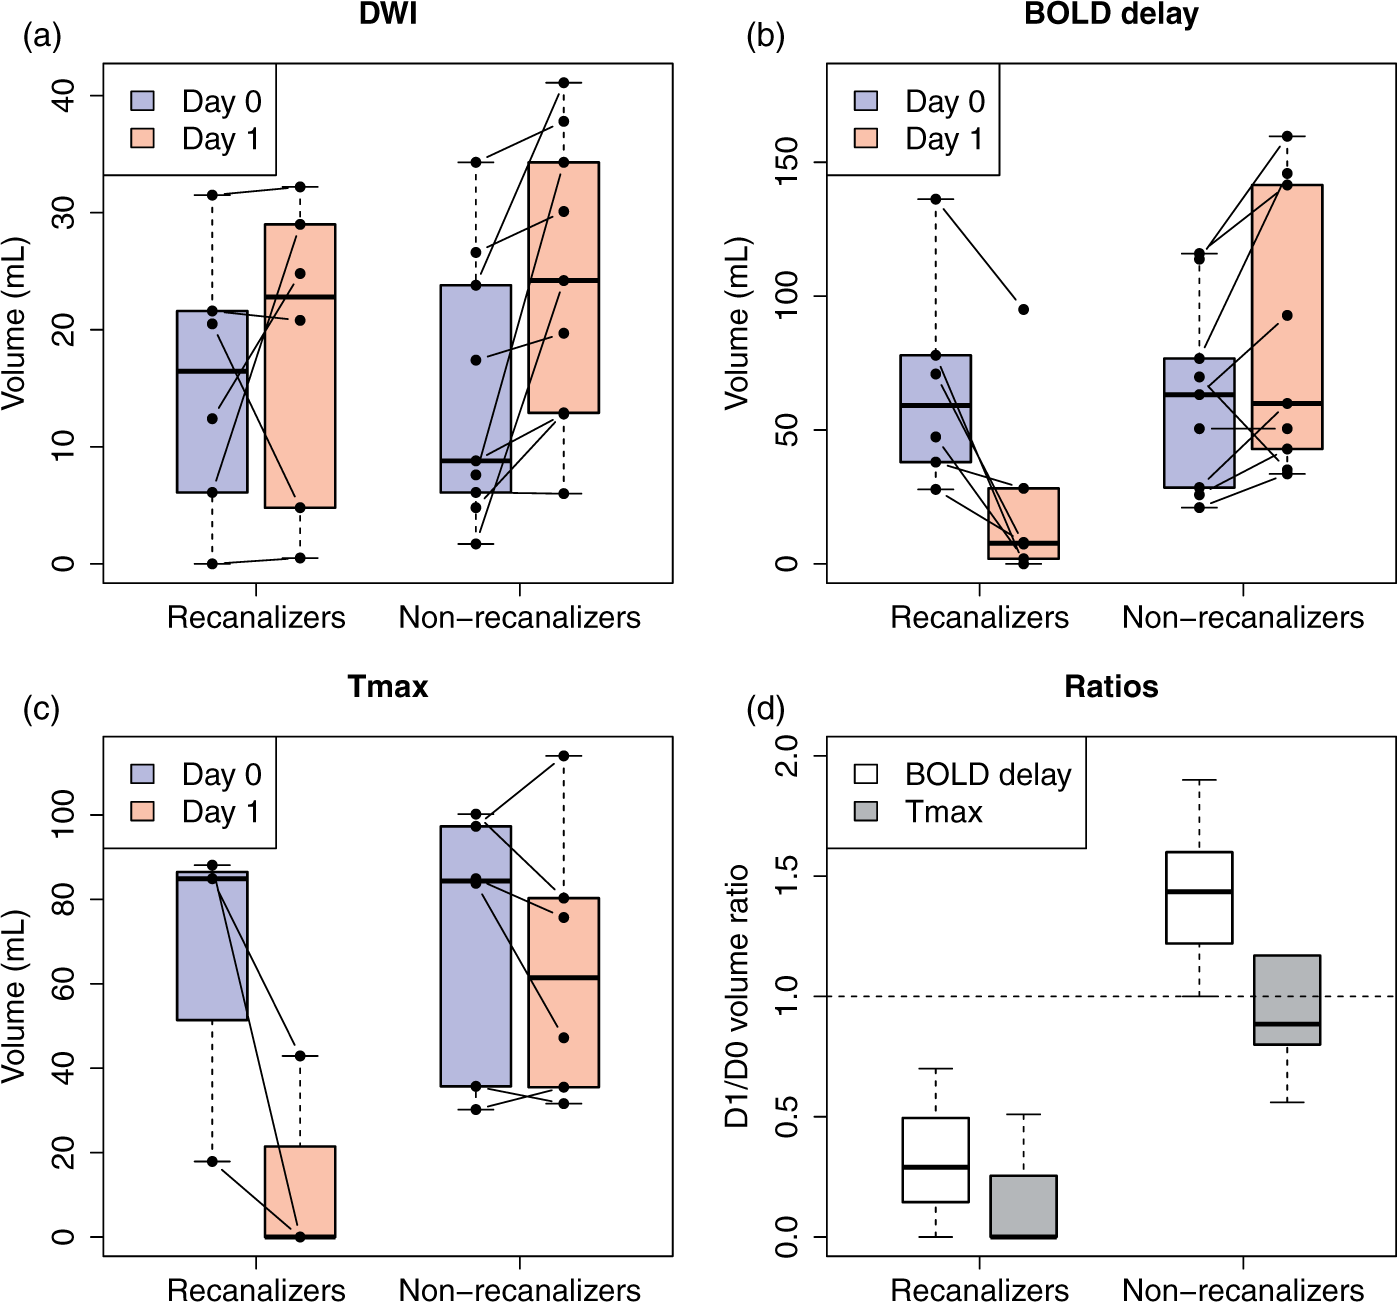
Recanalizers showed less infarct growth (n = 6, median ratio = 1.02, IQR = 0.6–2.7) compared to non-recanalizers (n = 9, median ratio = 1.46, IQR = 1.1–3.2); this difference was not statistically significant (p = 0.347). Growth of the BOLD delay lesion was prominent in non-recanalizers (n = 9, median ratio = 1.47, IQR = 1.1–1.7, example in Figure 2), while BOLD delay lesions shrank in recanalizers (n = 6, median ratio = 0.2, IQR = 0.03–0.7, p = 0.0016, examples in Figure 3 and Supplementary Figure II).
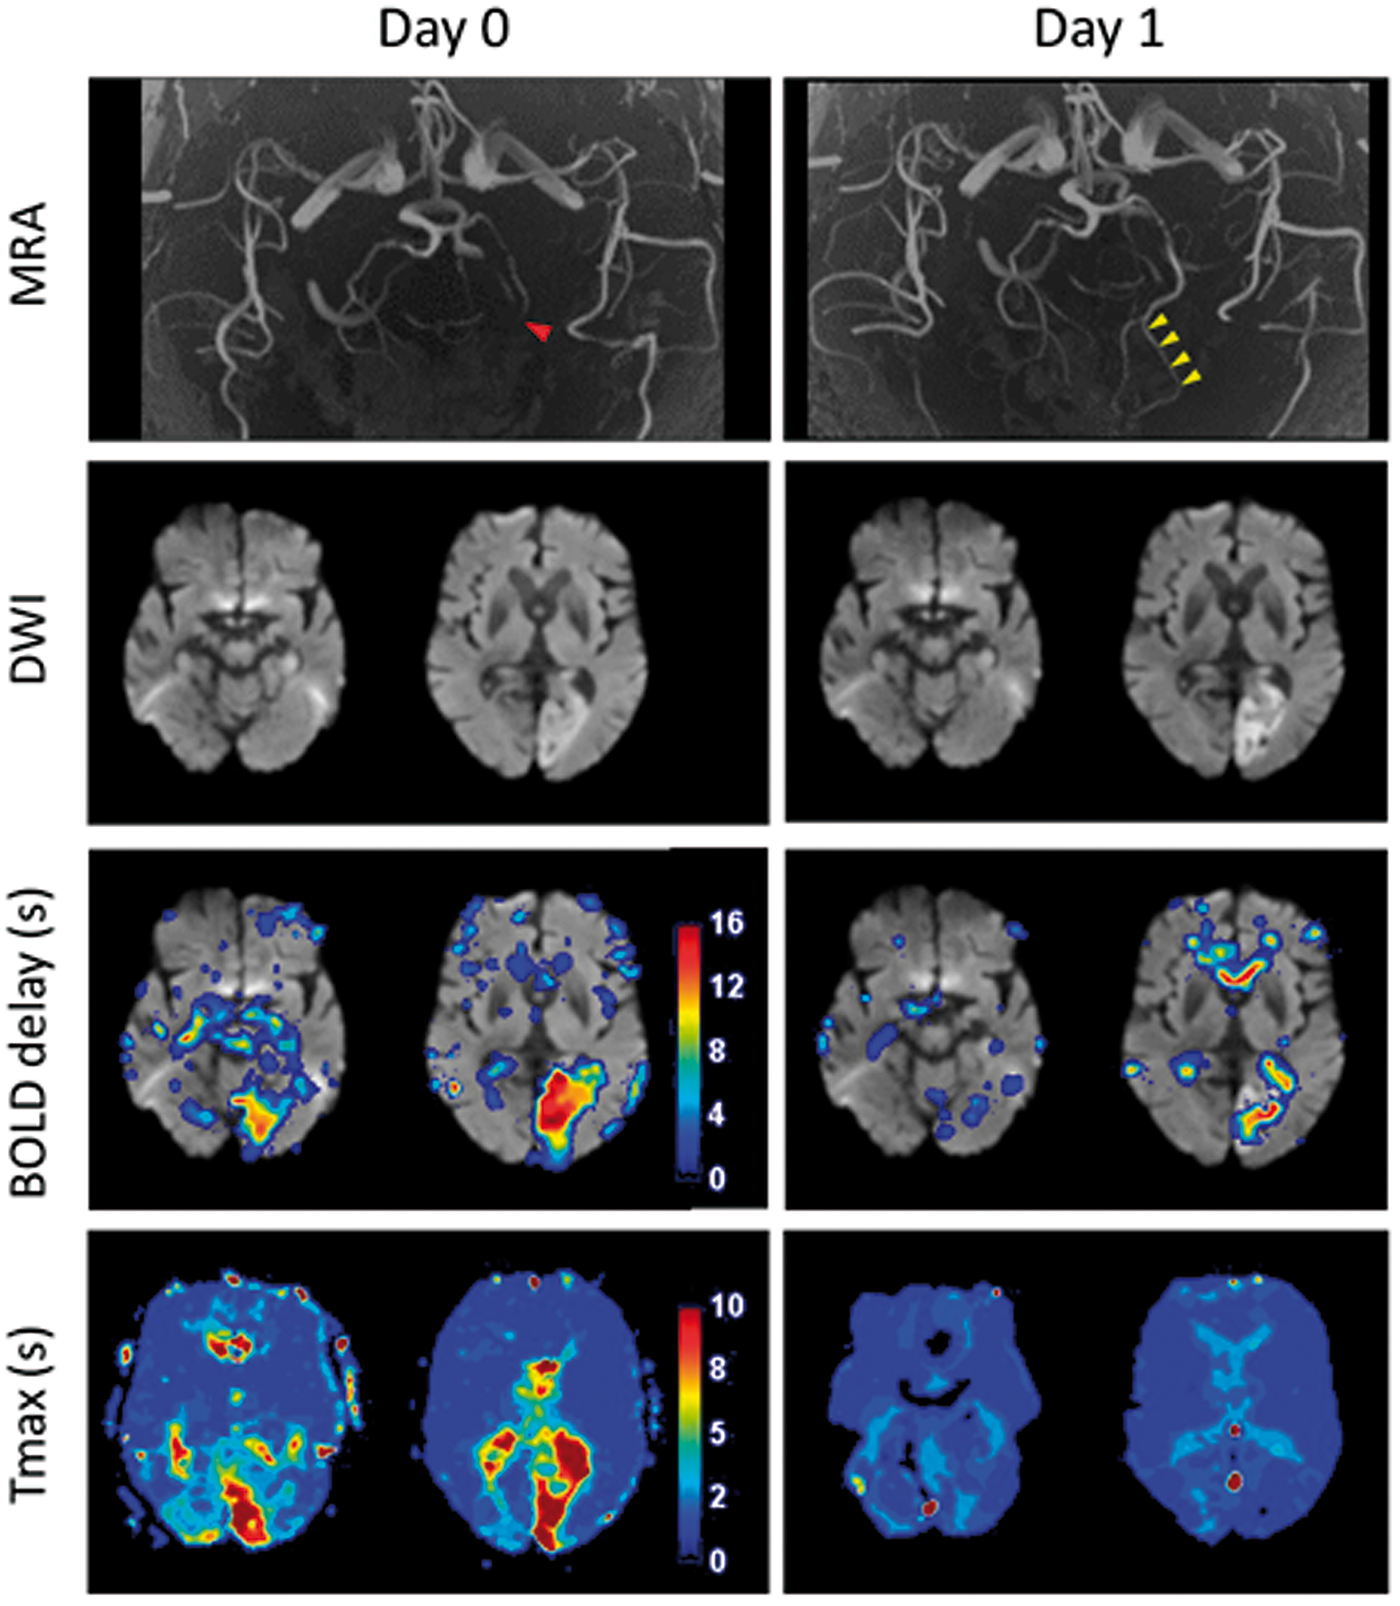
Example of a patient in the non-recanalized group, scanned 2 h after stroke symptom onset (Day 0). Diffusion-weighted imaging (DWI) shows a right-sided middle cerebral artery infarct with an M1 occlusion visible on the MR angiography (MRA) and a corresponding perfusion deficit on both the Tmax and BOLD delay maps. There was no recanalization after intravenous thrombolysis (Day 1). The Tmax lesion remained stable (D1/D0 volume ratio = 1.17). while the BOLD delay lesion grew (D1/D0 volume ratio = 1.47). Example patient showing complete recanalization. This patient was scanned 2.5 h after symptom onset and shows a left posterior cerebral artery infarct. The initial P3 occlusion (Day 0, red arrowhead) completely recanalized (Day 1, yellow arrowheads), accompanied by recovery of the Tmax and BOLD delay lesions. A small amount of BOLD delay persisting within the infarct itself is seen on the Day 1 map.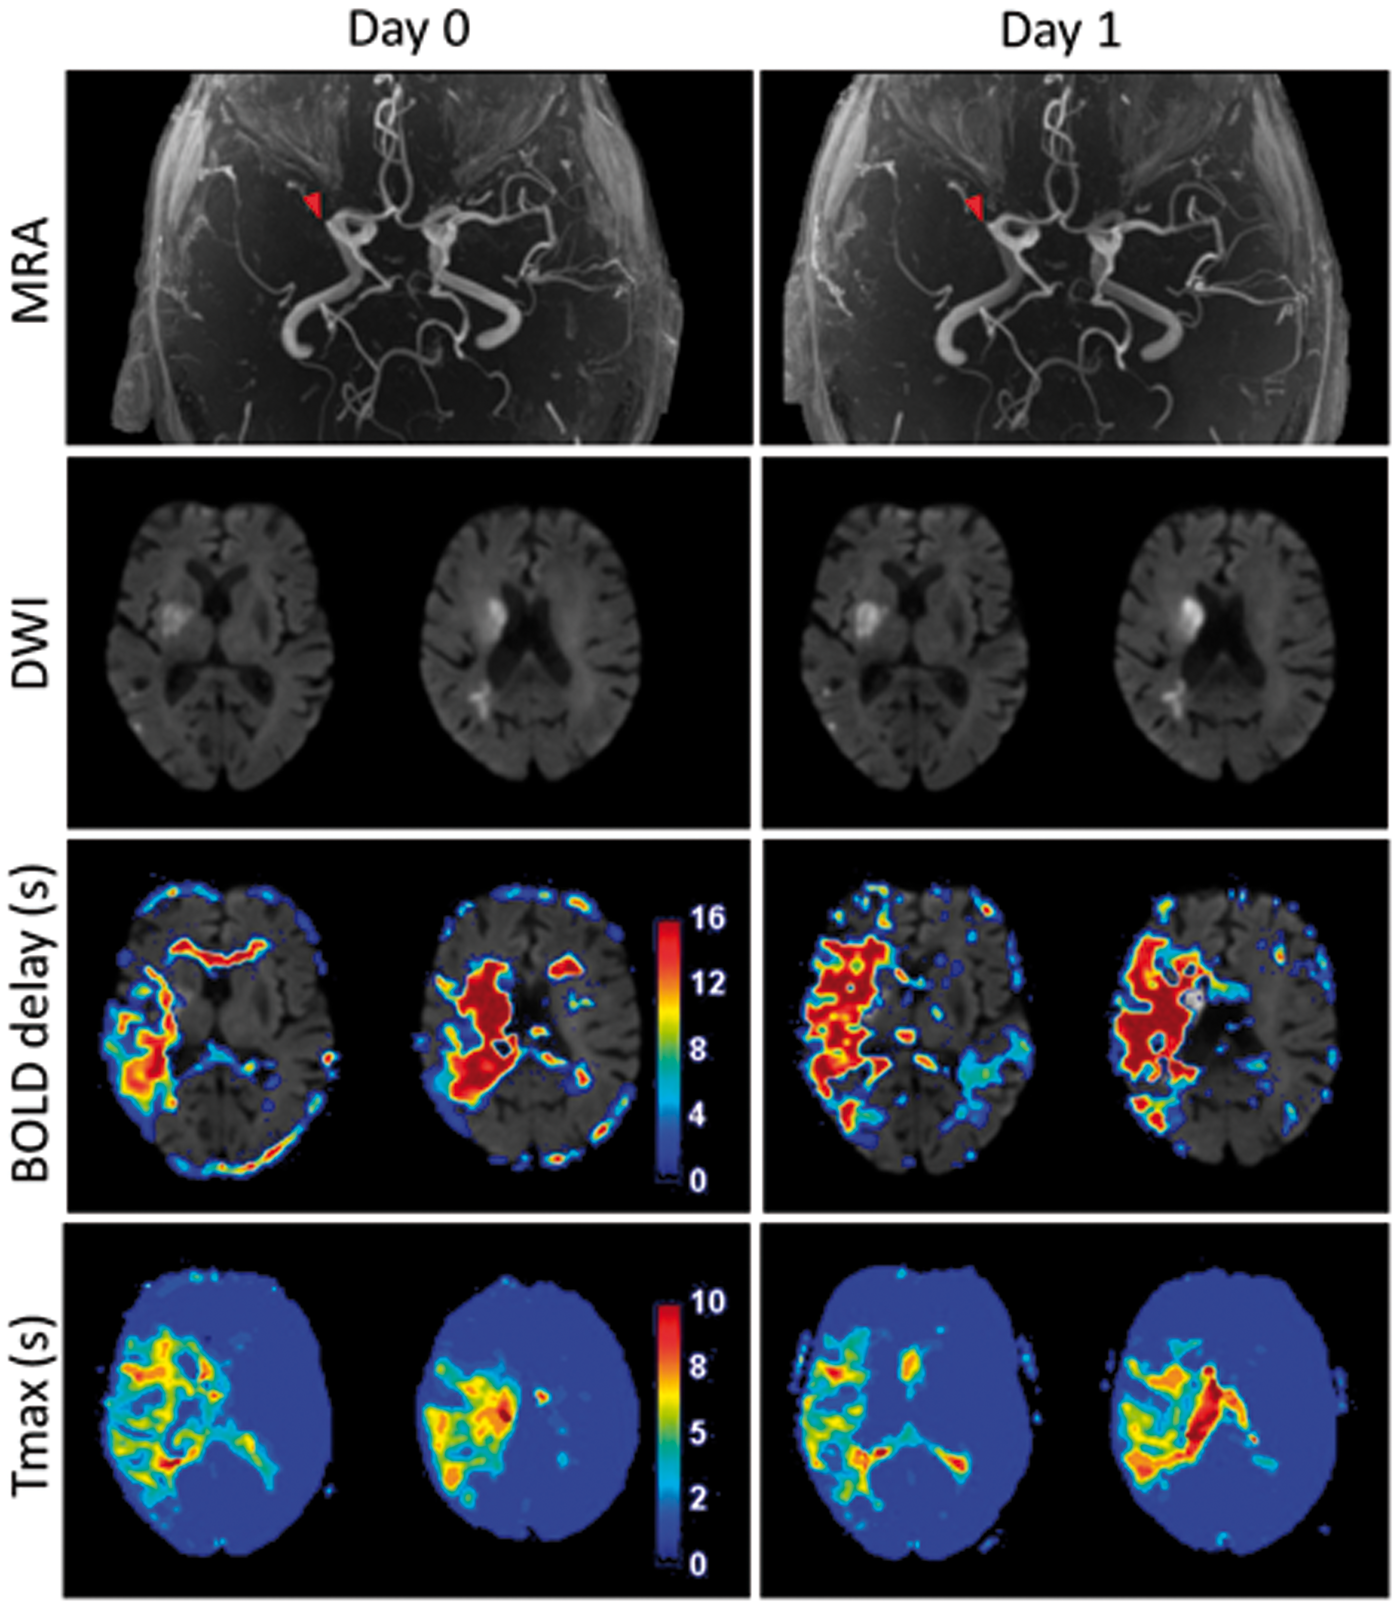
The degree of recanalization, quantified using the TIMI score, was negatively correlated with the BOLD delay volume change ratio (Spearman’s rho = −0.72, p = 0.0027). No significant correlation was found between the BOLD delay volume change ratio and clinical outcome measured using the modified Rankin Score 90 days following stroke onset (Spearman’s rho = 0.4, p = 0.1402).
Changes in BOLD delay and Tmax values over time
To assess the relationship between BOLD delay and Tmax, as has been previously done,3,4 we calculated the ROI-wise correlation between BOLD delay and Tmax (median = 0.43, IQR = 0.26–0.55). Median spatial overlap, quantified using the Dice coefficient, between manually delineated Tmax and BOLD delay hypoperfusion lesions was 0.58 (IQR = 0.44–0.63).
Longitudinal perfusion changes (delta BOLD delay) are shown for all patients in Figure 4, quantified by subtracting the mean perfusion (i.e. BOLD delay or Tmax) value in each ROI (within the affected vascular territory) on D0 from the mean perfusion value in the same ROI on D1. This plot shows that BOLD delay tends to increase in severity over time in non-recanalizers. This occurs in the same ROIs where Tmax severity remains largely stable. On the other hand, in recanalizers, both BOLD delay and Tmax severity decreases (albeit to varying extents).
Scatter plot showing changes in mean Tmax and BOLD delay values within ROIs in the affected vascular territory between days 0 and 1 according to recanalization status. Each point is the mean value within a ROI corresponding to the area covered by the affected vascular territory on each slice. Positive change values indicate worsening of perfusion severity from day 0 to day 1, and negative values indicate improvement. In recanalizers, ROIs where Tmax improves are associated with improvement in BOLD delay. However, in most ROIs in the non-recanalizers, Tmax changes little but BOLD delay severity worsens substantially.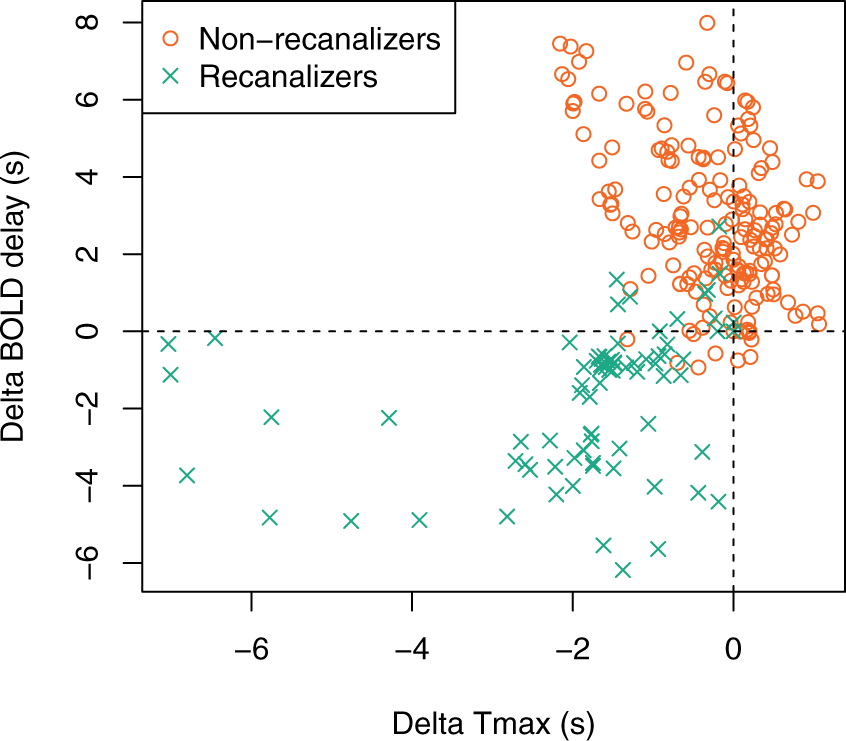
The distribution of BOLD delay and Tmax values on D0 and D1 within the affected vascular territory are shown in Figure 5, pooled across all patients who received both an rsfMRI and DSC-MRI scan. The same is shown for patients who only received rsfMRI (Supplementary Figure III). Most voxels within the affected vascular territory have a BOLD delay value of less than 3 s and represent normally perfused tissue.
8
The second focal peak, seen between 10 and 20 s, represents severely hypoperfused tissue.3,7
Kernel density plots showing the distribution of perfusion deficit severity values (pooled across all patients who received both DSC-MRI and rsfMRI scans) on day 0 and day 1 in the affected vascular territory according to recanalization status. Blue and red vertical lines indicate the mean perfusion deficit severity in the sample on days 0 and 1, respectively.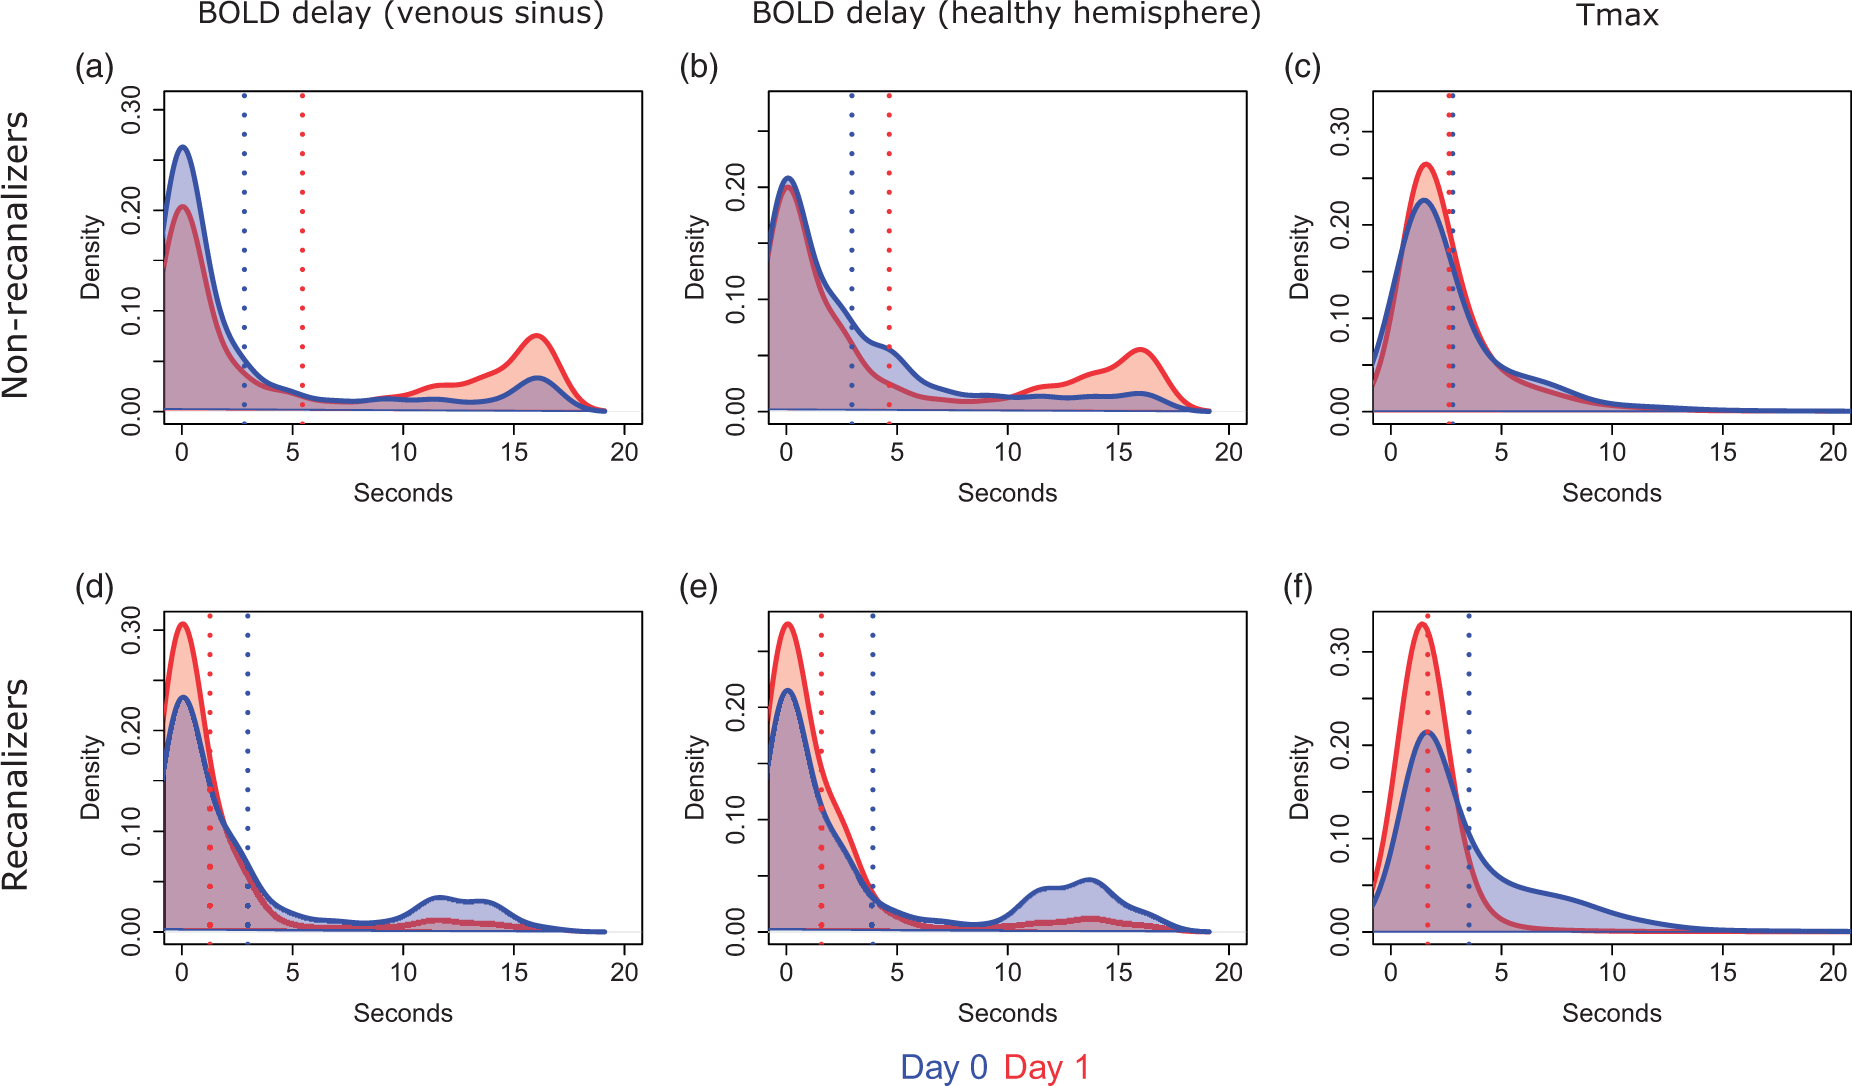
We observed a reduction in BOLD delay severity on D1 (a decrease in the peak between 10 and 15 s on Figure 5(d) and (e)) in patients who recanalized and an increase in severity in patients with persistent occlusion (an increase in the peak between 10 and 20 s on Figure 5(a) and (b)). This pattern is visible in most patients (individual patient plots can be found here: https://doi.org/10.6084/m9.figshare.5904619) and regardless of the reference signal used to calculate the BOLD delay.
The linear mixed model showed that, in areas of infarct growth, the changes in BOLD delay values (in seconds, derived from the venous sinus reference) over time differed between recanalizers and non-recanalizers (main effects interaction between time and recanalization status, F = 22.54, p = 0.0003). BOLD delay severity decreased on D1 compared to D0 in recanalizers (b = −4.4 s) and increased in non-recanalizers (b = 4.3 s, Figure 6). There was no significant difference between recanalizers and non-recanalizers in terms of BOLD delay values on D0 (b = 2.3 s, standard error = 2.0 s, p = 0.2919). The full results of the linear mixed model of the changes in BOLD delay values (including those derived from the healthy hemisphere reference) are shown in Supplementary Table I.
Effects plots showing the predicted mean BOLD delay values (derived from the venous sinus reference in A and the healthy hemisphere reference in B) from the linear mixed models for the interaction between the study timepoints (D0 and D1) and the presence or absence of recanalization. The bars indicate 95% confidence intervals. The plots show that recanalization is associated with a decrease in BOLD delay severity, while persistent vessel occlusion is associated with an increase in BOLD delay severity in areas of infarct growth.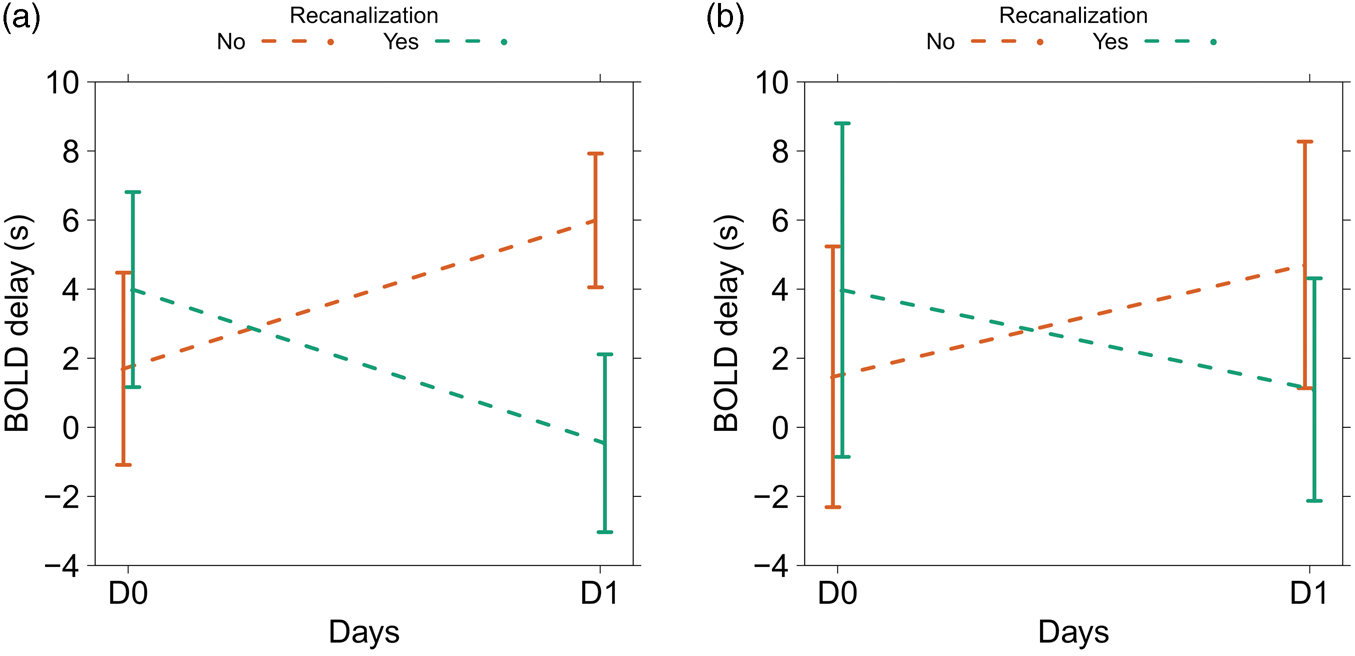
Examples of the relationship between BOLD delay changes and infarct growth in two patients (Supplementary Figure IV) and of a patient with total perfusion-diffusion mismatch 24 detected using both BOLD delay and Tmax (Supplementary Figure V) are shown in the Online Supplement.
Discussion
In this study, we show for the first time that BOLD delay lesions, reflecting abnormal blood flow, recover following vessel recanalization and become more severe when vessel occlusion persists.
BOLD delay detects therapeutically relevant perfusion changes in acute stroke
Several cross-sectional studies have compared BOLD delay to more established perfusion imaging techniques such as DSC-MRI and ASL1–7 but only one study has thus far examined BOLD delay changes over time, 5 starting two weeks after stroke symptom onset. While no information about vessel pathology was reported, BOLD delay recovery was common in that cohort. Substantial BOLD delay was present in only 8% of 86 patients at 3 months post-stroke, showing that BOLD delay changes over time in stroke patients. Of course, reperfusion occurring beyond two weeks following symptom onset is most likely unrelated to treatment and irrelevant for tissue or clinical outcomes.25,26 Our study enhances our understanding of this method by showing that BOLD delay can detect reperfusion associated with vessel recanalization within a clinically relevant time window.
Following vessel recanalization, we found that hypoperfusion on DSC-MRI and BOLD delay recovers in parallel, both in terms of lesion size and hypoperfusion severity. Like Tmax, BOLD delay severity decreased within the first 48 h throughout the affected vascular territory, even in areas of eventual infarct growth (Figure 5), indicating that other factors besides tissue reperfusion may play a role in promoting infarct progression in these patients. 27 Interestingly, partial BOLD delay recovery occurred in cases where reperfusion is incomplete due to partial vessel recanalization (Supplementary Figure II), suggesting that the method is sensitive to subtle changes in perfusion. We also observed that even reperfusion without vessel recanalization, presumably due to recruitment of collateral flow, 28 can be detected using BOLD delay (see Supplementary Figure IV). The relationship between collateral flow and BOLD delay has thus far only been studied in isolated cases 7 but warrants further investigation, as the former is an important predictor of stroke outcome. 29
Comparison to conventional perfusion imaging methods
Blood flow changes in cases of persistent vessel occlusion provide some interesting insights into perfusion measured using BOLD delay. In the absence of vessel recanalization, BOLD delay lesions expand and become quantitatively more severe within the first 48 h following symptom onset. Importantly, this unexpected finding was not an artifact of our choice of reference signal (Figure 5 and Supplementary Figure III). Although in theory the venous sinus signal may be contaminated by stroke-related changes in the passage of blood through the vasculature, the results were similar when using the average signal from the healthy (unaffected) cerebral hemisphere as a reference in the time shift analysis procedure (Figure 5 and Supplementary Figure III).
In some patients with vessel occlusion (see individual plots here: https://doi.org/10.6084/m9.figshare.5904619), BOLD delay increases most prominently in hypoperfused areas that later infarcted, whereas Tmax showed little change over time in these areas. These are isolated observations, but they nevertheless suggest that the relationship between Tmax and BOLD delay is complex and requires further investigation. Again, this was observed when either the venous sinus or unaffected hemisphere signal was used as a reference, suggesting that the observation is not an artifact of the choice of reference signal. In addition, in situations of adequate collateral flow and low infarct growth (despite persistent vessel occlusion), we observed BOLD delay recovery (Supplementary Figure IV). It is worth noting that BOLD delay, which is based on an oxygenation-sensitive signal, probably reflects tissue perfusion by red blood cells, while Tmax, which uses an intravascular tracer, reflects plasma perfusion. These phenomena may be differentially affected in acute stroke, for example due to progressive capillary constriction by pericytes, which can selectively prevent the passage of oxygen-carrying blood cells and ultimately cause tissue death.30,31 Our results suggest that such changes may be better reflected in BOLD delay than conventional measures of perfusion. Animal studies combining multiple imaging modalities, as well as larger clinical studies comparing perfusion changes over time using both BOLD delay and DSC-MRI, may help investigate this hypothesis.
Our results further validate BOLD delay as a non-invasive measure of blood flow that can be used for monitoring stroke patients in clinical practice. The routine use of existing perfusion imaging methods is mainly hindered by technical and logistic limitations,32,33 despite being useful for guiding reperfusion therapy in acute stroke34,35 and for decision-making in patients with stroke mimics 36 or a total perfusion-diffusion mismatch24,37 (Supplementary Figure V). Perfusion imaging based on rsfMRI is advantageous for reasons beyond simply not requiring exogenous contrast agent administration. Using the same data, clinicians may distinguish mild from severe hypoperfusion,3,4 assess changes in blood volume potentially related to collateral flow,3,38 and study the consequences of brain ischemia on the brain’s functional networks.39,40 Moreover, our study shows that BOLD delay is capable of detecting relevant changes in perfusion over time in acute stroke. However, we did not find a correlation between BOLD delay changes and modified Rankin score at day 90, possibly because many factors besides reperfusion influence stroke outcome. 41 Studies with larger sample sizes should be designed to account for these factors with the aim of investigating whether the use of BOLD delay to guide treatment-related decisions influences clinical outcomes.
Limitations
Our final sample was relatively small, mostly because many patients were excluded due to head motion. Motion-related BOLD signal changes affect the time shift analysis procedure, resulting in false-negatives and potentially confounding longitudinal studies. By using stringent exclusion criteria, our final sample had little motion that was comparable between the D0 and D1 scans. The quantitative and spatial relationships between BOLD delay and Tmax in the current study are similar to those reported in the literature,2–4,6,7 suggesting that our sample, although small, is representative of patient populations that have been studied so far. We are also currently investigating the use of motion correction strategies to make BOLD delay more suitable for routine clinical use.
As a consequence of the small sample size, this study’s conclusions are subject to certain caveats. Although vessel recanalization and reperfusion are closely linked, other factors may also influence a stroke patient’s perfusion status. These include the time from stroke symptom onset to imaging and the extent of collateral flow (which affects both tissue perfusion and stroke severity). In our sample, the groups were not well matched in terms of stroke severity and time from symptom onset to imaging, which precludes concluding that recanalization independently caused the changes in perfusion over time observed using BOLD delay. Larger studies are crucial to investigating the precise relationship between BOLD delay changes and treatment-related factors such as vessel recanalization, as well as clinical outcome.
In theory, the relatively low-sampling rate used in this study (TR = 2.3 s) may not be optimal for estimating time shifts. However, recent evidence from our group using multiband sequences with high temporal resolution (TR = 0.4 s) indicates that the oscillations driving BOLD delay in stroke are inherently very slow (<0.1 Hz). 42 The main advantage of using a higher sampling rate would therefore be to allow removal of fast physiological signals through temporal filtering, which could not be performed in this study.
Previous studies 5 have excluded infarcted tissue from BOLD delay assessment due to the potential for noisy correlations. Indeed, in these areas, local (patho-)physiological factors profoundly alter the BOLD signal due to events such as cell swelling (as indicated by DWI), reduced oxygen consumption, and disturbed neurovascular coupling. However, there is ample evidence suggesting that the fluctuations underlying BOLD delay are of systemic origin, being primarily explained by vasodilation induced by changes in blood CO2 due to respiratory variations.38,43–47 Thus, these fluctuations are unlikely to depend solely on such local mechanisms. Nonetheless, we examined in our sample the distribution of the maximum cross-correlation coefficient in the DWI lesion, the BOLD delay lesion, and healthy contralateral tissue (Supplemental Figure VI). Pathological tissue showed lower time-shifted correlations with the venous sinus signal, possibly due to ischemia-related changes in BOLD oscillation frequency or amplitude 48 that may affect the correlation between the BOLD signal in ischemic voxels and the reference. However, the coefficients of most of the voxels exceeded significance thresholds used in previous studies on healthy individuals,8,49 suggesting that the correlations are not spurious.
Conclusion
We found that changes in cerebral perfusion in acute stroke patients, which are clinically relevant markers of the tissue's response to treatment, can be detected using BOLD delay. This non-invasive method is thus a promising option for monitoring stroke patients receiving recanalization therapy. Moreover, the changes we observed in this study suggest that BOLD delay provides interesting pathophysiological information in stroke patients, the exact nature of which is yet to be fully understood.
Supplemental Material
Supplemental material for Non-invasive monitoring of longitudinal changes in cerebral hemodynamics in acute ischemic stroke using BOLD signal delay
Supplemental material for Non-invasive monitoring of longitudinal changes in cerebral hemodynamics in acute ischemic stroke using BOLD signal delay by Ahmed A Khalil, Kersten Villringer, Vivien Filleböck, Jiun-Yiing Hu, Andrea Rocco, Jochen B Fiebach and Arno Villringer in Journal of Cerebral Blood Flow & Metabolism
Footnotes
Funding
The author(s) disclosed receipt of the following financial support for the research, authorship, and/or publication of this article: This work was supported by the German Federal Ministry of Education and Research (grant numbers 01EO0801, 01EO01301).
Declaration of conflicting interests
The author(s) declared the following potential conflicts of interest with respect to the research, authorship, and/or publication of this article: JBF reports personal fees from BioClinica, Cerevast, Artemida, Brainomix, and Lundbeck, grants from Center for Stroke Research/Federal Ministry of Education and Research, outside the submitted work. KV reports grants from Center for Stroke Research funded by the Federal Ministry of Education and Research, during the conduct of the study (01EO0801 and 01EO01301 – these grants also financed the 1000plus and LOBI-BBB studies) and received consultant fees from Parexel. AR received speaker honoraria and travel expenses from Bayer and EVER Pharma. AAK, J-YH, KV, and JBF are inventors of a patent application relating to a method for automated, user-independent delineation of perfusion lesions, used and described in this manuscript. AAK was supported by a NeuroCure Cluster of Excellence PhD Fellowship. The remaining authors have nothing to disclose.
Authors’ contributions
AAK conceived and designed the study, delineated the images, performed the statistical analysis, interpreted the results, and prepared the original manuscript and figures. VF processed the imaging data. J-YH developed the automated lesion delineated algorithm and processed the imaging data. KV, AR, JBF participated in data collection. KV, AR, JBF, and AV interpreted the results. All authors reviewed and edited the manuscript.
References
Supplementary Material
Please find the following supplemental material available below.
For Open Access articles published under a Creative Commons License, all supplemental material carries the same license as the article it is associated with.
For non-Open Access articles published, all supplemental material carries a non-exclusive license, and permission requests for re-use of supplemental material or any part of supplemental material shall be sent directly to the copyright owner as specified in the copyright notice associated with the article.