
Abstract
By optimizing thresholds, we identified the perfusion-weighted magnetic resonance imaging (PWI) parameters that accurately predict final infarct volume and neurologic outcome in a primate model of permanent middle cerebral artery (MCA) occlusion. Ten cynomolgus monkeys underwent PWI and diffusion-weighted imaging (DWI) at 3 and 47 hours, respectively, after right MCA occlusion using platinum coils, and were killed at 48 hours. Volumes of the hypoperfused areas on PWI were automatically measured using different thresholds and 11 parametric maps to determine the optimum threshold (at which least difference was found between the average volumes on PWI and those determined using specimens or DWI). In the case of arrival time (AT), cerebral blood volume (CBV), time to peak (TTP), time to maximum (
Keywords
Introduction
Perfusion-weighted magnetic resonance imaging (MRI) (PWI) by using the dynamic susceptibility contrast method is widely used to assess perfusion abnormalities in patients with acute ischemic stroke, including candidates for thrombolytic therapies. It has been considered that PWI combined with diffusion-weighted imaging (DWI) can predict which tissues with ischemic penumbra can be salvaged by immediate reperfusion therapy, particularly, beyond 3 hours after the onset of ischemia (Albers et al, 2006; Davis et al, 2008; Koehrmann et al, 2007). However, several studies have reported that areas with perfusion abnormalities show significant variations depending on the parameters, algorithms, or thresholds used to evaluate the abnormalities (Wirestam et al, 2000; Kane et al, 2007; Kudo et al, 2009, 2010). These inconsistencies associated with PWI seem to be one of the reasons for the failure of a recent randomized trial on intravenous thrombolytic therapy, in which a PWI-DWI mismatch had unprecedentedly been adopted as an inclusion criterion (Hacke et al, 2009). To resolve the inconsistencies in PWI findings, it is essential to determine the most appropriate PWI conditions for accurate prediction of penumbral areas. Therefore, we attempted to determine the parameter, algorithm, and threshold that accurately predict the infarct volume and neurologic outcome after permanent unilateral occlusion of the middle cerebral artery (MCA) in the primate brain.
Materials and methods
Preparation of Animal Model
From June to September 2008, we performed intravascular surgery on 10 male cynomolgus monkeys (
All study procedures were approved by the institutional animal care and use committee and performed in accordance with the institutional guidelines for animal experiments.
Magnetic Resonance Imaging
Baseline and follow-up MRI examinations were performed ~3 and 47 hours after MCA occlusion, respectively, by using a 1.5-T MR scanner (Signa MR/i; GE Healthcare, Milwaukee, WI, USA) and a quadrature detection knee coil. One animal died 22 hours after MCA occlusion and was subjected to the follow-up MRI immediately after death (at 22 hours after MCA occlusion). All the animals were anesthetized with an intramuscular injection of ketamine hydrochloride (10 mg/kg) containing atropine sulfate (0.05 mg/kg) before the MRI examinations.
The baseline MRI comprised axial single-shot spin-echo echo-planar DWI (repetition time/echo time, 8000 milliseconds/60 milliseconds;
The follow-up MRI performed at 47 hours after MCA occlusion comprised axial and coronal DWI as well as axial T2-weighted images and fluid-attenuated inversion recovery images performed using the aforementioned parameters.
Neurologic Examination
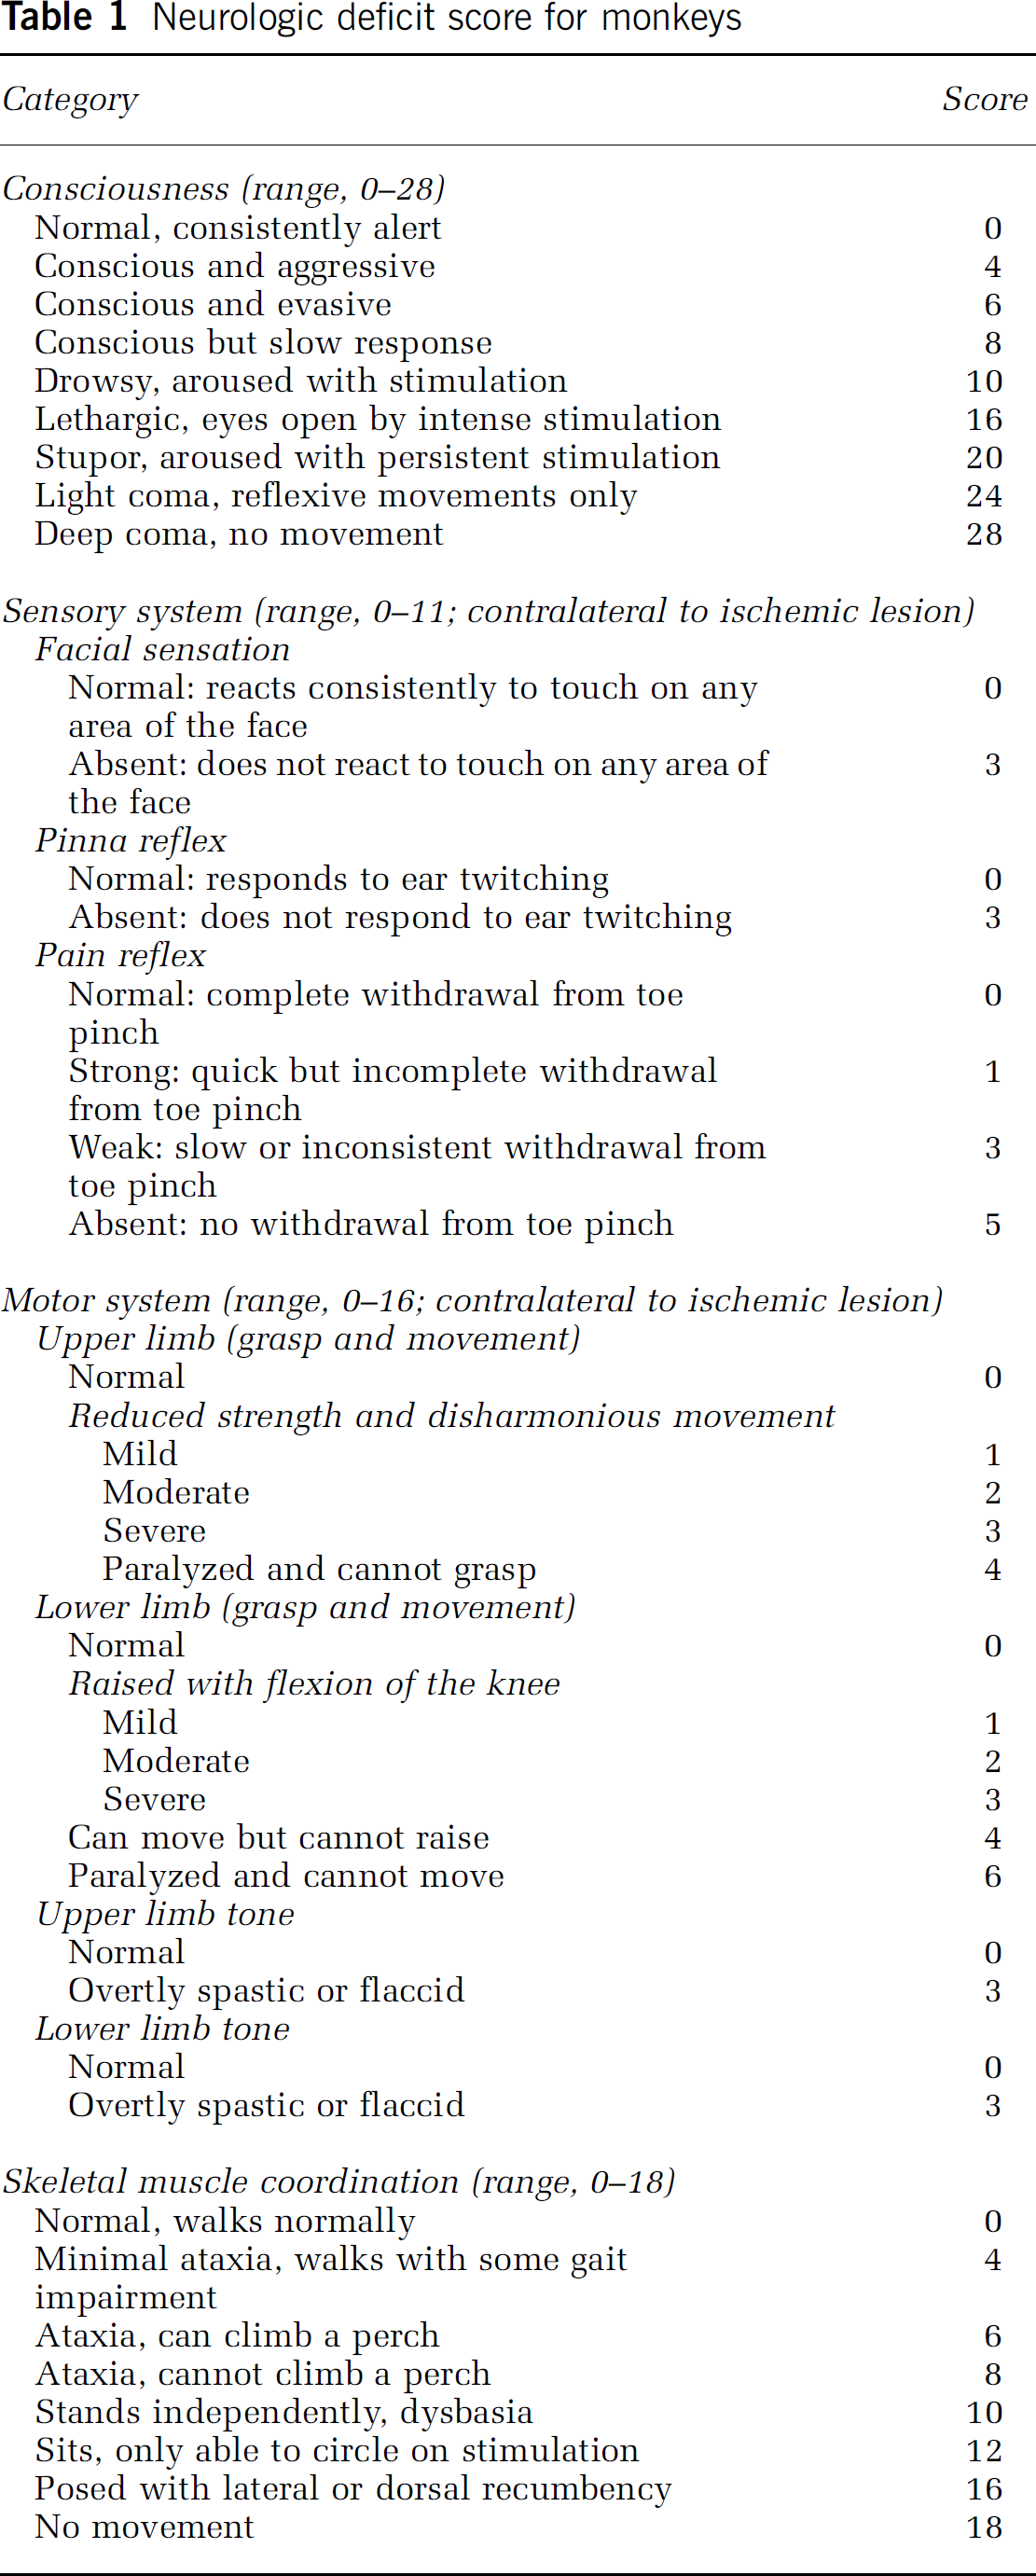
To evaluate the neurologic outcome after permanent MCA occlusion, we calculated the neurologic deficit score (NDS) for monkeys by using a modification of the scoring method introduced by Kito et al (2001) (Table 1) at 46 hours after MCA occlusion, that is, just before the follow-up MRI. The consciousness, sensory system, motor system, and skeletal muscle coordination of the monkeys was assessed by one of the authors (KS), who had extensive experience in evaluating NDSs and was unaware of the baseline MRI findings. The animal that died 22 hours after MCA occlusion could not be subjected to a neurologic evaluation.
Neurologic deficit score for monkeys
Histologic Preparation and Analysis
The animals were deeply anesthetized with an intravenous injection of pentobarbital sodium (35 mg/kg) 48 hours after MCA occlusion. The entire brain was excised, and contiguous coronal sections were cut at 4-mm intervals by using a brain matrix meant for the dissection of adult monkey brains (MBM-2000C; BioResearch, Nagoya, Japan). The sections were stained with 1% 2,3,5-triphenyltetrazolium chloride and transferred to a 10% formalin neutral buffer solution.
The 2,3,5-triphenyltetrazolium chloride-stained sections, in which healthy tissue was stained red and infarcted tissue appeared white, were digitized with a scanner at a resolution of 300 dots per inch. The infarcted areas in each coronal section were manually traced by one of the authors (KH) by using an image analysis software package (SimplePCI Ver. 5.2; Hamamatsu Corporation, Sewickley, PA, USA), and the infarct volumes were calculated.
Perfusion-Weighted Magnetic Resonance Imaging Data Analysis
Postprocessing of the PWI data was performed using a free PWI analysis software package (Perfusion Mismatch Analyzer [PMA] Ver. 3.0.0.0; Acute Stroke Imaging Standardization Group-Japan; http://asist.umin.jp/index-e.htm). After automatic detection of the arterial input function and venous output function, classical and semiquantitative parametric maps were simultaneously generated. The latter were prepared using two types of deconvolution techniques, namely, standard singular value decomposition (sSVD) and block-circulant singular value decomposition (bSVD). Classical parametric maps of the following parameters were drawn: arrival time (AT), time to peak (TTP), mean transit time (MTT) calculated using the first moment (FM) method, cerebral blood flow (CBF) determined using the maximum slope method, and cerebral blood volume (CBV) calculated on the basis of area under the curve. Semiquantitative parametric maps generated using sSVD and bSVD included the following parameters: CBF determined as the peak value of residue function (
By using the software mentioned above, the volumes of the areas showing perfusion abnormalities were automatically measured after establishing a seed point within the lesion area, under different thresholds of the contralateral ratio, which ranged from 1 to 6 with intervals of 0.02 (300 steps) in the AT, TTP, MTT, and
Statistical Analyses
Pearson's correlation test was used to assess the correlation between infarct volume and the volume of areas with perfusion abnormalities, as measured using the appropriate threshold at which the average volume of the latter showed minimum difference from that of the former. Further, agreements between the values calculated above were determined by calculating the intraclass correlation coefficient (ICC). The correlation between the NDS value and hypoperfused volume of the PWI maps was also examined by Spearman's rank correlation test. The α level for all the analyses was 0.05.
Results
Baseline and follow-up MR images with sufficient image quality were successfully obtained for all the animals, and all the PWI data were readily analyzed by the Perfusion Mismatch Analyzer software.
The volumes of hyperintense areas on the follow-up axial and coronal DWI showed very high correlations and agreements (axial DWI:
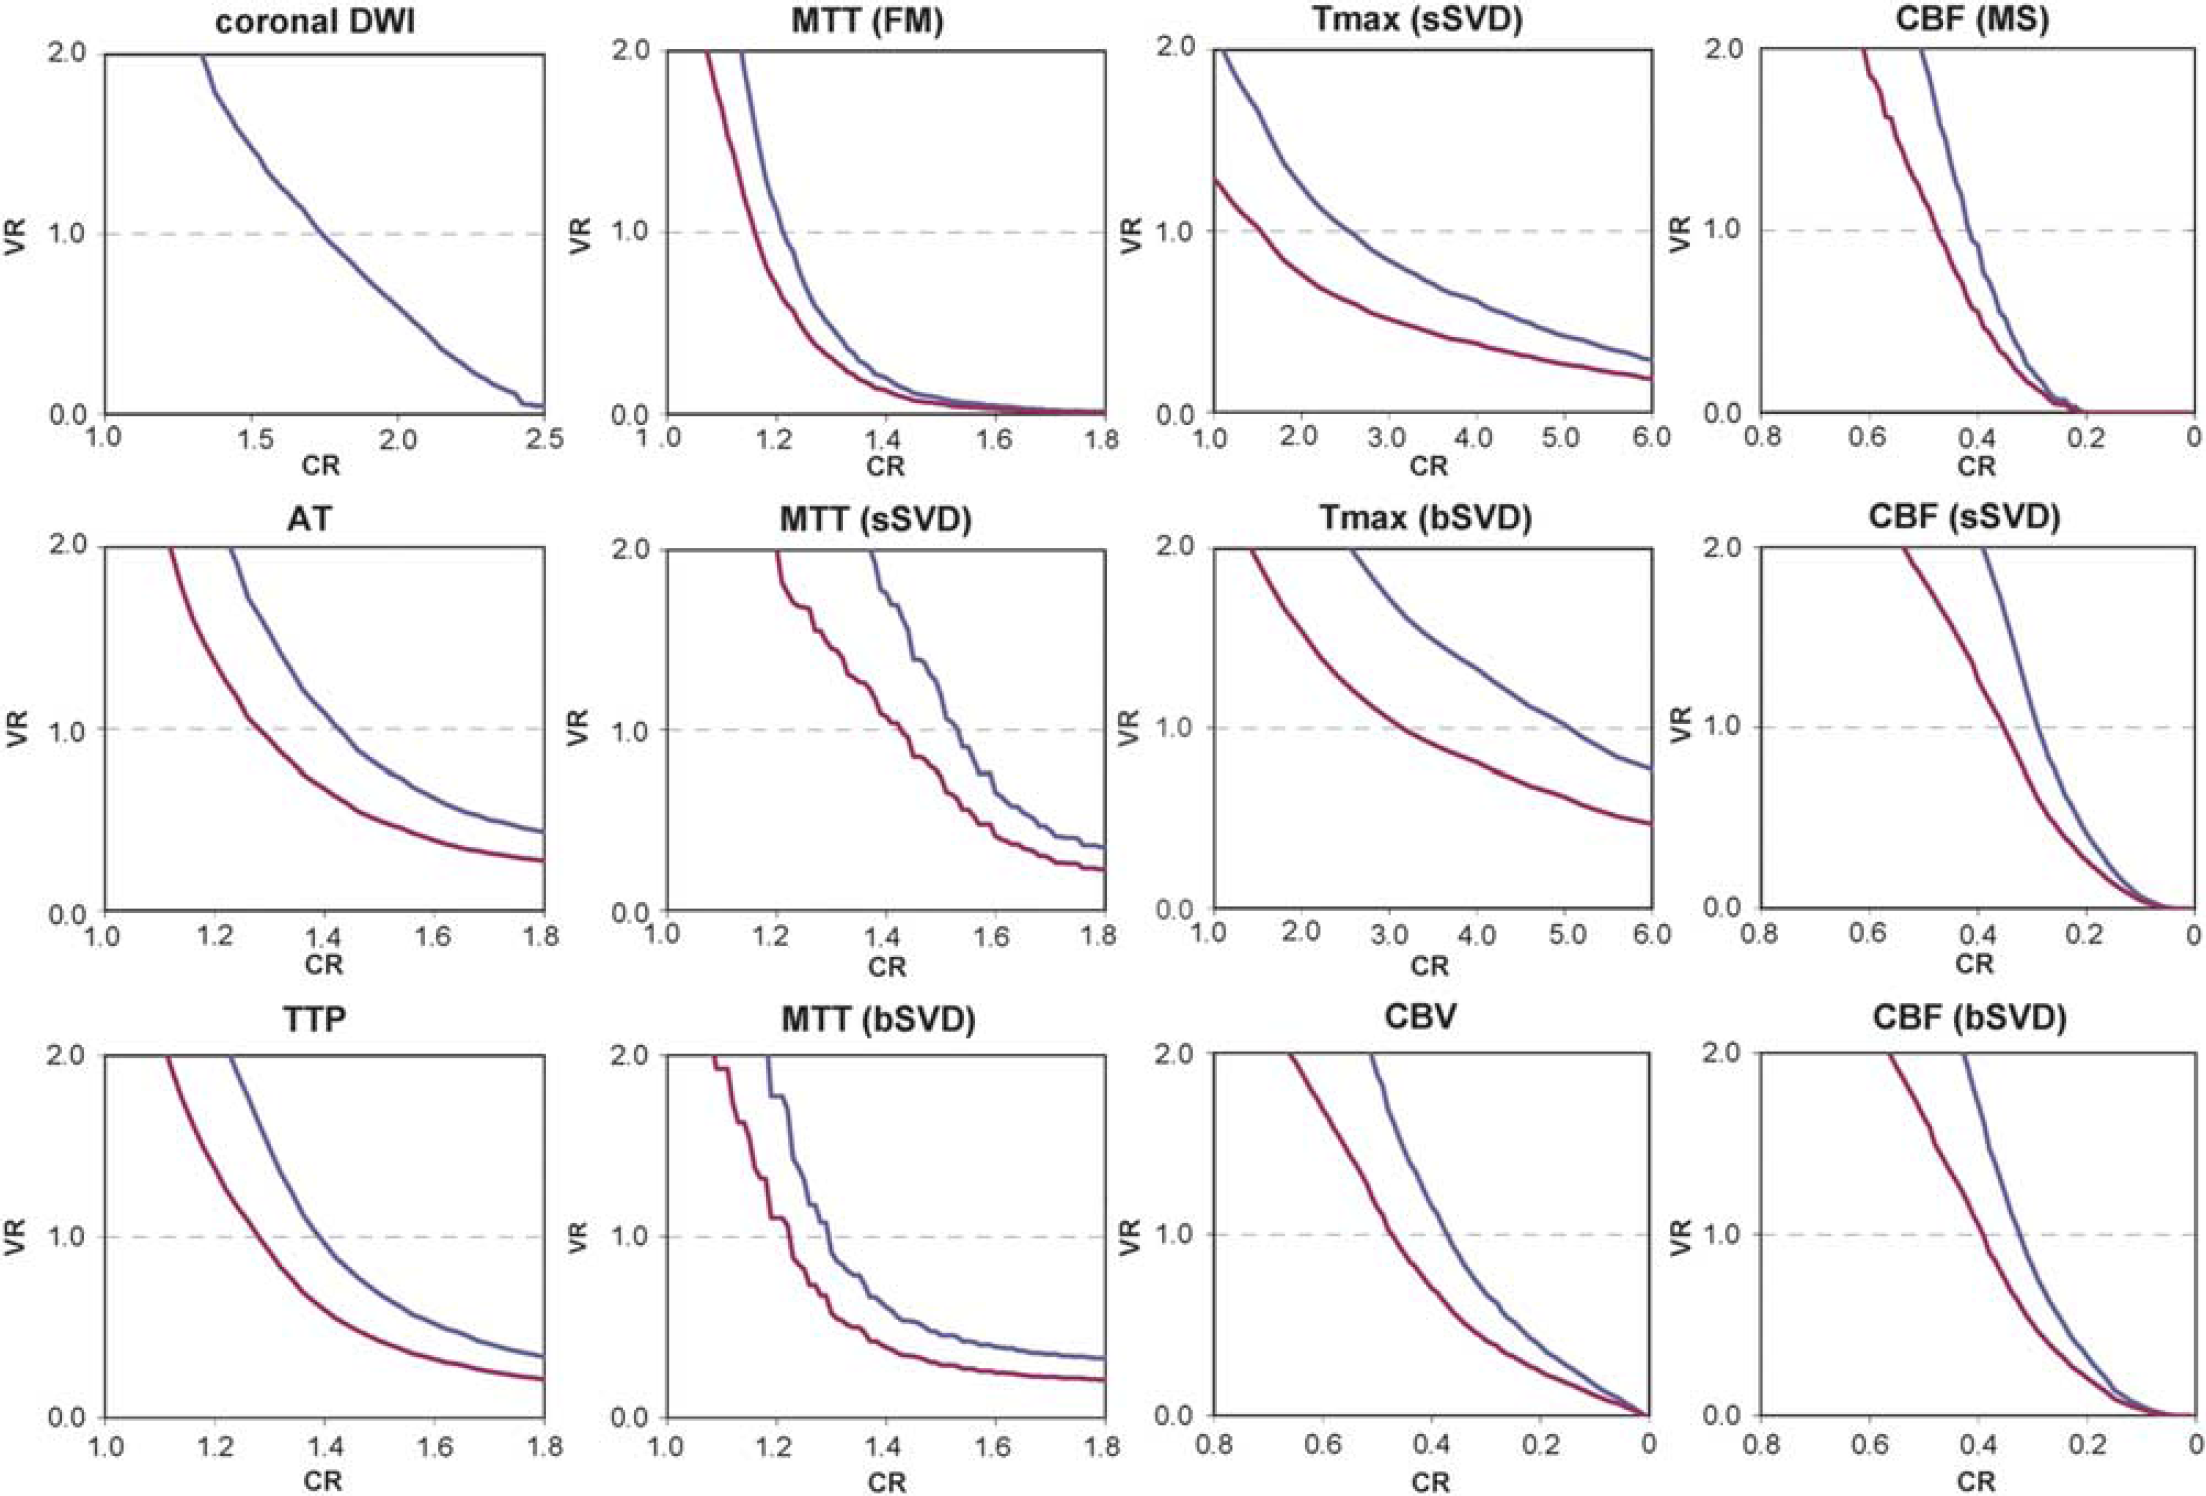
Determination of the optimum thresholds at which the average volume of the hypoperfused areas showed minimum difference from that of the infarct areas. CR represents contralateral ratio of the signal intensity of the hypoperfused area; VR represents average volume ratio of the hypoperfused area to the infarct area; blue lines represent VR against the specimen; and red lines represent VR against the axial diffusion-weighted imaging (DWI) with the threshold at a CR of 1.75. Optimum thresholds were determined at a VR of 1.0. AT, arrival time; bSVD, block-circulant singular value decomposition; CBF, cerebral blood flow; CBV, cerebral blood volume; FM, first moment; MTT, mean transit time; MS, maximum slope; sSVD, standard singular value decomposition;
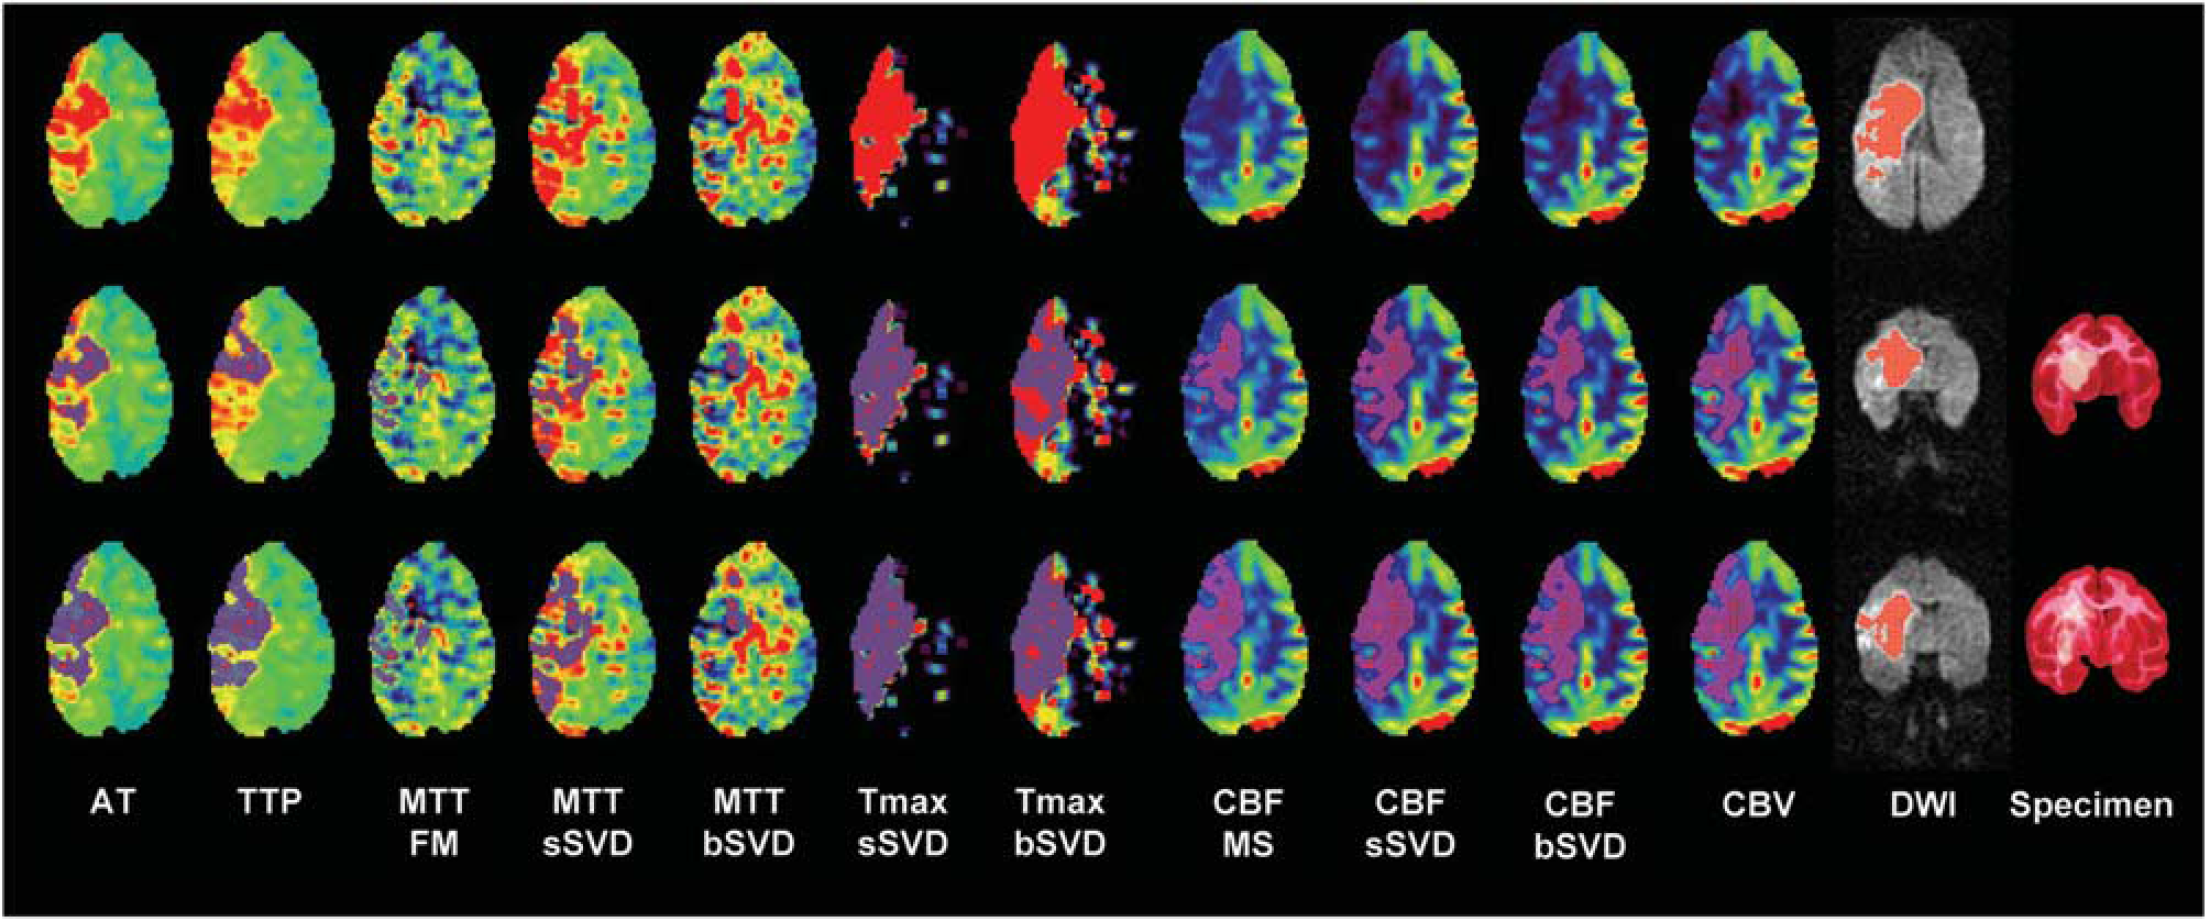
Multiparametric perfusion-weighted images, diffusion-weighted images, and macroscopic pathologic images (subject #1). Purple areas on perfusion-weighted magnetic resonance imaging (PWI) in the middle and lower rows: hypoperfused areas that were automatically determined using the threshold at which the average volume of the hypoperfused area showed minimum difference from that of the infarct areas on the specimen and axial diffusion-weighted imaging (DWI), respectively. Red areas on DWI represent abnormal signal areas that were automatically determined using the threshold at which the average volume of the abnormal area on coronal DWI showed minimum difference from that of the specimen. Hypoperfusion areas remarkably vary among various metrics of PWI. Those on the arrival time (AT), block-circulant singular value decomposition (bSVD)-time to maximum (
Infarct volumes and clinical outcomes in animals with permanent occlusion of unilateral MCA
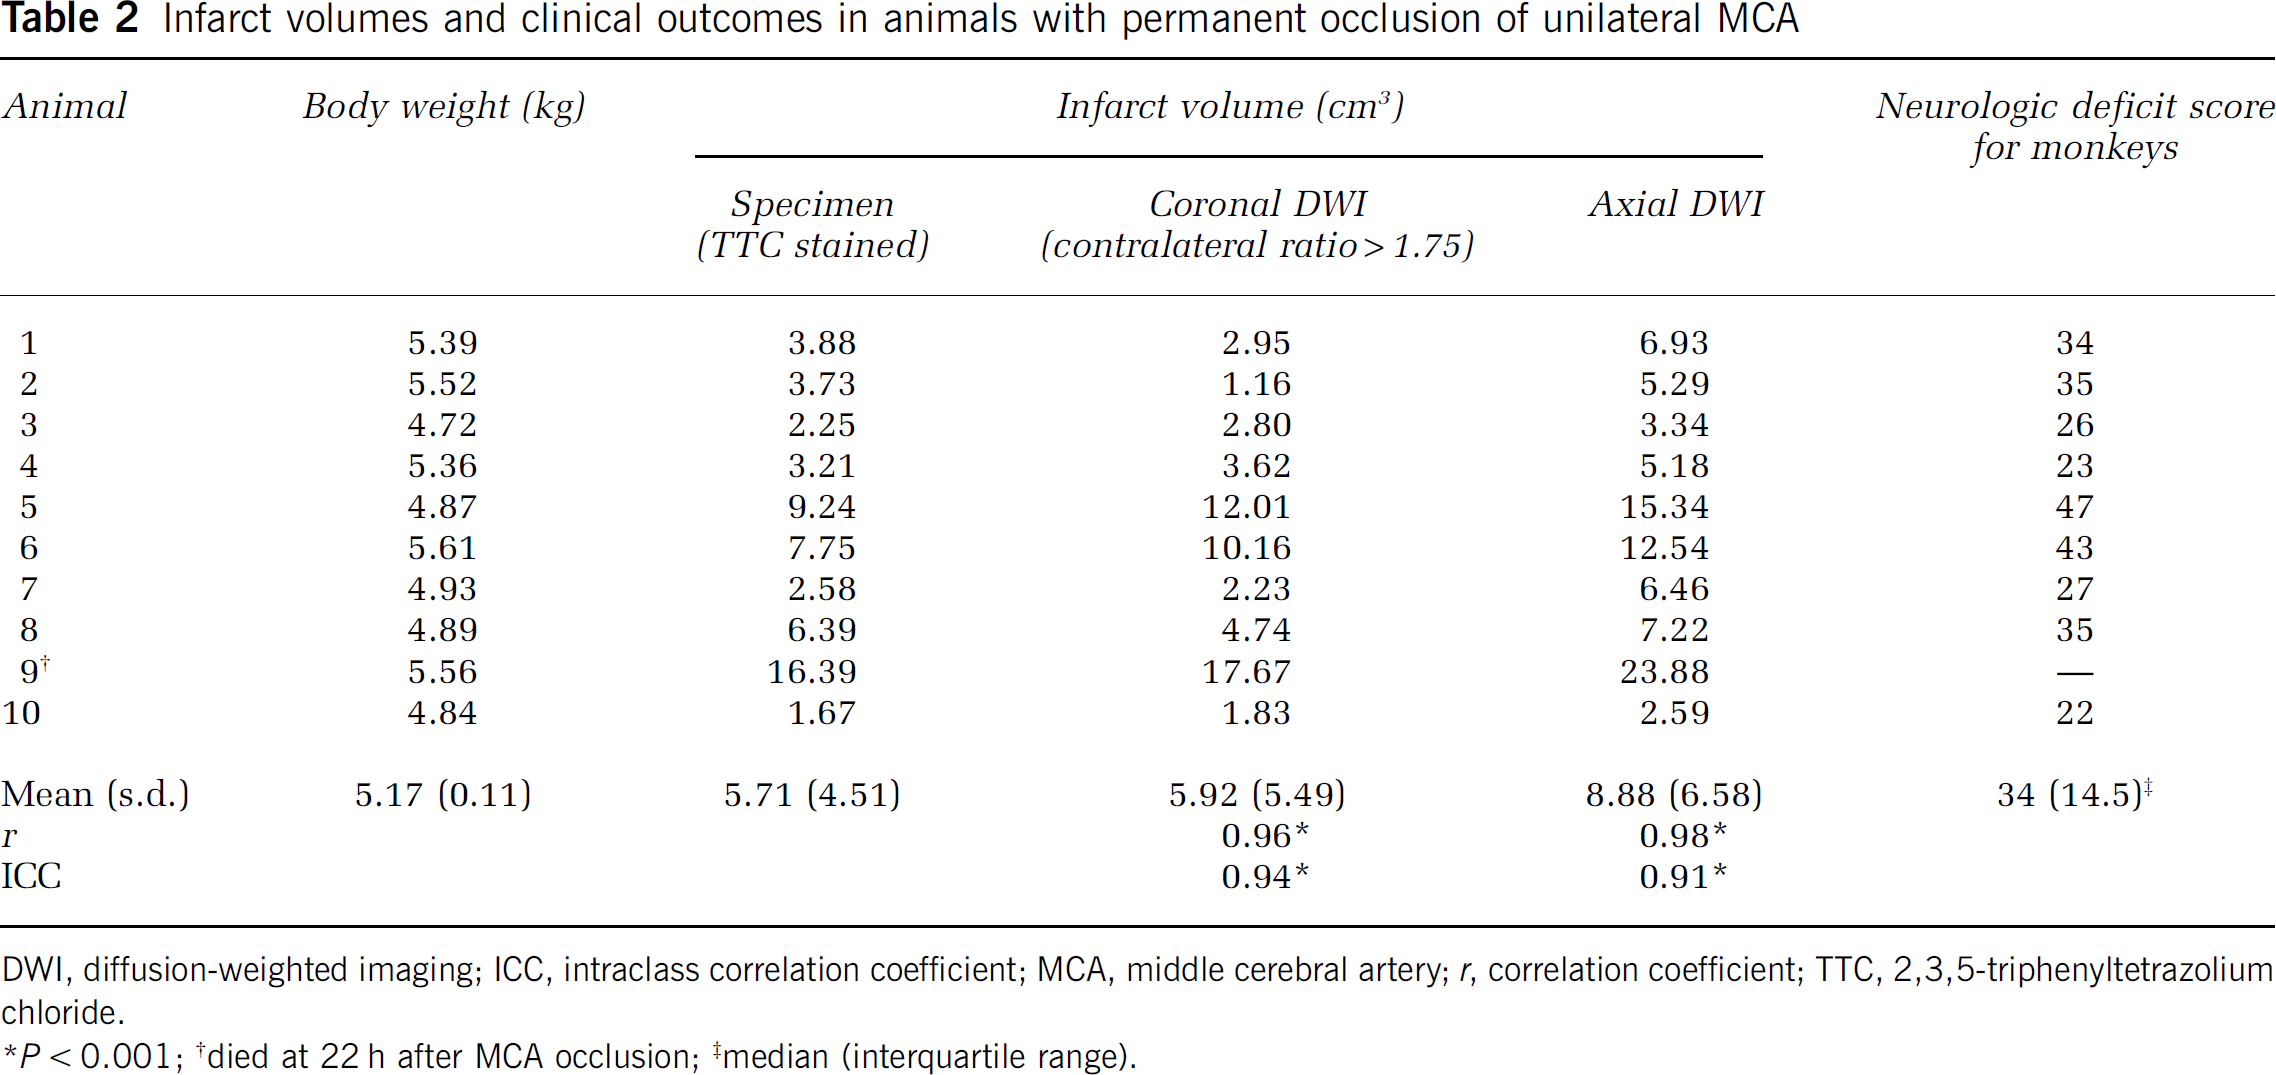
DWI, diffusion-weighted imaging; ICC, intraclass correlation coefficient; MCA, middle cerebral artery;
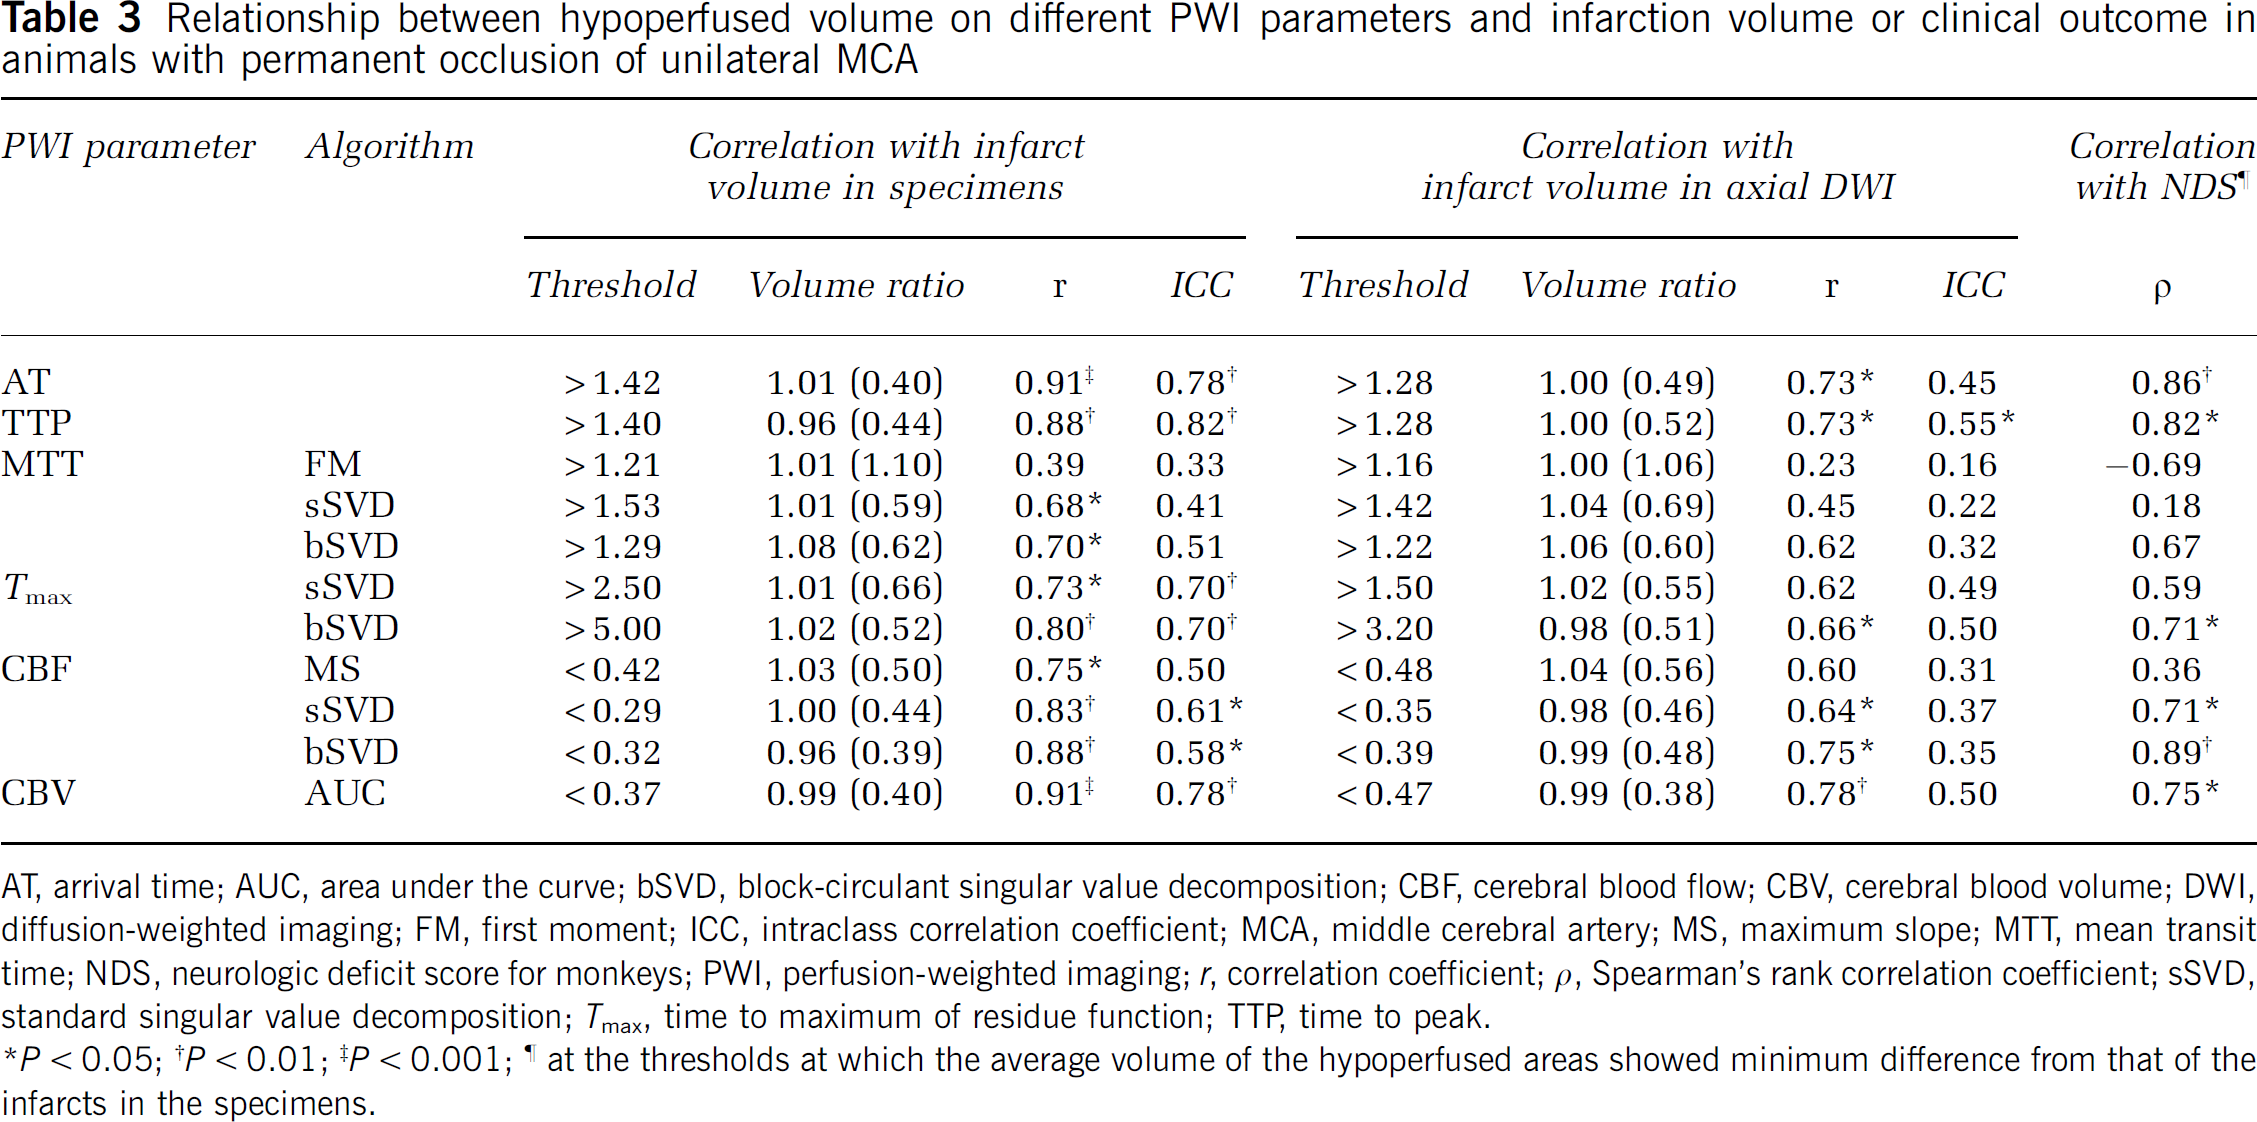
The volumes of the hypoperfused areas in the AT and CBV maps showed excellent correlations (
Relationship between hypoperfused volume on different PWI parameters and infarction volume or clinical outcome in animals with permanent occlusion of unilateral MCA
AT, arrival time; AUC, area under the curve; bSVD, block-circulant singular value decomposition; CBF, cerebral blood flow; CBV, cerebral blood volume; DWI, diffusion-weighted imaging; FM, first moment; ICC, intraclass correlation coefficient; MCA, middle cerebral artery; MS, maximum slope; MTT, mean transit time; NDS, neurologic deficit score for monkeys; PWI, perfusion-weighted imaging;
Further, the volumes of the hypoperfused areas in the AT, TTP, bSVD-
With regard to the neurologic outcome, the volumes of the hypoperfused areas in the AT and bSVD-CBF maps at the thresholds of minimum difference from the infarct volumes of specimens showed good correlations (
Discussion
The PWI can facilitate the generation of various parametric maps to evaluate cerebral perfusion abnormalities in patients with acute stroke. Earlier studies on thrombolytic therapies have adopted one or several parameters of classical parametric maps such as TTP, MTT calculated by the FM method, CBF determined by the maximum slope method, and CBV calculated on the basis of area under the curve as well as semiquantitative parametric maps such as MTT, CBF, and
In most studies that used PWI for evaluating perfusion abnormalities in acute stroke, hypoperfused areas were visually identified on the basis of color or gray-scale maps without setting any thresholds. Further, recent multicenter trials adopted an ‘eye-balling’ method to determine the presence of a > 20% PWI-DWI mismatch and accepted the use of any of PWI parameters (Hacke et al, 2005, 2009; Furlan et al, 2006); this decision presumably caused substantial discrepancies among the findings of different institutes, and the indications for thrombolytic therapy were thus unclear. Several studies have performed quantitative assessments by using certain thresholds. Recent trials conducted using
In this study, we used a primate model of permanent M1 occlusion instead of patients with acute stroke to avoid intersubject variations in hemodynamics and recanalization and to elucidate susceptibility to errors caused by tracer delay and dispersion effects that are reported to be profound under conditions of major artery occlusion (Calamante et al, 2000). Reperfusion therapy is strongly indicated for acute stroke because of embolic occlusion of the MCA, because early reperfusion has the potential to salvage extensive brain tissues, including several eloquent areas, and to prevent severe neurologic impairments such as hemiplegia and aphasia. However, large intersubject variations in collateral circulation and cerebrovascular reactivity exist under the condition of MCA occlusion and can cause considerable variation in estimating the severity of ischemia, final infarct size, and neurologic outcome. In addition, this condition can produce negligible errors in PWI, usually overestimation of the severity, extent, or both of hypoperfusion, because of tracer delay and dispersion effects because of collateral circulation (Ibaragi et al, 2005). Hence, it is crucial to determine the combination of the parameter, algorithm, and threshold that can most accurately predict the final infarct size and neurologic outcome under the condition of permanent MCA occlusion, because this combination is assumed to be capable of identifying the outer border of the penumbral area in acute stroke.
In this study, the correlations and agreements of the volumes of hypoperfused areas with the infarct volumes and neurologic outcomes remarkably differed with the different PWI parameters and algorithms, despite the strict application of the thresholds optimized using our automated optimization technique. In contrast to earlier observations of acute stroke patients by using PWI (Butcher et al, 2005; Takasawa et al, 2008) or perfusion CT (Wintermark et al, 2006), the volumes of the hypoperfused areas in the AT and CBV maps, which are known to over- and underestimate the final infarct volume, respectively, showed the strongest correlations and agreements with the infarct volumes in the specimens, followed by the TTP, Tmax, and deconvolution-CBF maps. Further, poor or fair correlations and agreements were observed in the case of the MTT calculated using the deconvolution and nondeconvolution methods and the nondeconvolution CBF, although these parameters are believed to be considerably reliable (Takasawa et al, 2008; Wintermark et al, 2006). In addition, the correlations between the volumes of the hypoperfused areas and values of NDS showed the same tendencies as those of the aforementioned correlations. These results suggest that the parameters that accurately visualize penumbral areas and predict final infarct size and neurologic outcome under optimized threshold settings were not identical to those that were considered appropriate on visual examination. The AT, CBV, and TTP, and probably
Regarding the difference in the algorithms for calculating MTT, CBF, and Tmax, the deconvolution algorithms showed stronger correlations and agreements between the volumes of the hypoperfused areas and those of the infarcts than the nondeconvolution algorithms. Further, bSVD showed stronger correlations and agreements than sSVD. These results suggest that deconvolution algorithms are more reliable than nondeconvolution algorithms, and that bSVD is more accurate than sSVD, as reported earlier (Ostergaard et al, 1996
This study had some limitations. First, the planes used for PWI and specimen preparation differed. Templates for dissection of the primate are provided only for coronal sections, whereas PWI should be performed on axial sections. This limitation may have produced substantial errors on analyses, although the volumes of the infarcts in the coronal specimens showed excellent correlations and agreements with the volumes measured using both coronal and axial follow-up DWI. Second, the volumes of the infarcts in the specimens and on DWI were calculated 2 days after MCA occlusion as it is difficult for our primate model to survive for > 3 to 5 days owing to the risk of brain herniation because of the limited intracranial space. In fact, one monkey died before 24 hours. Although a recent report has shown that DWI findings at 3 to 5 days after onset may be a surrogate marker for the final infarct volume (Lu et al, 2005), the final infarct volume is usually assessed by MRI at ≥ 30 days after onset (Gaudinski et al, 2008). Hence, the calculation of the volumes of the infarcts in the specimens and on DWI at 2 days after onset in this study includes some potential biases caused by infarct evolution after 2 days. The relatively low correlations between the volume of the hypoperfused area on PWI and lesion volume on DWI in this study can be attributed to the fact that lesions on DWI at 2 days after the occlusion cannot directly indicate the infarct volume, although we confirmed strong correlations between the lesion volume on DWI and the infarct volume on the specimens. Third, the number of the subjects was small, and subjects with recanalization and those with occlusions at various locations were not examined. The permanent proximal M1 occlusion that we performed only represents a small subgroup of the ischemic stroke cases, and provides wide ischemic areas such that any perfusion parameters would detect any correlation. Fourth, the time resolution of PWI that we used was relatively low because of a limited hardware performance, which may impede the accuracies of perfusion parameters in the monkeys in which transit time of the tracer within the brain is shorter than in the human subjects. Finally, the thresholds in this study cannot be directly applied for the evaluation of perfusion abnormalities in patients with acute stroke. The thresholds applied in this study were determined using the contralateral ratio and considerably differed from the thresholds used in earlier studies on acute stroke patients (Shih et al, 2003; Sobesky et al, 2004; Butcher et al, 2005; Bandera et al, 2006; Takasawa et al, 2008; Olivot et al, 2009). To determine the optimum parameter, algorithm, and threshold for predicting the final infarct volume in patients with acute stroke, further studies using patient data and the postprocessing technique introduced by us are needed.
In conclusion, this study showed that AT and CBV as well as TTP,
Footnotes
MS is a consultant for Mitsubishi Tanabe Pharma.