
Abstract
Blood oxygen level dependent (BOLD) functional magnetic resonance imaging (fMRI) has been widely used to investigate spontaneous low-frequency signal fluctuations across brain resting state networks. However, BOLD only provides relative measures of signal fluctuations. Arterial Spin Labeling (ASL) MRI holds great potential for quantitative measurements of resting state network fluctuations. This study systematically quantified signal fluctuations of the large-scale resting state networks using ASL data from 20 healthy volunteers by separating them from global signal fluctuations and fluctuations caused by residual noise. Global ASL signal fluctuation was 7.59% ± 1.47% relative to the ASL baseline perfusion. Fluctuations of seven detected resting state networks vary from 2.96% ± 0.93% to 6.71% ± 2.35%. Fluctuations of networks and residual noise were 6.05% ± 1.18% and 6.78% ± 1.16% using 4-mm resolution ASL data applied with Gaussian smoothing kernel of 6mm. However, network fluctuations were reduced by 7.77% ± 1.56% while residual noise fluctuation was markedly reduced by 39.75% ± 2.90% when smoothing kernel of 12 mm was applied to the ASL data. Therefore, global and network fluctuations are the dominant structured noise sources in ASL data. Quantitative measurements of resting state networks may enable improved noise reduction and provide insights into the function of healthy and diseased brain.
Keywords
Introduction
Brain neurons are constantly active with a high level of activity even when the person is not engaged in a focused mental task, i.e. during the resting state. Brain baseline neural activity at rest consumes 80% of neuronal energy metabolism in the cerebral cortex.1,2 Spontaneous low frequency (<0.1 Hz) fluctuations in this baseline energy metabolism have been observed to be temporally correlated across distinct brain resting state networks, including left and right sensorimotor areas, visual, auditory, ventral attention, and default mode networks (DMN) (see a review 3 ). Quantification of these neural activities, baseline neural activity, and fluctuations of the regional networks, can provide crucial information to help understand the function of normal resting brain and pathophysiological alterations caused by brain disease. Quantification may also help constrain models of neuron and network correlations and how they contribute to organized network activity.4,5
Resting state network studies have almost exclusively used blood oxygenation level-dependent (BOLD) functional magnetic resonance imaging (fMRI) to detect spontaneous fluctuations. BOLD signal fluctuations, however, result from a complex combination of cerebral blood volume, cerebral blood flow (CBF), and cerebral metabolic rate of oxygen (CMRO2),6,7 and thus reflect a rather indirect measurement of neural activity. Consequently, BOLD fluctuations are quantified in relative or statistical units without simple relationship to physiology. Thus, alternate measurement techniques with the potential to provide more direct and quantitative measures of neural functional activity would be beneficial.
Another functional MRI technique, Arterial Spin Labeling (ASL),8,9 can provide quantitative measurement of CBF. ASL uses endogenous water in the blood as its tracer and therefore does not require any exogenous injection. ASL acquires image pairs made up of a labeled image, in which the inflowing blood is magnetically labeled using radiofrequency (RF) pulses and magnetic field gradients, and a control image without labeled blood. CBF can be calculated from the difference of those two images, which reflects only the labeled blood present in the images. Therefore, ASL can provide quantitative measurement of CBF, which is a direct measure of brain physiology. 6 In addition, it offers a more direct approach to measure neural activity than BOLD due to the close coupling of neural activity and CBF.6,10
ASL has demonstrated its ability to detect resting state functional networks,11–17 first in a sensorimotor network using seed-based analysis and later mapping large-scale networks using independent component analysis (ICA). Our ASL preliminary resting state studies have also been reported in abstract forms.18,19 Because ASL perfusion measurements are quantitative, the amplitude of the signal fluctuations can be quantified. Two groups have made first steps toward quantification of resting state perfusion fluctuations.14,20 One group studied only a few slices in the sensorimotor cortex and quantified the average regional perfusion fluctuation amplitude for the motor area. The other group used volumetric perfusion acquisition to compare BOLD and ASL networks and reported a quantity derived from the power spectrum of fluctuations, termed the amplitude of low frequency fluctuations (ALFF) for several resting state networks. Although both groups filtered out noise outside a specific frequency range, they did not use regression or ICA to extract the correlated noise component. So their resting state network(s) still contain signal fluctuations caused by non-neural systematic artifacts, and signal fluctuations from random white noise. Moreover, global signal fluctuations, i.e. fluctuations of ubiquitously correlated signals across the whole cortical gray matter, are large and should be carefully studied and removed as part of a focused quantitative study of network fluctuations.
Herein, we quantify the signal fluctuations of the large-scale resting state networks by separating the global signal fluctuations and signal fluctuation from random white noise, and evaluate the impact of the fluctuating noise sources on ASL perfusion reliability at different spatial scales. We begin by separating the resting state functional networks of ASL (compared with BOLD data to ensure the extraction of resting state networks is consistent with the large BOLD literature) using ICA. An analytical method is then introduced based on ASL data to generate quantitative signal fluctuation maps for the resting state networks using the inverse transformation of ICA. Finally, we demonstrate that network fluctuations become the dominant source of noise in ASL resting CBF measurements at the lower spatial resolution typically introduced by smoothing and clustering analyses used for multi-subject studies.
Methods
ASL imaging
Pseudo-continuous arterial spin labeling (pCASL) was used for the labeling 21 to take advantage of its high efficiency and increased signal-to-noise ratio (SNR). 22 This technique employs repeated RF and gradient pulses to achieve continuous labeling but with a lower RF duty cycle compatible with the pulsed RF amplifiers used on most human scanners. We used RF pulse and gradient parameters similar to our previous paper 21 except that the labeling duration and post-labeling delay were 2 s and 1.8 s, respectively. Unlike the previous ASL studies, a longer delay after labeling (1.8 s) and vessel suppression 23 were applied to minimize intravascular contamination, improve quantification, and avoid compromised signal-noise-ratio (SNR) in the regions with longer arterial transit time such as posterior borderzone regions.
ASL perfusion images were acquired with a 3D stack of spirals Rapid Acquisition with Refocused Echoes (RARE) imaging sequence with 40 slices of 4 mm thickness. Each acquisition was performed with three spiral interleaves and alternation between label and control images, producing a resolution of 3.64 mm. The repetition time (TR) of each ASL acquisition was 5 s. The spin-echo-based 3D volumetric imaging method, 24 unlike the echo planar imaging (EPI) frequently used for BOLD fMRI, allows high-quality imaging of regions of the brain near the base of the brain where magnetic fields are less uniform.
Background suppression was also used to minimize the contamination from unstable background tissue signal. 25 In addition to minimizing motion-induced noise, background suppression also suppresses residual blood oxygenation contamination of the ASL images because BOLD signal modulation is a fixed percentage of the background. To minimize background, and hence the blood oxygen signal, we used the algorithm in Maleki et al. 26 and Dai et al. 27 to determine the optimal pulse timing but with the target magnetization of CSF and fat set to zero and that of gray and white matter set to 0.3%. The maximum allowed preparation time was set at 3.8 s, chosen to fit the 2 s of labeling duration and 1.8 s of post-labeling delay. The resulting optimal pulse timings for designated target magnetizations consisted of a saturation pulse at 3800 ms and four inversion pulses at 3023, 1648, 637, and 137 ms before the defined imaging time of 0. The background suppression pulse at 3023 ms fell within the ASL labeling period and therefore the pulse was interleaved with the labeling pulses. 28 A selective pulse that saturates the water protons inferior to the labeling plane was applied 287 ms before image acquisition to suppress inferior signals and avoid the inflow of unsuppressed and unlabeled blood into the imaged volume.
In vivo measurements
Twenty healthy subjects (8 females/12 males, 22–38 years old 30.3 ± 4.6) were recruited and studied following a human subjects protocol approved by the institutional review board of Beth Israel Deaconess Medical Center. All subjects gave written consent prior to participation. All volunteers were imaged on a 3 Tesla HDxt (GE Healthcare, Waukesha, WI, USA) scanner using an 8-channel head coil receive array and the body coil for transmission. Each subject was scanned following an identical protocol.
The scan began with a three-plane localizer to define the anatomy of interest. Axial T1-weighted magnetization prepared rapid gradient echo (MPRAGE) images covering the whole brain were acquired in 3 min 58 s (96 slices with Matrix: 192 × 192; thickness: 2.0 mm, TE: min Full, TR: 25 ms, TI: 1100 ms, FOV: 24 cm, rBW: 31.25 kHz).
Next, the resting-state pCASL acquisition and BOLD acquisition were performed. Subjects were instructed at the beginning of pCASL and BOLD acquisitions to keep eyes closed and try not to fall into asleep. For resting-state PCASL, a 3D volume from a location between the base of the cerebellum and the fourth ventricle to above the top of the head was prescribed. The labeling plane was automatically placed 16 mm below this volume by the pulse sequence software. PCASL labeling and imaging parameters were described above. For each of the three spiral interleaves, control and label images were acquired consecutively, and therefore each 3-D ASL image acquisition required 6 TRs (totaling 30 s). Forty 3D ASL volumes were collected in 20 min and 31 s.
For resting-state BOLD, 28 axial slices with a thickness of 4 mm, a gap of 1 mm, field-of-view of 24 cm and a matrix size of 64 × 64 covering the whole brain were obtained using gradient-echo EPI with TR = 2 s and TE = 25 ms. Three hundred BOLD image volumes were collected in 10 min and 4 s.
Image analysis
All the ASL data were reconstructed by a custom IDL reconstruction routine using a standard regridding algorithm and converted into 4D Nifti format for subsequent analysis. The first ASL volume was discarded to avoid non-steady state magnetization. For the BOLD data, a 4D BOLD volume was formed in Nifti format from 300 (number of volumes acquired) × 28 (number of slices in each volume) DICOM images.
The 4D ASL and BOLD volumes were registered to the standard Montreal Neurological Institute (MNI) template space using SPM8 algorithms. Each 4D ASL and BOLD volume was first motion corrected. Structural T1-weighted MPRAGE images were used to allow for better registration to standard space. First, T1 images were registered to the mean ASL and BOLD images after motion correction, then they were segmented and the resulting gray matter maps were used to determine the best transformation to the standard space. The resulting transformation parameters were then used to transform the BOLD and ASL volumes.
In order to establish the quality of our network identification and consistency with the literature, we first used MELODIC (Multivariate Exploratory Linear Decomposition into Independent Components, part of FSL, www.fmrib.ox.ac.uk/fsl), a widely used statistical method for extracting resting state networks. The high-pass filtering with a cutoff frequency of 0.01 Hz (100 s) was applied to the BOLD data but not the ASL data because BOLD data are susceptible to low frequency confounds such as scanner drift while ASL data are not. Automatic dimension estimation in MELODIC was not reliable for both ASL and BOLD data. Instead, we chose to investigate the effects of the number of dimension on the extracted resting state networks. The number of independent components investigated was 10, 15 and 20 for both ASL and BOLD data. We fixed the number of independent components to 15 and 20 for ASL and BOLD, respectively, for further fluctuation quantifications because the numbers were sufficient to extract the major networks observed in prior studies while avoiding a large number of spurious components.
Global signal fluctuations
The global component of BOLD signal fluctuations is frequently removed before extracting resting state networks. However, it has been shown to be tightly coupled with a slow modulation of neuronal activity. 29 Therefore, global ASL signal fluctuations were quantified and characterized. Global ASL signal fluctuation was calculated for each subject from global ASL signal time series. Global ASL signal at each time point was calculated as the mean of the registered ASL difference map averaged over the brain voxels defined by the SPM8 whole brain mask. The global signal fluctuation for each subject was calculated as the temporal standard deviation of global ASL signals. The global signal fluctuation percentage for each subject was calculated as the ratio of the global signal fluctuation to its baseline perfusion, which was obtained as the temporal mean of global ASL signals. To evaluate the spatial distribution of the global signal fluctuation, a similarity map was calculated as the dot product of the global ASL signal time series and voxel signal time series. The similarity map was calculated, instead of a Pearson correlation map, to better visualize the spatial distribution across the gray matter and avoid the amplified noise from low SNR regions such as white matter.
Fluctuation quantification for resting state networks
As is common for resting state analysis software, it is difficult to convert from the resting state independent components (ICs) to the corresponding perfusion signals using MELODIC. To overcome this software limitation, we implemented a custom analysis using an open access ICA program (http://www.cnl.salk.edu/∼tony/) employing the infomax algorithm30,31 that extracted resting state ICs which are very similar to those obtained using MELODIC (data not shown). We calculated the fluctuations of perfusion associated with the different resting state ICs determined by the infomax algorithm. The detailed steps for quantifying fluctuations were as follows.
The ASL data were first preprocessed and input into the infomax program to separate the resting state ICs: the ASL volume time series of each subject was spatially smoothed with a 6-mm Gaussian kernel and resampled to 4 mm resolution using FSL commands. To separate the fluctuations of the resting state networks from global signal fluctuations, global signal fluctuations were removed from time series of each subject. To remove the global signal fluctuations of each subject, we scaled the mean whole-brain perfusion of the subject (acquired at different time points) to a fixed constant to ensure each 3D volume of each subject had the same mean perfusion value. This proportional scaling is referred to as global normalization in most of the image processing literature and also in this paper. The fixed constant will be referred to as the whole-brain global ASL signal. The scaled perfusion volumes after global normalization were then demeaned by subtracting the mean signal over time at each voxel.
The inverse ICA infomax algorithm (as described in Appendix) was then used to perform the exact steps to convert each IC back to the perfusion signals (time × space) corresponding to the IC. This process yields a set of ICs, each with a spatial map corresponding to the relative contribution of each voxel to the IC, and an associated ASL perfusion signal time series. The IC’s ASL perfusion signal time course is a matrix with two dimensions: temporal dimension formed by a concatenation of all the individual subject time courses, and spatial dimension formed by all the voxels in 3D space. We extracted the individual subject time course so a per-subject IC fluctuation map could be generated. For a given subject and IC, the fluctuation map was calculated as the standard deviation of the perfusion time series for that subject at all the voxels in 3D space (see Appendix for the perfusion time series corresponding to each subject). A mean ASL image was calculated on a per-subject basis by averaging the ASL images over the time series. The per subject fluctuation map was then divided by the mean ASL image for the subject to produce a per subject relative fluctuation map.
Fluctuations of resting state networks were our primary interest and hence only the ICs representing recognized resting state networks were evaluated further. For each subject, regional fluctuations of each resting state network were evaluated as the regional mean of the above generated relative fluctuation map associated with the network. Specifically, the regional fluctuations for the network were calculated by averaging the relative fluctuation map over the binary resting state network mask. Binary resting state network masks were generated by assigning 1 to those voxels with amplitude in the corresponding IC spatial map above a fixed threshold in the unmixed space. The threshold was chosen to ensure the generated binary masks delineated the bright spots of the resting state networks (the yellow-color regions shown in Figure 1). Paired t-tests were used to compare the regional fluctuation differences between different networks.
Group-level resting-state networks extracted from ASL data (left) and BOLD data (right).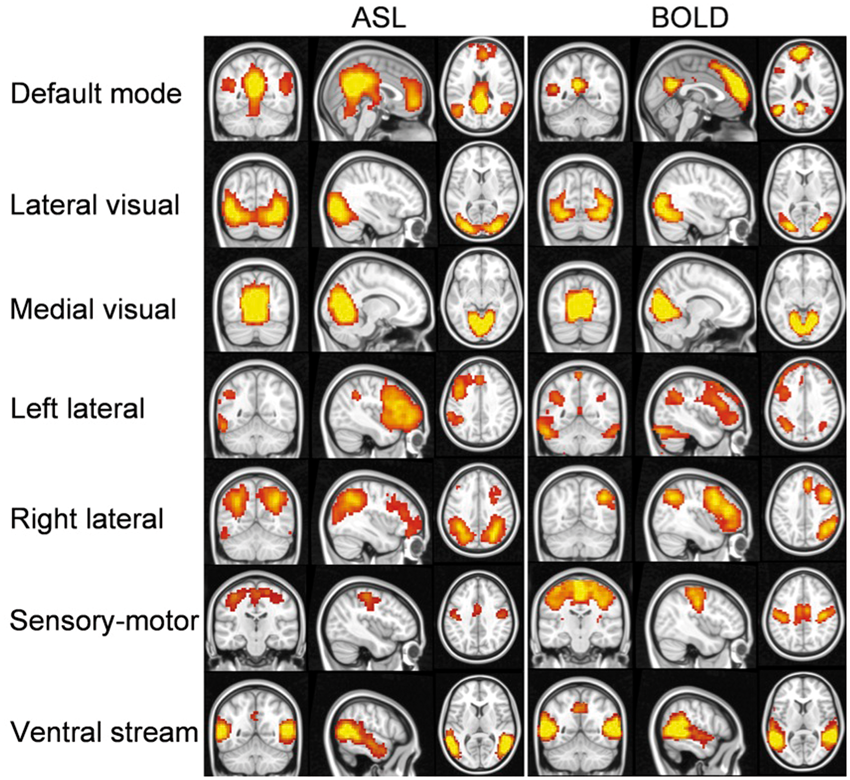
Separation of network perfusion signal fluctuations from residual noise
Besides the ASL signal fluctuations from the ICs attributed to brain networks, there exist some residual signals that are not explained by the ICs, which we refer to as residual noise in this paper. The residual noise R can be calculated by subtracting the perfusion signal from the networks,
To evaluate the characteristics of the two signal fluctuation sources and potential approaches to reduce them, the effects of image smoothing on the two noise sources were investigated. Instead of a smoothing kernel of 6 mm, a smoothing kernel of 12 mm was applied to the original ASL data and ICA was performed separately after the smoothing to compare the difference between the two derived signal fluctuations. The relative fluctuation maps were calculated as a ratio of the fluctuation maps to the mean perfusion map on a subject basis. For each subject, fluctuations of the ASL signal model and residual noise within gray matter were calculated by averaging the relative fluctuation maps over the gray matter mask. The gray matter mask was generated as a binary mask from the SPM8 gray matter probability template with those voxels whose probabilities are above 60%. Paired t tests were used to compare the difference in fluctuations between the networks and residual noise from the ASL data using 6 mm smoothing, between the network fluctuations using 6 mm smoothing and 12 mm smoothing, and between residual noise using 6 mm smoothing and 12 mm smoothing.
Results
Comparison of ICs extracted using ASL and BOLD data
Independent components (ICs) extracted from independent component analysis (ICA) using ASL and BOLD data from the same 20 subjects.
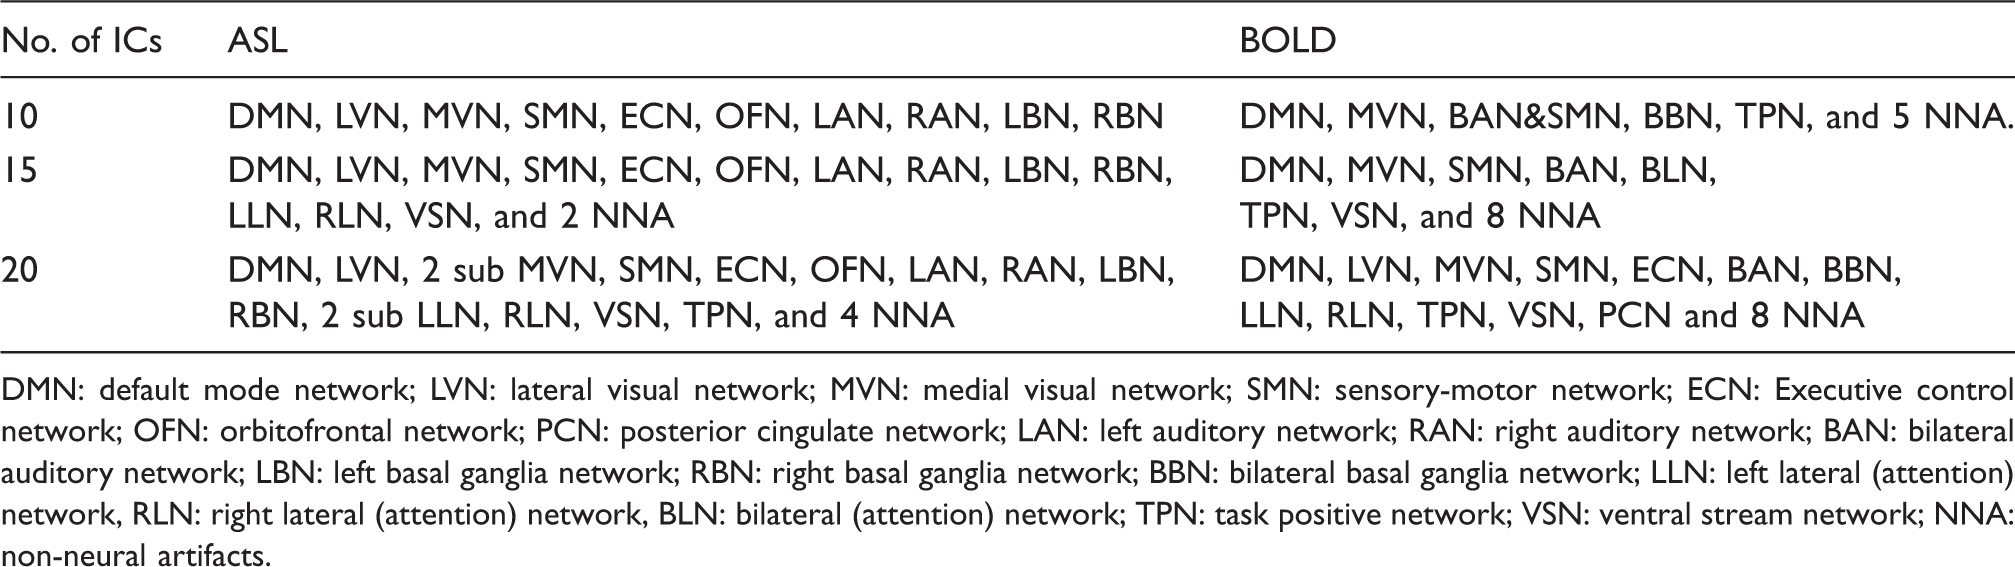
DMN: default mode network; LVN: lateral visual network; MVN: medial visual network; SMN: sensory-motor network; ECN: Executive control network; OFN: orbitofrontal network; PCN: posterior cingulate network; LAN: left auditory network; RAN: right auditory network; BAN: bilateral auditory network; LBN: left basal ganglia network; RBN: right basal ganglia network; BBN: bilateral basal ganglia network; LLN: left lateral (attention) network, RLN: right lateral (attention) network, BLN: bilateral (attention) network; TPN: task positive network; VSN: ventral stream network; NNA: non-neural artifacts.
Resting state networks from ASL data
Resting state ASL data extracted similar resting state networks (Figure 1) to those reported in previous BOLD studies.32–34 The resting state networks derived from the BOLD data obtained in the same subjects are also shown for comparison. The major resting state networks, including default mode, lateral visual, medial visual, left lateral, right lateral, sensory-motor, ventral stream, and auditory networks were all detected from ASL data.
Quantifying fluctuations of global ASL signals
Globally correlated signals were readily detected with ASL and fluctuation of global signal was fairly large. The global average fluctuations of ASL signals measured at rest showed fairly uniform correlation across the entire cerebral cortex (Figure 2), supporting their identification as global fluctuations. Global ASL signal fluctuation amplitude relative to the ASL baseline perfusion was 7.59% ± 1.47% averaged over 20 subjects.
Mean similarity map of global ASL signal fluctuations and the voxels from the entire brain. Mean similarity map was averaged across all the subjects. The global fluctuations of ASL signals measured at rest showed fairly uniform similarity with the entirety of cerebral cortical gray matter.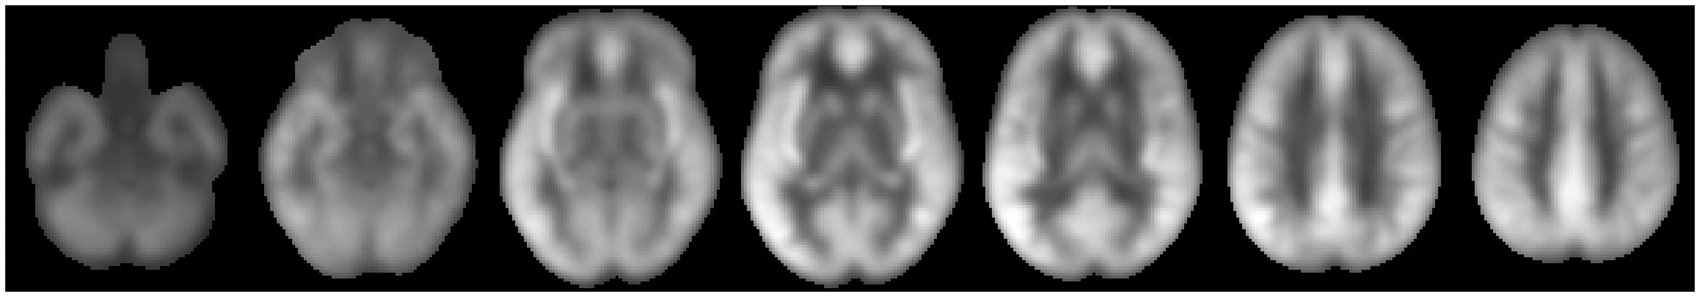
Quantifying fluctuations of resting state networks
Regional fluctuations of resting state networks (relative to mean perfusion signal).

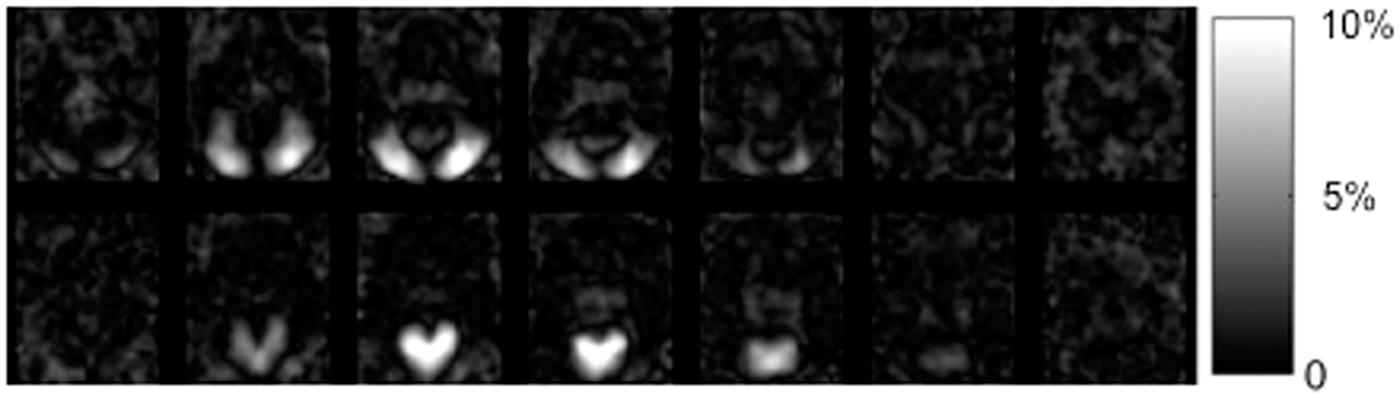
Perfusion signal fluctuation maps from the lateral visual, top, and medial visual networks, bottom, relative to the mean global perfusion.
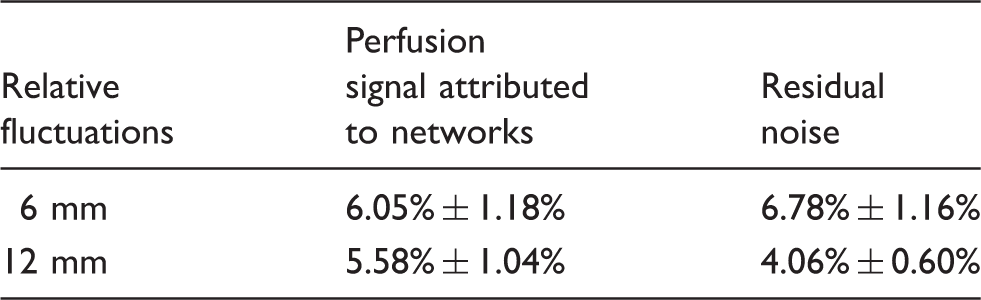
Effects of different Gaussian smoothing kernel width on gray matter fluctuations from IC-derived networks and residual noise (relative to mean perfusion signal).
Separation of perfusion signal fluctuations from networks and residual noise
Fluctuations from the ICs (i.e. networks) are the dominant noise sources for statistical analysis of ASL data applied with typical smoothing kernels (e.g. Gaussian kernel FWHM of 12mm). The perfusion signal fluctuation maps attributed to networks and residual noise for the ASL data using a Gaussian smoothing kernel FWHM of 6 mm are compared to those using Gaussian kernel FWHM of 12 mm in Figure 4. The fluctuation maps from the ICA-derived networks did not show visually detectable changes with different smoothing kernels, while fluctuation maps of residual noise show much reduced signal intensity with larger smoothing kernel.
The mean perfusion map, the map of perfusion signal fluctuations from networks extracted by ICA, and the fluctuation map of residual noise from the ASL data using a Gaussian smoothing kernel FWHM of (a–c) 6 mm and (d–f) 12 mm.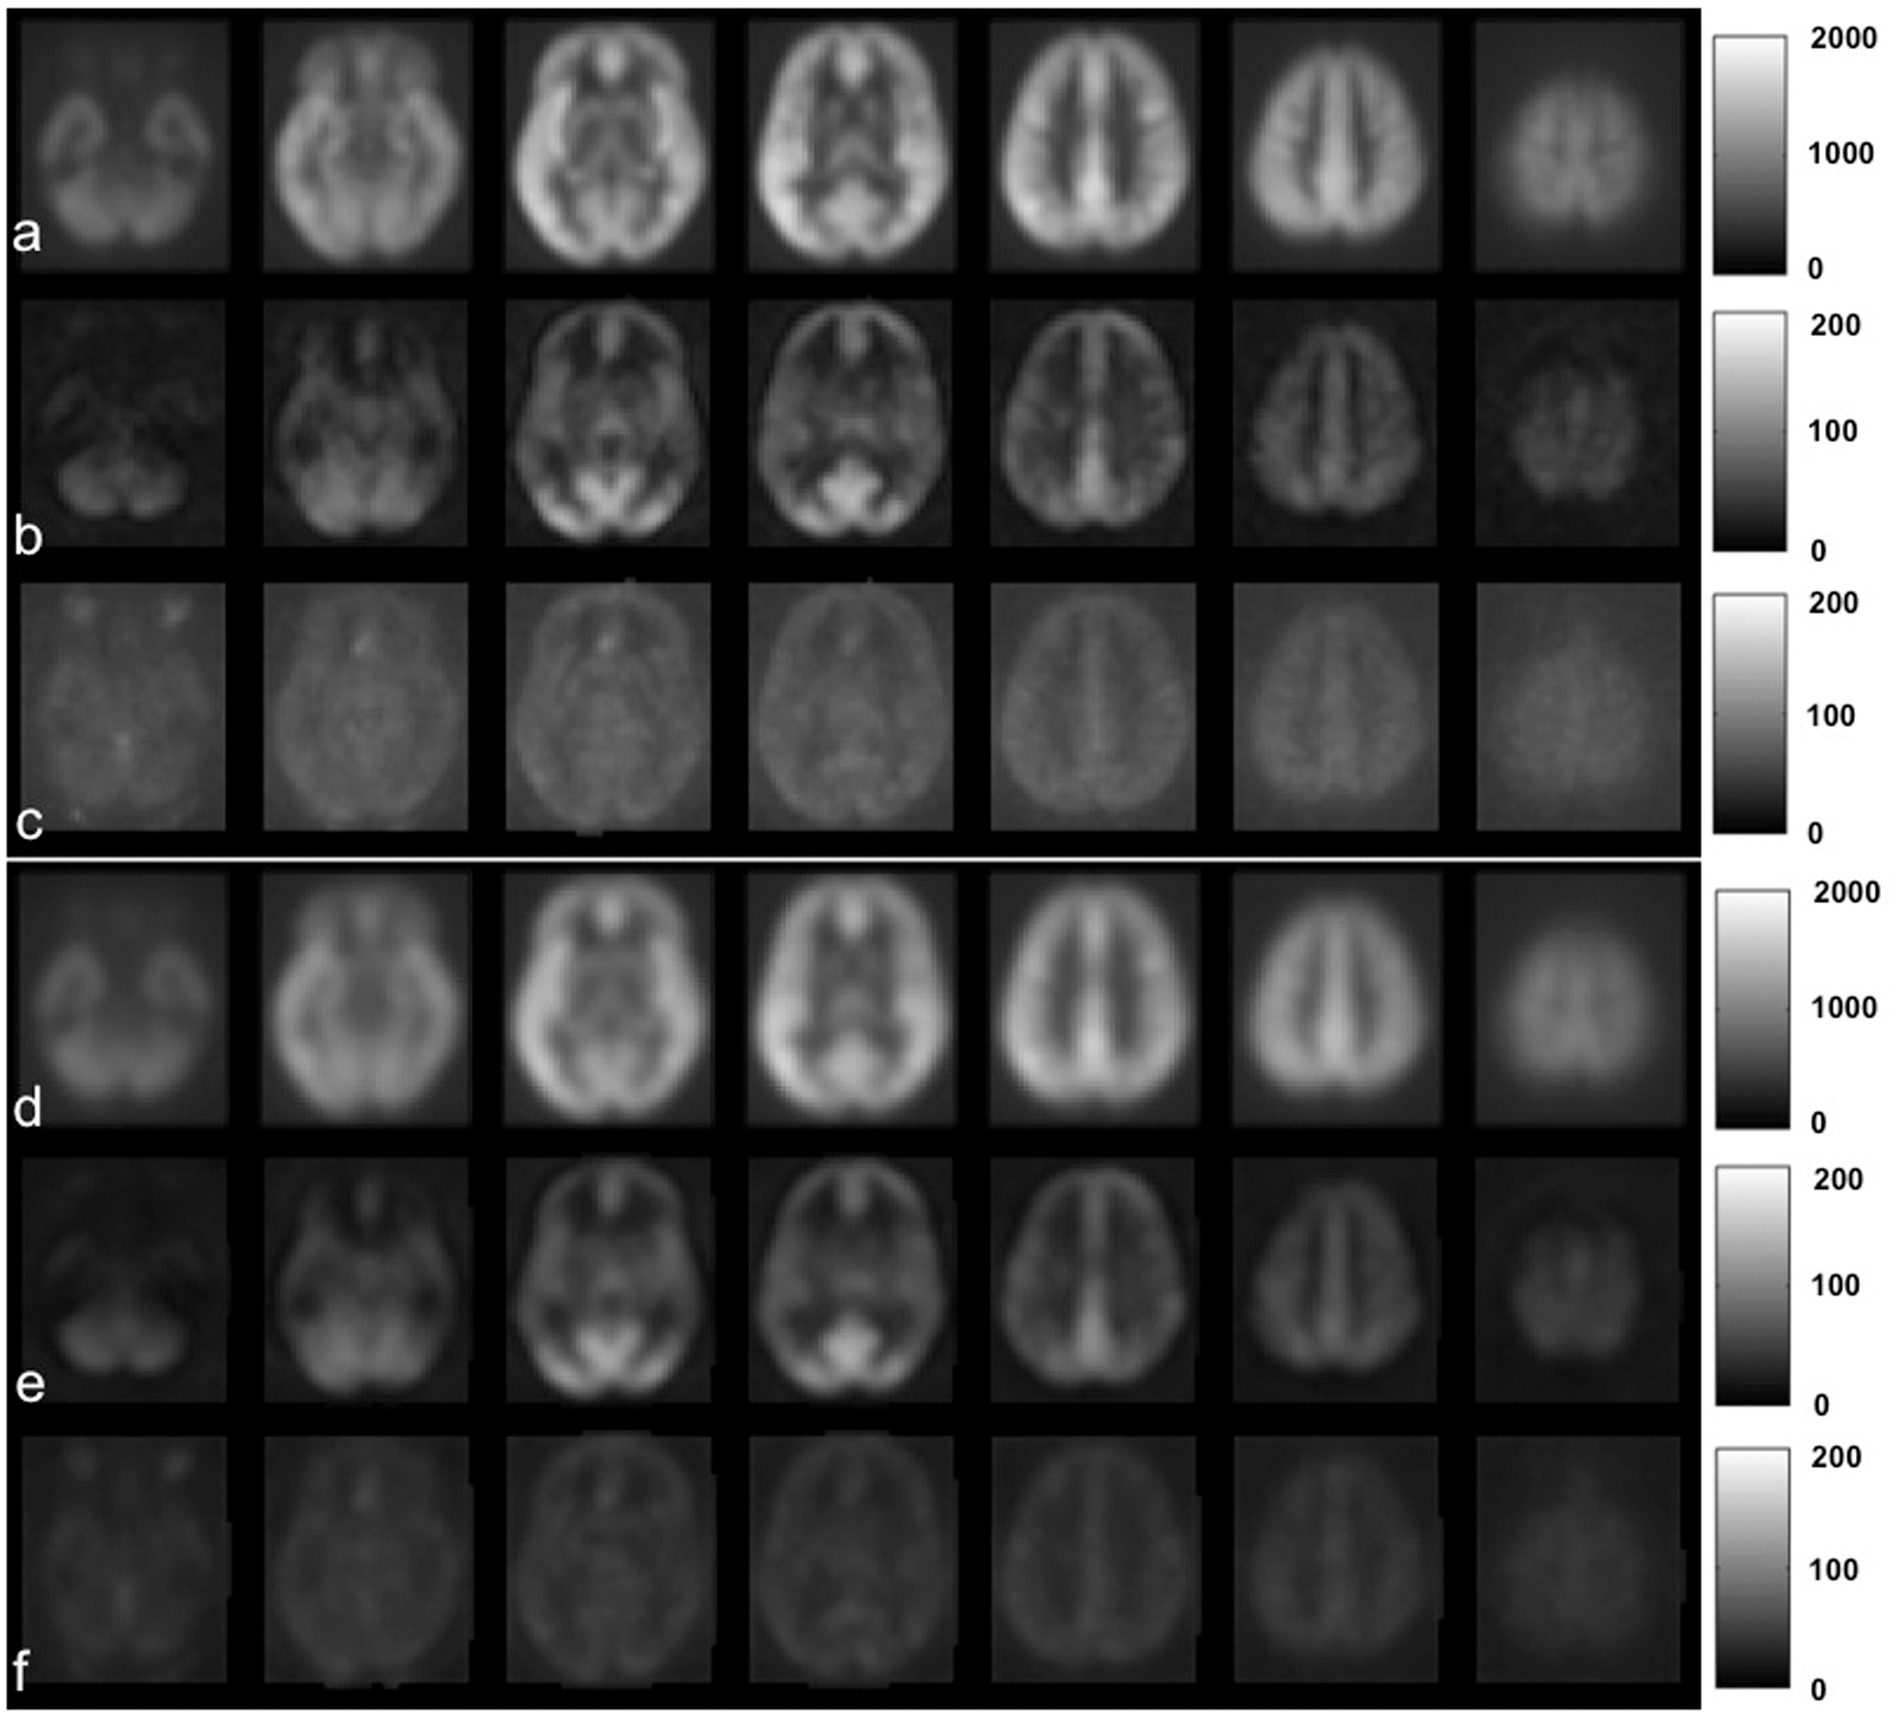
Quantification of noise fluctuations shows that network fluctuations dominate over residual thermal and other noise sources for smoothing of 12 mm FWHM or greater. The gray matter fluctuation amplitudes of the ICA-derived networks and residual noise averaged over 20 subjects using the two different smoothing kernels are listed in Table 3. For the commonly used smoothing kernel of 6 mm, we observed slightly higher gray matter fluctuations of residual noise than those of networks (p = 0.011), but the network fluctuations become higher than those of residual noise at 12 mm FWHM smoothing. This reflects the much more rapid drop in residual noise with the 12 mm relative to 6 mm smoothing kernel. Network fluctuations decrease only 7.77% ± 1.56% with larger smoothing, while fluctuations of residual noise show a much larger decrease of 39.75% ± 2.90% (both are significant decreases, however). These results indicate that the fluctuations from the resting state networks are mostly spatially extended, structured noise that cannot be greatly reduced with larger smoothing kernels, while residual noise behaves more like Gaussian random noise and can be effectively reduced with smoothing.
Discussion
Our results demonstrate the capability to quantify resting state network fluctuations using ASL and to separate global and regional effects. As studies of resting networks increasingly target understanding of the relationship between large-scale correlations across the brain and cooperative behavior between microscopic neurons, the availability of quantitative measures of network fluctuations will provide useful data to constrain models.
ASL global signal fluctuations were the largest fluctuation source among all ASL noise sources. The uniformly correlated fluctuation pattern may reflect globally correlated neural activity. A recent study demonstrated that the global component of BOLD signal fluctuations frequently removed in analysis is tightly coupled with a slow modulation of neuronal activity that appear to be ubiquitous in the cerebral cortex. 29 However, physiological noise, such as cardiac pulsations and respiratory motions, could contribute to global signal fluctuations. It will be interesting to further separate the sources of global signal fluctuations, both for the improvement of perfusion measurement sensitivity and for our understanding of brain physiology. A separate study to explore the sources of ASL global signal fluctuations is planned.
Resting state fluctuation amplitudes vary across different networks. This may reflect different neural activity required to maintain the normal function of the resting brain. We have observed the largest fluctuations in visual networks. These findings are in concordance with prior BOLD studies. 35 A significant fluctuation difference was also observed between left lateral and right lateral network. The rank of network fluctuations is inconsistent with the fluctuation rank in a recent paper using ASL. 20 For instance, our results showed the smallest fluctuation from the right lateral network and the largest fluctuation from the visual networks, while their results indicated the opposite fluctuation order. One possible explanation is that the fluctuation amplitudes may vary with the range of frequency over which fluctuations are measured, which are different for the two studies.
The frequency range over which fluctuations are averaged is an important factor in determining the measured fluctuation amplitudes. Because our ASL implementation averaged perfusion over a 30 s window, fluctuations faster than 0.02 Hz were not included in our calculation. On the other hand, the low pass and high pass filters used in most BOLD resting state processing also focus on a limited frequency range. Different frequency ranges may contribute to differences in amplitude between networks measured with different methods. In the future, improvements in ASL acquisition speeds will enable temporal resolutions of 5 s or better. Since the hemodynamic response of the brain limits signal fluctuations faster than this and ASL has excellent low frequency stability, 36 future ASL studies should be able to quantify and characterize the entire frequency range of fluctuations accessible by hemodynamic measures.
Quantitative measurements of signal fluctuations in resting state networks could be very important for improved noise reduction and statistical analysis of future ASL studies. For example, knowing the magnitude of signal fluctuation of the interested network, one can design the experiment to reduce the noise to an acceptable degree by choosing the length of the scan time. Different statistical models may also be needed. The most commonly used statistical tools assume a spatially smoothed normal distribution with minimal covariance between voxels at larger distances. Our resting network studies show, however, that the spatial pattern of noise correlations between voxels is extended and complex. Future ASL studies may require new statistical analysis models to take into account the complex noise correlation pattern in ASL data.
The signal fluctuations of resting state networks were reported as a percentage of resting perfusion instead of in absolute units of blood flow. That is because reference images required for quantification were unfortunately not acquired in this study. However, absolute quantification of perfusion signal fluctuation in physiologic units is readily achieved using the perfusion signal kinetic model and an additional reference image.37–39 Such reference image acquisition can and will be included in future studies. Since the average gray matter perfusion is approximately 70 ml/100g/min for normal healthy young volunteers, 40 the absolute perfusion signal fluctuations can be estimated from this population average and the reported signal fluctuation percentage in this paper.
An additional benefit of ASL for study of resting state networks is the reduction of non-neural noise sources observed with BOLD. Visual screening of networks derived with ICA applied to BOLD data is essential to remove the many “networks” that reflect artifacts such as motion. Far fewer artifactual networks were observed in ASL data relative to BOLD data. Specifically, only 2 out of 15 ICA networks in ASL data, but 8 out of 20 ICA networks in BOLD data appeared as non-neural. Even if 20 ICs were chosen for ASL data, only 4 out 20 ICA networks appeared as non-neural (some ICA networks were partitioned into smaller networks). This is presumably related to the suppression of spatially coherent noise sources in perfusion data. Motion-related artifacts can be largely reduced by combining the ASL labeling with background suppression pulses. 25 By suppressing the background tissue signal to a small percentage, the blood oxygen contamination to ASL signals was also minimized. Although previous volumetric ASL resting state studies used background suppression, ASL control signals still contained 15–20% of background tissue signal and therefore the ASL signal fluctuation may have been affected by non-neural modulation of background tissue signals.
Unlike BOLD, ASL images were acquired using a spin-echo based technique, which is expected to reduce the susceptibility signal loss near air tissue interface. The DMN detected from the ASL data showed larger extension into regions with high susceptibility related frequency gradients than the DMN derived from BOLD, consistent with reduced BOLD sensitivity due to susceptibility signal loss (Figure 5). The improved sensitivity of ASL over BOLD in the regions with high susceptibility is consistent with a previous study.
17
ASL combined with spin-echo based acquisition is capable of offering improved sensitivity in regions with high susceptibility, including orbitofrontal regions and inferior temporal regions, and hence offers a unique advantage for applications targeted at these regions.
The BOLD group-level coefficient of variation (CV) map (red-yellow color) overlaid on the default mode network (green color) extracted from (a) ASL data and (b) BOLD data. The CV map, calculated as the ratio of standard deviation to mean, emphasizes the poor sensitivity of BOLD at the base of the frontal lobes. The larger spatial extent of the default mode network into the orbital frontal cortex seen in (a) likely reflects the higher sensitivity of ASL to function in this region.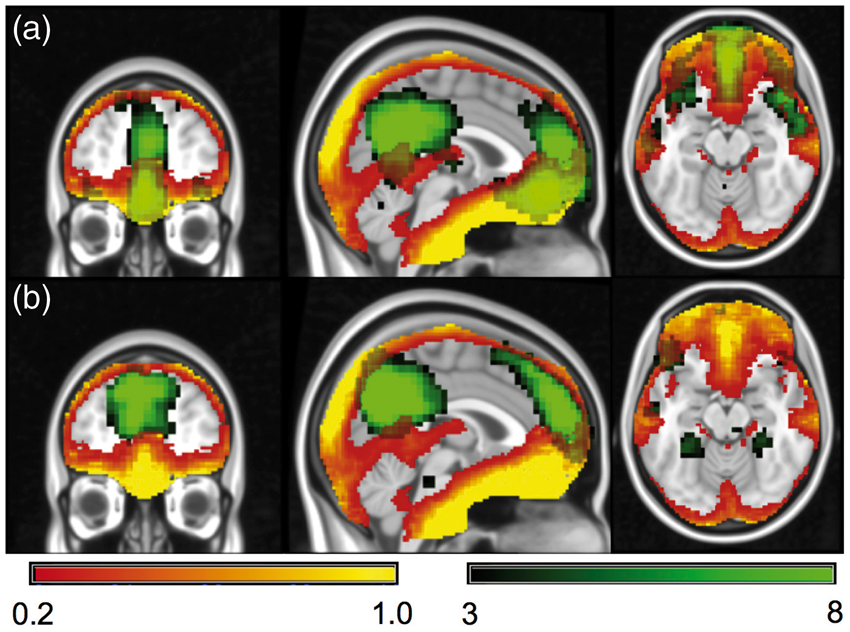
Conclusions
ASL has demonstrated the capability to quantify global fluctuations and resting state network fluctuations in physiological units. Global fluctuations are larger than those of the spatially constrained network fluctuations and fluctuations caused by random noise. The amplitude of resting state network fluctuations varies across networks. Global and networks fluctuations are dominant noise sources for statistical analysis of ASL data applied with normal smoothing kernels. Quantification of resting state network fluctuations with ASL may enable improved noise reduction and statistical analysis of ASL studies and provide insights into the function of normal resting brain and pathophysiological alterations caused by disease.
Footnotes
Funding
The author(s) disclosed receipt of the following financial support for the research, authorship, and/or publication of this article: This work was supported by grant 2R01MH080729 from the National Institutes of Health.
Declaration of conflicting interests
The author(s) declared the following potential conflicts of interest with respect to the research, authorship, and/or publication of this article: DCA is an inventor of PCASL and receives post-market royalties through his institution from GE Healthcare, Philips Healthcare, and Hitachi. He also receives research support from GE Healthcare.
Authors’ contributions
WD designed the protocol, acquired the data, analyzed the data, interpreted the data and drafted the paper; GV and RS acquired the data and revised the paper; and DCA designed the protocol, interpreted the data, and revised the paper.