
Abstract
Clearance of perivascular wastes in the brain may be critical to the pathogenesis of amyloidopathies. Enlarged perivascular spaces (ePVS) on MRI have also been associated with amyloidopathies, suggesting that there may be a mechanistic link between ePVS and impaired clearance. Sleep and traumatic brain injury (TBI) both modulate clearance of amyloid-beta through glymphatic function. Therefore, we sought to evaluate the relationship between sleep, TBI, and ePVS on brain MRI. A retrospective study was performed in individuals with overnight polysomnography and 3T brain MRI consented from a single site (n = 38). Thirteen of these individuals had a medically confirmed history of TBI. ePVS were visually assessed by blinded experimenters and analyzed in conjunction with sleep metrics and TBI status. Overall, individuals with shorter total sleep time had significantly higher ePVS burden. Furthermore, individuals with TBI showed a stronger relationship between sleep and ePVS compared to the non-TBI group. These results support the hypothesis that ePVS may be modulated by sleep and TBI, and may have implications for the role of the glymphatic system in ePVS.
Introduction
The brain perivascular space is a neuroanatomical route for fluid flow and maintenance of brain homeostasis.1,2 Perivascular spaces, also known as Virchow–Robin spaces, are fluid-filled areas of the brain separating the meninges and arteries or veins. When perivascular spaces (ePVS) are enlarged (ePVS), they become visible in the basal ganglia (BG) and centrum semiovale (CS) on MRI. ePVS have historically been considered incidental radiological and/or pathological findings. However, recent studies have identified strong associations between increased ePVS burden and Alzheimer's disease (AD) status,3–5 dementia, 6 and stroke.7–9
A recently characterized system of cerebrospinal fluid and brain interstitial fluid exchange across the perivascular space, termed the “glymphatic” system, clears interstitial solutes from the brain into the bloodstream, primarily during sleep.2,10 It has been recently hypothesized that ePVS burden may reflect impaired perivascular glymphatic function, specifically.11,12 Both sleep and TBI status modulate glymphatic function.13,14 Accordingly, ePVS have been associated with sleep disruption, 15 and ePVS in TBI patients have also been reported,16,17 although these factors have yet not been examined within the same study.
Sleep-wake disturbances are among the most common symptoms of TBI, with frequent reports of increased insomnia, drowsiness, and difficulties staying asleep. 18 Although the mechanism that underlies sleep disturbances following TBI remains unclear, recent work in animal models has implicated a neuroanatomical mechanism based on an impaired orexin/hypocretin system. 19 Thus, the objective of this study was to evaluate the effect of sleep and TBI on ePVS on MRI. We hypothesized that both TBI and poor sleep would be associated with increased ePVS on MRI.
Materials and methods
Study sample and exclusion criteria
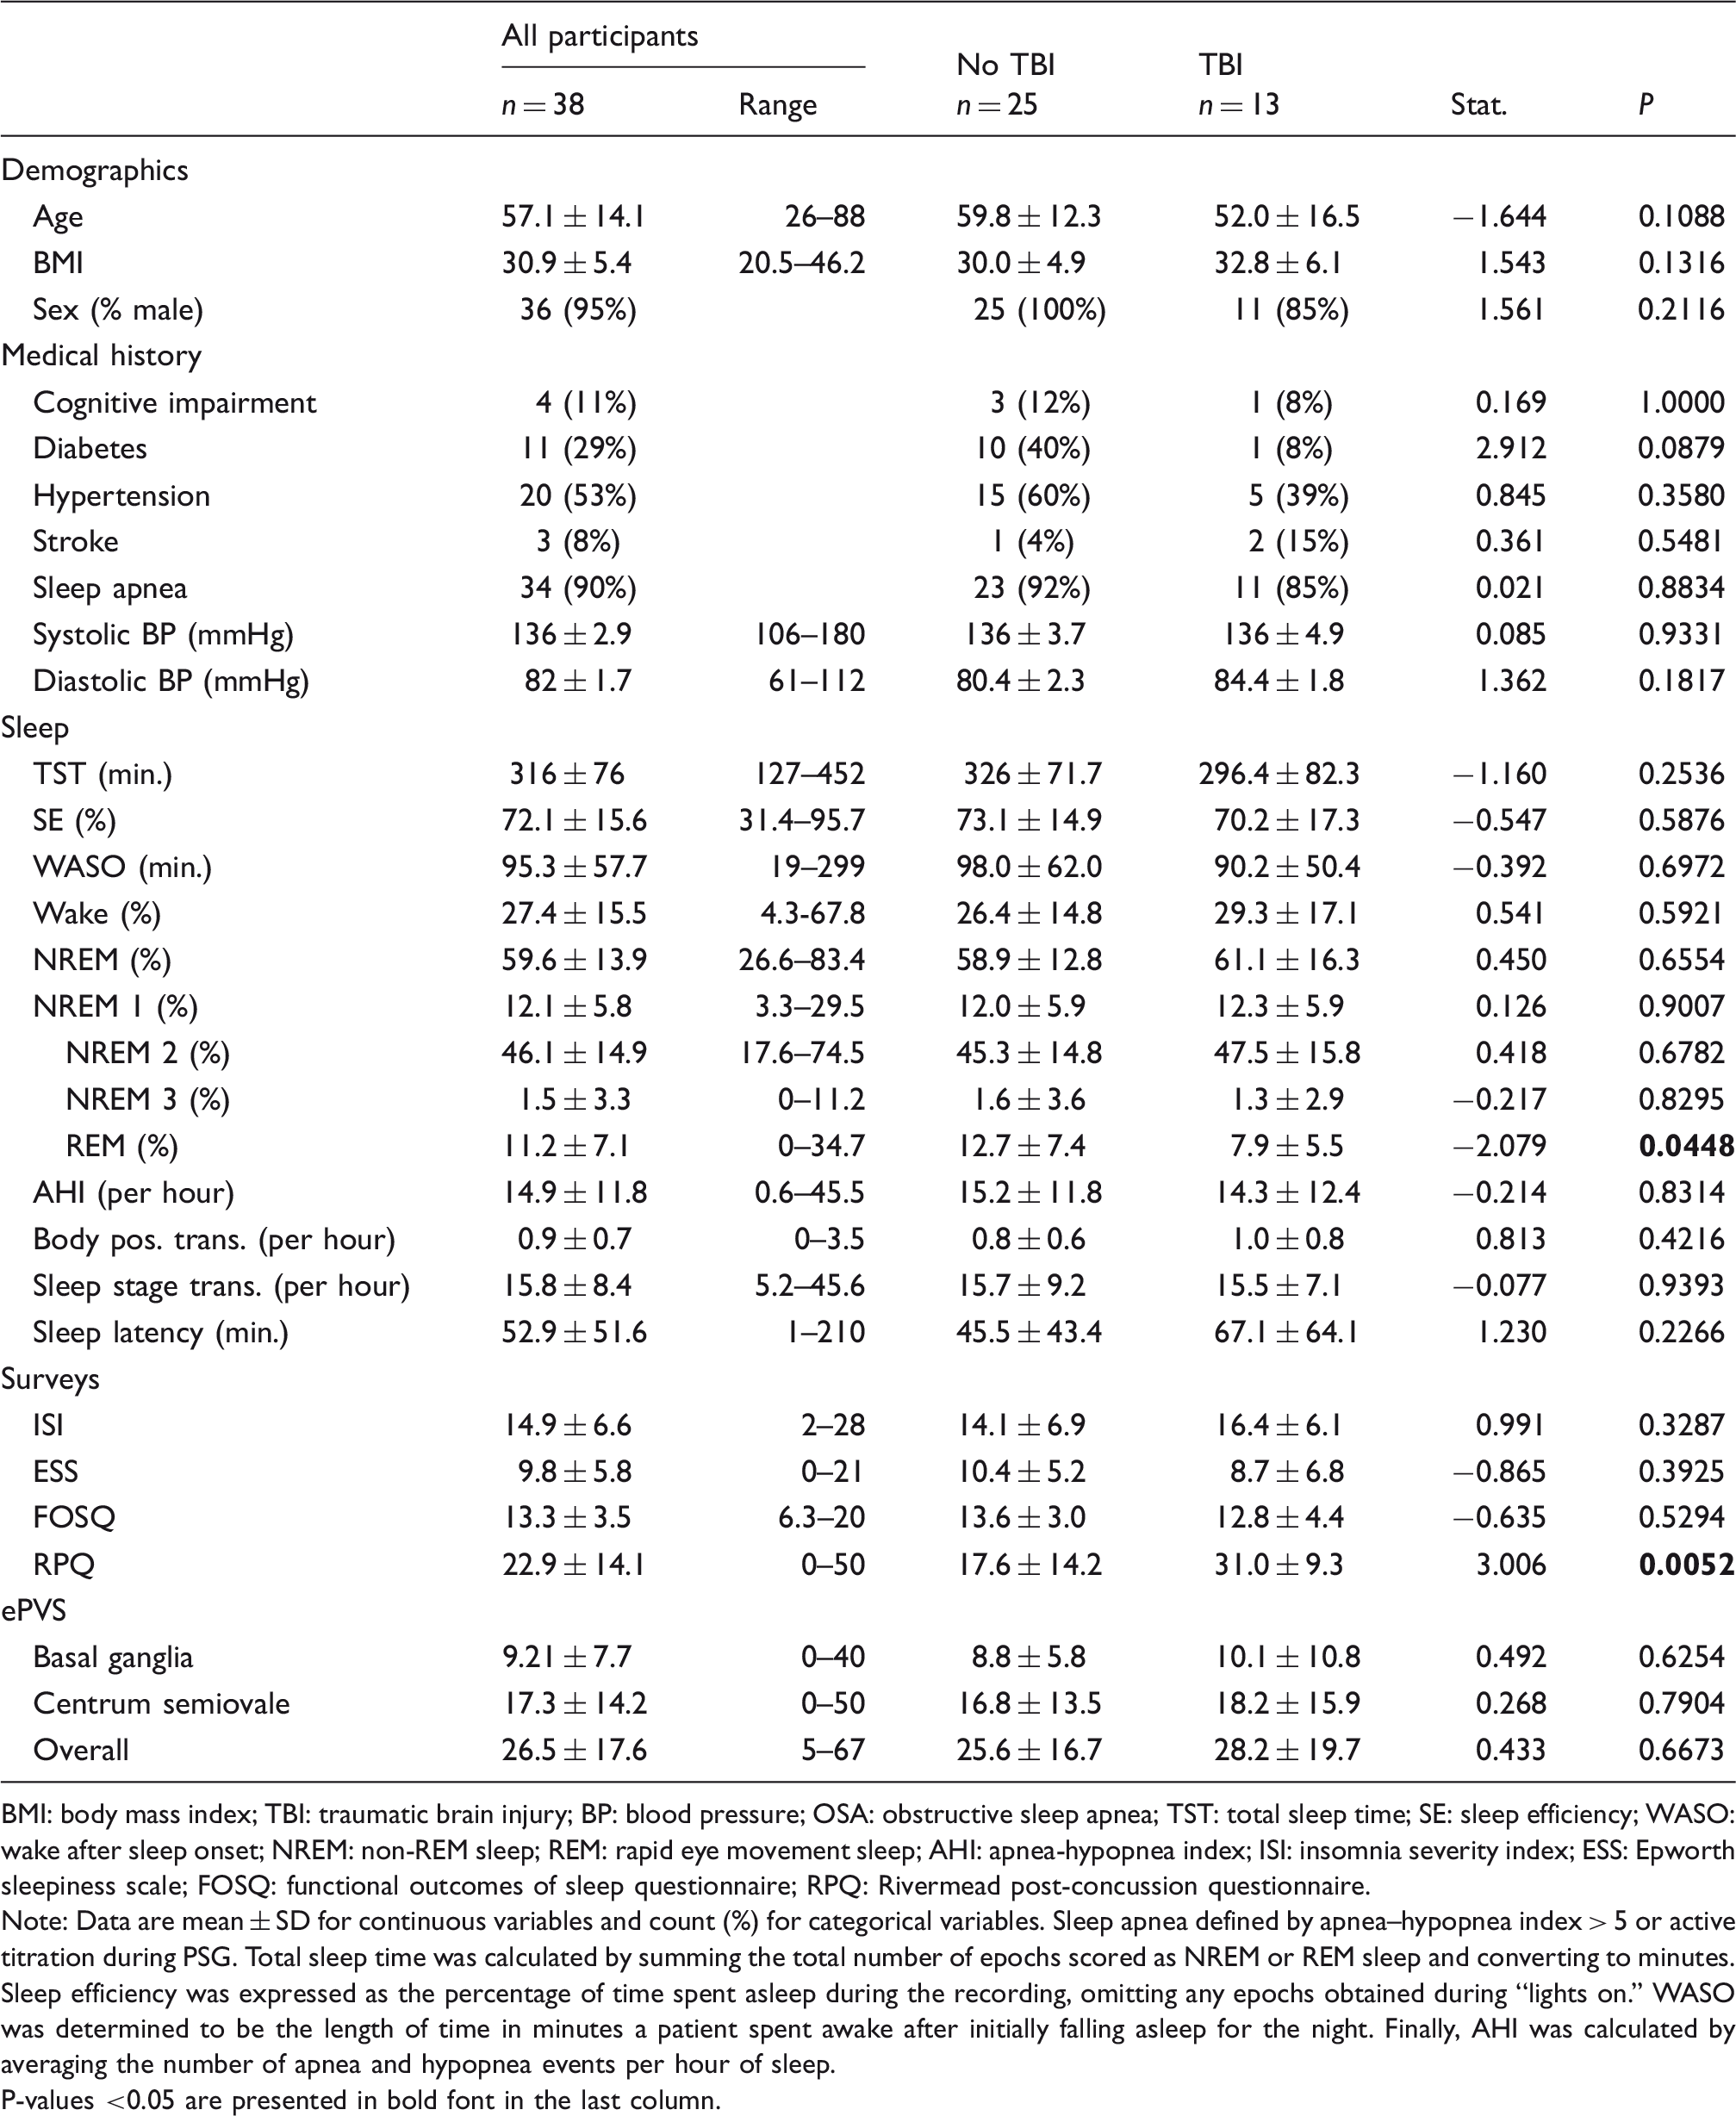
All subjects provided informed consent under VA Portland Health Care System Institutional Review Board approval (MIRB #3641), and the study was conducted in accordance with the ethical guidelines of the Belmont Report. Subjects with overnight polysomnography (PSG) recordings were consented at the Portland VA between May 2015 and November 2016 (n = 670). Participants were excluded if they did not have more than 4 h total time in bed during the PSG (n = 31), if they did not undergo brain MRI (n = 626), or if the history of TBI could not be confirmed in the medical record (n = 6), leaving n = 38 participants available for analysis (Figure 1). Demographics of remaining participants, including diabetes, hypertension, stroke, and blood pressure history are shown in Table 1. Both MRI and PSG were clinically indicated studies.
Study design and subject inclusion criteria. Subject demographics. BMI: body mass index; TBI: traumatic brain injury; BP: blood pressure; OSA: obstructive sleep apnea; TST: total sleep time; SE: sleep efficiency; WASO: wake after sleep onset; NREM: non-REM sleep; REM: rapid eye movement sleep; AHI: apnea-hypopnea index; ISI: insomnia severity index; ESS: Epworth sleepiness scale; FOSQ: functional outcomes of sleep questionnaire; RPQ: Rivermead post-concussion questionnaire. Note: Data are mean ± SD for continuous variables and count (%) for categorical variables. Sleep apnea defined by apnea–hypopnea index > 5 or active titration during PSG. Total sleep time was calculated by summing the total number of epochs scored as NREM or REM sleep and converting to minutes. Sleep efficiency was expressed as the percentage of time spent asleep during the recording, omitting any epochs obtained during “lights on.” WASO was determined to be the length of time in minutes a patient spent awake after initially falling asleep for the night. Finally, AHI was calculated by averaging the number of apnea and hypopnea events per hour of sleep. P-values <0.05 are presented in bold font in the last column.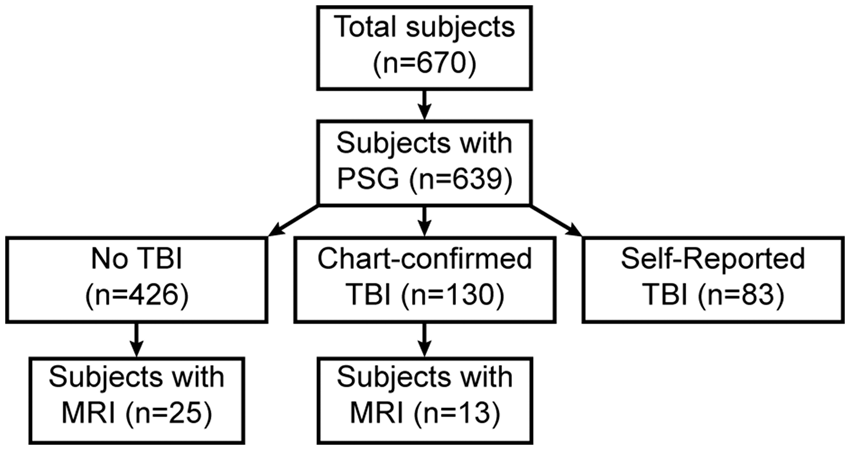
TBI profile
TBI profile of subjects.
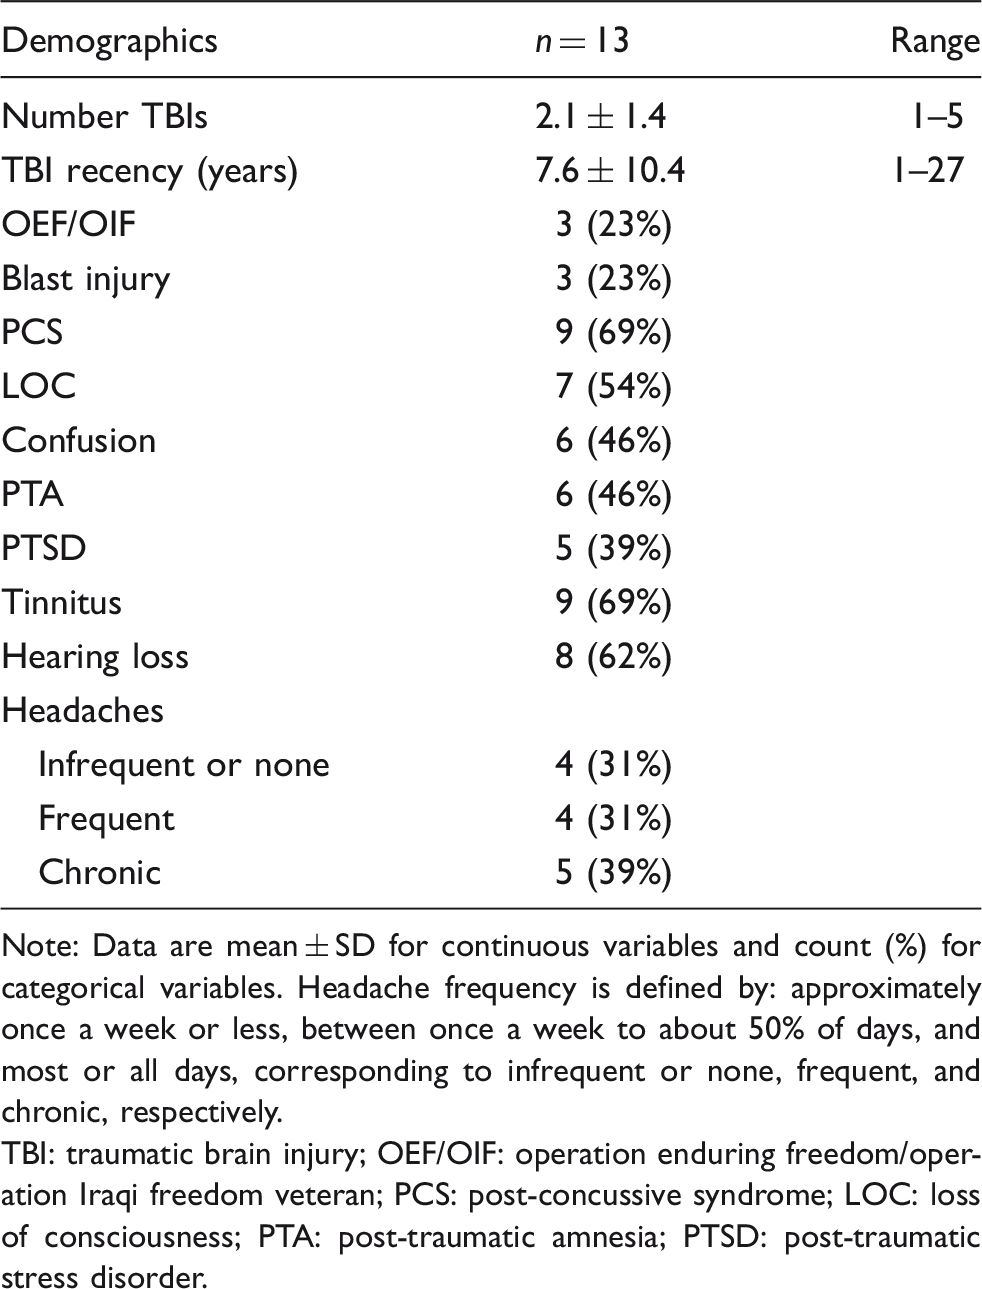
Note: Data are mean ± SD for continuous variables and count (%) for categorical variables. Headache frequency is defined by: approximately once a week or less, between once a week to about 50% of days, and most or all days, corresponding to infrequent or none, frequent, and chronic, respectively.
TBI: traumatic brain injury; OEF/OIF: operation enduring freedom/operation Iraqi freedom veteran; PCS: post-concussive syndrome; LOC: loss of consciousness; PTA: post-traumatic amnesia; PTSD: post-traumatic stress disorder.
Chart history of cognitive dysfunction was also recorded, which was limited to ICD-10 diagnoses of AD, dementia, and/or mild cognitive impairment. For the purposes of this study, patients were classified as “cognitively impaired” if they were diagnosed with one or more of these disorders in the medical record.
Surveys
Post-traumatic stress disorder checklist DSM-5
To obtain information on subject's post-traumatic stress disorder (PTSD) status, participants completed the 20-item Post-Traumatic Stress Disorder Checklist DSM-5 (PCL-5) survey, which serves to provisionally diagnose and assess symptom severity of PTSD. 20 Individual questions are Likert scales ranging from 0 = “Not at all” to 4 = “Extremely,” and the 20 questions are grouped into 4 subscales, or “clusters.” Participants in this study were classified as having PTSD if they met the PCL-5 cluster criteria 20 and had a total score of ≥33. Cronbach's alpha (95% CI) in our sample was 0.97 (0.96–0.98) which is consistent with literature reported values. 21
Insomnia severity index
The insomnia severity index (ISI) is a 7-item survey used to assess insomnia severity (i.e. difficulty initiating and staying asleep). The total score ranges from 0 to 28, 22 and individual items are 5 point Likert scales: 0 = “None,” 1 = “Mild,” 2 = “Moderate,” 3 = “Severe,” 4 = “Very severe.” Cronbach's alpha (95% CI) in our sample was 0.92 (0.88–0.96), which is consistent with previously reported values. 23
Epworth sleepiness scale
The Epworth sleepiness scale (ESS) is an 8-item survey used to assess daytime sleepiness. 24 The total score ranges from 0 to 24 and individual items are 4-point Likert scales: 0 = “Would never doze,” 1 = “Slight chance of dozing or sleeping,” 2 = “Moderate chance of dozing or sleeping,” 3 = “High chance of dozing or sleeping.” A score of ≥ 11 is indicative of abnormal daytime sleepiness. Cronbach's alpha in our sample was 0.88 (0.82–0.94) consistent with literature reported values.25,26
Functional outcomes of sleep quality
The functional outcomes of sleep questionnaire (FOSQ-10) is a 10-item survey used to assess quality of life due to sleep quality. 27 Individual items are 4-point Likert scales: 1 = “Yes, extreme difficulty,” 2 = “Yes, moderate difficulty,” 3 = “Yes, a little difficulty,” 4 = “No difficulty”; however, half of the items are a 5-point Likert scale that include a rating of 0 = “I don't do this activity for other reasons.” The survey is divided into five subscales, which are then averaged to calculate a total score; thus, the total score of the FOSQ-10 ranges from 5 to 20. Cronbach's alpha in our sample was 0.79 (0.69–0.89) which is consistent with literature reported values. 28
Rivermead post-concussion questionnaire
The Rivermead post-concussion questionnaire (RPQ) is a 13-item survey used to assess post-concussive symptoms. 29 Individual items are 5-point Likert scales: 0 = “Not experienced at all,” 1 = “No more of a problem,” 2 = “A mild problem,” 3 = “A moderate problem,” 4 = “A severe problem.” Cronbach's alpha (95% CI) in our sample was 0.95 (0.92–0.97), which is consistent with previously reported values. 30
ePVS quantification in MRI
A blinded researcher (AC, a neurologist) counted ePVS on single axial MRI slices containing the BG and CS regions using established visual rating scales based on anatomical landmarks. All patients had axial T1 and T2 images. When available, axial T2 slices were compared with T1 and fluid-attenuated inversion recovery (FLAIR) images at the same level. MRI parameters for the T2 images were TE = 80, TR = 3000, FOV =250 mm, slice thickness = 4 mm, spacing = 5 mm. ePVS quantification was completed visually using established gold standard visual rating methods, 31 in which PVS counts were performed on one axial slice in the CS and BG each that contained the greatest PVS burden were tallied. A second blinded experimenter (JMP, a neuroradiologist in collaboration with BC, a radiology resident) also counted ePVS. Inter-rater agreement scores were calculated. In four cases, the number of ePVS were borderline and led to disagreement between scorers. In these instances, another independent blinded researcher (EB) quantified ePVS and determined the final count. Intra-class correlation (95% confidence interval) showed consistency between the two raters of 0.92 (0.86–0.96) for BG and 0.91 (0.85–0.95) for CS, indicating acceptable levels of interscorer agreement. 32
A single, aggregate ePVS count value was determined for each participant by summing scores from the BG and CS, deemed “total,” based on previously established protocols.4,15 Aggregate ePVS value for each participant was then stratified into one of four categories mild (1–10), moderate (11–20), frequent (21–40), and severe (41+) based on an established ePVS rating scale,
31
modified such that category scores were based on global, rather than regional counts. Follow-up analyses used ePVS counts as a continuous variable, the distribution of which ranged from 5–67, had a positive skew (0.8), and was non-normal (Shapiro–Wilk W = 0.893; P < 0.01). Representative MRI axial images for ePVS in BG and CS are shown in Figure 2. The distribution across the four severity categories is as follows: 71% mild, 18% moderate, 8% frequent, and 3% severe in the BG, and 40% mild, 29% moderate, 18% frequent, 11% severe in the CS.
Representative MR images of ePVS burden across severity categories. Panels (a) to (d) show axial T2 MR brain images acquired at 3T at the level of the basal ganglia. Panels (e) to (h) show axial T2 MR brain images acquired at 3T at the level of the centrum semiovale. Arrows denote individual ePVS. Columns are ordered left to right in increasing bins of ePVS burden (1–10, 11–20, 21–40, 41+).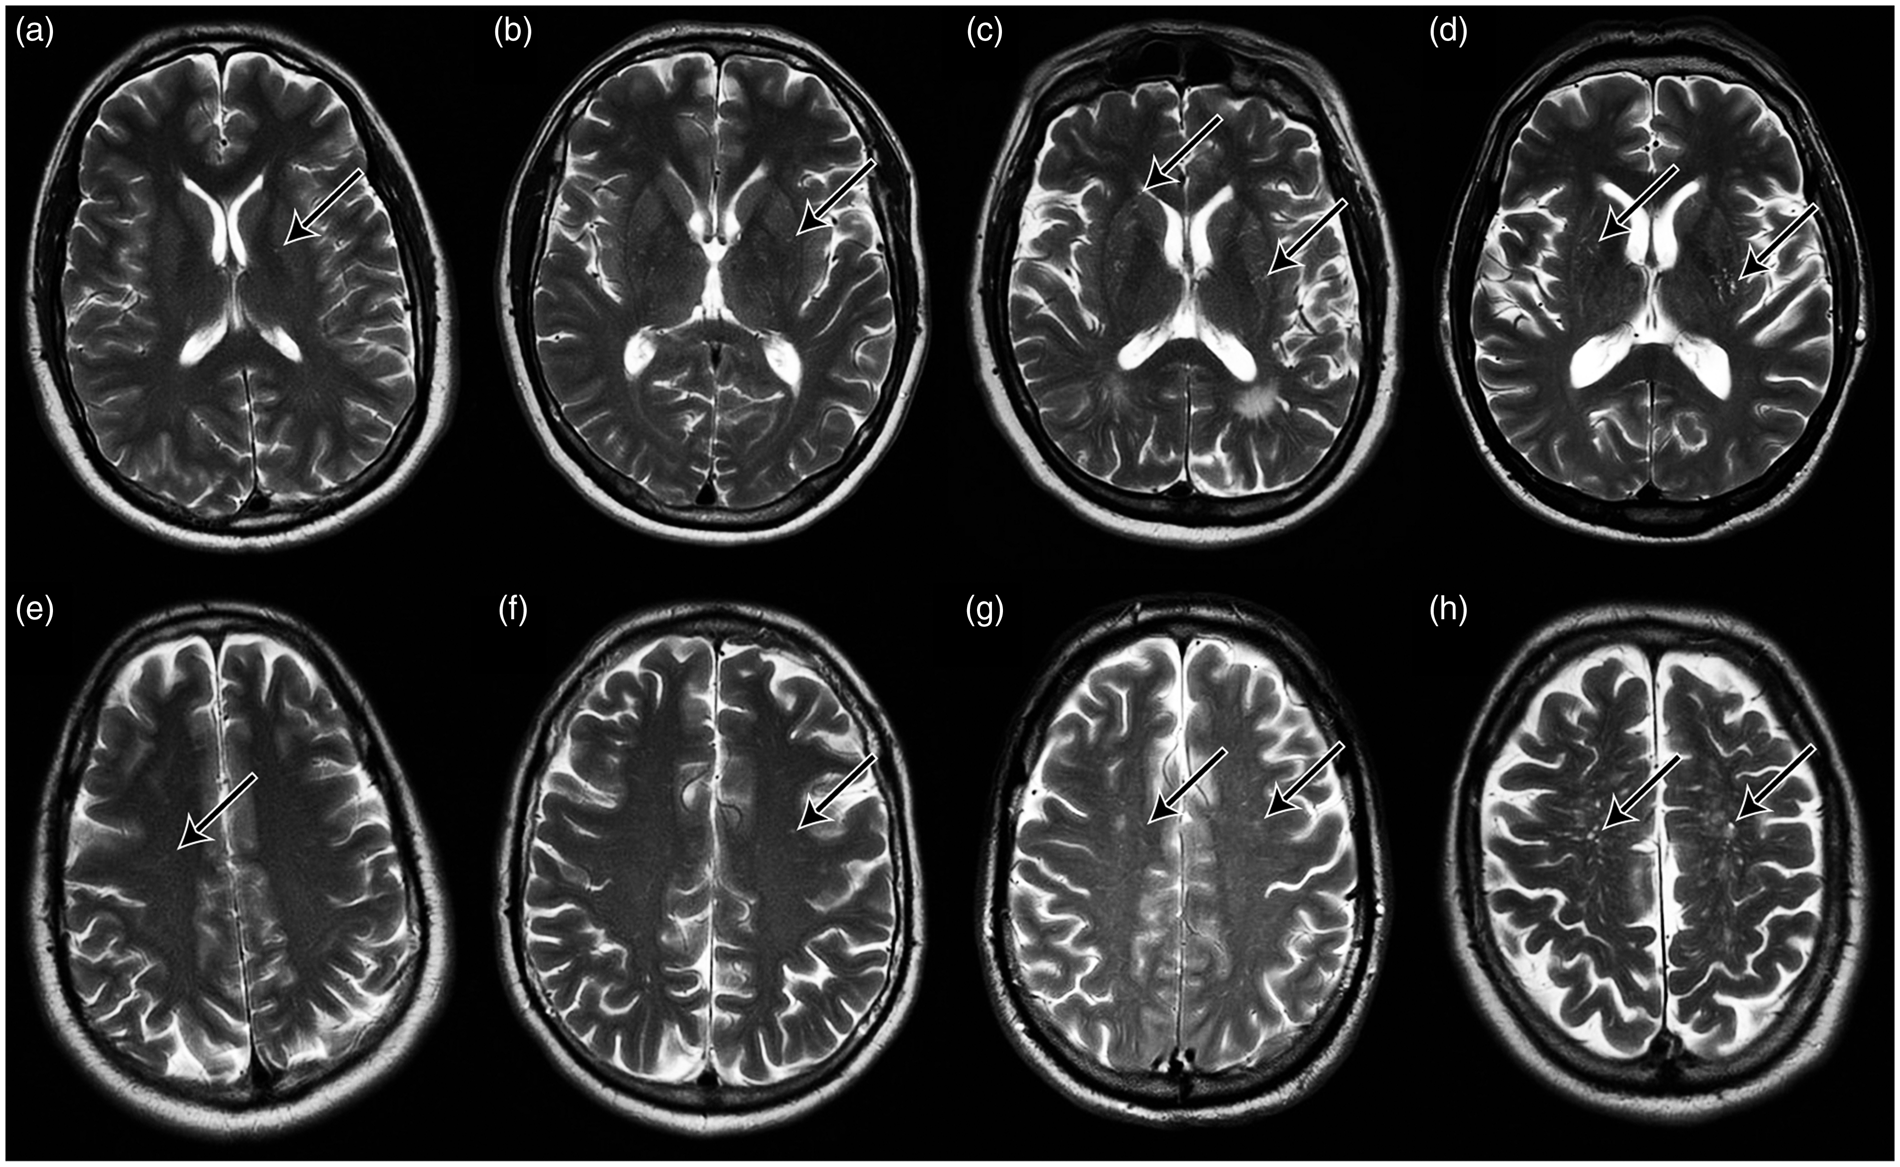
PSG
All subjects completed a clinically indicated, in-laboratory, Type I sleep study recorded using Polysmith® version 9.0 (Nihon Kohden, 2012). Sleep staging was performed by an American Academy of Sleep Medicine (AASM)-accredited polysomnographic technician and interpreted by a board-certified physician in Sleep Medicine. Standard parameters as specified by the AASM were captured in the PSG recordings, including electroencephalography (EEG), electromyography (EMG) of the mentalis muscle, electrocardiography (EKG), electrooculography (EOG; left and right eyes), peripheral blood-oxygen saturation (SpO2), respiratory movement/effort (thorax and abdominal), airflow (nasal and oral), auditory (snoring), and body positioning (right side, left side, supine, prone).
Individual PSG data were analyzed for total sleep time (TST), time spent in each sleep stage as a percent of TST, sleep efficiency, wake after sleep onset (WASO), and apnea–hypopnea index (AHI). Total sleep time was calculated by summing the total number of epochs scored as NREM or REM sleep and converting to minutes. Sleep efficiency was expressed as the percentage of time spent asleep during the recording, omitting any epochs obtained during “lights on.” WASO was determined to be the length of time in minutes a patient spent awake after initially falling asleep for the night. Finally, AHI was calculated by averaging the number of apnea and hypopnea events per hour of sleep.
Statistical analyses
Analyses were performed using R version 3.4.1. 33 An alpha value of 0.05 was used for all tests, unless otherwise noted. Demographic data were analyzed using Student's t-tests for normally distributed numeric variables, and the Wilcoxon–Mann–Whitney two-sample rank-sum test for non-normally distributed numeric variables.
Relationships between ePVS burden categories and sleep metrics were analyzed using Kruskal–Wallis one-way analysis of variance, with post hoc comparisons using Dunn's test, corrected for multiple comparisons via the Benjamini–Hochberg procedure.
Due to the non-normal distribution of the ePVS data, relationships between ePVS counts and sleep metrics were assessed using Spearman's rank correlation. Correlations controlled for age, BMI, and obstructive sleep apnea (OSA) status, defined by participants either requiring positive airway pressure titration or having an AHI > 5 during their baseline PSG recording. Comparisons between non-TBI and TBI groups were performed using Fisher Z-transformed Spearman correlations.
Results
Sample
There were no significant differences in age, BMI, blood pressure, or the percent of participants with cognitive impairment, diabetes, hypertension, or stroke between the non-TBI (n = 25) and TBI (n = 13) groups (Table 1). Additionally, there were no significant differences in PSG-derived sleep metrics between the two groups, apart from REM sleep percent being marginally lower in the TBI group (P < 0.05). There were no group-wise differences in self-reported sleep metrics (ISI, FOSQ, or ESS). However, individuals with TBI history reported worse post-concussive symptom severity (assessed via the RPQ), as expected (P < 0.01). There was no group-wise difference in the number of ePVS in any of the brain regions examined.
Sleep impairment is associated with severity of ePVS burden
Using a modified ePVS rating scale, we found that increased ePVS burden was significantly associated with both TST (H = 9.57; P < 0.05; two-tailed Kruskal–Wallis) (Figure 3(a)) and REM sleep percent (H = 10.12; P < 0.05) (Figure 3(f)). Dunn's post hoc test, which controlled for multiple comparisons, indicated that individuals with “mild” ePVS burden exhibited significantly longer total sleep time than individuals with “frequent” (383 vs. 316 min; Z = 2.13; P
adj
< 0.05), and “severe” burdens (383 vs. 240 min; Z = 3.04; P
adj
< 0.05). Dunn's test also revealed that individuals with “mild” ePVS burden exhibited higher ratios of REM sleep than individuals with “moderate” (16.9% vs. 8.6% REM; Z = 2.99; P
adj
< 0.01), “frequent” (16.9% vs. 10.4% REM; Z = 2.26; P
adj
< 0.05) and “severe” burdens (16.9% vs. 10.5% REM; Z = 2.55; P
adj
< 0.05).
ePVS burden is increased in individuals with poor sleep. Panel (a) shows significantly decreased total sleep time in individuals with severe and frequent ePVS compared to those with mild ePVS burden. Panels (b), (c), (d) and (e) show the same trends for sleep efficiency, time spent awake after sleep onset, time spent awake in total, and time spent in non-REM sleep. Panel (f) indicates significantly decreased time spent in REM sleep in individuals with moderate, frequent and severe ePVS compared to those with mild ePVS burden. All statistics controlled for age, BMI, and OSA status. *Padj < 0.05.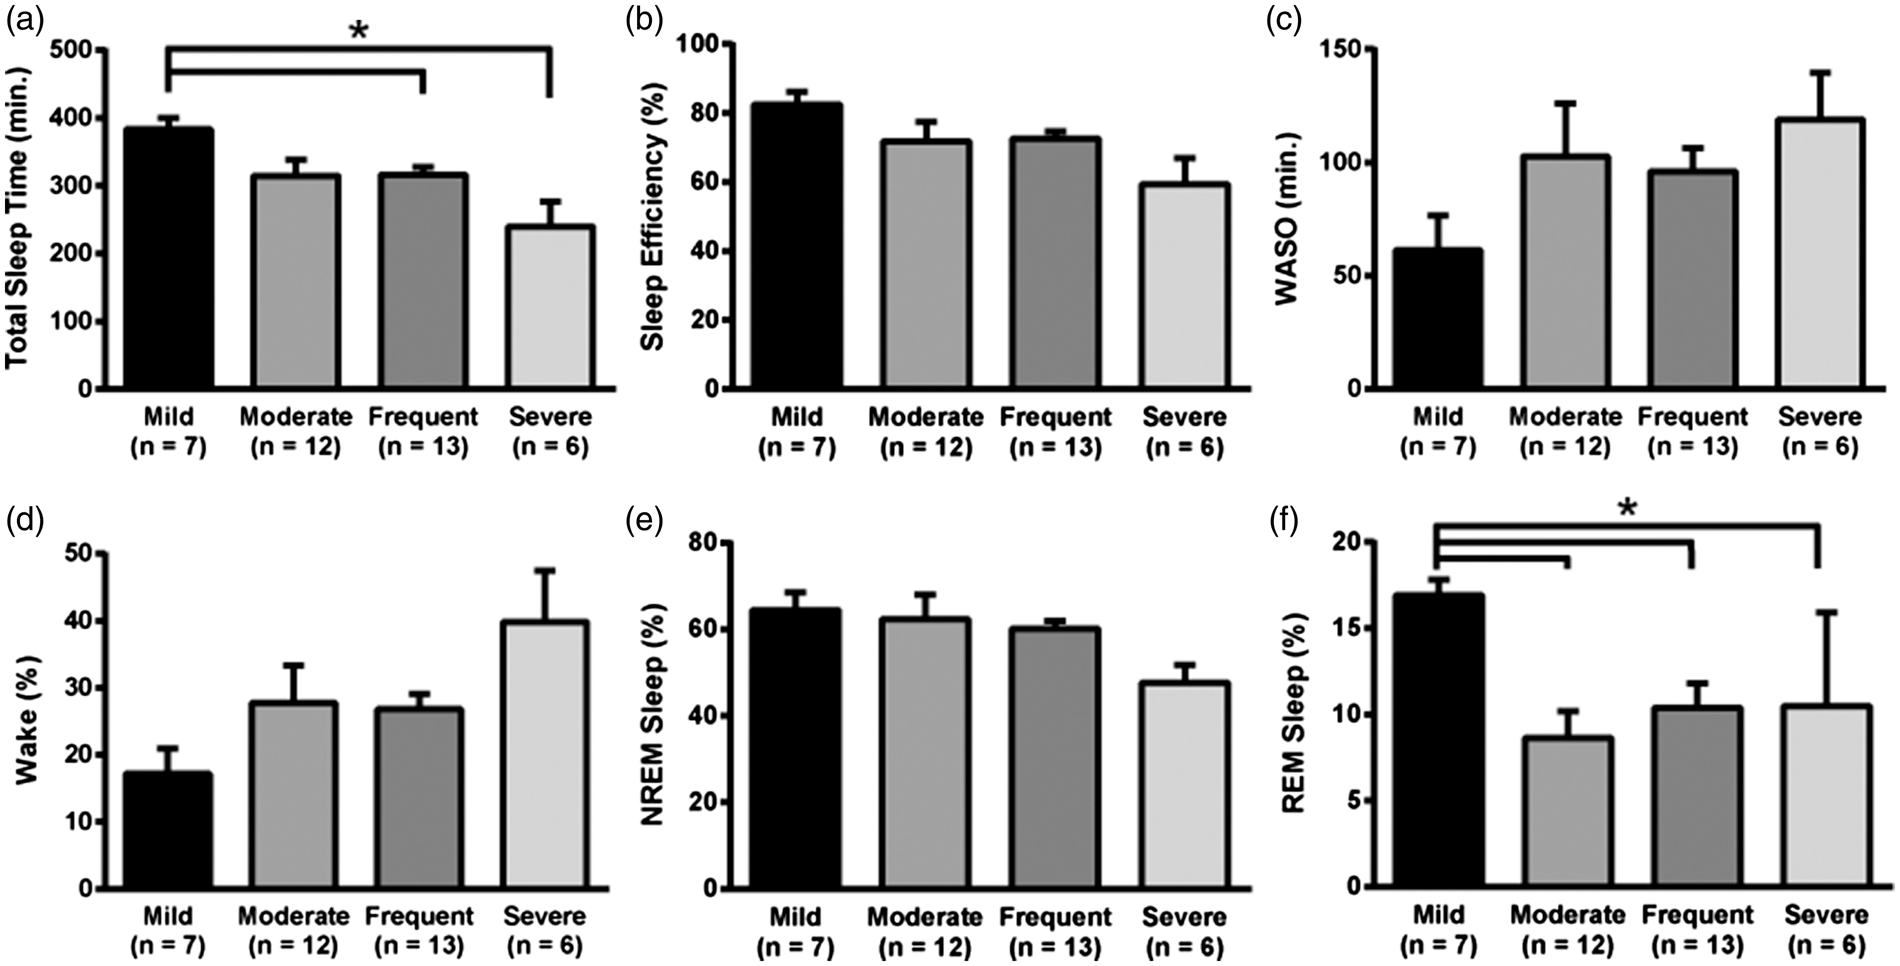
There were no significant group differences in the omnibus ANOVA for sleep efficiency (H = 6.02; P > 0.05), WASO (H = 5.87; P > 0.05), or time spent either awake (H = 5.49; P > 0.05) or in NREM sleep (H = 6.53; P > 0.05) (Figure 3(b) to (e)), although consistent trends were apparent. Furthermore, subset of NREM sleep stages (i.e. NREM stage N1, N2, and N3) revealed no significant group differences in the omnibus ANOVA for NREM 1 (H = 2.39; P > 0.05), NREM 2 (H = 4.73; P > 0.05), or NREM 3 (H = 2.83; P > 0.05).
Sleep impairment is significantly correlated with ePVS counts in the TBI group, but not in the non-TBI group
Spearman's correlations between number of ePVS, and objective/ subjective sleep metrics, which controlled for age, BMI, and OSA status.
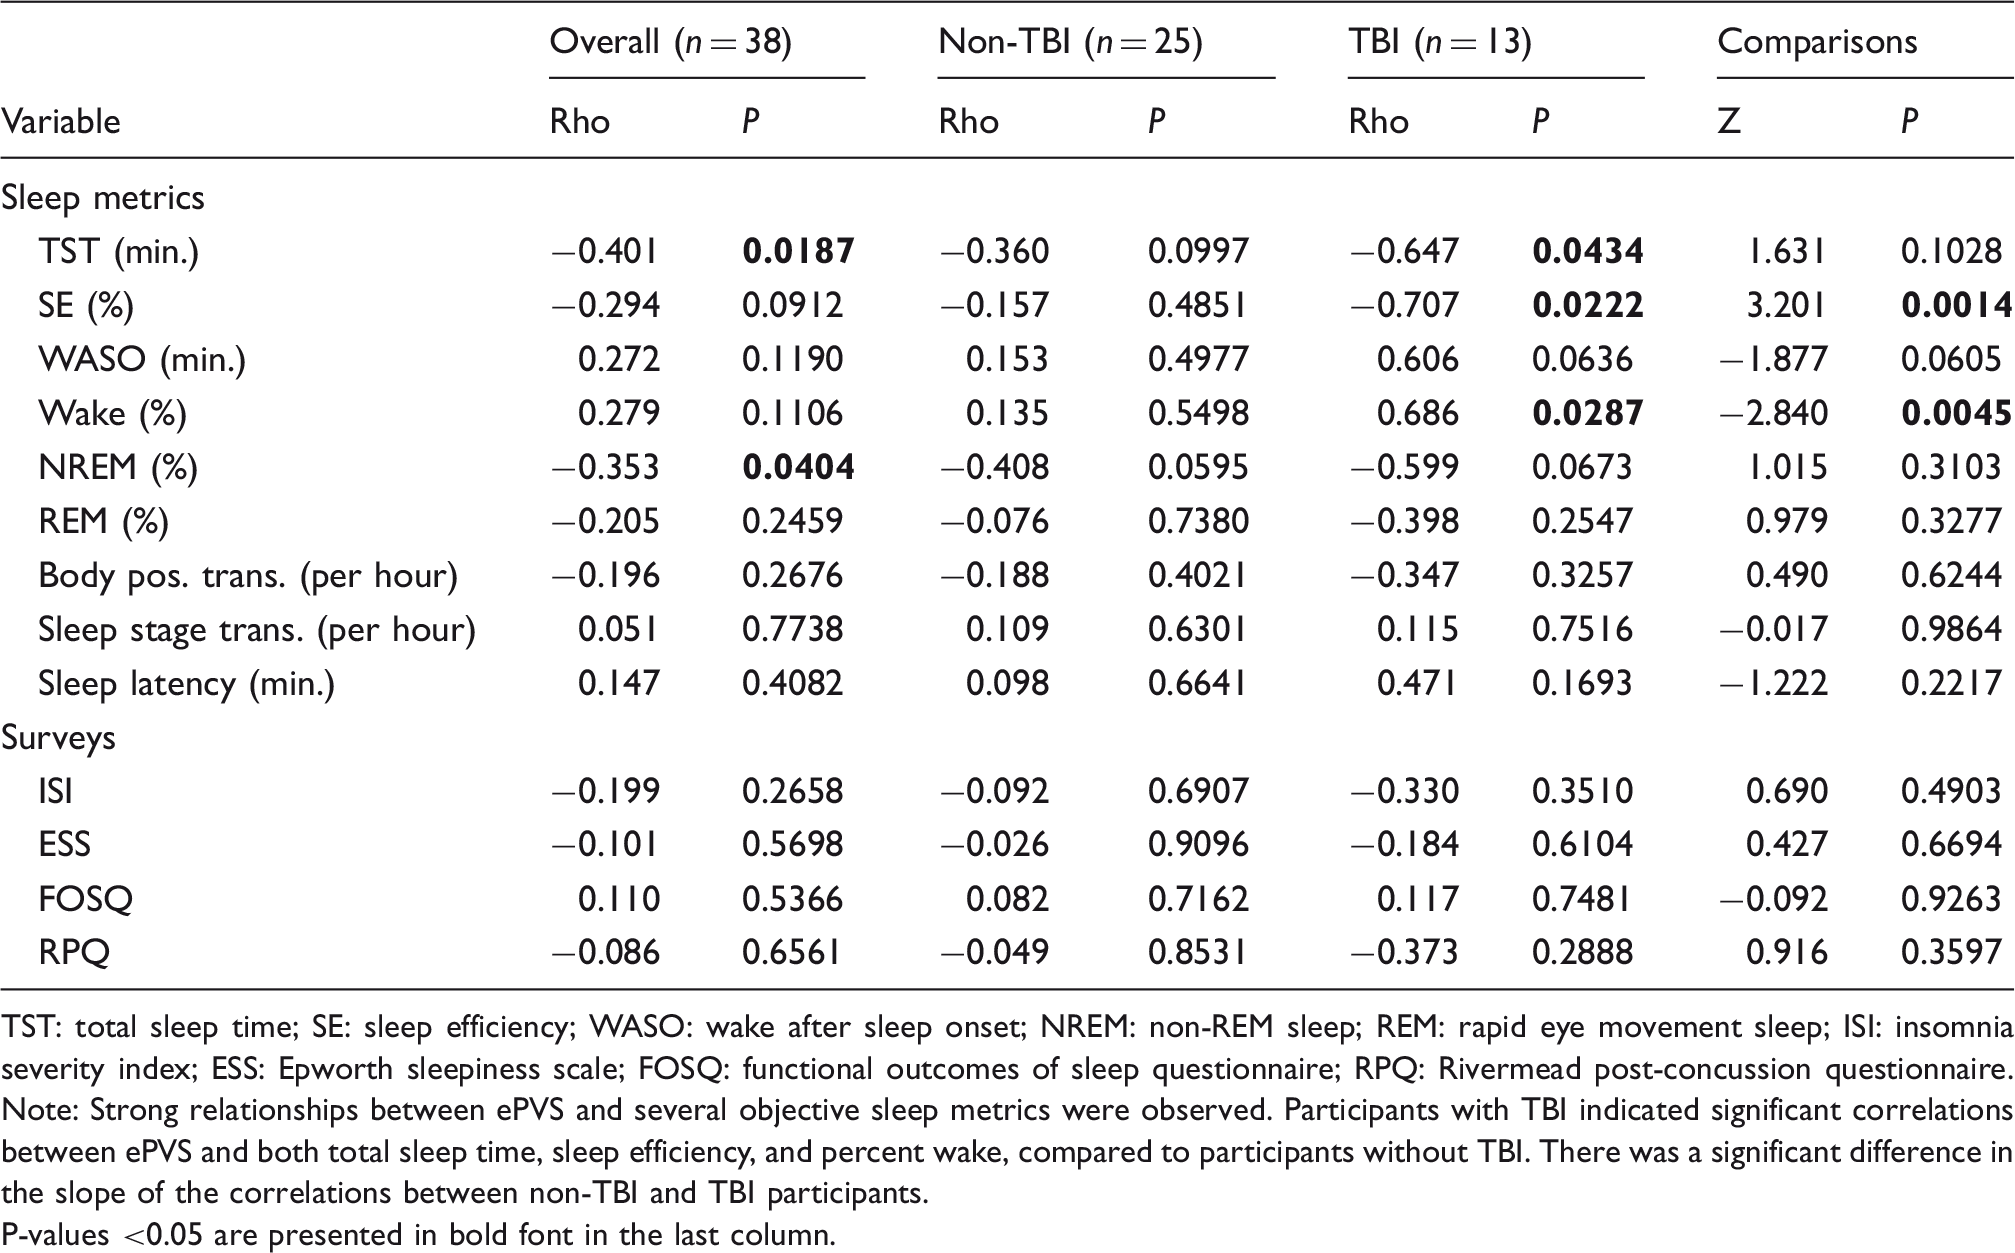
TST: total sleep time; SE: sleep efficiency; WASO: wake after sleep onset; NREM: non-REM sleep; REM: rapid eye movement sleep; ISI: insomnia severity index; ESS: Epworth sleepiness scale; FOSQ: functional outcomes of sleep questionnaire; RPQ: Rivermead post-concussion questionnaire.
Note: Strong relationships between ePVS and several objective sleep metrics were observed. Participants with TBI indicated significant correlations between ePVS and both total sleep time, sleep efficiency, and percent wake, compared to participants without TBI. There was a significant difference in the slope of the correlations between non-TBI and TBI participants. P-values <0.05 are presented in bold font in the last column.
A nested set of Spearman's rank correlations explored the relationships between TBI status, ePVS counts and sleep metrics. In this set of correlations, in the subset of participants with TBI, there was a significant relationship between increased ePVS counts and decreased TST (ρ = −0.65; P < 0.05), as well as decreased sleep efficiency (ρ = −0.71; P < 0.05) (Figure 4(a) and (b)). In contrast, there were no statistically significant relationships in non-TBI participants. Comparisons between the correlations using Fisher Z transformations showed significant differences between TBI and non-TBI groups for sleep efficiency (Z = 3.20; P < 0.01) and percentage of wake (Z = −2.84; P < 0.01) (Figure 4(b) and (c)).
Correlations between ePVS and sleep metrics, stratified by TBI. Panel (a) shows an overall significant inverse correlation between the number of ePVS and total sleep time, which remained statistically significant when subset for individuals with TBI. Panel (b) shows an overall significant inverse correlation between the number of ePVS and sleep efficiency, which remained statistically significant when subset for individuals with TBI. Panel (c) shows no significant overall correlation between the number of ePVS and time spent awake, although the correlation became statistically significant when only those with TBI were included. All statistics controlled for age, BMI, and OSA status.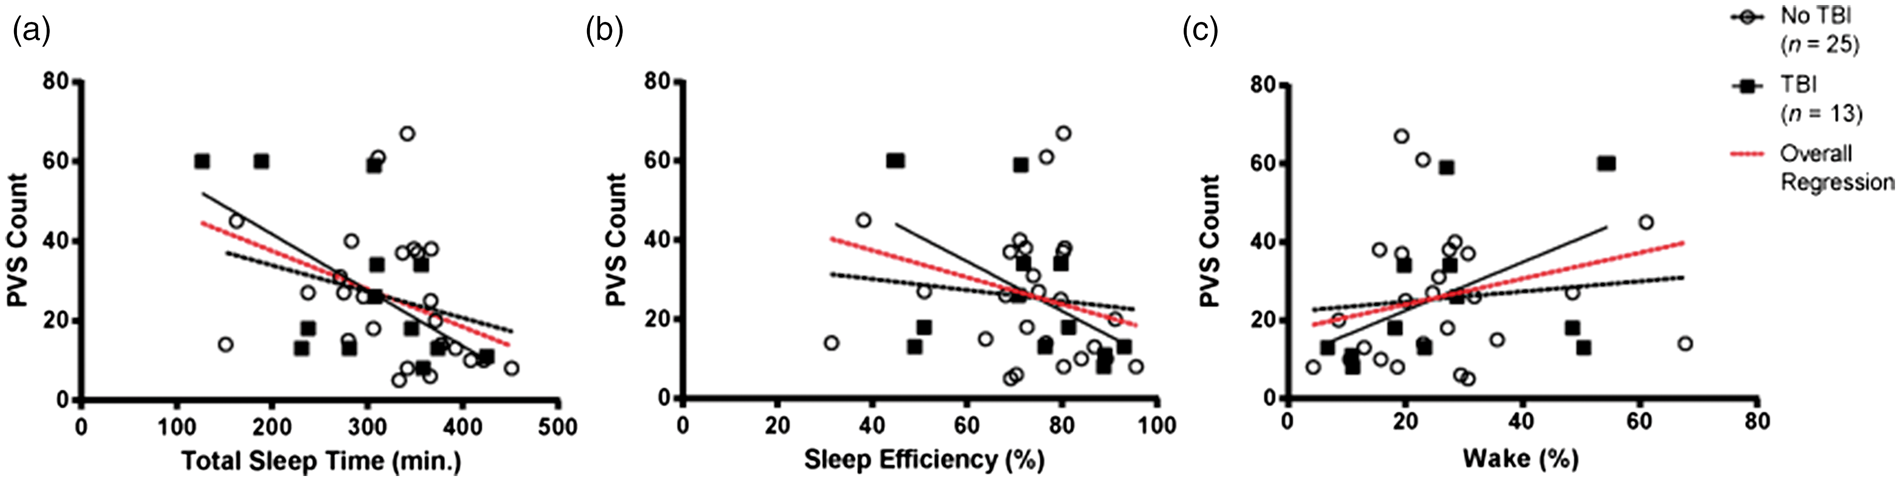
Discussion
In our data, increasing ePVS burden is independently associated with decreased total sleep time in our cohort overall, similar to one other reported finding. 15 In addition, our data showed that stratifying our cohort by TBI or No TBI modulated the relationship between sleep and ePVS: Individuals with TBI showed a stronger relationship between total sleep time and sleep efficiency and ePVS, compared to the non-TBI group. While the current data cannot address directionality or causality of the relationship between TBI, sleep, and ePVS, these data suggest that there may be a mechanistic link.
An unexpected outcome was the association between ePVS burden and decreased REM sleep. Again, while causality cannot be determined, these findings in particular suggest that higher ePVS burden may be mechanistically linked to a pathological brain state that may compromise the generation of REM sleep.
Because prior studies have reported an association between ePVS and Alzheimer's, dementia, and stroke, we examined the incidence of cognitive impairment, diabetes, stroke, and hypertension, as well as systolic and diastolic blood pressure between non-TBI and TBI patients in this study. There were no differences between groups. Because the incidence of clinical stroke was not significantly different between the non-TBI and TBI patients, and no cortical strokes were observed on MRI, it can be inferred that the incidence of lacunar stroke did not significantly differ between groups as well.
ePVS have historically been considered incidental radiological and/or pathological findings. However, recent radiological–pathological correlation has shown increased parenchymal and vessel-bound amyloid in brain tissue with increased ePVS burden,34,35 suggesting that ePVS may reflect insufficient amyloid clearance mechanisms. The recent characterization of the “glymphatic” system, a process of cerebrospinal fluid and brain interstitial fluid exchange across the perivascular space, has spurred reexamination of the significance of ePVS in the brain. Importantly, some studies suggest that ePVS may be markers of impaired glymphatic clearance.11,12
As interstitial proteins and peptides, including lactate, tau, and amyloid-β, from the brain parenchyma are cleared by the glymphatic system, failure of glymphatic clearance may contribute to the pathophysiology of AD and neurodegeneration associated with TBI.36–39 Accordingly, studies suggest that disruption of the glymphatic system by sleep deprivation can lead to accumulation of amyloid and other proteins.40,41 Traumatic brain injury (TBI) is a risk factor for neurodegeneration, including AD.39,42 In addition, TBI itself affects glymphatic flow and leads to impairment of interstitial solute clearance. 14 Because both sleep and TBI have been shown to modulate glymphatic function, our results support the notion that there may be a causative relationship between loss of glymphatic function and dilation of the perivascular space.
Limitations of this study include those common to retrospective studies, namely, analysis of a sample of convenience in which MRI and PSG were both clinically indicated, which could lend bias towards subjects with more neuroanatomical and sleep abnormalities compared to the general population. An additional consideration to note is that our cohort was enriched for sleep disorders (being recruited from a sleep clinic) – making it less likely to see group differences in sleep metrics between TBI and non-TBI subjects. While our sample size is comparable to prior reports of ePVS and sleep, 43 replication of these findings in in larger cohorts will serve to enrich this emerging field. Lastly, while in-laboratory PSG is a gold standard for sleep staging, the caveat is that it is only a single night's snapshot of an individual's sleep, and may not be representative of long-term sleeping patterns in the home.
Methodologically, this study used established visual rating scales to quantify ePVS in this study. Visual rating scales, as well as the categorical stratification of ePVS, were based upon previous work. 31 Limitations in MRI acquisition precluded more sophisticated (e.g. volumetric) methods. An aggregate value for ePVS counts was used because of the heterogeneous nature of TBI. This method runs the risk of smoothing over some differentiating properties of ePVS found in the white matter (e.g. CS), compared to those in the gray matter (e.g. BG). Some studies have found differences in the volume of ePVS found in BG and white matter in patient samples with differing ages represented.3,15 Furthermore, ePVS in the BG are implicated in different disease states (i.e. hypertensive arteriopathy) than those in the white matter (i.e. cerebral amyloid angiopathy). 44 When assessed as separate regions of interest, our findings did not suggest regional specificity, although this may have been due to the heterogeneous nature of TBI. Nevertheless, significant relationships were still identified that both recapitulate and extend current literature in the ePVS field. Future studies employing imaging protocols sufficient for automated segmentation methods, such as multimodal autoidentification of perivascular spaces (mMAPS), 45 which may allow higher spatial resolution, should be considered.
Footnotes
Funding
The author(s) disclosed receipt of the following financial support for the research, authorship, and/or publication of this article: VA Biomedical Laboratory Research & Development (BLR&D) Career Development Award (CDA) # IK2 BX002712, VA Rehabilitation Research & Development (RR&D) SPiRE Award, Portland VA Research Foundation, NIH EXITO Institutional Core, #UL1GM118964 to MML, NIH/NIA P30 AG008017 (ELB and LCS) and AG00817-28 (ELB), and Paul G. Allen Family Foundation to JMP, ELB, LCS, and MML.
Declaration of conflicting interests
The author(s) declared no potential conflicts of interest with respect to the research, authorship, and/or publication of this article.
Authors' contributions
Ryan Opel, analyzed and interpreted the data, and wrote the manuscript. Alison Christy, contributed to the experimental design, performed visual scoring of ePVS, and co-wrote the manuscript. Erin Boespflug, contributed to methodology, experimental design, and edited the manuscript. Kristianna Weymann, enrolled subjects in the repository and edited the manuscript. Brendan Case, performed visual scoring of ePVS and edited the manuscript. Jeffery Pollock, contributed to methodology, performed visual scoring of ePVS, and edited the manuscript. Lisa Silbert, contributed to experimental design and edited the manuscript. Miranda Lim, designed and oversaw the experiment, analyzed and interpreted the data, and co-wrote the manuscript.