
Abstract
Partial volume and mixed tissue sampling errors can cause significant inaccuracy in quantitative positron emission tomographic (PET) measurements. We previously described a method of correcting PET data for the effects of partial volume averaging on gray matter (GM) quantitation; however, this method may incompletely correct GM structures when local tissue concentrations are highly heterogeneous. We have extended this three-compartment algorithm to include a fourth compartment: a GM volume of interest (VOI) that can be delineated on magnetic resonance (MR) imaging. Computer simulations of PET images created from human MR data demonstrated errors of up to 120% in assigned activity values in small brain structures in uncorrected data. Four-compartment correction achieved full recovery of a wide range of coded activity in GM VOIs such as the amygdala, caudate, and thalamus. Further validation was performed in an agarose brain phantom in actual PET acquisitions. Implementation of this partial volume correction approach in [18F]fluorodeoxyglucose and [11C]-carfentanil PET data acquired in a healthy elderly human subject was also performed. This newly developed MR-based partial volume correction algorithm permits the accurate determination of the true radioactivity concentration in specific structures that can be defined by MR by accounting for the influence of heterogeneity of GM radioactivity.
Functional brain imaging using positron emission tomography (PET) permits quantitative in vivo measurement of regional cerebral metabolism, blood flow, and neuroreceptor concentration. The accuracy of quantitation of PET data is affected by its finite spatial resolution, which causes significant underestimation of the true isotope concentration in structures smaller than ∼2.5 times the full width at half-maximum (FWHM) (Hoffman et al., 1979; Kessler et al., 1984). Much of the prior work demonstrating this effect of underestimation of tracer concentration in small structures was performed using geometric phantoms consisting of hot spheres in a cold background (Mazziotta et al., 1981), a situation quite simplistic in comparison with that encountered in PET studies of the human brain. The accuracy of quantitative measurements of radioactivity in small volumes is further affected by the structure's shape, background, and z-axis sampling (Hoffman et al., 1979; Mazziotta et al., 1981; Kessler et al., 1984). Although the substantial effect of background radiation on the measurement of a hot spot was recognized by Kessler et al. (1984), the issue of heterogeneity of background was not addressed by these early experiments.
The underestimation of cortical activity in the presence of dilated CSF spaces due to partial volume effects is also a recognized source of error in PET measurements (Chawluk et al. 1987; Schlageter et al., 1987; Tanna et al., 1991). Several approaches to the correction of PET studies for the effects of atrophy have been described. Both Herscovitch et al. (1986) and Chawluk et al. (1987) have used ventricular and sulcal volumes derived from computed tomography (CT) to adjust whole-brain PET measurements of metabolism. A CT-based correction of regional PET data was reported by Fazekas et al. (1989). The superiority of magnetic resonance imaging (MRI) over CT tissue contrast for brain morphometric measurements (Condon et al., 1986a, b ) and lack of correction for axial resolution effects are limitations of these methods. Tanna et al. (1991) and Alavi et al. (1993) used MR-derived brain and CSF volumes to correct whole-brain metabolic rates in patients with Alzheimer disease and healthy elderly subjects.
We previously developed an MR-based two-compartment technique for partial volume correction of PET data, based on that described by Videen et al. (1988), which addressed the underestimation of quantitative cortical tracer measurements in the presence of dilated sulci (Meltzer et al., 1990b). However, this technique did not consider the effects of partial volume averaging between gray matter (GM) and white matter (WM), a potential limitation in the setting of aging or disease states in which the proportion of GM to WM may be altered (Hoedt-Rasmussen and Skinhoj, 1966; Miller et al., 1980; Creasey et al., 1986; Prohovnik et al., 1989; Rusinek et al., 1991; Lim et al., 1992). A modification of this approach using a spoiled gradient recall (SPGR) MR pulse sequence to obtain high-contrast differences among GM, WM, and CSF permitted the determination of cortical GM tracer concentration (Mueller-Gaertner et al., 1992). In this approach, pixels in the MR image were classified as one of three tissue components and proportionally weighted according to the relative contribution of each to the PET signal. Limitations of this latter approach include the assumption of homogeneous cortical GM activity and the undercorrection of small GM structures such as the amygdala, where spill-in of activity from surrounding structures greatly influences the apparent tracer concentration. We have developed an extension of this method that improves partial volume correction of heterogeneous GM radioactivity when structures of interest can be delineated by MR.
METHODS AND MATERIALS
Theory
The first steps in the algorithm are identical to those previously published (Mueller-Gaertner et al., 1992). An abbreviated version is presented here:
The observed PET image (Iobs) can be represented by the convolution (⊗) of the actual radioactivity distribution (Iactual), which is composed of a linear sum of the activity within the GM, WM, and CSF compartments, with the system resolution, as represented by h, the three-dimensional point spread function of the scanner:

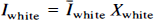
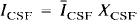
Of importance, h is assumed to be shift-invariant. The PET value for CSF (ĪCSF) and WM (Īwhite) is assumed to be homogeneous and known. Īwhite is obtained from Īobs by sampling the centrum semiovale, a large WM region near the frontal and parietal convexity. The spatial distribution of pixels in each of the three tissue compartments, GM, WM, and CSF, as determined by MR, is denoted as Xgray, Xwhite, and XCSF, respectively. These functions have a value of 1 for pixels within the compartment and 0 outside the compartment. Therefore, the radioactivity concentration in WM and CSF is given by
The actual radioactivity distribution for GM is unknown and heterogeneous and is given by
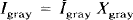
where Īgray indicates that the concentration within the GM is not assumed to be uniform.
Substituting into Eq. 1:

Rearranging,
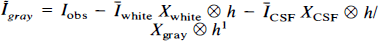
ĪCSF is assumed to be negligible and therefore assigned a value of 0, simplifying Eq. 6 to
The algebraic arrangement from Eq. 5 to Eq. 6 is permissible only if either Īgray is constant (i.e., spatially homogeneous) or h is a δ-function (i.e., the imaging system has perfect resolution). In practice, neither of these conditions is perfectly met, and the general approach is thus unable to completely recover Īgray. Our previous work (Mueller-Gaertner et al., 1992) indicated that the method was least successful for subcortical GM or small cortical GM “hot spots” (focal areas of increased activity). To account for heterogeneous Īgray, we have extended this three-compartment algorithm by including a fourth compartment: a GM volume of interest (VOI) such that IVOI ≠ Igray. Equation 1, therefore, takes the following form:

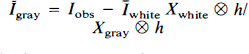
Since IVOI is unknown, the radioactivity due to the VOI is
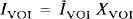
Equation 7 is modified to define IVOI:
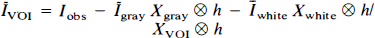
where Īgray is defined by the three-compartment correction, i.e., as the result of Eq. 7.
MR acquisition
MR data were acquired on a Signa 1.5 T scanner (General Electric, Milwaukee, WI, U.S.A.). SPGR MR (echo time = 5, repetition time = 65, flip angle = 45°, no. excitations = 2) images were acquired coplanar to the PET imaging planes (for phantom and human study), using an individually fitted thermoplastic facemask (Poly-splint; Poly-Med Manufacturing Co., Baltimore, MD, U.S.A.) and an MR-visible fiducial for plane localization (Meltzer et al., 1990a). Each MR data set consisted of 60 1.5-mm-thick contiguous images (24-cmfield of view, image matrix = 256 × 256 pixels, pixel size = 0.94 mm). The high-resolution, high-contrast SPGR MR data permitted accurate segmentation of GM, WM, and CSF and delineation of subcortical structures of interest.
PET acquisition
PET studies were performed on a GE 4096plus whole-body scanner. Each PET data set consisted of 15 images (in a 128 × 128 matrix with a 2-mm pixel size) with a slice separation of 6.5 mm. Transmission scans were utilized to correct PET data for attenuation. The data were corrected for decay and scatter and smoothed using a low-pass Hann filter (6-mm width, corresponding to a cut-off frequency = 0.33 Nyquist) to a final resolution of FWHM = 8.0 mm in the z-axis and 7.0 mm in-plane. Scanner resolution was measured empirically from point sources positioned in the center of the field of view.
Image processing
The MR data segmentation, convolution, and image manipulation steps necessary for partial volume correction and for the creation of simulated PET images were performed using Macintosh-based image analysis software (Digital Image Processing Station, Hayden Image Processing Group, Cleveland, OH, U.S.A.).
Computer simulations
SPGR MR image data acquired on two male subjects (aged 64 and 77 years) were segmented into GM, WM, and CSF elements by histogram analysis of the pixel intensities, as previously described (Mueller-Gaertner et al., 1992). The midpoints between adjacent pixel intensity peaks were used as cut-off values for defining pixels as GM, WM, or CSF. Simulated PET images were created by arbitrarily assigning GM, WM, and CSF pixels values as follows: CSF = 0, WM = 40, and GM = 120, and convolving the MR data with the PET point spread functions (z-axis FWHM = 8.0 mm, in-plane FWHM = 7.0 mm). Subcortical VOIs were defined by cylinders (oriented longitudinally in the z-axis) and ellipsoids in the anatomic position of the amygdala and were coded over a range of contrast values from equal to WM to four times GM and a range of sizes (at constant contrast of two times GM) (152, 429, 518, and 725 mm3, i.e., representative values from MR measurements of the amygdala in 10 patients with Alzheimer disease and 10 elderly controls). Additional subcortical VOIs were defined by the boundaries of the caudate and thalamus in the MR data set, and these structures were coded as 480 (i.e., four times GM). The center image in the MR data set used to create a simulated PET image corresponded to the z-axis midpoint of the subcortical VOI. A 6-mm z-axis shift between the center of the MR data set and the center of the caudate simulated z-axis undersampling of a structure of interest with PET.
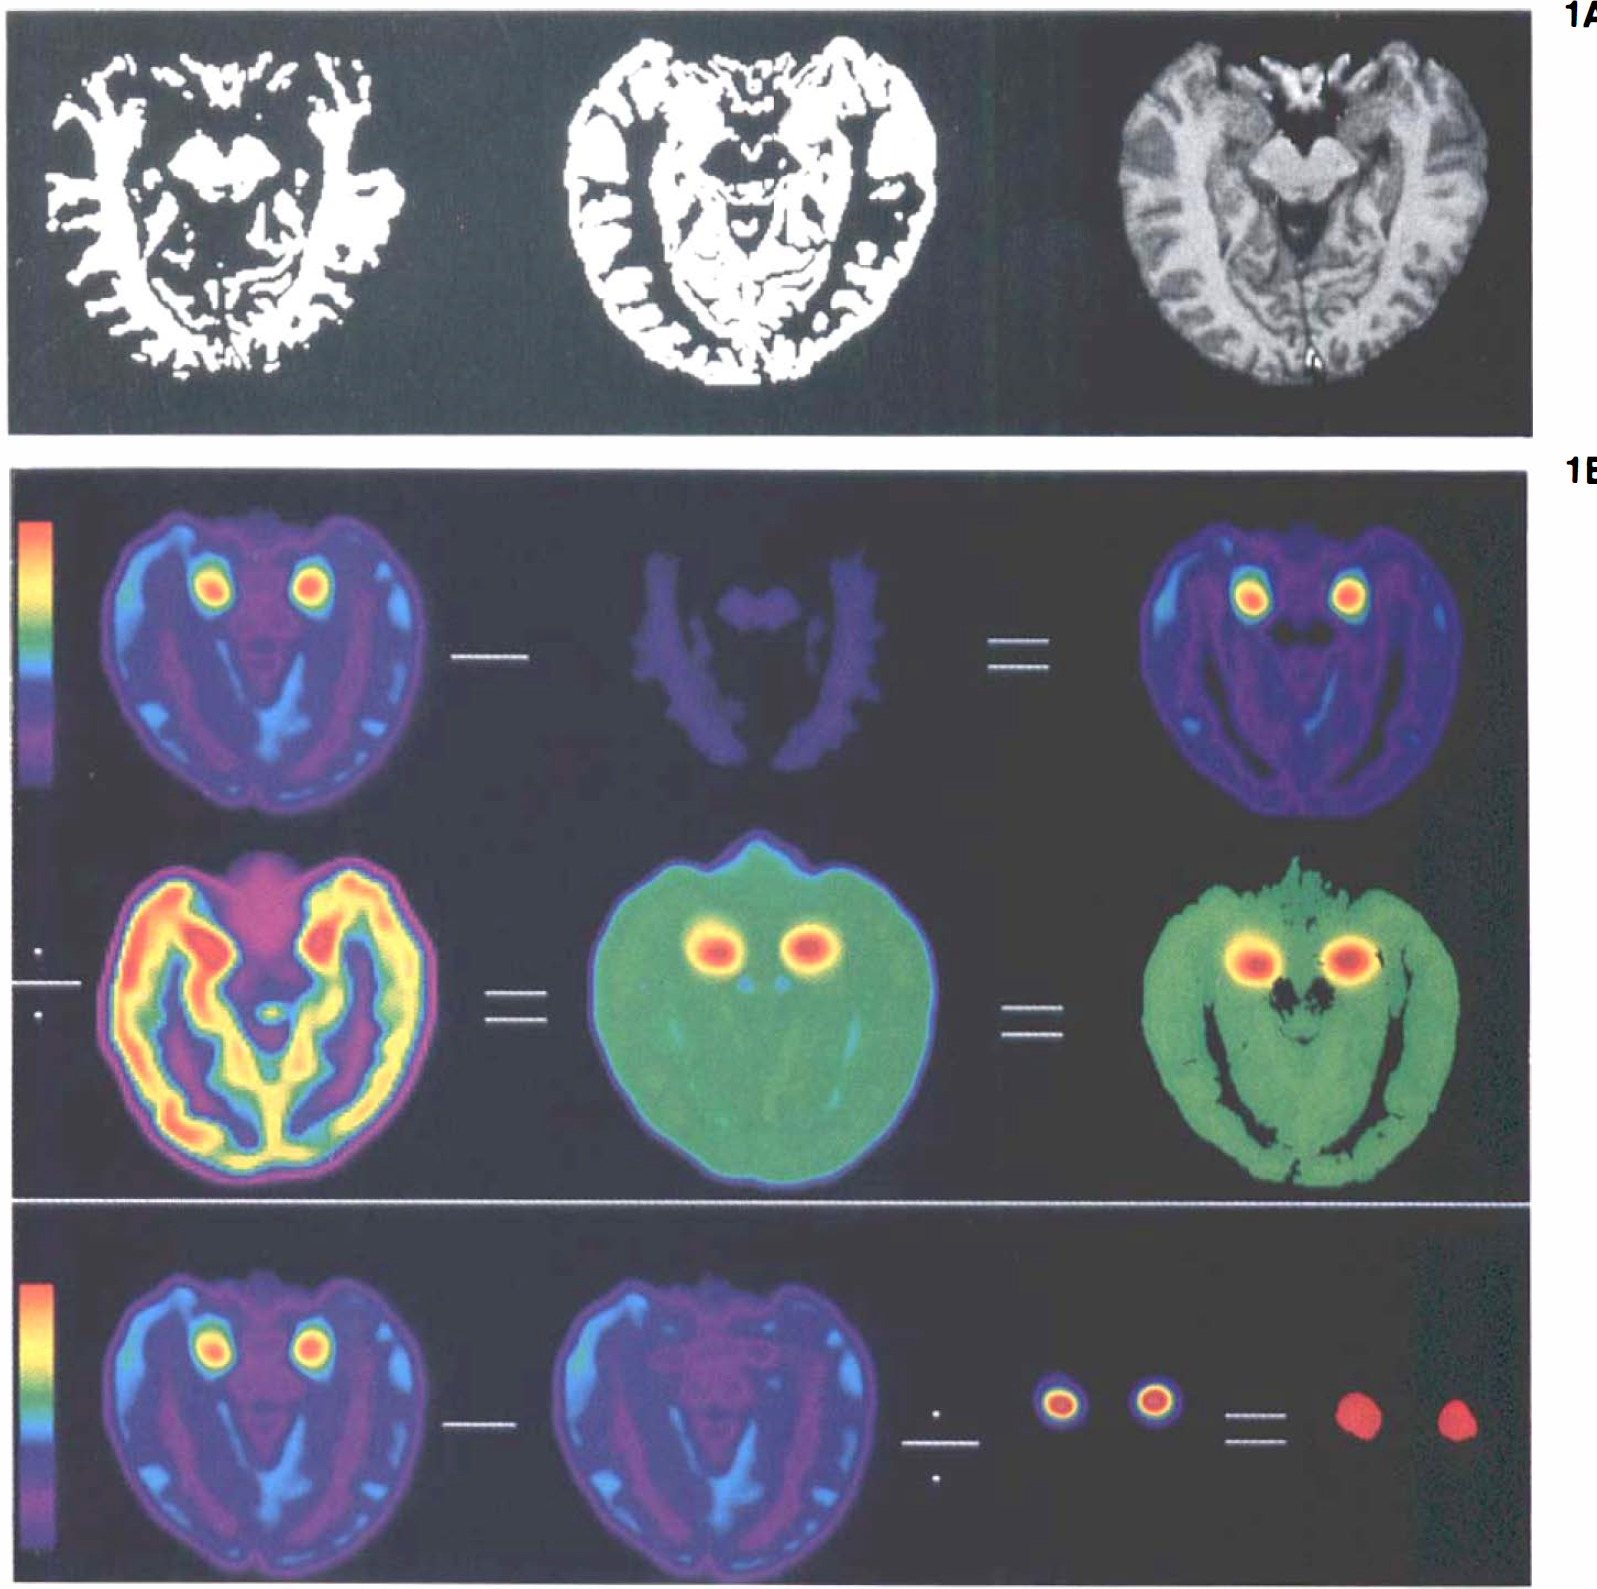
Four-compartment correction of quantitative measurements for subcortical VOIs was performed on the simulated PET data (Fig. 1). Data sampling was performed using ∼8 × 8 mm regions of interest (ROI) on both the simulated and the corrected PET data. Our previously published three-compartment technique of partial volume correction (Mueller-Gaertner et al., 1992) was also used to correct simulated PET measurements of the amygdala over a range of contrast values and sizes.
Phantom construction and imaging
A cylindrical phantom 6 cm in height and 12 cm in diameter was constructed using agarose and copper sulfate to simulate brain tissue (Mitchell et al., 1986) (Fig. 2; Table 1). Three main compartments representing cortical GM, WM, and CSF were separated by polyvinylacetate film (thickness = 1 mm) embedded in and sealed by wax. The thickness of the cortical ribbon and the gyral pattern were approximated from an MR image of a normal human subject. Two smaller compartments representing a small cortical hot spot and a subcortical nucleus such as the amygdala were placed within the GM compartment and within the WM compartment, respectively. The cortical subcompartment was created using a thin-walled plastic cylinder that had a diameter of 8 mm and extended the length of the phantom in the z-plane. The larger subcompartment, simulating a subcortical VOI, was a thin-walled ellipsoid with diameter of 15 mm and height of 6 mm (vol = 2.2 ml) suspended in the agarose matrix.
Correction of agar brain phantom PET data
Percentage error in ROI analysis of tracer concentration in the GM, large VOI, and small cortical hot spot compartments are shown pre- and postcorrection. The three-compartment correction was used to derive a corrected GM value, which was then used in the four-compartment correction of the two VOIs. See text for abbreviations.
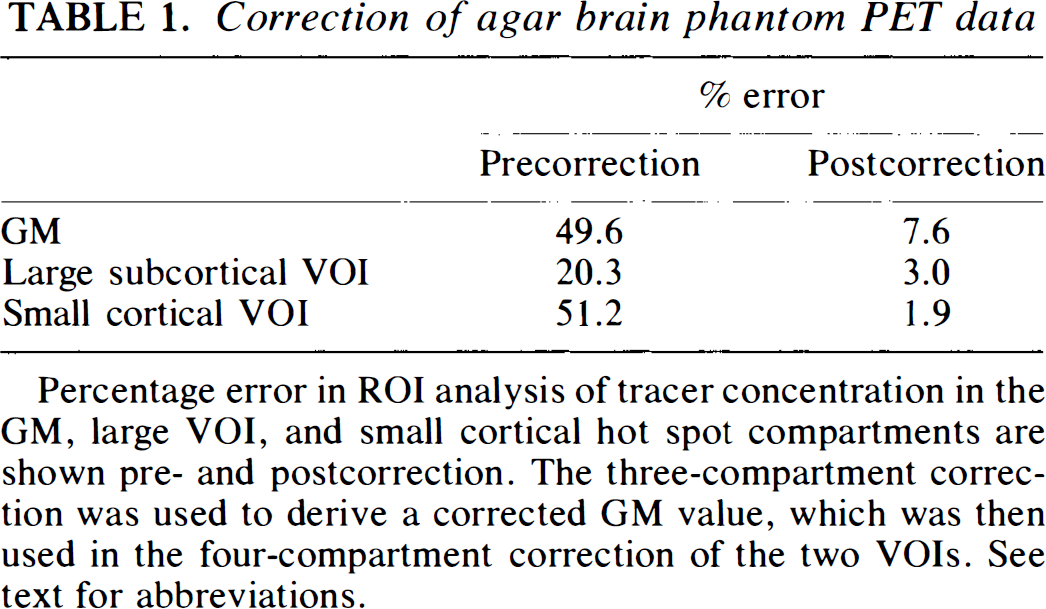
Four-compartment correction of agarose brain phantom showing steps as performed in the computer-simulated images in Fig. 1B.
Each compartment was filled with a 1–2% warm (75°C) agarose solution containing 0.6 mM copper sulfate and 1.0 μCi/ml 18F for the GM compartment, 1.1 mM copper sulfate and 0.4 μCi/ml 18F for the WM compartment, and 1.8 mM copper sulfate and 2.1 μCi/ml 18F for the two hot VOI compartments. The CSF compartment contained no copper sulfate or 18F. The copper sulfate concentrations were varied for each compartment to achieve tissue contrast similar to that observed in SPGR MR data of the human brain.
PET data of the phantom were acquired and compared with those of three 1-L beakers, each filled with one of the three agarose solutions (i.e., those used to fill the GM, WM, and cortical/subcortical VOI compartments of the phantom), which were each scanned separately. The true tracer concentration of each compartment in the phantom could thus be determined without the effects of partial volume averaging with neighboring areas of differing activity. MR data were also acquired on the agarose brain phantom.
The MR data set of the phantom was segmented using histogram analysis of the pixel intensities in the GM, WM, CSF, and VOI compartments. A WM image was created by assigning all WM pixels the value achieved by sampling a large WM area in the PET image of the phantom with five 8 × 8 mm (2-mm/pixel) ROI. A GM image was created by assigning all GM pixels a value of 1 and all non-GM pixels a value of 0. Similarly, VOI images were created by assigning pixels corresponding to each of the two VOIs a value of 1 and all other pixels a value of 0. These single-compartment images were then convolved with the z-axis and in-plane point spread functions of the PET and smoothed with the identical low-pass filter applied to the PET image to achieve the same final resolution. CSF pixels were assigned a value of 0. Partial volume correction for GM was performed as described earlier. The corrected GM value thus achieved was then assigned to GM pixels in the MR data set and a “true” GM image created. The WM and “true” GM images were used to determine a corrected tracer concentration for the subcortical and cortical hot spot compartments.
Sampling of the subcortical and cortical VOIs was performed before and after partial volume correction, using 8 × 8 mm ROIs.
Human study
The four-compartment correction was performed on [18F]fluorodeoxyglucose (FDG) and [11C]carfentanil (CFN) PET data acquired on a 69-year-old healthy man (Frost et al., 1985, 1988). For the FDG PET study, images were acquired over a 20-min interval beginning 30 min following a 5-mCi tracer dose of FDG. For opiate receptor imaging, scans were acquired over 90 min following intravenous injection of 20 mCi CFN and summed over the interval 35–70 min postinjection (Frost et al., 1988). FDG studies were performed under conditions of eyes blindfolded and ears plugged. Paired 8 × 8 mm (2-mm/pixel) ROIs were used to sample the cortex and amygdalas before and after correction.
RESULTS
Computer simulations
Comparison among simulated PET data in the uncorrected state, application of the previously published three-compartment correction (Mueller-Gaertner et al., 1992), and following four-compartment correction of VOIs of varying contrasts and sizes are shown in Figs. 3 and 4. Over a variety of contrasts, ranging from 0.3 to 2.0 times GM concentration, errors in the recovery of assigned values in cylindrical VOIs observed in the uncorrected simulated PET data were as follows: 120.0, 15.0, 24.3, 31.9, 37.2, 47.9, and 64.6% at contrast ratios of 0.3, 1.0, 1.2, 1.3, 1.5, 2.0, and 4.0 (contrast ratio = assigned value/GM value), respectively (Fig. 3). Three-compartment correction of GM activity resulted in errors of 145.0, 0.8, 10.7, 19.4, 25.6, 38.3, and 57.7% at the same contrast ratios. In both the uncorrected and the three-compartment corrected data, the largest errors occurred when activity in the VOI differed most from surrounding GM activity. Underestimation of assigned tracer concentration was observed when the VOI value was greater than neighboring tissue, and overestimation occurred when the VOI was colder than the surround. Four-compartment correction recovered the assigned VOI value with a maximum error of 1.9% (mean error = 1.3 ± 0.6% SD).

Comparison of uncorrected simulated PET data (⚄) and three- () and four-compartment (▪) correction of the amygdala. The uncorrected data overestimate tracer concentration in the amygdala when the coded activity is lower than that of GM due to spill-in activity from surrounding GM structures. Underestimation of uncorrected amygdala activity is seen when the amygdala is hotter than surrounding brain. Full recovery is achieved only with the four-compartment method over a range of coded amygdala values. See text for abbreviations.

Three- () and four-compartment (▪) correction of amygdalas of different sizes in computer-simulated PET data. Substantial underestimation in percent recovery of the coded amygdala value is observed in the uncorrected data (⚄) with a mild effect of worsening recovery with decreasing amygdala size. Three-compartment correction results in mild improvements in recovery over the uncorrected data. Four-compartment correction results in full recovery of coded values over a range of amygdala sizes.
The effect of size of the GM VOI was demonstrated with ellipsoid amygdalas ranging in size from 152 to 725 mm3. ROI sampling of VOI tracer concentration in the simulated PET data resulted in errors ranging from 39.1 to 49.7%. This error decreased to 27.7–41.9% following three-compartment correction and to 0–0.4% with four-compartment correction (Fig. 4).
Four-compartment correction of the thalamus and caudate in a simulated PET resulted in complete recovery of the coded value as compared with 14.8 and 50% underestimation in the uncorrected data, respectively. Full recovery was also achieved by four-compartment correction of a caudate that was positioned at a 6-mm offset from the z-axis center of the simulated PET slice, whereas underestimation of 64.4% was demonstrated in the uncorrected simulated PET (i.e., an additional underestimation of true caudate value by 14.4% over that obtained with the caudate aligned with the z-axis center of the PET slice).
Agarose brain phantom
The uncorrected PET image of the phantom demonstrated a 49.6% underestimation in the cortical GM compartment (Table 1). This error decreased to 7.6% following three-compartment correction. The error associated with measurement of the large VOI and smaller cortical hot spot decreased from 20.3 and 51.2% in the uncorrected data to 3.0 and 1.9% following four-compartment correction, respectively. There was a 2.5% error in the determination of WM tracer concentration from the PET image of the phantom as compared with that of the beaker containing only WM agarose.
Application to human PET data
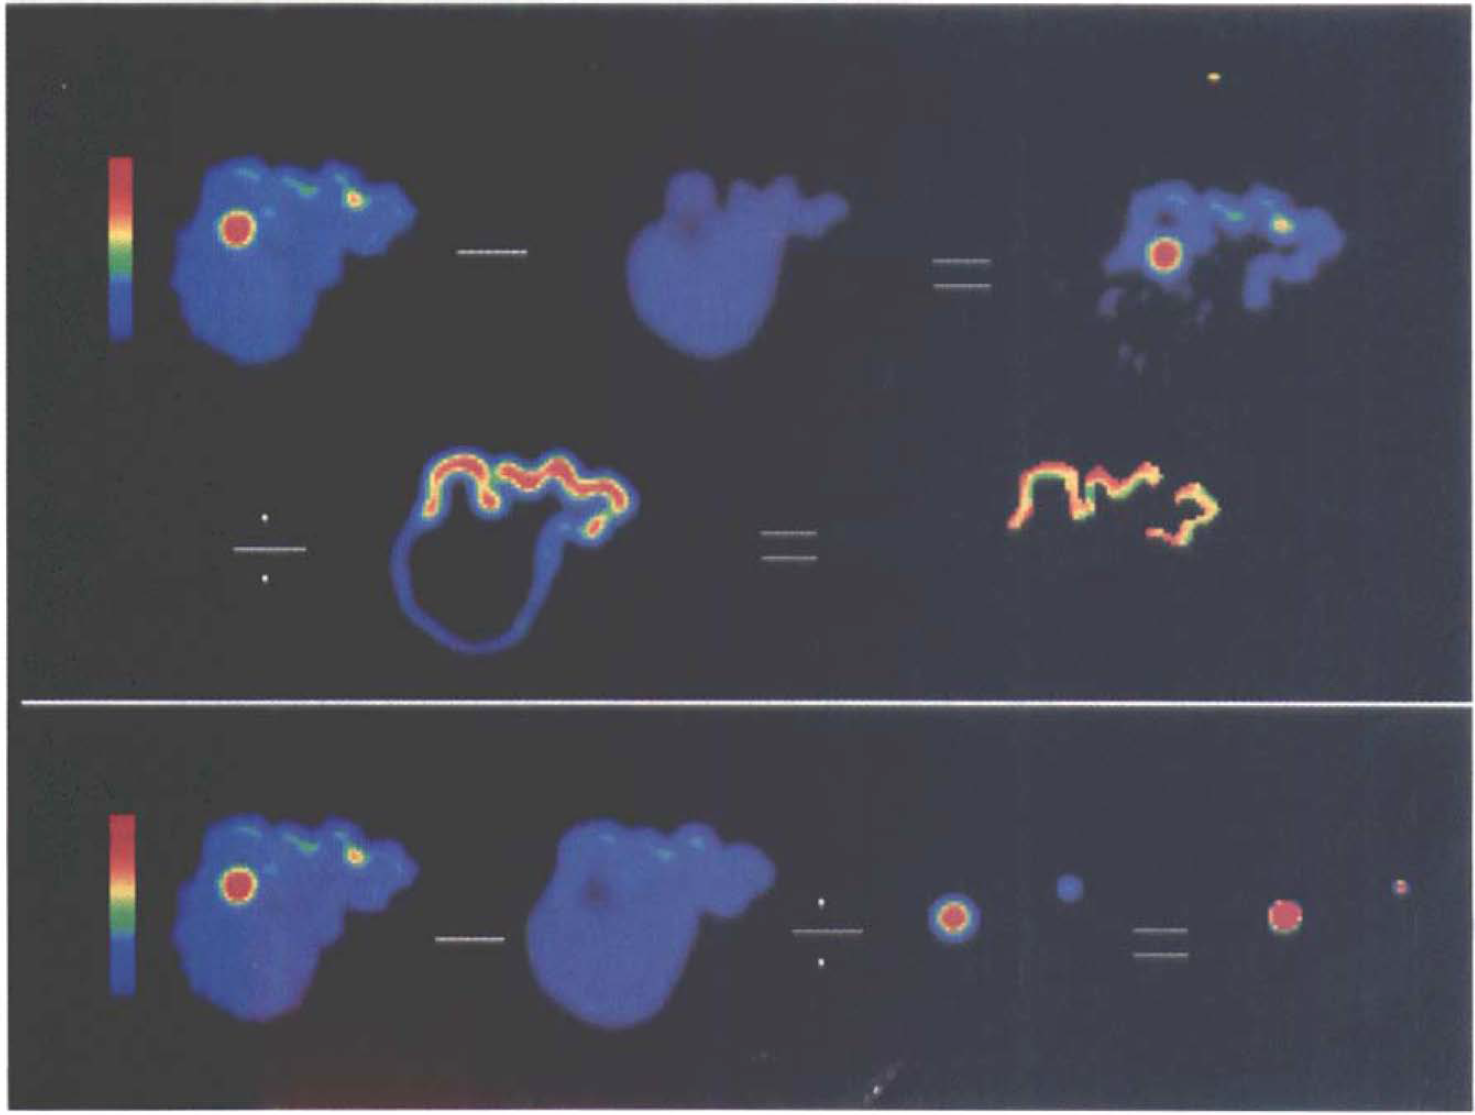
Figure 5 demonstrates partial volume correction of single-slice CFN PET data in an elderly human subject. Cortical GM activity increased 55% in the CFN and 53% in the FDG data after three-compartment correction. Four-compartment correction of CFN amygdala activity resulted in an uncorrected-to-corrected ratio of 1.2. In the case of FDG, the corrected-to-uncorrected mean amygdala value was 0.7. In the FDG images, the corrected GM activity was 2.9 times greater than corrected amygdala activity, implying that spill-in from the surrounding hotter GM resulted in overestimation of the observed amygdala activity in the uncorrected FDG image.
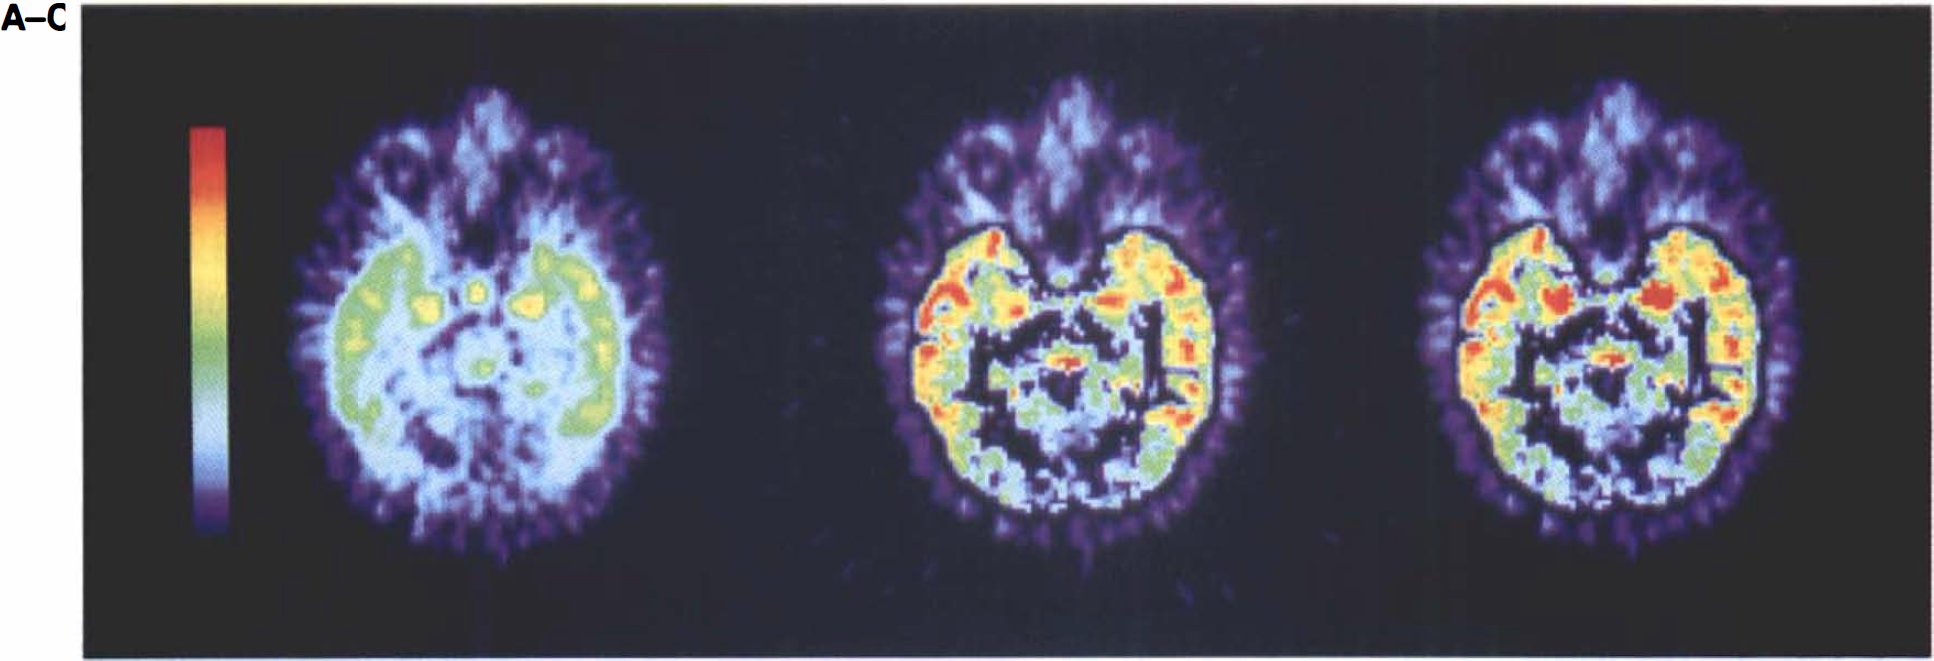
Partial volume correction of [11C]carfentanil PET image in an elderly man.
DISCUSSION
Partial volume and mixed tissue sampling errors can significantly influence the quantitative accuracy of PET. We and others have previously described approaches that attempt to account for some or all of these errors. We previously published the implementation of a two-compartment correction method for partial volume correction of PET data (Meltzer et al., 1990b), which uses MR data to correct PET measurements for the partial volume effects caused by metabolically inactive CSF spaces. The two-compartment correction method does not take into consideration partial volume averaging of GM and WM activity, which is inherent given the typical differences in activity in GM and WM. Since the proportion of GM and WM may be altered in disease states and normal aging, simply correcting for brain-CSF partial volume effects may confound the comparison of such subjects with young healthy individuals (Miller et al., 1980; Prohovnik et al., 1989; Rusinek et al., 1991; Lim et al., 1992). A three-compartment modification additionally corrected for potential differences in the GM/WM proportions between groups by determining the tracer concentration of cortical GM (Mueller-Gaertner et al., 1992). The major advantage of the new procedure for partial volume correction of PET images over the two- and three-compartment approaches to partial volume correction for PET previously published (Meltzer et al., 1990b; Mueller-Gaertner et al., 1992) is the accurate correction of small subcortical structures and irregular objects such as small cortical VOIs that can be defined by MR. Application of the four-compartment extension permits valid comparison of radioactivity concentration in selected brain regions between healthy control subjects and patients in whom the structure of interest may be morphologically reduced in size. This method would also allow partial volume correction of specific small cortical regions that exhibit abnormal signal on MR and may be expected to differ in metabolic activity or receptor concentration from surrounding tissue. Delineation of the structure of interest by MR is a requisite parameter for the algorithm. The actual GM PET radioactivity concentration of GM regions identified by functional MR techniques may also be potentially derived by this method.
The accurate determination of the true tracer concentrations in heterogeneous GM achieved with this partial volume correction technique represents a significant advantage over the previously published three-compartment method (Mueller-Gaertner et al., 1992). Validation of the four-compartment correction in simulated PET images created from human brain MR data demonstrated an error of <2% in the determination of a wide range of assigned activity values in GM VOIs such as the amygdala, caudate, and thalamus. Undercorrection of small structures such as the amygdala with the three-compartment approach is due to partial volume averaging between areas of relatively high radioactivity and surrounding structures with lower tracer concentrations (Figs. 3 and 4). The four-compartment model removes this source of error by defining a VOI as having a different tracer concentration from neighboring structures. Full correction of cortical VOIs with the three-compartment approach is achieved when such areas are large in size relative to scanner resolution. Small cortical VOIs that do not span the full z-axis thickness of the PET slice would behave similarly to subcortical structures, and in this case, full correction would be expected only with the four-compartment modification.
The correction algorithm was further validated in a PET acquisition of an agarose brain phantom (Mitchell et al., 1986) with heterogeneous radioactivity distribution (Fig. 2; Table 1). The phantom used in the current work differs from that used by Mueller-Gartner et al. (1992) in that a subcortical structure and heterogeneity in the cortical activity were introduced. This additional level of complexity provides a more realistic representation of PET data in a human brain. Furthermore, validation studies using the agarose brain phantom may more closely reflect the accuracy of this correction technique as applied to human PET studies than the computer-simulated PET data. The slightly larger error associated with partial volume correction of the phantom over that obtained with the computer simulations may be due to several factors. Such potential sources of error include registration of the PET and MR data sets, which was not a factor in the computer simulations. The acquisition of coplanar PET and MR data was performed using the method developed by Meltzer et al. (1990a) with subsequent visual overlay of coplanar data sets. However, a variety of approaches to the registration of PET and MR data sets may be used (Levin et al., 1988; Evans et al., 1991; Kapouleas et al., 1991). The addition of fiducial markers visible on the PET and MR may further increase the accuracy of registration of the morphologic and functional image data (Evans et al., 1991), but these factors were beyond the scope of the current work.
In the human PET studies, four-compartment correction of CFN PET data resulted in a mean increase of 18% in amygdala activity. A larger increase in surrounding GM activity after correction resulted in very similar corrected values for the amygdala and temporal lobe GM, both known areas of high binding (Frost et al., 1985, 1988). In the case of FDG, the corrected amygdala activity was lower than the uncorrected value. This suggests that spill-in from surrounding “hotter” GM was artifactually elevating the apparent amygdala radioligand concentration in the uncorrected images. Although the true metabolic activity in human amygdala is unknown, autoradiographic data acquired in rats using [14C]deoxyglucose have demonstrated activity in individual nuclei to be lower than in surrounding cortical structures, with amygdala-to-cortical ratios as low as 0.5 (Laurie and Pratt, 1993; Hammer and Cooke, 1994). Additionally, the amygdala is not a pure GM structure but rather is composed of several nuclei with interposed WM tracts. Therefore, the mean metabolic activity of the amygdala may be expected to be lower than cortical GM due to the influence of WM that is metabolically less active.
ROI size may affect recovery of tracer concentration in both uniform and nonuniform backgrounds (Hoffman et al., 1979; Mazziotta et al., 1981; Kessler et al., 1984; J.M. Links et al., in press). ROIs that are small relative to the size of the structure of interest will yield higher accuracy but have a tendency toward greater noise than large ROIs. For our analyses, ROI size was kept uniform and smaller than the dimensions of the smallest VOI to reduce mixed tissue sampling and maintain a consistent contribution of noise. Irregularly shaped ROIs with borders conforming in shape but within the true borders of the VOI would be an alternative approach toward optimizing the balance between accuracy and noise.
A potential source of error in the correction method is the process of segmentation of the MR pixels into the various tissue compartments. Partial volume averaging of tissues with differing signals, particularly at ventricular and sulcal margins and GM/WM interfaces, results in mixed pixels with signal intensities intermediate between those of the pure tissue types. Errors due to inaccurate segmentation would not be reflected in the computer simulations since the simulated PET images were created from MR data with identical segmentation. The thresholding approach used in this study employs a histogram analysis of pixel intensities and requires the assumption of a Gaussian distribution of pixel intensities within each tissue compartment, which is closely approximated (Mueller-Gaertner et al., 1992). A variety of alternative approaches to segmentation may be incorporated into the four-compartment partial volume correction method (Lim and Pfefferbaum, 1989; Hillman et al., 1991; Kohn et al., 1991; Coffey et al., 1992; Bonar et al., 1993). Manual structure outlining (Coffey et al., 1992), thresholding techniques (Lim and Pfefferbaum, 1989), and feature space analysis (Bonar et al., 1993) have been used to quantitatively distinguish brain tissue compartments with human MR data. Utilizing MR signal intensity information from two echoes in a spin echo pulse sequence may offer an additional advantage over techniques that employ a single MR data set (Lim and Pfefferbaum, 1989; Kohn et al., 1991). Further optimization of the selected MR pulse sequence for improved GM/WM/CSF contrast may facilitate greater accuracy of tissue segmentation. Furthermore, minimization of the time of data acquisition is a critical consideration to avoid patient motion artifact, which may seriously degrade image quality.
Inherent in the correction algorithm is the assumption of homogeneity of activity within the CSF and WM compartments and within the structure of interest. The smallest element that may be corrected must be definable on MR; therefore, subcomponents of structures are addressed similarly if they cannot be differentiated with MR. Although the four-compartment partial volume correction method represents an improvement over previous approaches, it remains overly simplistic relative to the complexity of the human brain. The correction of multiple neighboring structures of differing activity would require incorporating additional compartments into the final algorithm. The inclusion of multiple additional compartments (XVOI1, XVOI2, XVOI3…) might be approached through an iterative algorithm, but error propagation may limit the utility of this modification. The potential interaction of several adjacent regions with different radioactivity values, Igray1 ≠ Igray2 ≠ Igray3…, creates a more complex situation that is not addressed in this work.
The fundamental derivation and practical implementation of our approach assume a shift-invariant three-dimensional point spread function, with a two-dimensionally rotationally symmetric in-plane response. Neither shift invariance nor in-plane rotational symmetry holds for our scanner. However, for a brain positioned in the center of the (whole-body-sized) gantry, radial elongation of the in-plane point spread function is negligible, and the FWHM varies by a maximum of 0.4 mm. Thus, these simplifying assumptions are probably not a major source of error, although they likely contribute to the discrepancies in performance between the computer simulations and actual brain phantom experiments.
In summary, we present a four-compartment approach to partial volume correction of PET data, which represents a substantial improvement in accuracy over previous methods. This method permits the determination of the true radioactivity concentration in heterogeneous GM when specific regions of potentially different tracer concentration from neighboring structures can be defined by MR. The accuracy of this approach has been demonstrated in computer simulations of brain PET images derived from human MR data. Further validation in an agarose brain phantom and implementation in actual PET data from a healthy elderly subject were performed. The four-compartment correction method eliminates the substantial error caused by partial volume effects, permitting greater accuracy of quantitative PET measurements in selected brain regions of healthy control subjects and patients with cortical or subcortical atrophy.