
Abstract
Dysfunction of the glymphatic system, an intracranial clearance pathway that drains misfolded proteins, has been implicated in the onset of Parkinson’s disease (PD). Recently, the coupling strength of global blood-oxygen-level-dependent (gBOLD) signals and cerebrospinal fluid (CSF) inflow dynamics have been suggested to be an indicator of glymphatic function. Using resting-state functional magnetic resonance imaging (MRI), we quantified gBOLD–CSF coupling strength as the cross-correlation between baseline gBOLD and CSF inflow signals to evaluate glymphatic function and its association with the clinical manifestations of PD. We found that gBOLD–CSF coupling in drug-naïve PD patients was significantly weaker than that in normal controls, but significantly stronger in patients less affected by sleep disturbances than in those more affected by sleep disturbances, based on the PD sleep scale. Furthermore, we collected longitudinal data from patients and found that baseline gBOLD–CSF coupling negatively correlated with the rate of change over time, but positively correlated with the rate of change in UPDRS-III scores. In conclusion, severe gBOLD–CSF decoupling in PD patients may reflect longitudinal motor impairment, thereby providing a potential marker of glymphatic dysfunction in PD.
Keywords
Introduction
Parkinson’s disease (PD), the second most common neurodegenerative disease, is clinically characterized by motor dysfunction, which is attributed to the progressive loss of dopaminergic (DA) neurons in the substantia nigra (SN) and accompanied by aggregation of misfolded alpha-synuclein (α-syn).1–4 However, the mechanism of α-syn clearance is not completely understood.
The glymphatic system is a recently discovered continuous fluid-clearance pathway that drains misfolded proteins such as α-syn from the brain along perivascular spaces (PVS), formed by the endfeet of astrocytes that surround the arterioles and venules.5–8 The glymphatic clearance system promotes the convective flow between interstitial fluid and cerebral fluid, ultimately merging in the downstream extra-cranial lymphatic networks.9,10 Glymphatic clearance is promoted during sleep and is tightly regulated by circadian rhythms,10,11 whereby even one night of sleep deprivation resulted in an increased Aβ burden significantly. 12 Moreover, an increasing number of studies have suggested a potential functional role of the glymphatic system in neurodegenerative diseases.13–18 However, most data have been derived from animal models or tracer-based in vivo imaging. While these studies have provided invaluable insight into glymphatic system physiology, the methods are not translatable for in vivo human studies. 19 Thus, less invasive and more direct imaging strategies are urgently needed to better characterize the role of glymphatic clearance in clinical PD pathophysiology. 19 Diffusion tensor magnetic resonance imaging (MRI) has been used to visualize glymphatic function; but it cannot accurately reflect the dynamic aspects of the glymphatic system.20,21
Global blood oxygen level-dependent (gBOLD) resting-state functional MRI (rs-fMRI) signals of <0.1 Hz have been associated to cerebrospinal fluid (CSF) dynamics. Therefore, low-frequency oscillations in CSF is a possible resource to non-invasively quantify glymphatic system dynamics.22–26
In this study, we aimed to compare the strength of gBOLD–CSF coupling between drug-naïve PD patients and healthy individuals. Follow-up visits after 1.94 ± 0.86 years also allowed us to conduct a longitudinal study of the effect of gBOLD–CSF coupling on the progression of motor and non-motor deficits in PD. Furthermore, as all of our PD patients were affected by sleep-related symptoms, we explored the association between gBOLD–CSF coupling and sleep disturbances.11,24,27,28 Most studies conducted to date have primarily been based on cross-sectional data, and longitudinal evaluation is limited. Therefore, we believe our study provides a novel insight into the role of the glymphatic system in patients with PD.
Materials and methods
Participants
The ethics committee of the Second Affiliated Hospital of Zhejiang University approved this study. All participants provided written informed consent in accordance with the principles of the Declaration of Helsinki. Data were obtained from drug-naïve patients clinically diagnosed with idiopathic PD from the Second Affiliated Hospital, Zhejiang University School of Medicine, from August 2014 to November 2021. PD patients were diagnosed according to the Movement Disorder Society Clinical Diagnostic Criteria. Age- and sex-matched healthy individuals were recruited from the community as normal controls (NC). The following exclusion criteria were applied: (1) parkinsonism attributed to immune disease, metabolic disease, trauma, or other secondary factors; (2) presence of additional neurodegenerative diseases simultaneously such as Alzheimer’s or Huntington’s disease; (3) patients with a medical history of stroke or intracranial arteriovenous malformation; (4) cerebral structural abnormalities, such as those resulting from brain trauma or brain tumor; (5) severe cognitive dysfunction, as determined by Montreal Cognitive Assessment (MoCA) scores less than 10 and/or Minimum Mental State Examination (MMSE) less than 9; (6) left- or bilateral-handed patients; and (7) inability to undergo MRI (Figure 1).
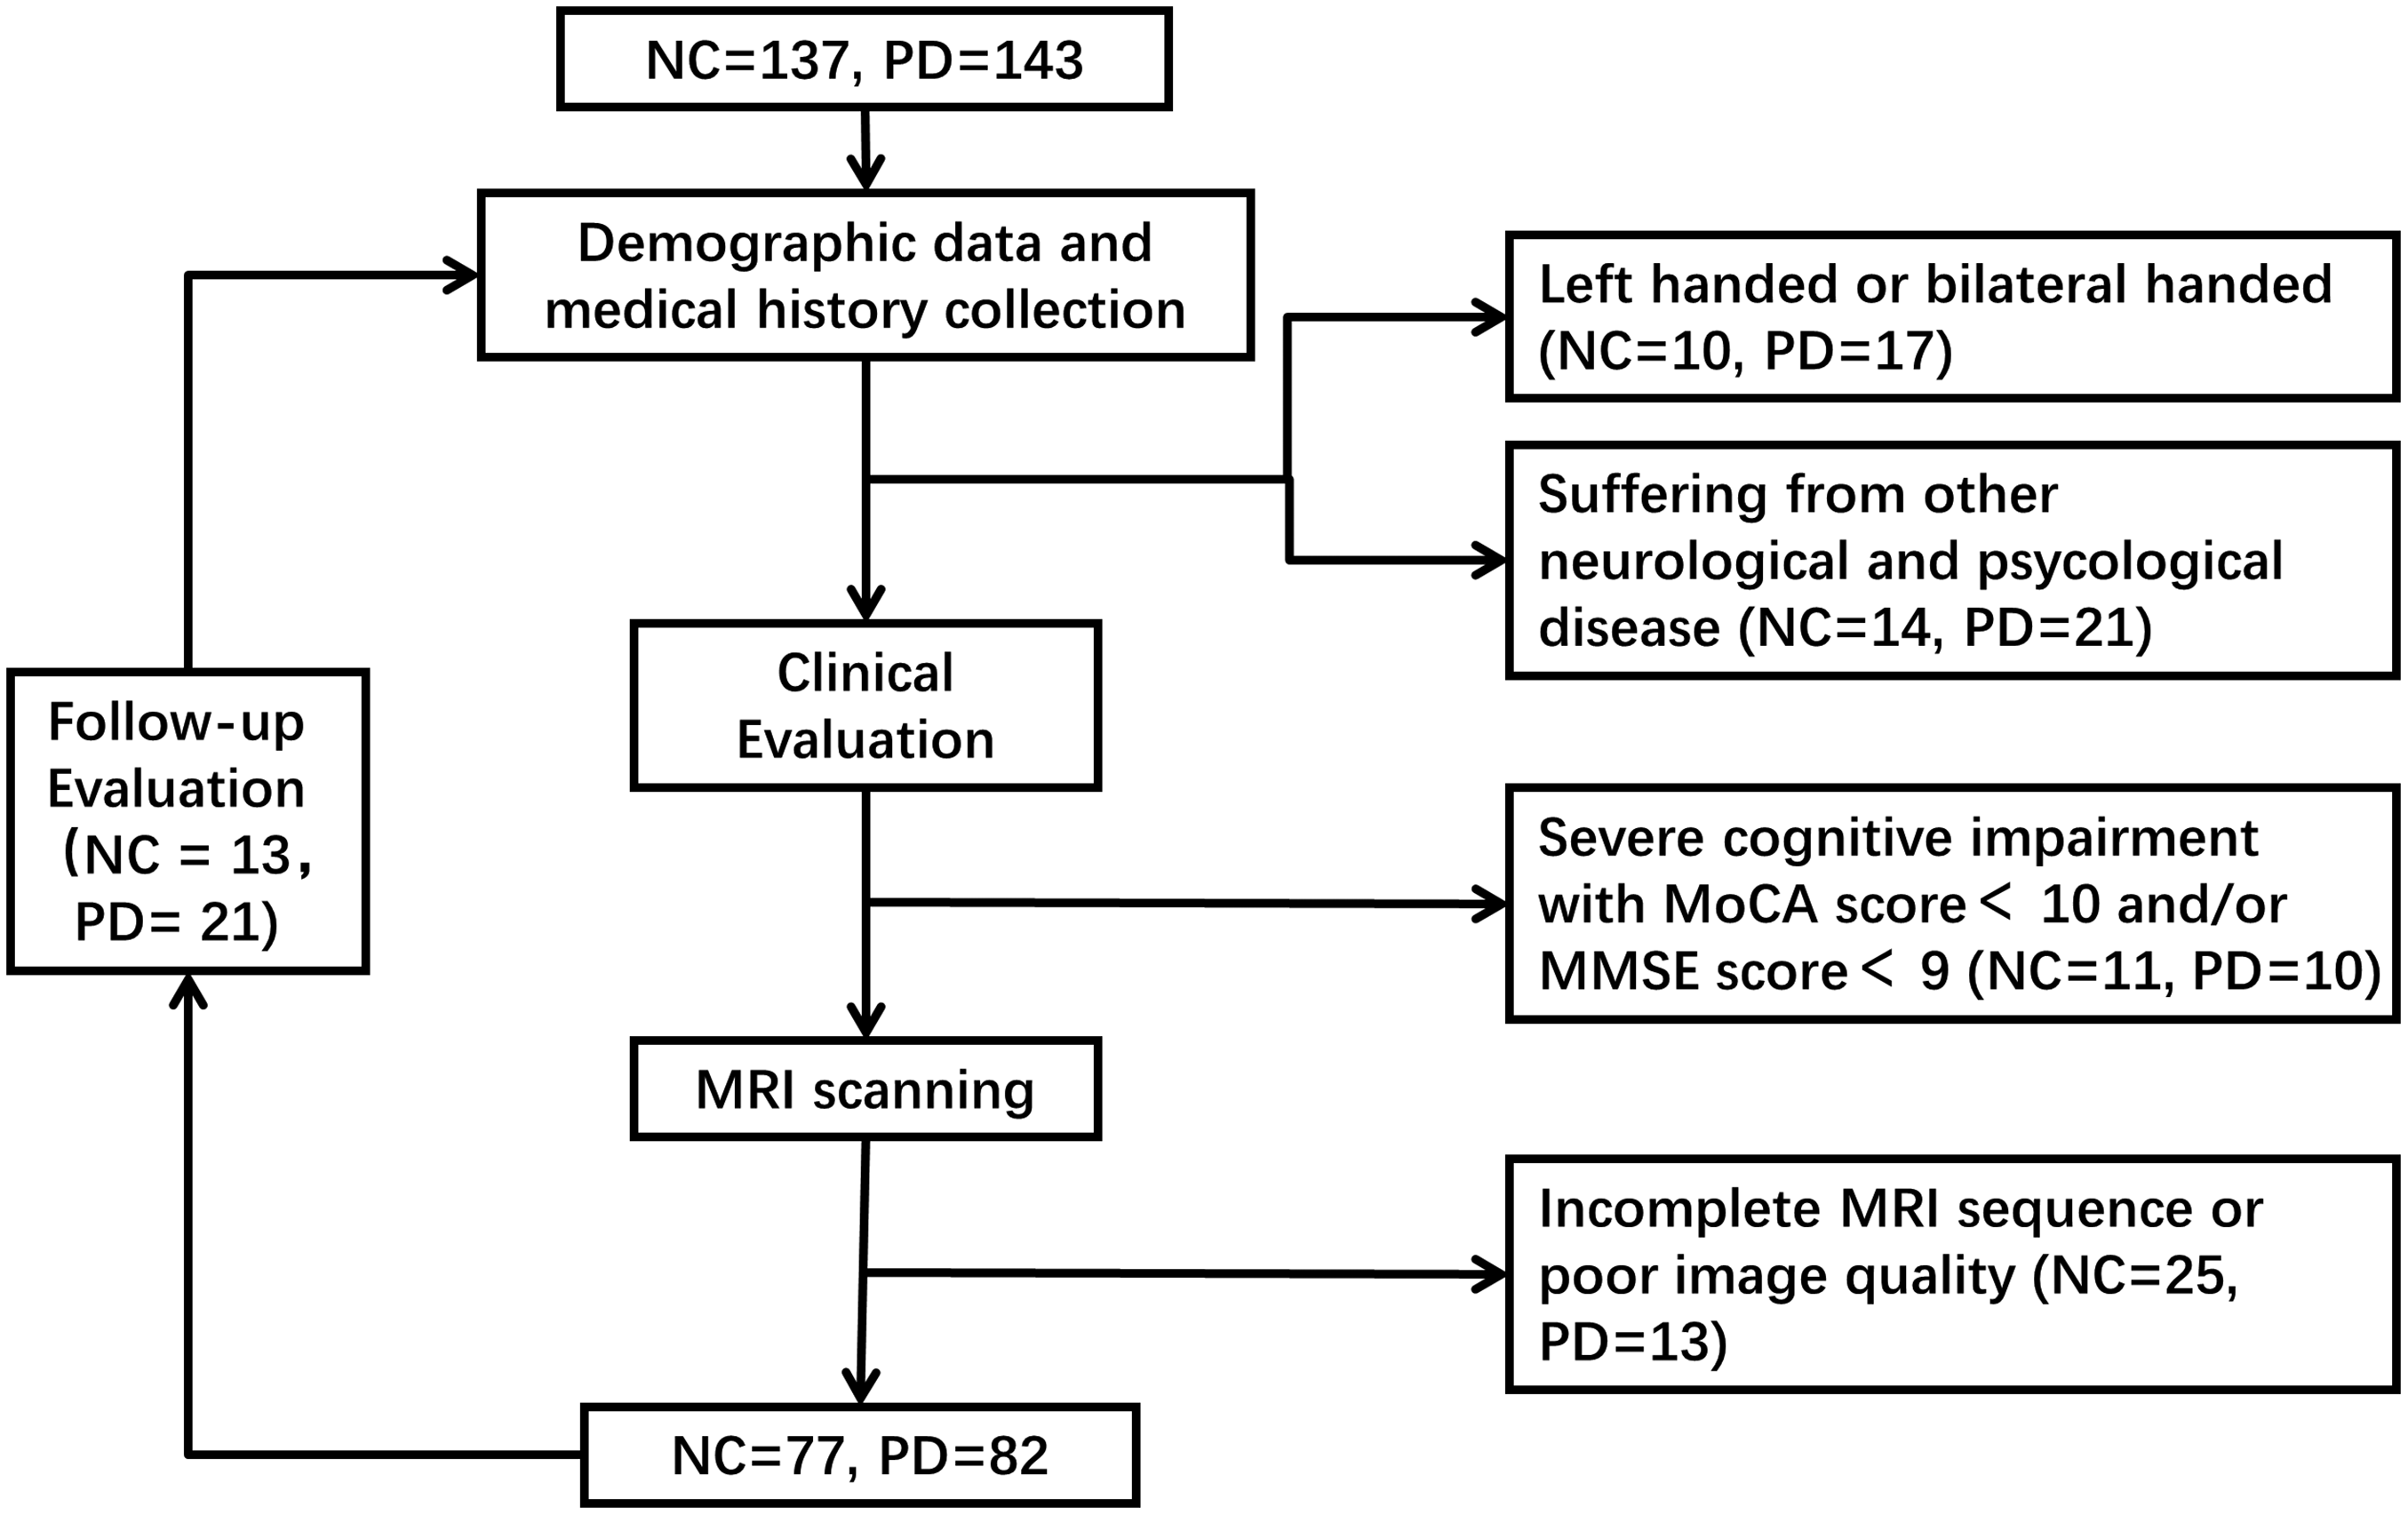
Flow chart of participant recruitment and exclusion.
Clinical assessments
Clinical and imaging evaluations were performed on all participants in the morning to minimize the impact of the circadian rhythm on glymphatic activity. Baseline demographic data and clinical variables of potential interest were collected. Unified Parkinson’s Disease Rating Scale (UPDRS) scores were also assigned. 29 UPDRS part III provided an immediate comprehensive neurological assessment of motor symptoms in participants; UPDRS part I and UPDRS part II were applied to assess the non-motor symptoms and motor symptoms in the daily life of patients, respectively. The stage of functional disability associated with PD among patients were distinguished using the Hoehn-Yahr (H-Y) scale. 30 Sleep-related behavioral manifestations of PD were evaluated using the Rapid Eye Movement (REM) Sleep Behavior Disorder Questionnaire-Hong Kong (RBDQ-HK) 31 and the Parkinson’s Disease Sleep Scale (PDSS). 32 Higher RBDQ-HK scores indicate more frequent RBD symptoms and lower PDSS scores indicate more severe sleep symptoms. To identify whether sleep disorders in PD are associated with alterations in gBOLD–CSF coupling, we separated baseline PD patients into PDSS-high and PDSS-low subgroups based on whether their PDSS score was above or below the median. At baseline, PD patients with a RBDQ-HK factor 2 score ≥8 were defined as PD with possible RBD (PD-pRBD). 33 All patients followed the appropriate treatment plan as advised by an experienced neurologist after baseline evaluation. And we underwent follow-up visits for 13 times in NC group and 21 times in PD group. At follow-up, all assessments were conducted at the OFF stage. Total daily levodopa equivalent dose was calculated. 34
Imaging data acquisition and preprocessing
Brain images were captured using a 3.0 Tesla MRI scanner (GE Discovery 750), equipped with an 8-channel head coil. A foam pillow was used to immobilize the participant’s head and limit artifacts when scanning. A trained radiologist observed the entire scanning process to ensure image quality. High-resolution T1-weighted structural images were acquired using a fast spoiled gradient recalled sequence: repetition time/echo time [TR/TE] = 7.336/3.036 ms; field of view = 260 × 260 mm2; matrix = 256 × 256; slice thickness = 1.2 mm; and slice number = 196 (sagittal). The rs-fMRI data were acquired using an echo-echo planar image sequence: [TR/TE] = 2000/30 ms; flip angle = 77°; field of view = 240 × 240 mm2; matrix = 64 × 64; slice thickness = 4.0 mm; slice gap = 0 mm; and number of slices = 38 (axial). All rs-fMRI data were preprocessed using the Data Processing & Analysis of Brain Imaging toolbox (version 6.0, http://rfmri.org/dpabi) 35 based on the Statistical Parametric Mapping (SPM) 12 (www.fil.ion.ucl.ac.uk/spm). 36 The first 10 volumes were removed to allow for the magnetization signal to reach equilibrium. The remaining 195 volumes were corrected to avoid intra-scan differences in acquisition time between slices and realigned for inter-scan head motion correction. The images were spatially smoothed with a 6-mm full width at half maximum Gaussian kernel and the linear temporal trends were removed. Band-pass filtering in the range of 0.01–0.1 Hz was applied. Nuisance regression analysis was not applied to the gBOLD signals, CSF signals, and motion parameters because these variables were the focus of the current study.25,26
Definition of regions of interest (ROI)
The ROI of the cortical gray matter was defined based on the Harvard-Oxford cortical structural atlases. 37 To obtain the mask of the cortical region in the native rs-fMRI data space, the T1-weighted images were linearly registered in the rs-fMRI data, and then co-registered (nonlinear) in the Montreal Neurological Institute (MNI) space in SPM12. The inverse transformation matrix was saved for further analysis. The ROI in the MNI space was transformed back to the native rs-fMRI space. As validated by Fultz et al., this signal reflects CSF inflow and is highly sensitive at the bottom of the cerebellum. 24 Therefore, we selected the bottom slices of the fMRI images to acquire the signal. Two neurologists, blinded to clinical data, manually defined the CSF ROIs here based on the rs-fMRI images, then verified using the T1 images.
Quantification of gBOLD–CSF coupling strength
After extracting the rs-fMRI signals from the cortical gray matter and CSF, we calculated the cross-correlation function between gBOLD and CSF signals to quantify their coupling strength over a range of time lags (−10s to 10s) using Pearson’s correlation. As the negative peak at +4s has the same amplitude as the positive peak at −4s, the BOLD–CSF correlation at this negative peak was utilized to quantify BOLD–CSF coupling strength. We also estimated the cross-correlation function between the negative derivative of the gBOLD signal and CSF signal, according to a previous study. 26 Using a permutation strategy, we examined the statistical significance of the gBOLD–CSF cross-correlations by randomly matching the gBOLD and CSF signals from different patients. This was repeated 10,000 times to build a null distribution based on their correlations and computed using MATLAB. The value of gBOLD–CSF coupling strength was then calculated by applying the segmented ROIs, respectively.
Statistical analysis
The Kolmogorov-Smirnov test was applied to test data normality. Student’s t test was performed to compare the differences in normally distributed continuous data (age and years in full-time education of participants with follow-up visits) and non-parametric tests to compare the non-normally distributed data (years in full-time education and UPDRS, PDSS, and RBDQ-HK scores). The chi-square test was performed to test the difference in categorical metrics (sex and H-Y stage). Spearman’s correlation was performed to analyze the association between gBOLD–CSF coupling and clinical metrics (UPDRS, PDSS, and RBDQ-HK scores). Logistic regression analysis was performed to adjust for age and sex as confounders. For the follow-up cohort, the annual clinical change rate of each clinical feature was calculated as [(follow-up − baseline)/follow-up interval (year)] × 100%. 38 Bonferroni test for multiple-comparison correction was performed to test the correlation between baseline gBOLD and UPDRS-I, II and III scores at baseline and their longitudinal changes. Statistical analysis was performed using Statistical Product and Service Solutions version 26.0 (IBM, New York City, NY, USA). Graphs were generated using GraphPad Prism 9.0 (GraphPad Software, San Diego, California, USA). Normally distributed continuous variables are expressed as mean ± standard deviation and non-normally distributed data as median (third quartile–first quartile). The intraclass correlation coefficient (ICC) of the gBOLD–CSF coupling strength value was used to establish inter-rater reliability in the defined CSF region. And the averaged value is applied in analysis. Statistical significance was considered as a p-value of <0.05.
Results
Participant characteristics
We recruited 159 participants from the Second Affiliated Hospital of Zhejiang University and the surrounding community in Hangzhou, Zhejiang Province. The participants included 82 drug-naïve PD patients and 77 normal controls (NCs). Table 1 summarizes detailed sample characteristics. No significant difference was observed in basic demographic information between the PD and NC groups (age, p = 0.397; sex, p = 0.093). For clinical metrics assessments, all participants received UPDRS evaluation; however, 29 and 17 PD patients did not complete the RBDQ-HK and PDSS assessments, respectively. We found that PD patients at baseline exhibited no differences in PDSS scores compared with NC (p = 0.306) and significantly higher RBDQ-HK scores than NC (p = 0.002). In the follow-up cohort, no significant difference was observed in basic demographic information (age, p = 0.455; sex, p = 0.183), but there was a significant difference in PDSS scores (p < 0.001) and RBDQ-HK scores (p = 0.013).
Characteristic of the cohort.
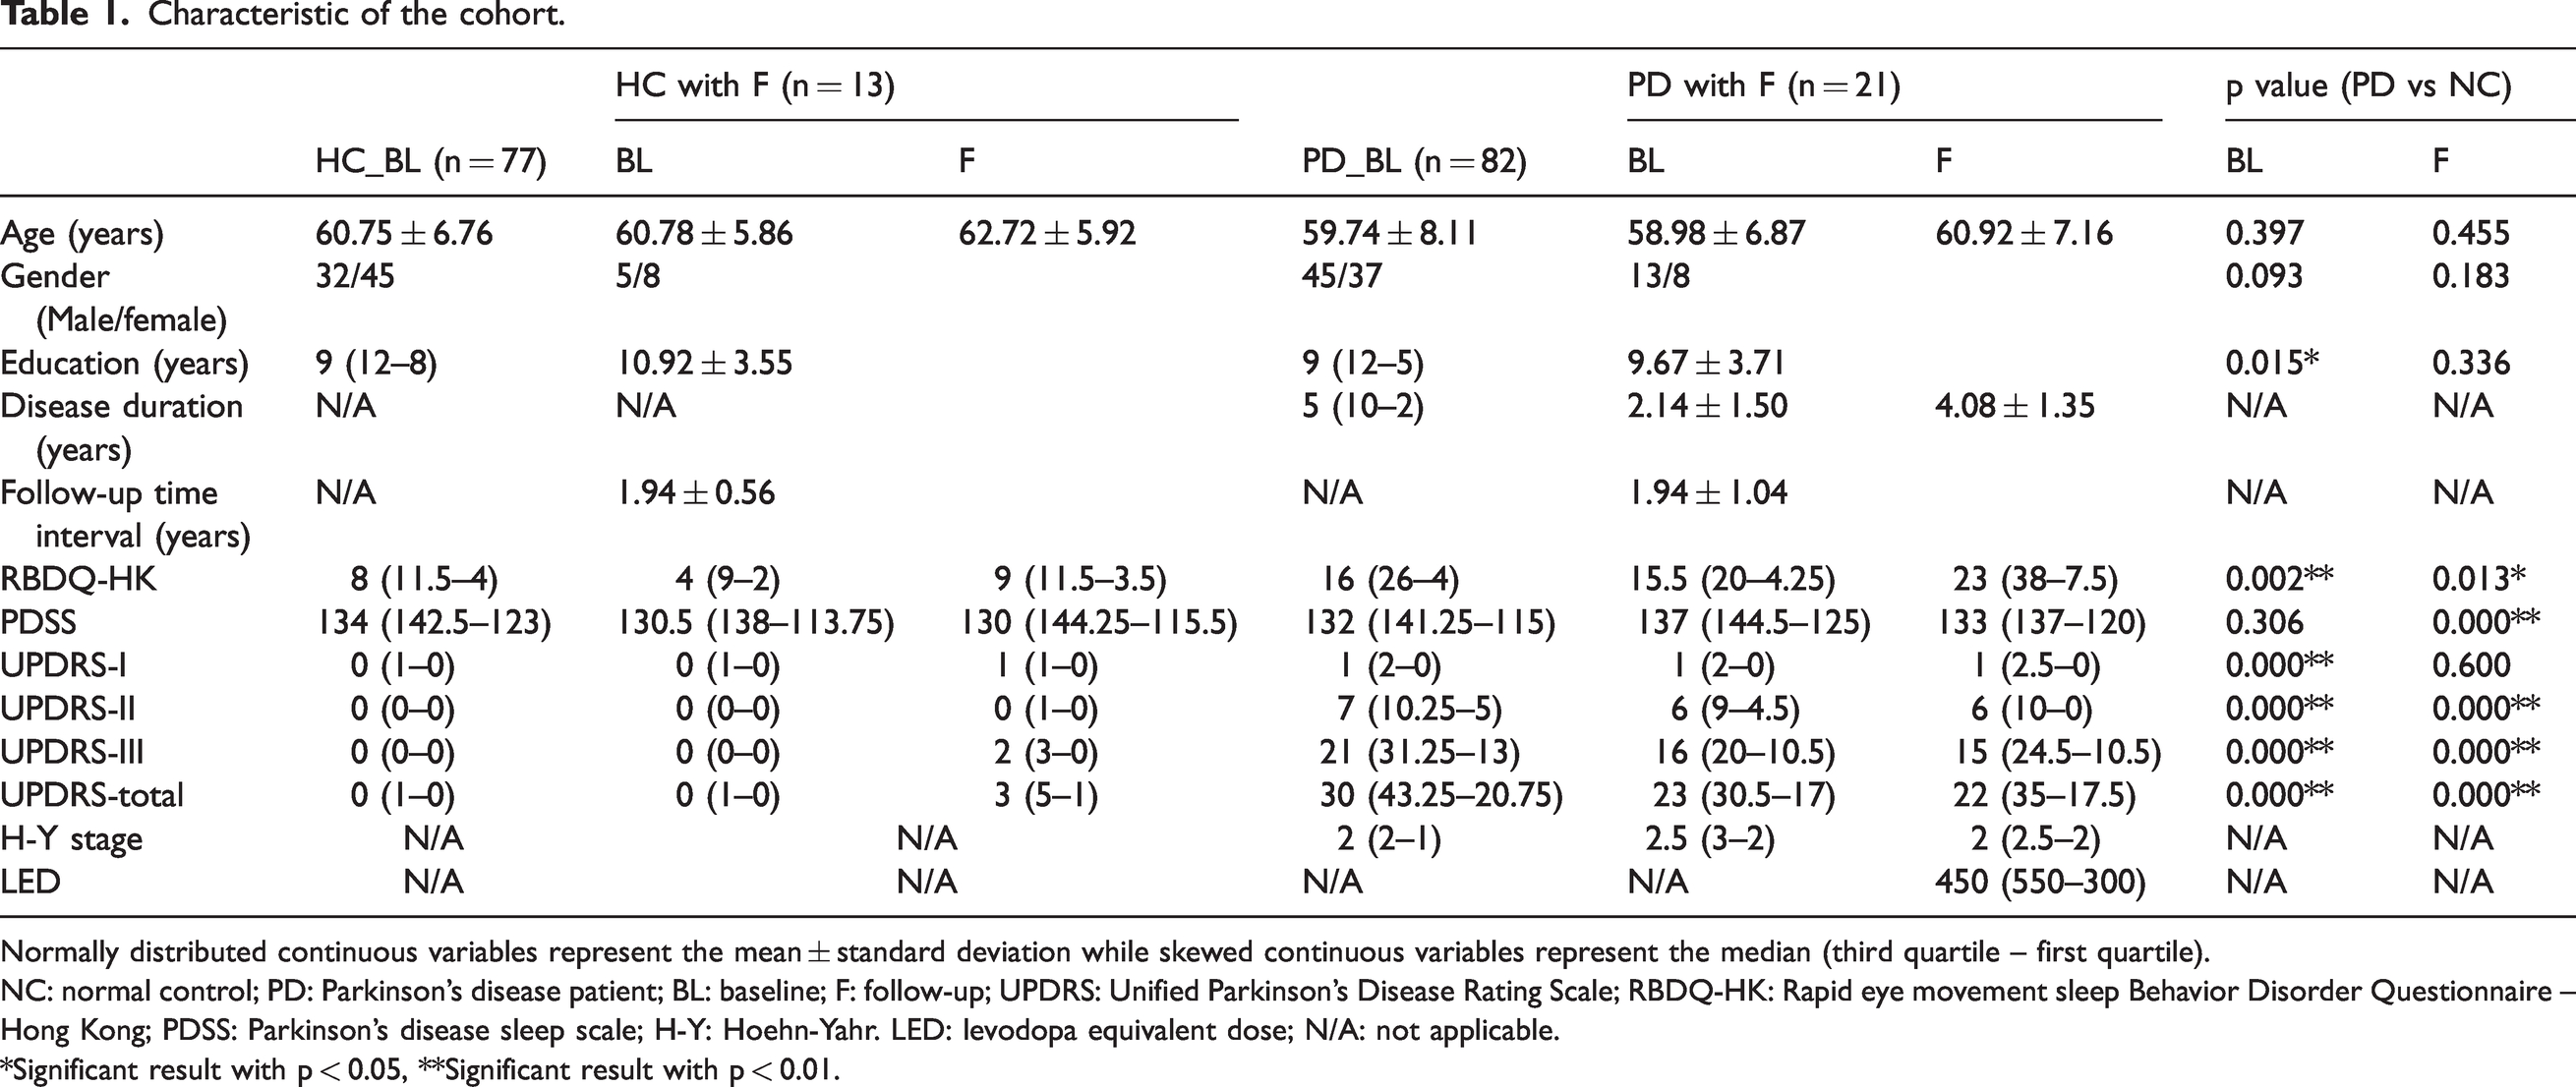
Normally distributed continuous variables represent the mean ± standard deviation while skewed continuous variables represent the median (third quartile – first quartile).
NC: normal control; PD: Parkinson’s disease patient; BL: baseline; F: follow-up; UPDRS: Unified Parkinson’s Disease Rating Scale; RBDQ-HK: Rapid eye movement sleep Behavior Disorder Questionnaire – Hong Kong; PDSS: Parkinson's disease sleep scale; H-Y: Hoehn-Yahr. LED: levodopa equivalent dose; N/A: not applicable.
*Significant result with p < 0.05, **Significant result with p < 0.01.
gBOLD signal couples with CSF signal changes
To examine whether gBOLD signals were strongly coupled to CSF signal changes in all participants, the gBOLD and CSF fMRI signals (Figure 2(a)) were extracted from the whole-brain gray matter regions and CSF region. The gBOLD and CSF signals showed corresponding changes in amplitude. Large CSF peaks often were preceded by a large positive gBOLD peak and followed by a large negative gBOLD peak (Figure 2(b)). The mean gBOLD–CSF cross-correlation function was characterized by a positive peak (B = 0.34, p < 0.001; permutation test with n = 10,000) around the −4-s lag, whereas there was a negative peak (B = −0.28, p < 0.001; permutation test with n = 10,000) at the lag of +4 s (orange dashed line in Figure 2(c), left panel). The cross-correlation function between the CSF signal and the negative first-order derivative of the gBOLD signal displayed a large positive peak at the zero-time lag (−d/dt B = 0.11, p < 0.001; permutation test with n = 10,000). Both cross-correlation functions showed patterns consistent with the data, confirming systematic coupling between the global brain signal and CSF flow. 24 The average ICC for the gBOLD–CSF coupling was 0.902, revealing a strong agreement between both researchers.
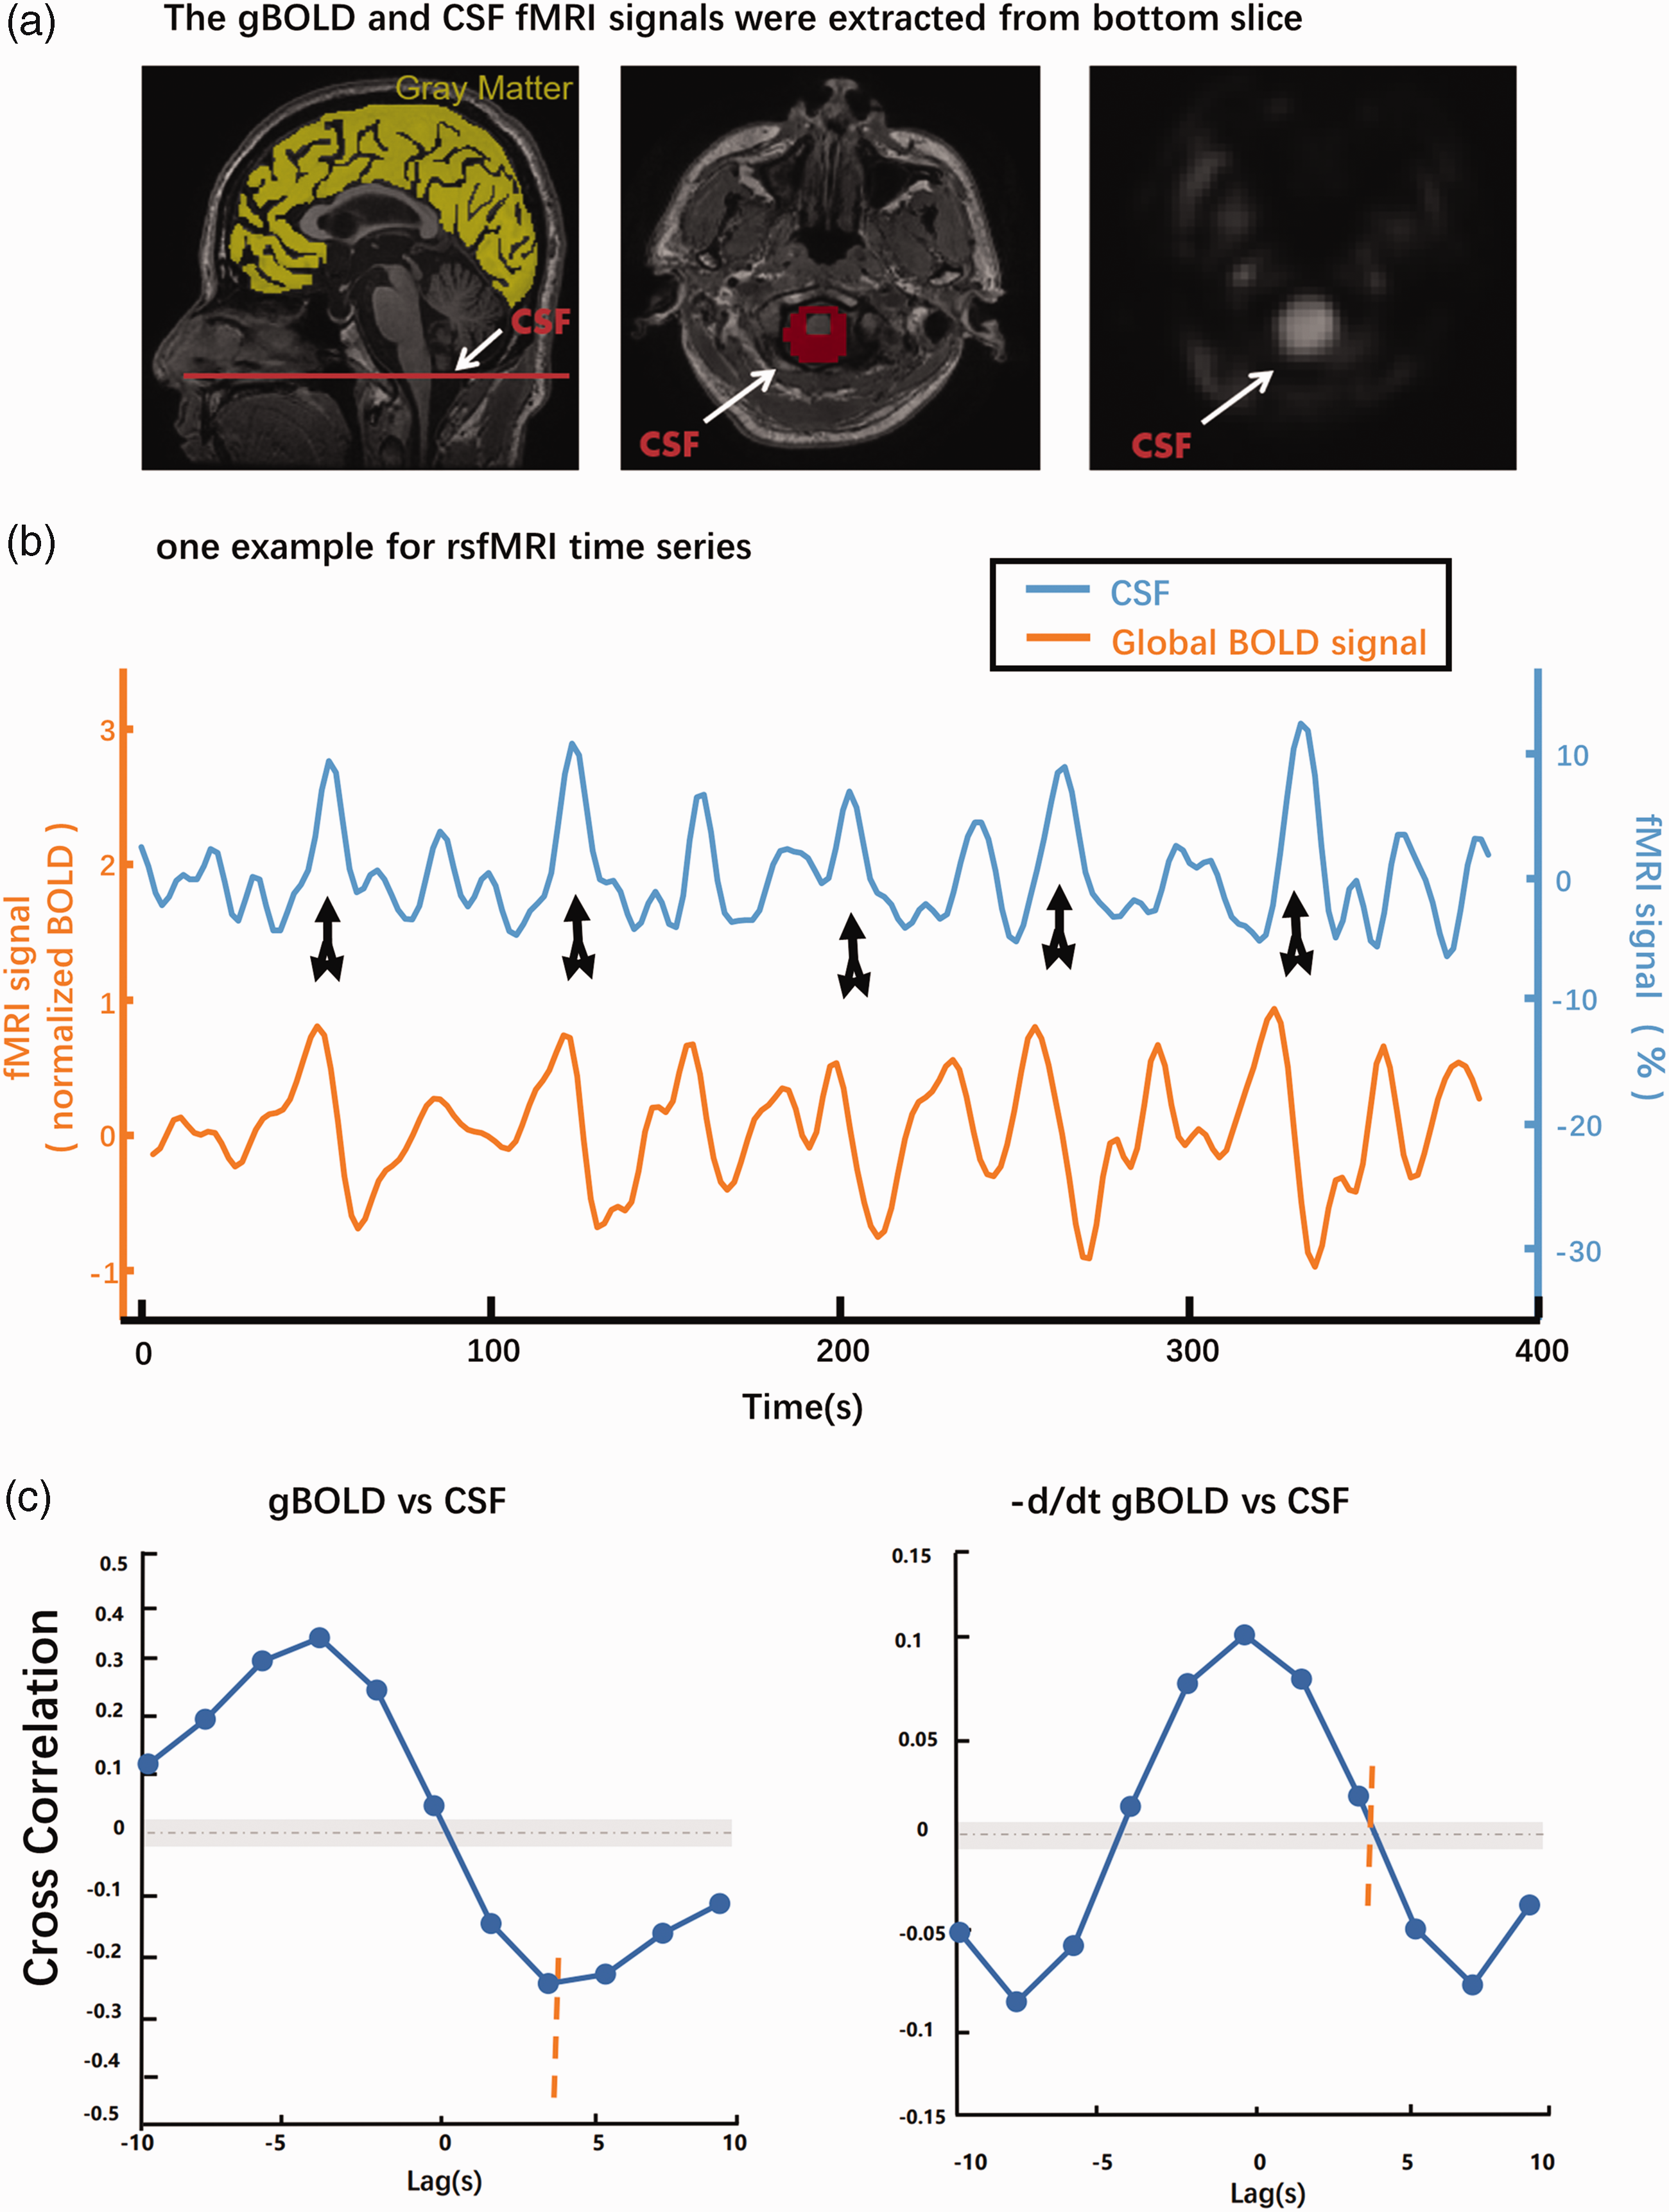
Systematic coupling between the gBOLD and CSF signals measured by rs-fMRI. (a) CSF signals from the bottom slice of the fMRI acquisition near the bottom of the cerebellum (red line). This bottom slice is expected to have maximal sensitivity to inflow effects. 76 CSF inflow from outside the fMRI acquisition volume, which does not experienced repeated radiofrequency pulses, increases the fMRI signal. 25 Systematic coupling between the gBOLD and CSF signals was measured by rs-fMRI. The gBOLD and CSF fMRI signals were separately extracted from the whole-brain gray matter regions (yellow mask on a T1-weighted structural MRI in the left panel) and CSF (the red mask) region at the bottom slice of the fMRI acquisition of the bright region in the middle and right panel (b, c). (b) The gBOLD and CSF signals from a healthy control showed corresponding changes of large amplitude. Large positive CSF peaks (black downward arrows) often are preceded by a large positive gBOLD peak and followed by a large negative gBOLD peak (black upward arrows) and (c) The mean gBOLD–CSF cross-correlation function (n = 159 participants) was characterized by a positive peak around the −4-s lag (B = 0.34, p < 0.001; permutation test with n = 10,000), whereas there was a negative peak at the lag of +4 s (B = −0.28, p < 0.001; permutation test with n = 10,000) (orange dashed line). The gray dashed line and the shaded region mark 95% confidence intervals for the mean correlation computed on shuffled signals. Overall, both cross-correlation functions showed patterns consistent with the data confirming systematic coupling between the global brain signal and CSF flow.
Association between BOLD–CSF coupling and PD
A significant correlation was found between age and gBOLD–CSF coupling (B = 0.004, p = 0.009, Figure 3(b)) Increased age has been associated with weaker gBOLD–CSF coupling strength. 26 For all following analyses, we adjusted the coupling strength for the effects of age and sex. The gBOLD–CSF coupling exhibited a significant difference, whereby it was lower in the NC group than in the drug-naïve PD groups (p = 0.006, Figure 3(a)). There was a correlation between UPDRS-II and gBOLD–CSF coupling signal (B = −0.006, p = 0.048, Figure 3(d)). however, no significant correlation was found between gBOLD–CSF coupling and UPDRS-III (B = 1.93e-5, p = 0.984, Figure 3(e)) or neurological assessment score (UPDRS-I; B = 0.001, p = 0.945, Figure 3(c)).
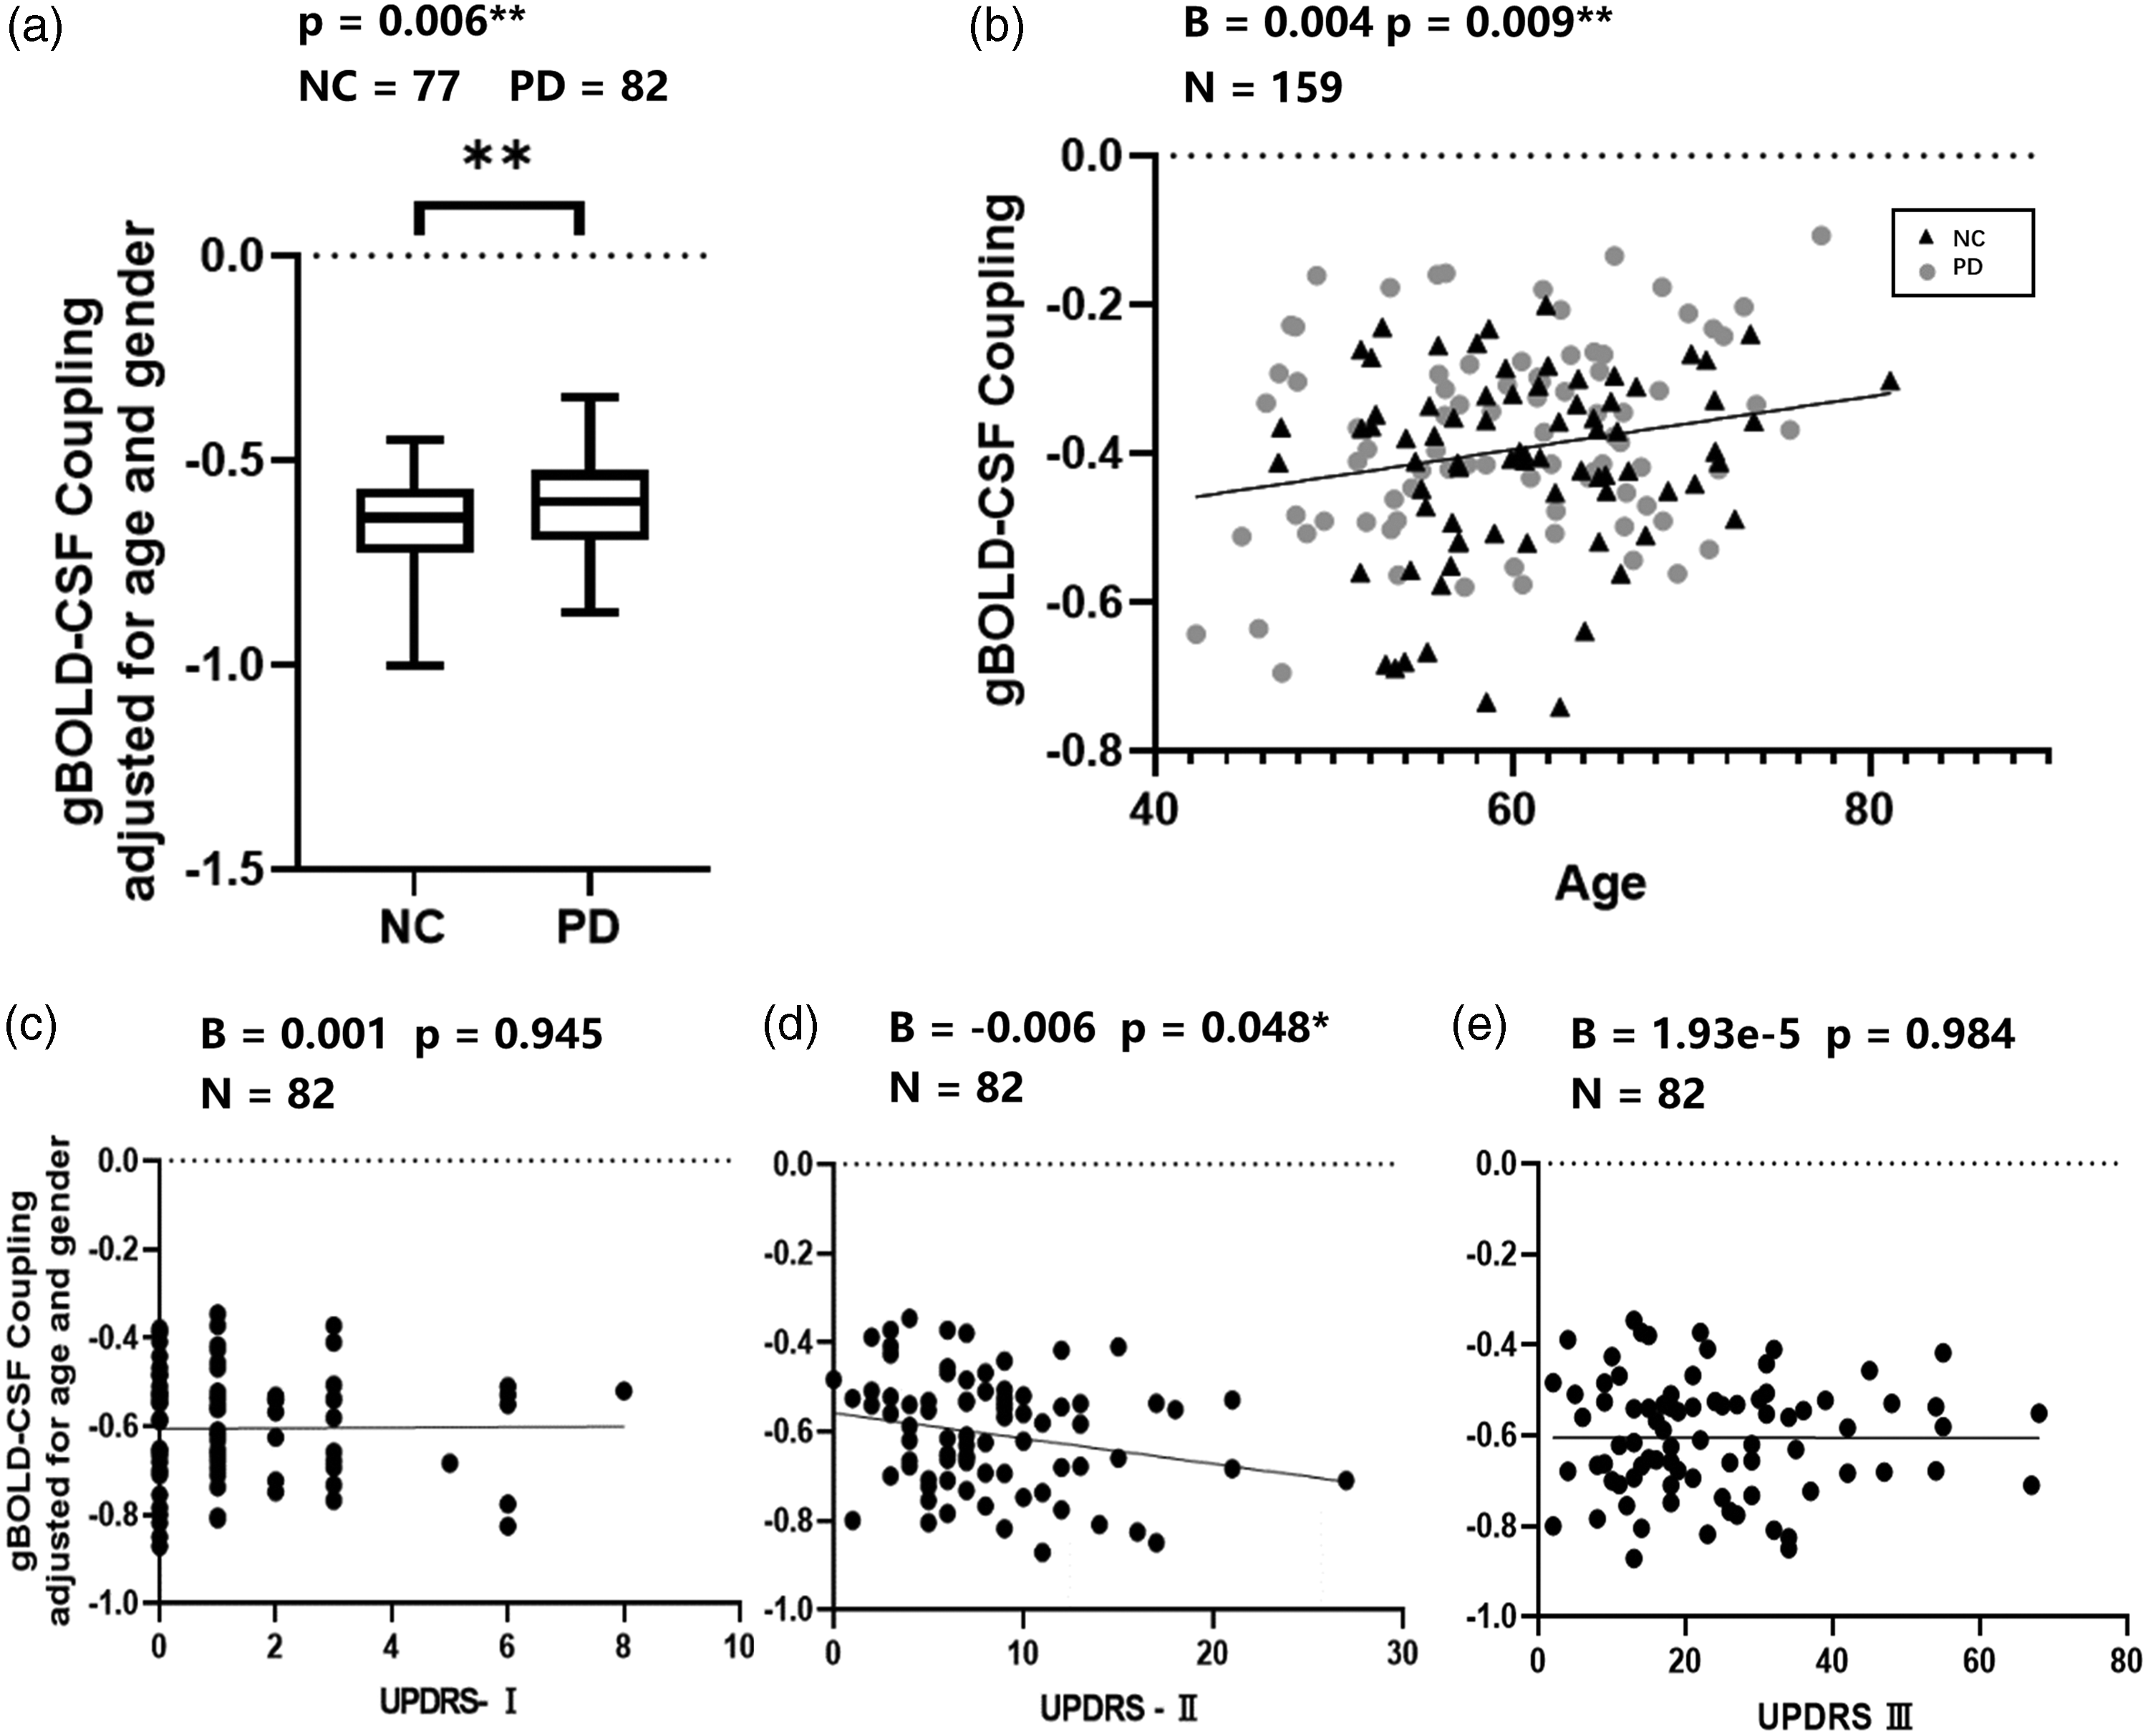
Association of gBOLD–CSF coupling to age, disease condition, and UPDRS scores. (a) Compared with NC, mean gBOLD–CSF coupling strength is significantly weaker (less negative) in PD (adjusted for age and sex; p = 0.006, NC = 77, PD = 82). (b) Age positively correlates with gBOLD–CSF coupling (B = 0.004, p = 0.009, N = 159) and (c, d, e) gBOLD-CSF coupling correlated with various clinical measurements. No significant correlation was found between the gBOLD-CSF coupling and any of the MDS-UPDRS motor (UPDRS-II, B = −0.006, p = 0.048, Bonferroni-corrected p = 0.144, d; UPDRS-III, B = 1.93e-5, p = 0.984, e) or non-motor (UPDRS-I, B = 0.001, p = 0.945, c) subscores of the baseline value.
Association of gBOLD–CSF coupling strength with longitudinal clinical changes
Consistent with comparisons across both drug-naïve PD patients at baseline and follow-up groups, BOLD–CSF coupling significantly correlated with the UPDRS-III score longitudinal changes (B = 36.27, p = 0.008, Bonferroni-corrected p = 0.024, Figure 4(a)). Stronger, that is, more negative gBOLD–CSF coupling at baseline was significantly associated with a higher change rate in gBOLD–CSF coupling, representing a more rapid deterioration of gBOLD–CSF coupling (B = −0.58, p < 0.001, Figure 4(b)). There was no significant correlation found between the gBOLD–CSF coupling at baseline and other UPDRS subscores change rate (UPDRS-I, B = −2.53, p = 0.143; UPDRS-II, B = 12.18, p = 0.039; Bonferroni-corrected p = 0.117; Figure 4(c) and (d)).
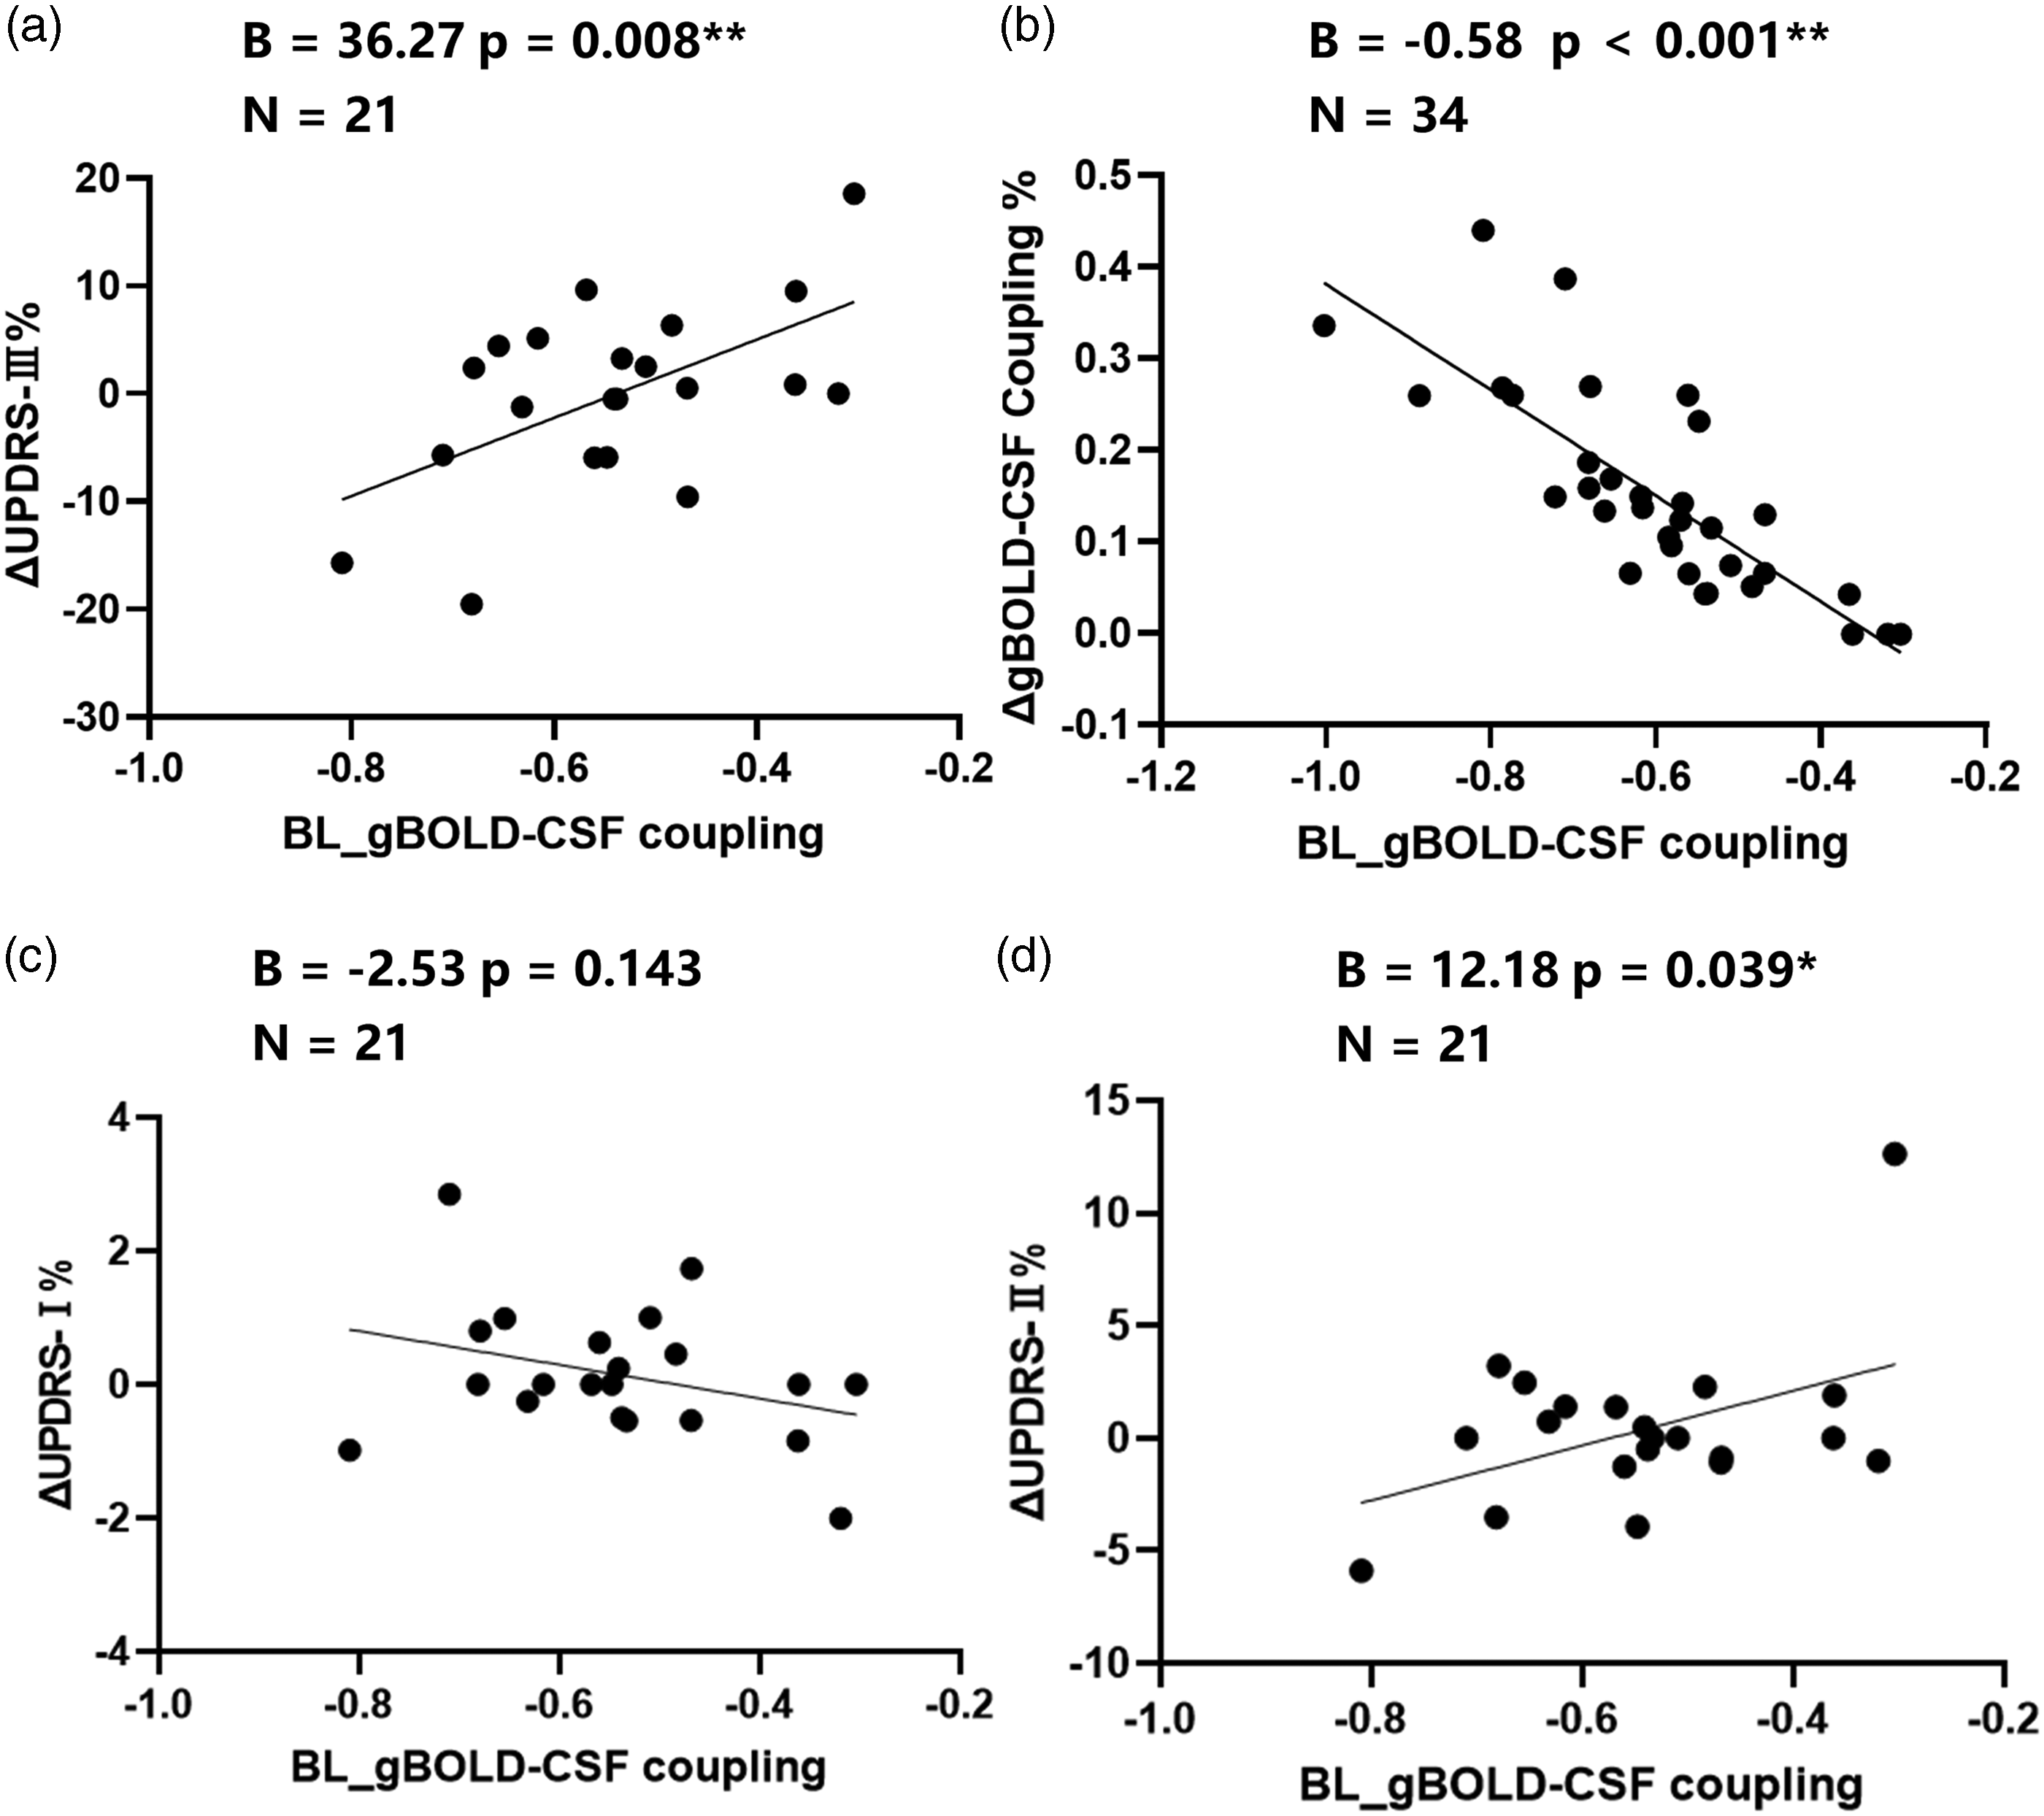
The correlation of gBOLD–CSF coupling at baseline and the rate of clinical changes. (a) Consistent with comparisons across both drug-naïve PD at baseline and follow-up groups. The BOLD–CSF coupling is significantly correlated with the UPDRS-III score changes rate (p = 0.008, Bonferroni-corrected p = 0.024, N = 21). (b) Baseline BOLD–CSF coupling signal in drug-naïve PD patients negatively correlated with gBOLD–CSF (adjusted for age and gender) change rate (B = −0.58, p < 0.001, N = 34) and (c, d) There was no significant correlation found between the gBOLD–CSF coupling at baseline and other MDS-UPDRS subscores change over time (UPDRS-II, B = 12.18, p = 0.039, Bonferroni-corrected p = 0.117, d; UPDRS-I, B = −2.53, p = 0.143, N = 21, c).
gBOLD–CSF coupling and sleep disturbances in PD
The gBOLD–CSF coupling metric was also compared between both the PD and NC groups. In baseline PD, less negative gBOLD–CSF coupling correlated with lower PDSS scores across PDSS subgroups (p = 0.047, Figure 5(a)). We did not find the association of gBOLD–CSF coupling and PDSS scores in PDSS-low group (B = 0.001, p = 0.350, Figure 5(b)) or PDSS-high group (B = 3.04e-4, p = 0.945, Figure 5(c)). No significant difference was found in gBOLD–CSF coupling strength between PD-nRBD and PD-pRBD group (p = 0.291). We found that gBOLD–CSF coupling vs RBDQ-HK associations remained marginally significant in PD-pRBD group (B = 0.004, p = 0.067, N = 25, Figure 5(f)). No association between gBOLD–CSF coupling and RBDQ-HK scores in the PD-nRBD group was found (B = 0.002, p = 0.733, N = 27, Figure 5(e)).
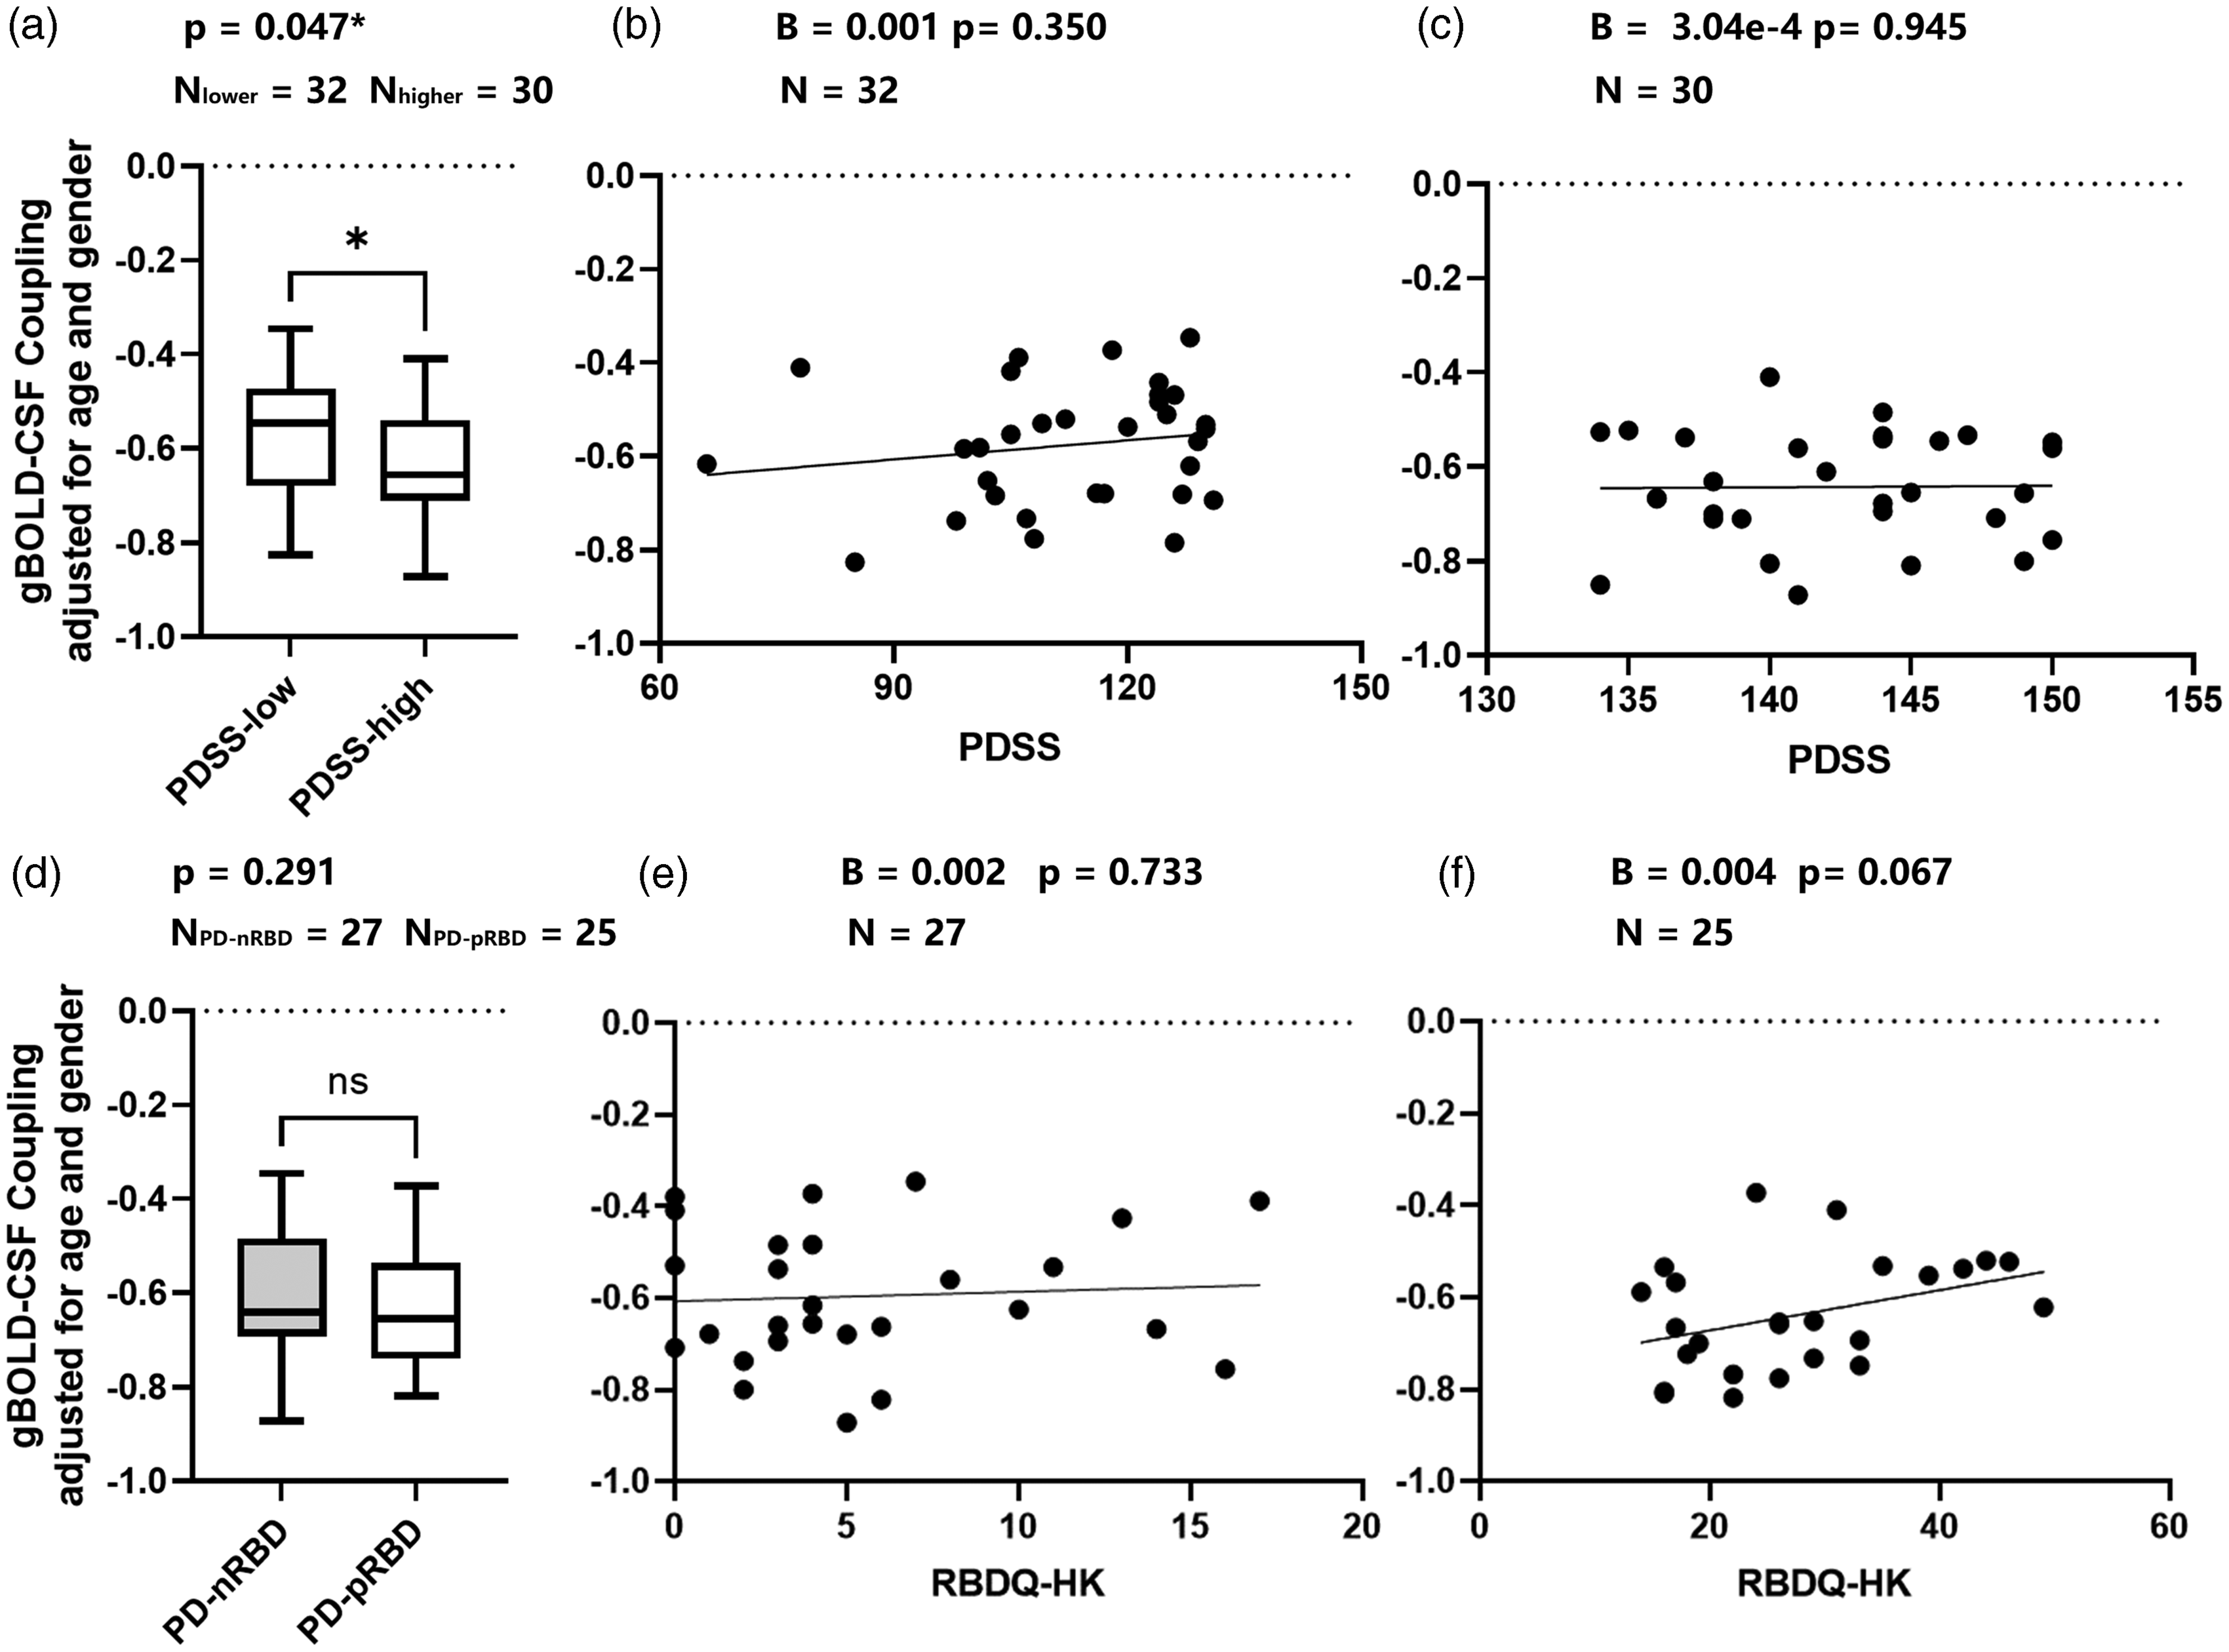
Associations of gBOLD–CSF coupling and sleep condition in PD patients. (a) Weaker gBOLD–CSF coupling strength was observed in PD with lower PDSS score (more severe sleep disturbance) group across PD with higher PDSS score groups (p = 0.047); (b, c) No association of gBOLD–CSF coupling and PDSS scores in PDSS-low group (B = 0.001, p = 0.350, N = 32, d) or PDSS-high group was found (B = 3.04e-4, p = 0.945, N = 30, c); (d) No significant difference was found in gBOLD–CSF coupling strength between PD-nRBD and PD-pRBD group (p = 0.291) and (e, f) The PD-specific gBOLD–CSF coupling vs RBDQ-HK associations remained significant in PD-pRBD group (B = 0.004, p = 0.067, N = 25, f). No association between gBOLD–CSF coupling and RBDQ-HK scores in the PD-nRBD group was found (B = 0.002, p = 0.733, N = 27, e).
Discussion
To the best of our knowledge, the current study is the first to find that the strength of gBOLD–CSF coupling was significantly lower in drug-naïve PD patients than in healthy individuals. Moreover, gBOLD–CSF decoupling significantly correlated with motor symptom deterioration and sleep disturbance. These results suggest that gBOLD–CSF coupling is a potential non-invasive marker of glymphatic system dysfunction in PD pathogenesis.
gBOLD–CSF coupling was applied as an index to reflect glymphatic function. Intracranial pressure, skull volume, whole CSF volume, cerebral blood flow, and interstitial fluid were all relatively stable. 39 An influx of CSF led to a subsequent decrease in cerebral blood flow. According to previous studies, oscillations in gBOLD signal in the 0.01–0.1 Hz range is associated with slow vasomotor pulsation, which is thought to drive glymphatic CSF flow.40–42 Taken together, low-frequency rs-fMRI signals that indicate gBOLD–CSF coupling likely result from highly coordinated neural and physiological processes that are closely linked to glymphatic clearance. 26 Thus, the cross-correlation in gBOLD–CSF signals can be applied to quantify the change in coordination activity between global BOLD signals and CSF inflow signals.
We found that the gBOLD–CSF coupling strength significantly decreased in the drug-naïve PD patients. In animal and autopsy studies, glymphatic dysfunction was also related to pathophysiological mechanisms of neurodegeneration, even before disease onset.18,43 Previous studies have shown that the glymphatic system is involved in the clearance of α-syn, which is central to the pathogenesis of PD.13,44–46 For example, the extracellular spreading of α-syn has been proposed to contribute to PD pathology, inducing microenvironmental responses. 47 In particular, blocking the deep cervical lymph nodes downstream of the glymphatic system aggravated PD pathology in A53T mice. 18 Another study revealed that the emergence of α-syn pathology was followed by delayed meningeal lymphatic drainage in an α-syn preformed fibril-injected PD mouse model. 16 These studies suggested that the glymphatic system is involved in PD pathology. Previous studies have reported glymphatic system deterioration in the early stages of AD and PD.13,14 The strength of gBOLD–CSF coupling decreased gradually from the healthy controls to AD patients, indicating that the burden of gBOLD–CSF decoupling may increase as the disease progresses from the prodromal phase. 25 Given that most PD patients present with significant loss of DA neurons in the SN, it is important to explore the pathophysiological mechanism in the early stages of the disease. Taken together, our results suggest that the gBOLD–CSF coupling may be a sensitive index metric to evaluate glymphatic dysfunction before PD treatment. Further research is required to determine the value of gBOLD–CSF coupling in the identification of prodromal PD.
We reported that baseline gBOLD–CSF coupling positively correlated to changes in UDPRS-III score, while no correlation with baseline UPDRS-III scores was found. This suggests that glymphatic dysfunction may be linked to rapid progression in motor symptoms, regardless of early appearance. UPDRS score is related to dopamine transporter binding. 48 DA neurons are highly sensitive to changes in the micro-environment, such as iron, 49 neurotoxicity, 50 and inflammation. 51 The loss of DA neurons may contribute to the manifestation of motor symptoms. Additionally, we noticed that in the PD follow-up cohort, mean UPDRS-III scores were lower than baseline UPDRS-III scores. Levodopa treatment can improve motor disability even in the OFF state and is invariably less severe than at baseline. 52 Enhanced glymphatic activity also contributes to the efficiency of drug delivery to the central nervous system. 53 We speculated that there may be a time cumulative effect whereby long-term gBOLD–CSF decoupling may lead to inefficient drug delivery or metabolic waste clearance eventually resulting in motor symptom deterioration. Our study found that baseline gBOLD–CSF coupling strength was negatively associated with its rate of change over time. Perhaps, this deterioration might be attributed to compensatory mechanisms, such as altered white matter diffusivity and PVS number and pattern.54,55
Over 90% of PD patients report various sleep problems, including insomnia, excessive daytime sleepiness, RBD, and circadian abnormalities. 56 As the disease progresses, disturbances in sleep become increasingly frequent and severe.57–60 Sleep-related symptoms have a significant impact on PD-related disabilities, compared with motor symptoms. 61 The glymphatic system is thought to exhibit low function during wakefulness and is switched on during slow-wave sleep,62–64 regulated by circadian rhythms.11,12,65–67 Here, we focused on the sleep problems in our PD patients and used PDSS to generally evaluate the 15 most common sleep symptoms in PD. 32 We found that gBOLD–CSF coupling strength was weaker in the subgroup with lower PDSS scores,16,17 indicating that PD patients with better sleep quality achieve more efficient glymphatic transport than those with poorer sleep quality. Furthermore, RBDQ-HK scores were marginally significantly correlated with gBOLD–CSF coupling strength in PD-pRBD patients, but not in PD patients without RBD. Currently, RBD is recognized as an α-synucleinopathy and as a prodromal symptom of PD.68,69 Consistent with previous studies, PD patients with or without RBD exhibit contradictory clinical manifestations and α-syn pathologies.70,71 Perhaps, this difference is because PD-RBD represents a more advanced form of the disease compared with PD without RBD. 72 Taken together, gBOLD–CSF coupling may be a potential tool to assess PD-related disability and study α-syn pathologies and further research is necessary to assess the correlation between sleep-related symptoms in PD and gBOLD–CSF coupling.
This study has a few limitations. First, we used gBOLD–CSF coupling to reflect whole-brain glymphatic function, in the absence of a more accurate method to evaluate glymphatic system function of the effaced region.73–75 Second, we mostly relied on questionnaires to evaluate clinical metrics. Instead, objective inspection methods, such as polysomnography and dopamine transporter-positron emission tomography, could have better reflected the actual situation in the brain. Third, we recruited our volunteers from a developing region; therefore, a portion of patients may have shown more severe symptoms before drug administration, due to their lack of medical resource accessibility. Lastly, if more patients had been available for follow-up data, the longitudinal study of clinical metrics and the gBOLD–CSF coupling would have higher accuracy.
In conclusion, the current study demonstrated a severe gBOLD–CSF decoupling in patients with drug-naïve PD and may reflect longitudinal motor impairment, thereby providing a potential marker of glymphatic dysfunction in PD. Moreover, gBOLD–CSF decoupling significantly correlated with motor symptom deterioration and sleep disturbance.
Supplemental Material
sj-pdf-1-jcb-10.1177_0271678X231164337 - Supplemental material for Reduced coupling of global brain function and cerebrospinal fluid dynamics in Parkinson’s disease
Supplemental material, sj-pdf-1-jcb-10.1177_0271678X231164337 for Reduced coupling of global brain function and cerebrospinal fluid dynamics in Parkinson’s disease by Zhiyun Wang, Zhe Song, Cheng Zhou, Yi Fang, Luyan Gu, Wenyi Yang, Ting Gao, Xiaoli Si, Yi Liu, Ying Chen, Xiaojun Guan, Tao Guo, Jingjing Wu, Xueqing Bai, Minming Zhang, Baorong Zhang and Jiali Pu in Journal of Cerebral Blood Flow & Metabolism
Footnotes
Funding
The author(s) disclosed receipt of the following financial support for the research, authorship, and/or publication of this article: This work was supported by the National Natural Science Foundation of China (grant number: NSFC82001353); and the Key Research and Development Program of Zhejiang Province (grant number: 2020C03020).
Acknowledgements
We would like to thank all the volunteers who participated in our study, as well as their caregivers.
Declaration of conflicting interests
The author(s) declared no potential conflicts of interest with respect to the research, authorship, and/or publication of this article.
Authors’ contributions
Z.W and Z.S: study conceptualization, data analysis, and writing the original draft. C.Z and X.G: image evaluation and validation. L.G, W.Y, and T.G: the acquisition of clinical metrics. Y.F and X.S: formal analysis and methods consultant. X.B, T.G, and J.W: acquisition of image data. Y.C and Y.L: program supervision, manuscript reviewing. B.Z: project administration, funding acquisition; M.Z: program supervision, review of the manuscript; J.P: program supervision, review, and editing of the final version of the manuscript. All authors have read and approved the final manuscript.
References
Supplementary Material
Please find the following supplemental material available below.
For Open Access articles published under a Creative Commons License, all supplemental material carries the same license as the article it is associated with.
For non-Open Access articles published, all supplemental material carries a non-exclusive license, and permission requests for re-use of supplemental material or any part of supplemental material shall be sent directly to the copyright owner as specified in the copyright notice associated with the article.