
Abstract
Cerebral microbleeds (CMBs) are hypothesised to have an important yet unknown role in the dementia disease pathology. In this study we analysed increasing number of CMBs and their independent associations with routine cerebrospinal fluid (CSF) biomarkers in a continuum of cognitive impairment. A total of 1039 patients undergoing dementia investigation were analysed and underwent lumbar puncture, and an MRI scan. CSF samples were analysed for amyloid β (Aβ) 42, total tau (T-tau), tau phosphorylated at threonine 18 (P-tau) and CSF/serum albumin ratios. Increasing number of CMBs were independently associated with low Aβ42 levels, in the whole cohort, Alzheimer’s disease and mild cognitive impairment (p < 0.05). CSF/serum albumin ratios were high with multiple CMBs (p < 0.001), reflecting accompanying blood–brain barrier dysfunction. T-tau and P-tau levels were lower in Alzheimer’s patients with multiple CMBs when compared to zero CMBs, but did not change in the rest of the cohort. White matter hyperintensities were associated with low Aβ42 in the whole cohort and Alzheimer’s disease (p < 0.05). Aβ42 is the routine CSF-biomarker mainly associated with CMBs in cognitive impairment, and there is an accumulative effect with increasing number of CMBs.
Keywords
Introduction
Small vessel disease due to cerebral amyloid angiopathy (CAA) and hypertensive arteriopathy has been the focus of recent increased attention. As microscopical vessels in the brain are impossible to image in vivo, putative markers of small vessel disease, such as cerebral microbleeds (CMBs), white matter hyperintensities (WMH) and lacunar infarcts, have been adopted as signatures of the disease. 1
In CAA vessel wall damage is caused by amyloid β (Aβ) deposition in the media and adventitia of vessel walls, leading to microaneurysmal formation, and sometimes occlusion of the lumen.1,2 Hypertensive arteriopathy in turn is mainly characterised by loss of smooth muscle cells from the tunica media, fibro-hyaline deposits, narrowing of the lumen and thickening of the vessel wall. 1 Both these processes lead to loss of vessel wall integrity, which in turn may cause major and minor bleeds, the latter being represented by CMBs. WMH in turn is thought to result from chronic hypoperfusion of the brain, in part caused by lumen restriction in small vessel disease. 1 The same mechanism, when acute and severe, may lead to lacunar infarcts. 1
Especially CMBs, occurring in higher frequency in populations with dementia when compared to healthy, have been recognised as an important marker in cognitive impairment. 3 Since small vessel disease is most common in populations with stroke and dementia, as well as ageing populations, associations between these markers and clinical cerebrospinal fluid (CSF) biomarkers, used in the routine dementia work-up, may not only increase understanding of the underlying pathogenesis and impact of markers of small vessel disease, but also convey their importance in cognitive impairment.
In this study we decided to focus on the importance of CMBs in cognitive impairment by studying associations with Aβ42, reflecting Aβ42 deposition in the brain and vasculature, total tau (T-tau) and tau phosphorylated at threonine 181 (P-tau), reflecting the intensity of neuronal damage and tangle formation, respectively, and CSF/serum albumin ratios, as a marker of disrupted blood–brain barrier integrity. 4 We hypothesized that: 1) the relation of CMBs with pathological CSF-biomarkers would increase from subjective cognitive impairment to mild cognitive impairment and finally, Alzheimer’s disease, reflecting the importance of CMBs in dementia. 2) A higher burden of CMBs would lead to even more pathological levels of CSF-biomarkers. 3) Additionally, we thought that the presence of both amyloid pathology and hypertensive arteriopathy, would increase associations between CMBs and pathological levels of CSF-biomarkers.
Materials and methods
Patients
This study is part of the Karolinska Imaging Dementia Study (KIDS), a memory clinic based cross-sectional study on CMBs and cognitive impairment. We included 1041 consecutive patients in our study, all undergoing dementia investigation with accompanying CSF samples and MRI scans, at the memory clinic/radiology department, Karolinska University Hospital, from 1 January 2006 to 1 January 2012. Exclusion criteria for all patients were insufficient scan quality on the MRI performed, and history of traumatic brain injury. After exclusion the cohort consisted of 1039 patients. Diagnosis was set, based on The International Classification of Diseases Tenth Edition (ICD-10) criteria, in multidisciplinary rounds, i.e. with geriatricians, neuropsychologists, neurophysiologists and neuroradiologists, with consideration to the whole clinical picture and all work up done.
ICD-codes and diagnostic groups.
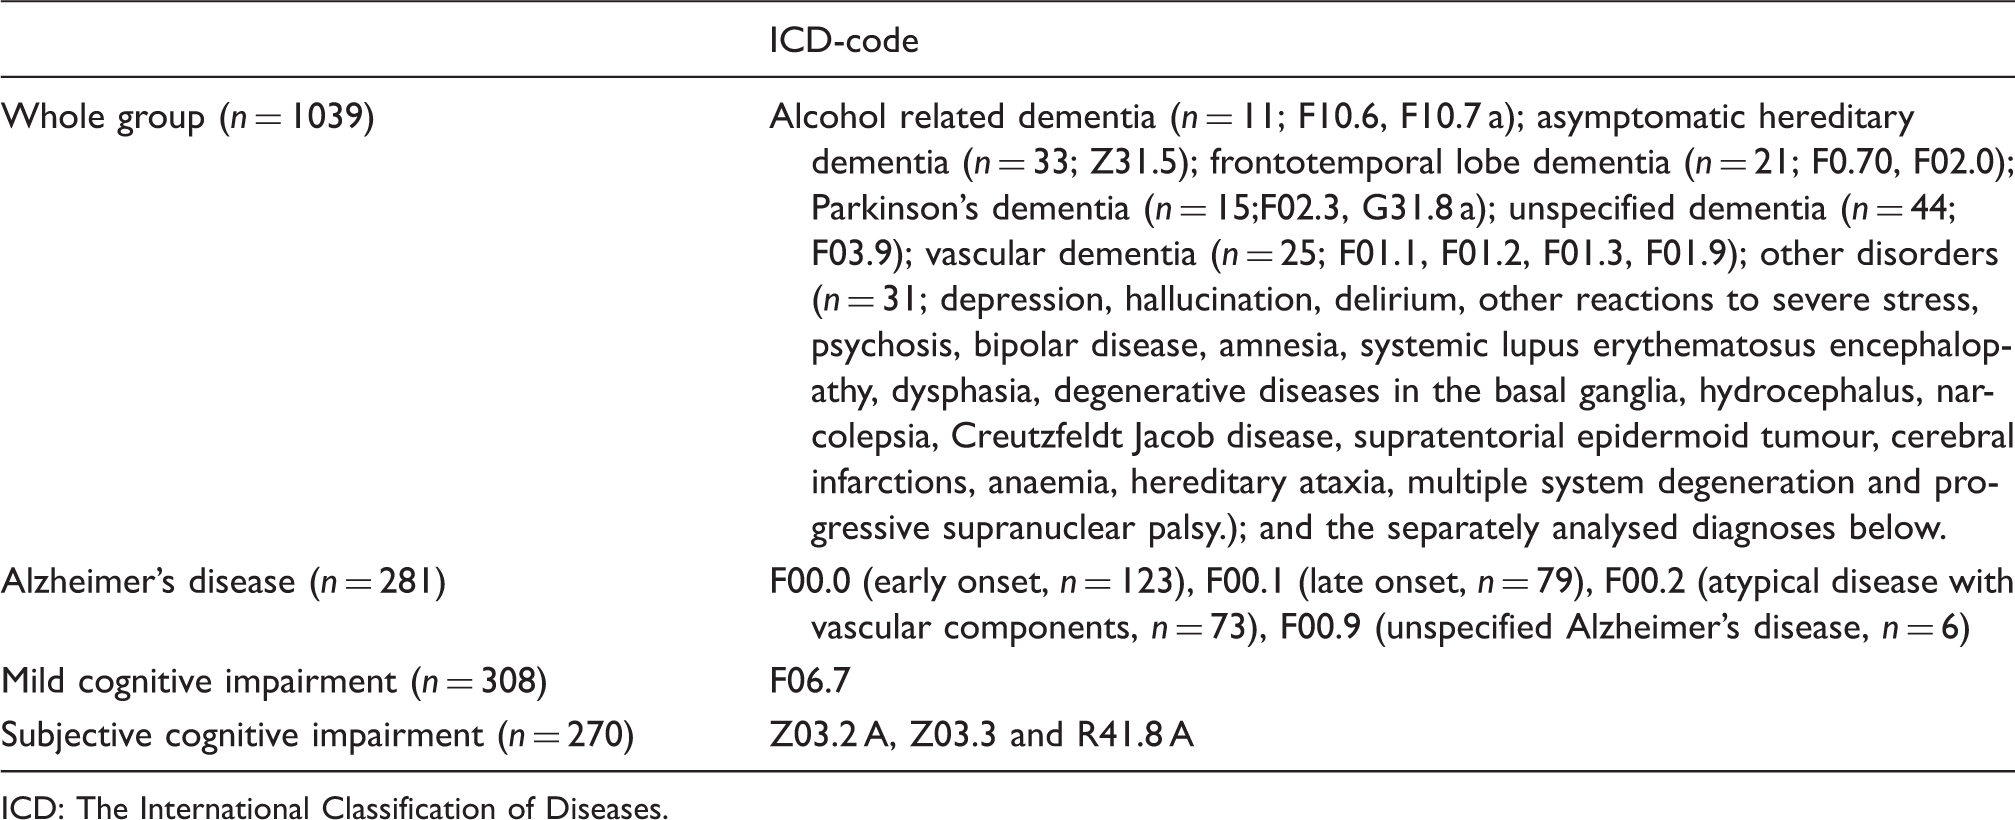
ICD: The International Classification of Diseases.
The presence of hypertension, hyperlipidaemia and diabetes was determined based on self-report as well as review of clinical patient charts regarding prior medical diagnoses and treatment, for all patients. Informed consent was obtained from each patient, according to the Declaration of Helsinki 1975/1983, and ethical approval was obtained from the regional ethical review board, Karolinska Institutet, Stockholm, Sweden.
MRI protocol
Three MRI scanners (Siemens Medical Systems, Erlangen, Germany) at the radiology department, Karolinska University Hospital, Huddinge were used. For each patient axial SWI and/or T2* sequences, as well as conventional MRI sequences, such as T1, T2, and FLAIR were obtained. All patients had their scan assigned based on clinical availability, to the different MRI scanners with 1.5 T and 3.0 T field strengths. Scanners and protocols, as well as distribution of patients on the different scanners and sequences, are seen in Supplementary Table 1.
Image analysis
All MR images were jointly (i.e. by consensus) analysed by a senior consultant neuroradiologist and an MD/PhD student with three years of training and experience in neuroradiology. Both raters were blinded to all patient data. CMBs were rated on axial T2* and/or SWI according to the microbleed anatomical rating scale (MARS), 5 with minor modifications as previously explained. 6 CMB counts were determined by the second rater, who had, as previously shown, excellent inter-rater agreement with the first rater, on both T2* and SWI, as well as excellent intra-rater agreement.6,7 WMHs were rated according to the Fazekas scale from 0 to 3 (none or single punctate; multiple punctate; early confluent; large confluent). 8 Lacunar infarctions were defined as 3–15 mm of size, with CSF signal on FLAIR, T2 and T1. All neuroradiological analyses were made on a radiological PACS workstation (Sectra AB, Stockholm, Sweden).
CSF analysis
CSF samples were obtained by lumbar puncture at the time of dementia investigation, and all CSF analyses took place at the Department of Clinical Chemistry, Karolinska University Hospital, Huddinge. CSF was collected in 10 mL polypropylene tubes and centrifuged within 2 h, at 1900g for 10 min, and then frozen until analysis. A small amount of CSF was used for routine analysis of total cells, total protein and glucose levels. Biomarkers were measured with sandwich type enzyme-linked immunosorbent assay; Aβ42 was measured with Innotest β-amyloid (1–42), T-tau with Innotest hTau-Ag, and P-tau with Innotest Phospho-tau (181 P) (Innogenetics, Ghent, Belgium). The unit used for biomarkers is ng/L. Blood samples were collected in conjunction with the lumbar puncture, in order to quantify CSF/serum albumin ratios. 9 The team involved in CSF and blood analysis were unaware of the dementia diagnosis and MR images.
Statistics
Descriptive statistics for CSF-biomarkers are given as median and interquartile range (IQR), and mean and standard deviation (±SD) for age and Mini Mental State Examination (MMSE) score. All CSF-biomarkers were log transformed due to their non-parametric distribution, but are displayed as median and IQR in tables and figures. Analysis of variance (ANOVA) with post hoc Bonferroni correction was used to differentiate patients with zero, one, and multiple CMBs defined as six or more CMBs. The cutoff six or more CMBs representing multiple CMBs was arbitrarily set, as in a prior report, 10 to maximize associations with CMBs and focus on those with a most severe CMB burden. Multivariate linear regression analyses were used to determine the association of increasing number of CMBs with CSF-biomarkers. CSF-biomarkers were set as dependent variables, and number of CMBs, WMH and lacunar infarctions as independent variables. The model was adjusted for age, gender, MRI field strength (1.5–3.0 T) and CMB sequences (SWI/T2*). SPSS 22.0 was used for statistical analysis, and p < 0.05 was set as the threshold of significance.
Results
Number of CMBs and associations with CSF-biomarkers
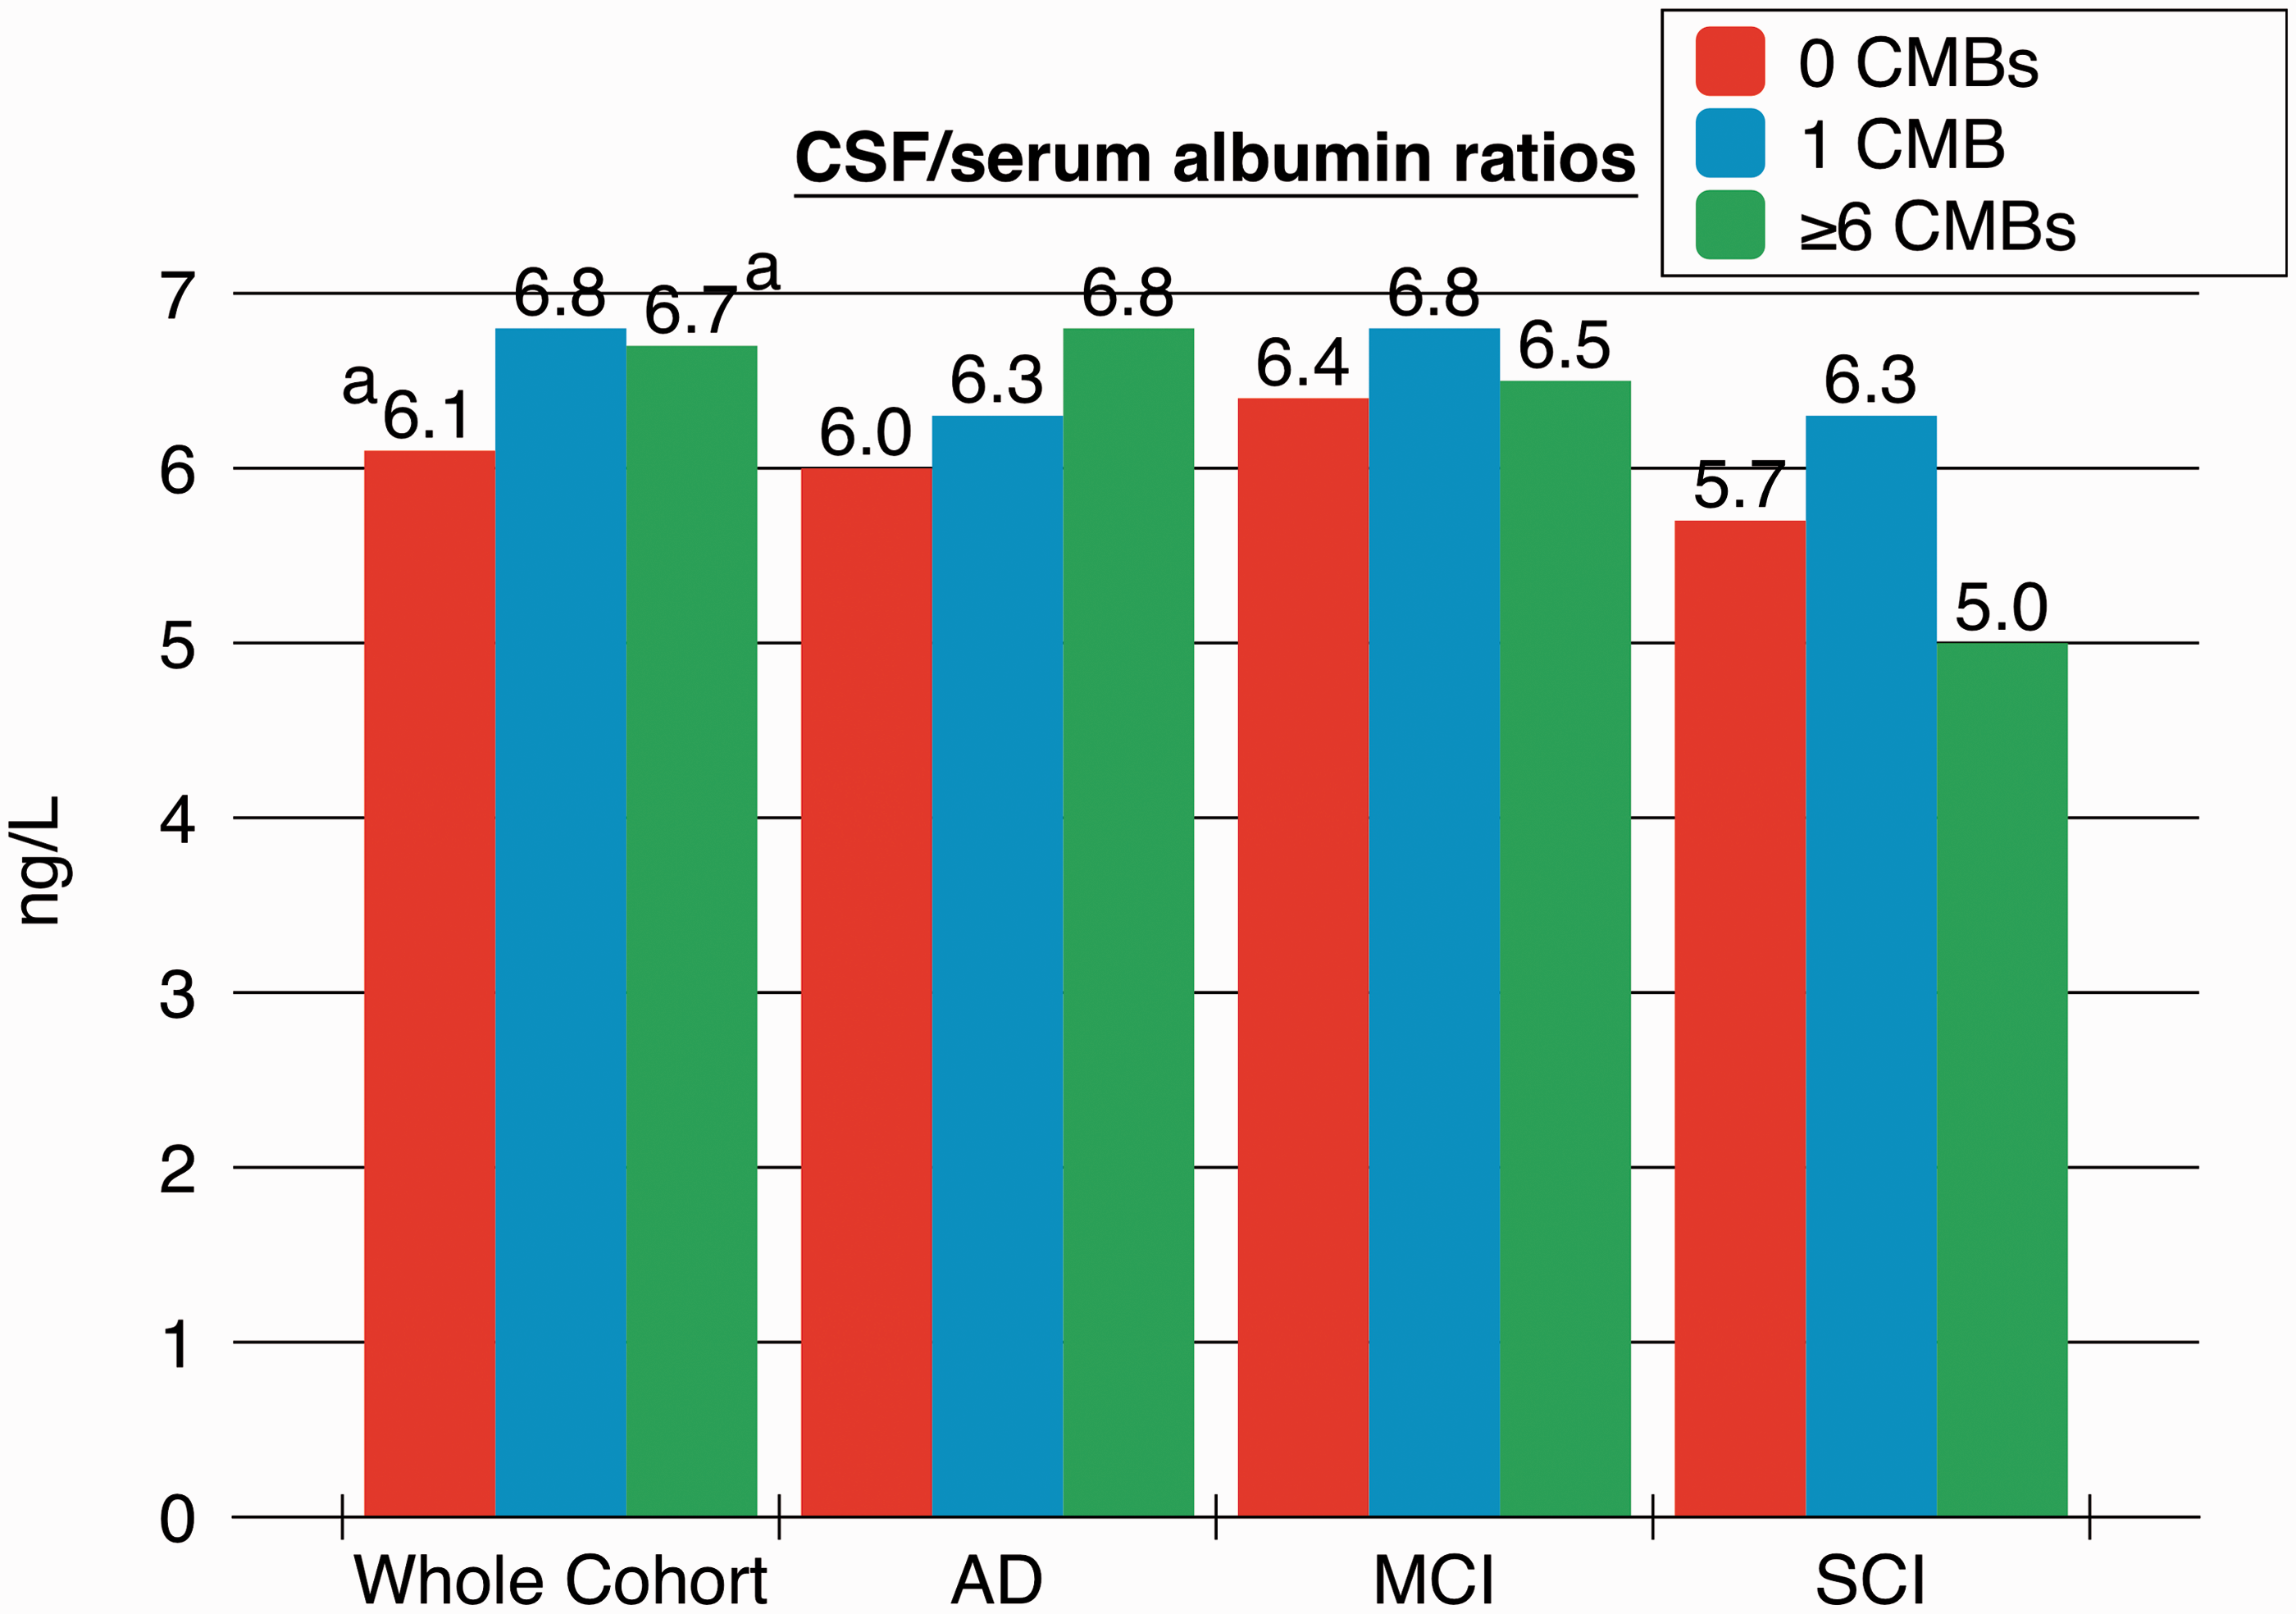
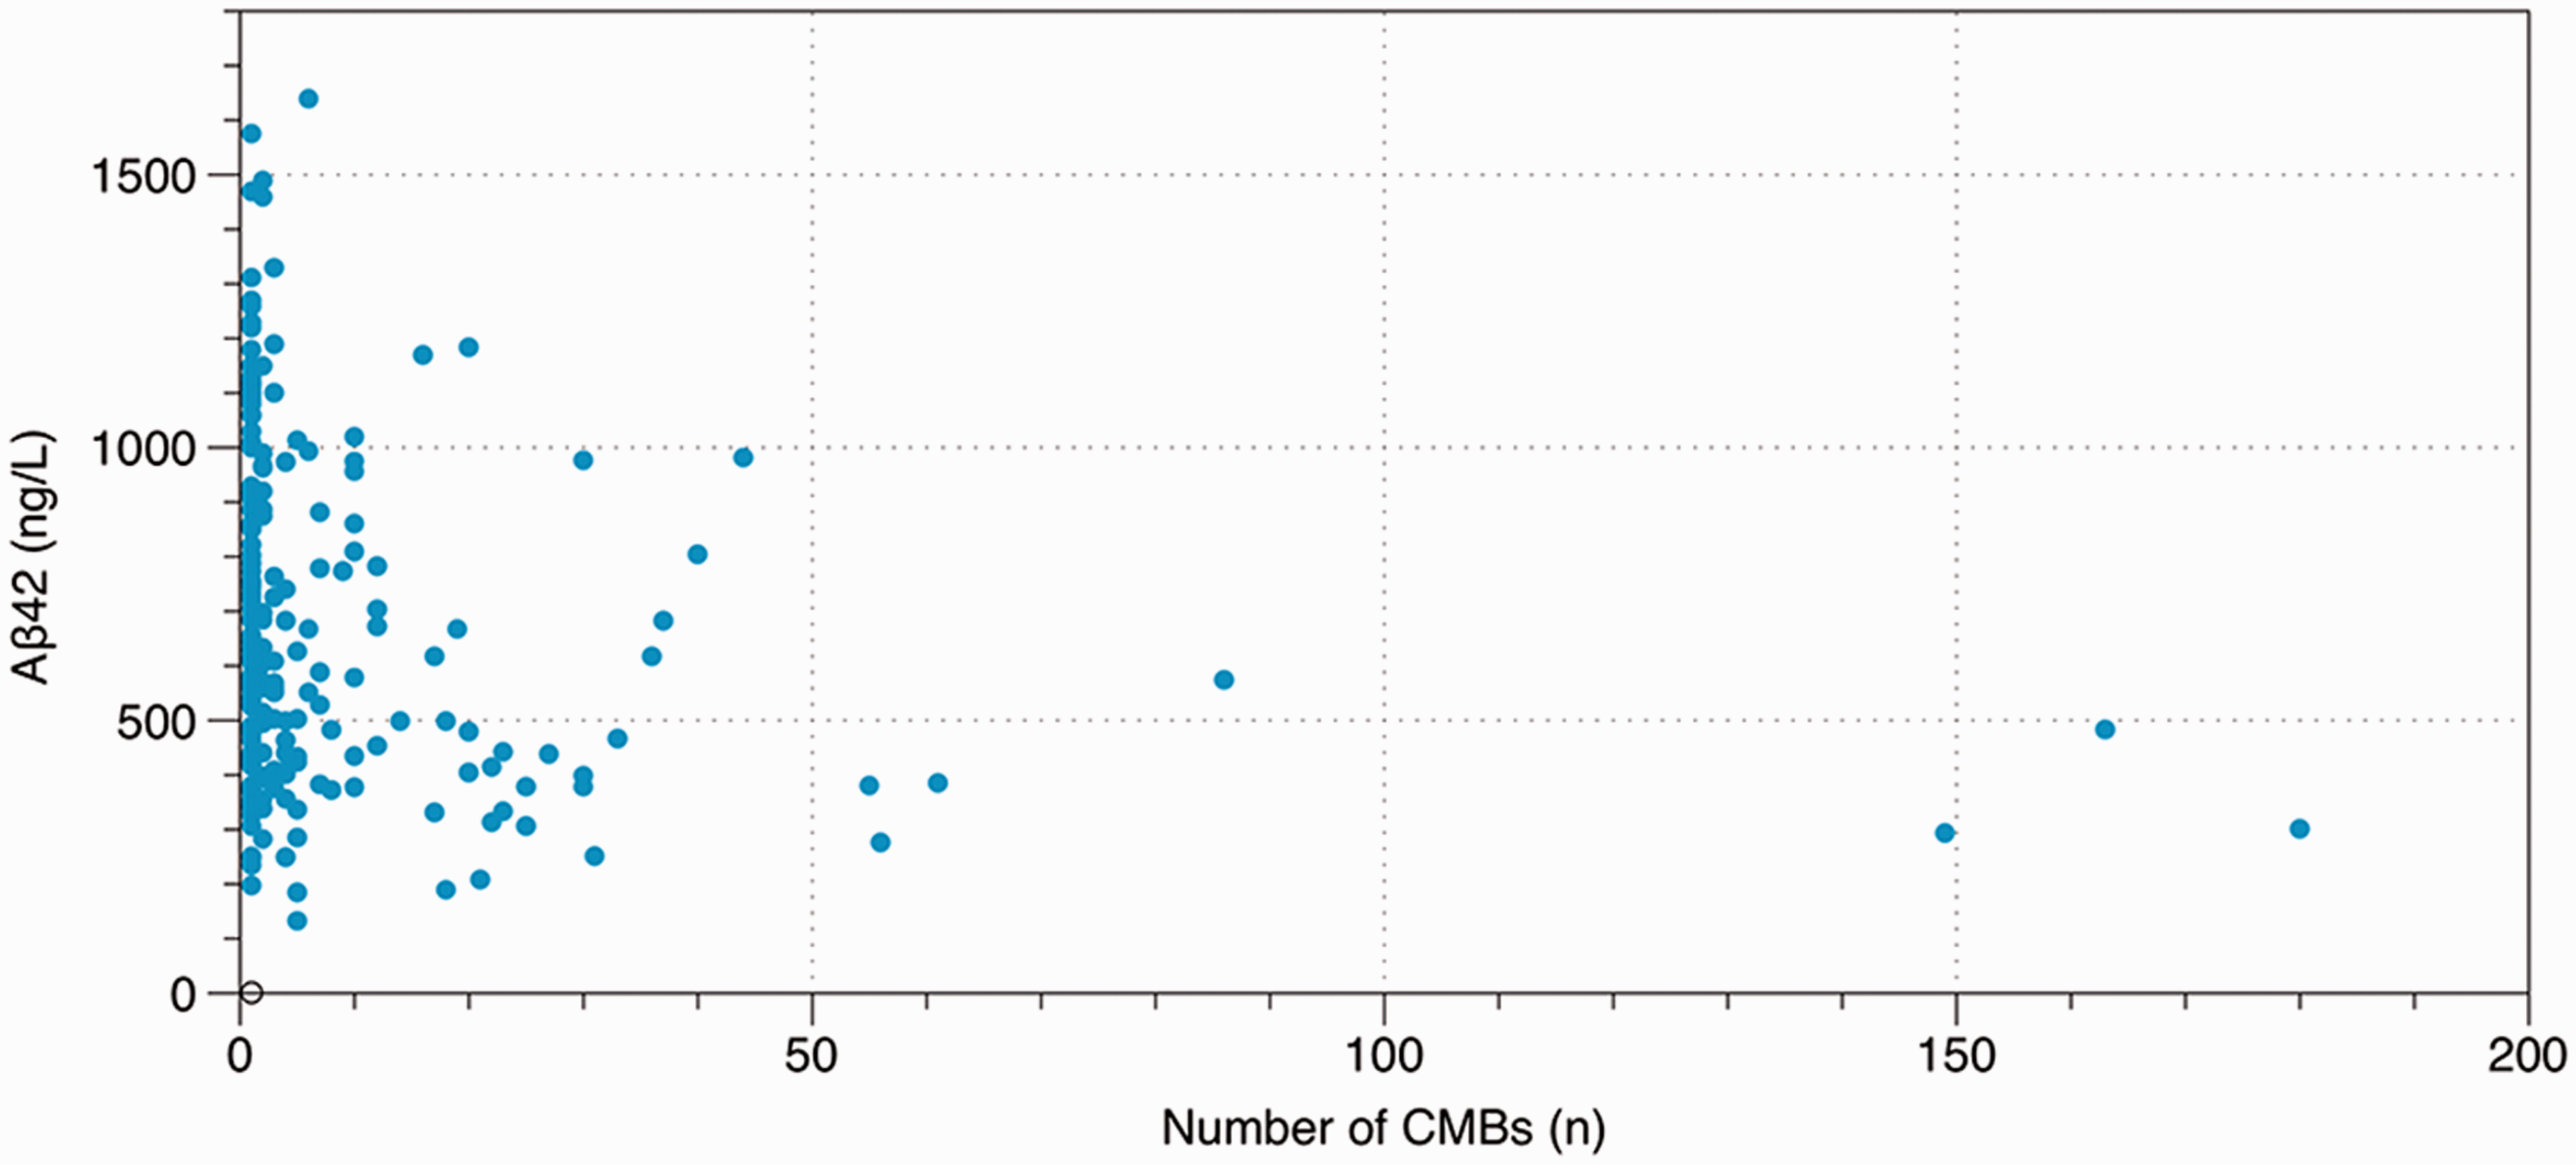
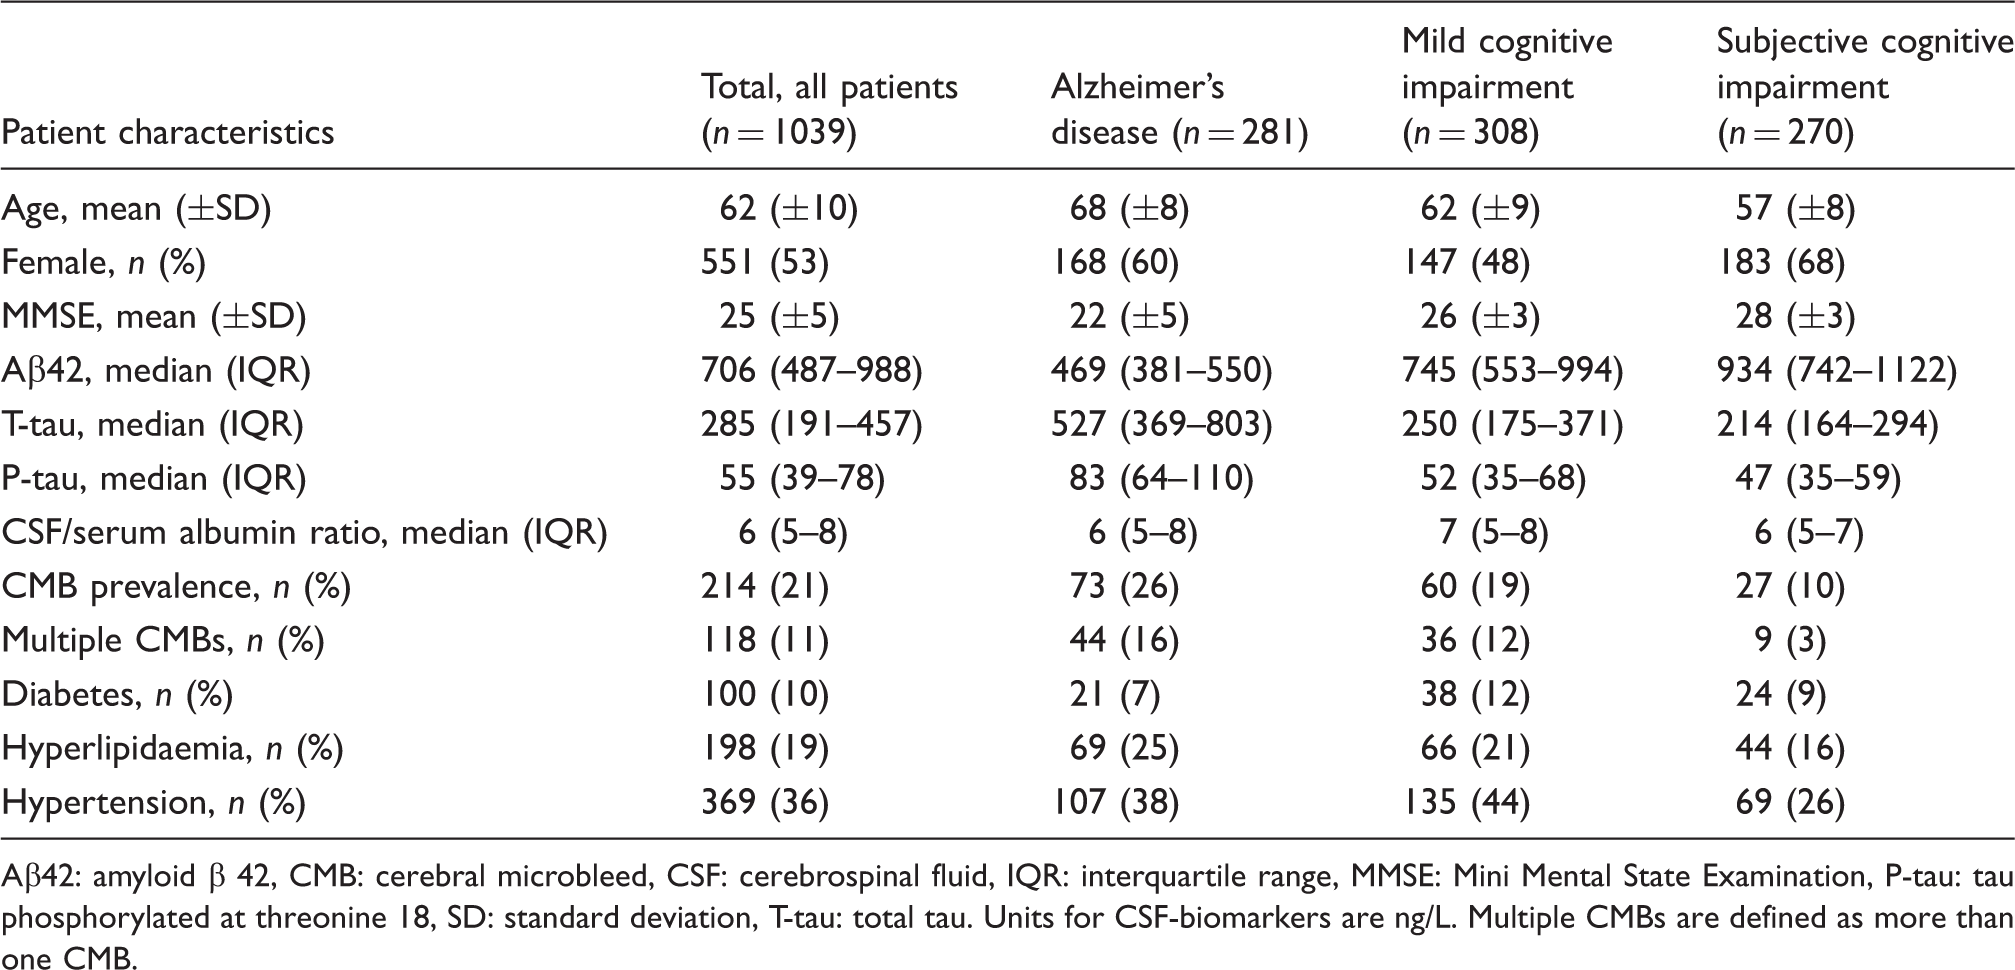
Baseline data for the cohort is presented in Table 2. We stratified our analysis for associations with CSF-biomarkers in patients with 0, 1 and ≥6 CMBs (Figure 1). In the whole cohort Aβ42 levels in patients with ≥6 CMBs were significantly lower than in patients with 1 (p = 0.007) or 0 (p < 0.001) CMBs. In patients with Alzheimer’s disease Aβ42 levels was lower in patients with ≥6 CMBs when compared to 0 CMBs (p = 0.01); T-tau and P-tau levels were considerably lower in patients with ≥6 CMBs, compared with patients with 0 CMBs (p < 0.01). Patients with mild cognitive impairment showed lower Aβ42 levels with ≥6 CMBs when compared to 0 CMBs (p = 0.02). No other differences between the groups were noted. In the whole cohort CSF/serum albumin ratios were increased with ≥6 CMBs, compared to 0 CMBs (p = 0.04) (Figure 2). No other differences in CSF/serum albumin ratios were noted between the groups. Figure 3 demonstrates the decline of Aβ42 levels with increasing number of CMBs in the whole cohort.
Number of CMBs and CSF-biomarkers analysed by ANOVAs with post hoc Bonferroni correction. The median value of CSF-biomarkers is shown. Interquartile range is displayed in error bars. In Alzheimer’s disease for T-tau the higher end of the error bar is: red bar 820, blue bar 674, green bar 820. In subjective cognitive impairment the higher end of the error bar for the blue bar is 1223. ap < 0.001, bp < 0.01, cp < 0.05. ANOVA: analysis of variance, CMB: cerebral microbleed, CSF: cerebrospinal fluid, T-tau: total tau. CSF/serum albumin ratios and associations with increasing number of CMBs, analysed by ANOVAs with post hoc Bonferroni correction. For AD the higher end of the error bar represents, red bar 8.0, blue bar 7.9, green bar 8.5; MCI, red bar 8.0, blue bar 8.6, green bar 8.6; SCI, blue bar 7.7. AD: Alzheimer’s disease; ANOVA: analysis of variance, CMB: cerebral microbleed, CSF: cerebrospinal fluid, MCI: mild cognitive impairment, SCI: subjective cognitive impairment, T-tau: total tau. ap < 0.001, bp < 0.01, cp < 0.05. A scatterplot of Aβ42 levels and number of CMBs in the whole cohort. Aβ42: amyloid β 42, CMBs: cerebral microbleeds. Baseline data. Aβ42: amyloid β 42, CMB: cerebral microbleed, CSF: cerebrospinal fluid, IQR: interquartile range, MMSE: Mini Mental State Examination, P-tau: tau phosphorylated at threonine 18, SD: standard deviation, T-tau: total tau. Units for CSF-biomarkers are ng/L. Multiple CMBs are defined as more than one CMB.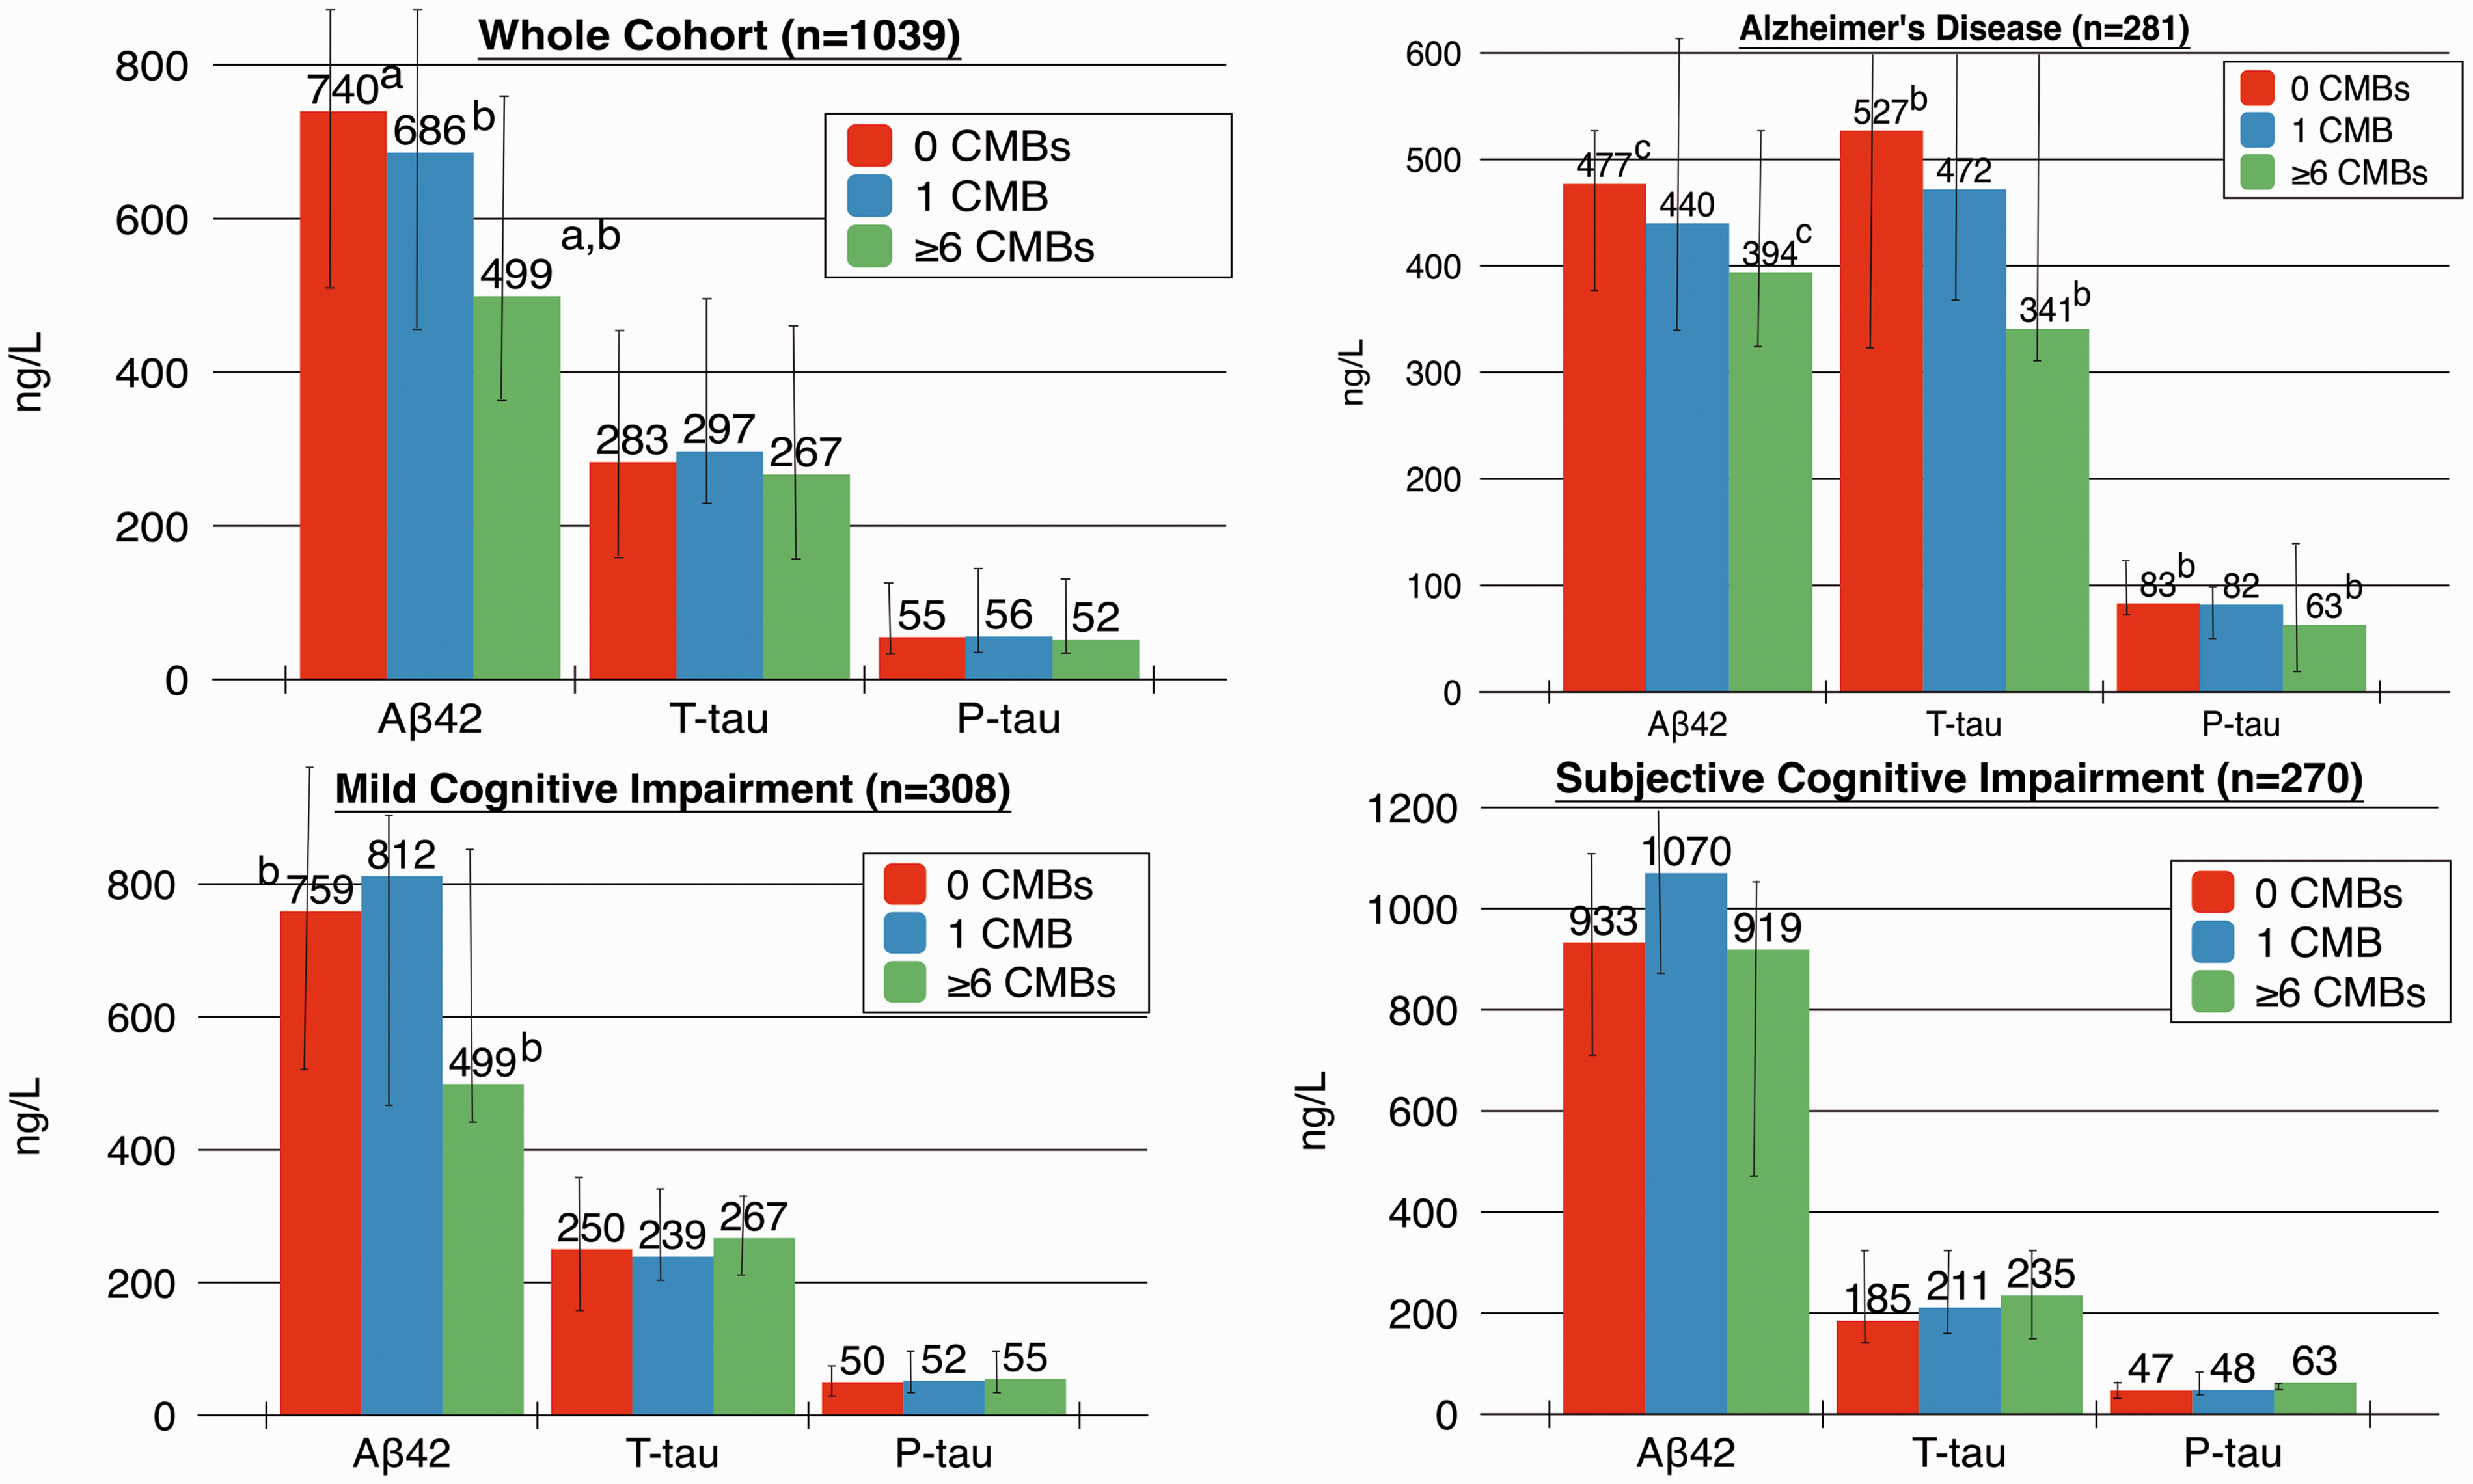
A separate analysis for vascular dementia (n = 25) showed no significant differences between CSF associations and number of CMBs. Stratifying groups into patients with hypertension and Alzheimer’s disease/vascular dementia showed no change in Aβ42 levels over varying numbers of CMBs. T-tau (p = 0.005) and P-tau (p < 0.001) were lower with ≥6 CMBs when compared to 0 CMBs. There was no difference in CSF/serum albumin ratios. Figure 4 shows the association between CMBs and CSF-biomarkers in the two groups. Similar analysis in Alzheimer’s disease with and without hypertension showed no significant association between CMBs and CSF-biomarkers.
Number of CMBs and CSF-biomarkers analysed by ANOVAs with post hoc Bonferroni correction. The median value of CSF-biomarkers is shown. AD: Alzheimer’s disease, ANOVA, analysis of variance, CMBs: cerebral microbleeds, CSF: cerebrospinal fluid, VaD: vascular dementia. ap < 0.01.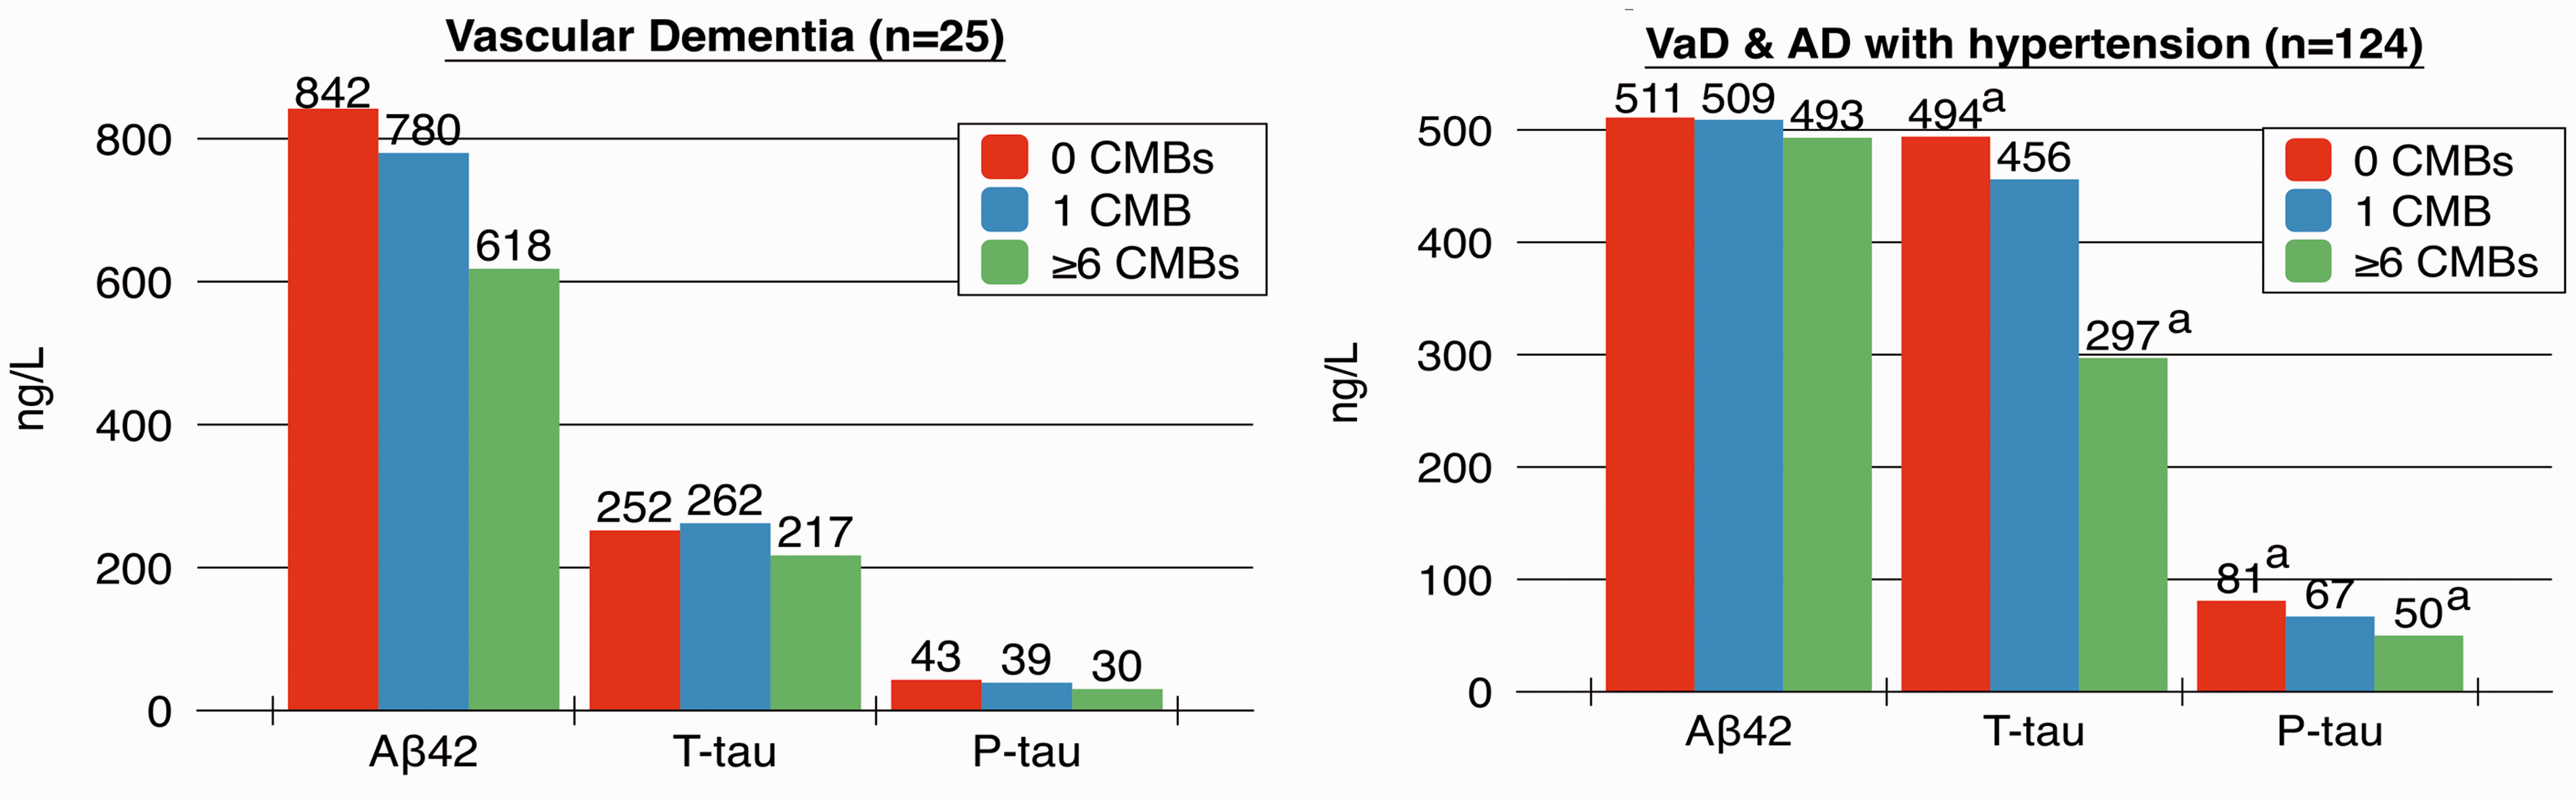
Independent associations of CMBs with CSF-biomarkers
Number of CMBs and the association with CSF-biomarkers.
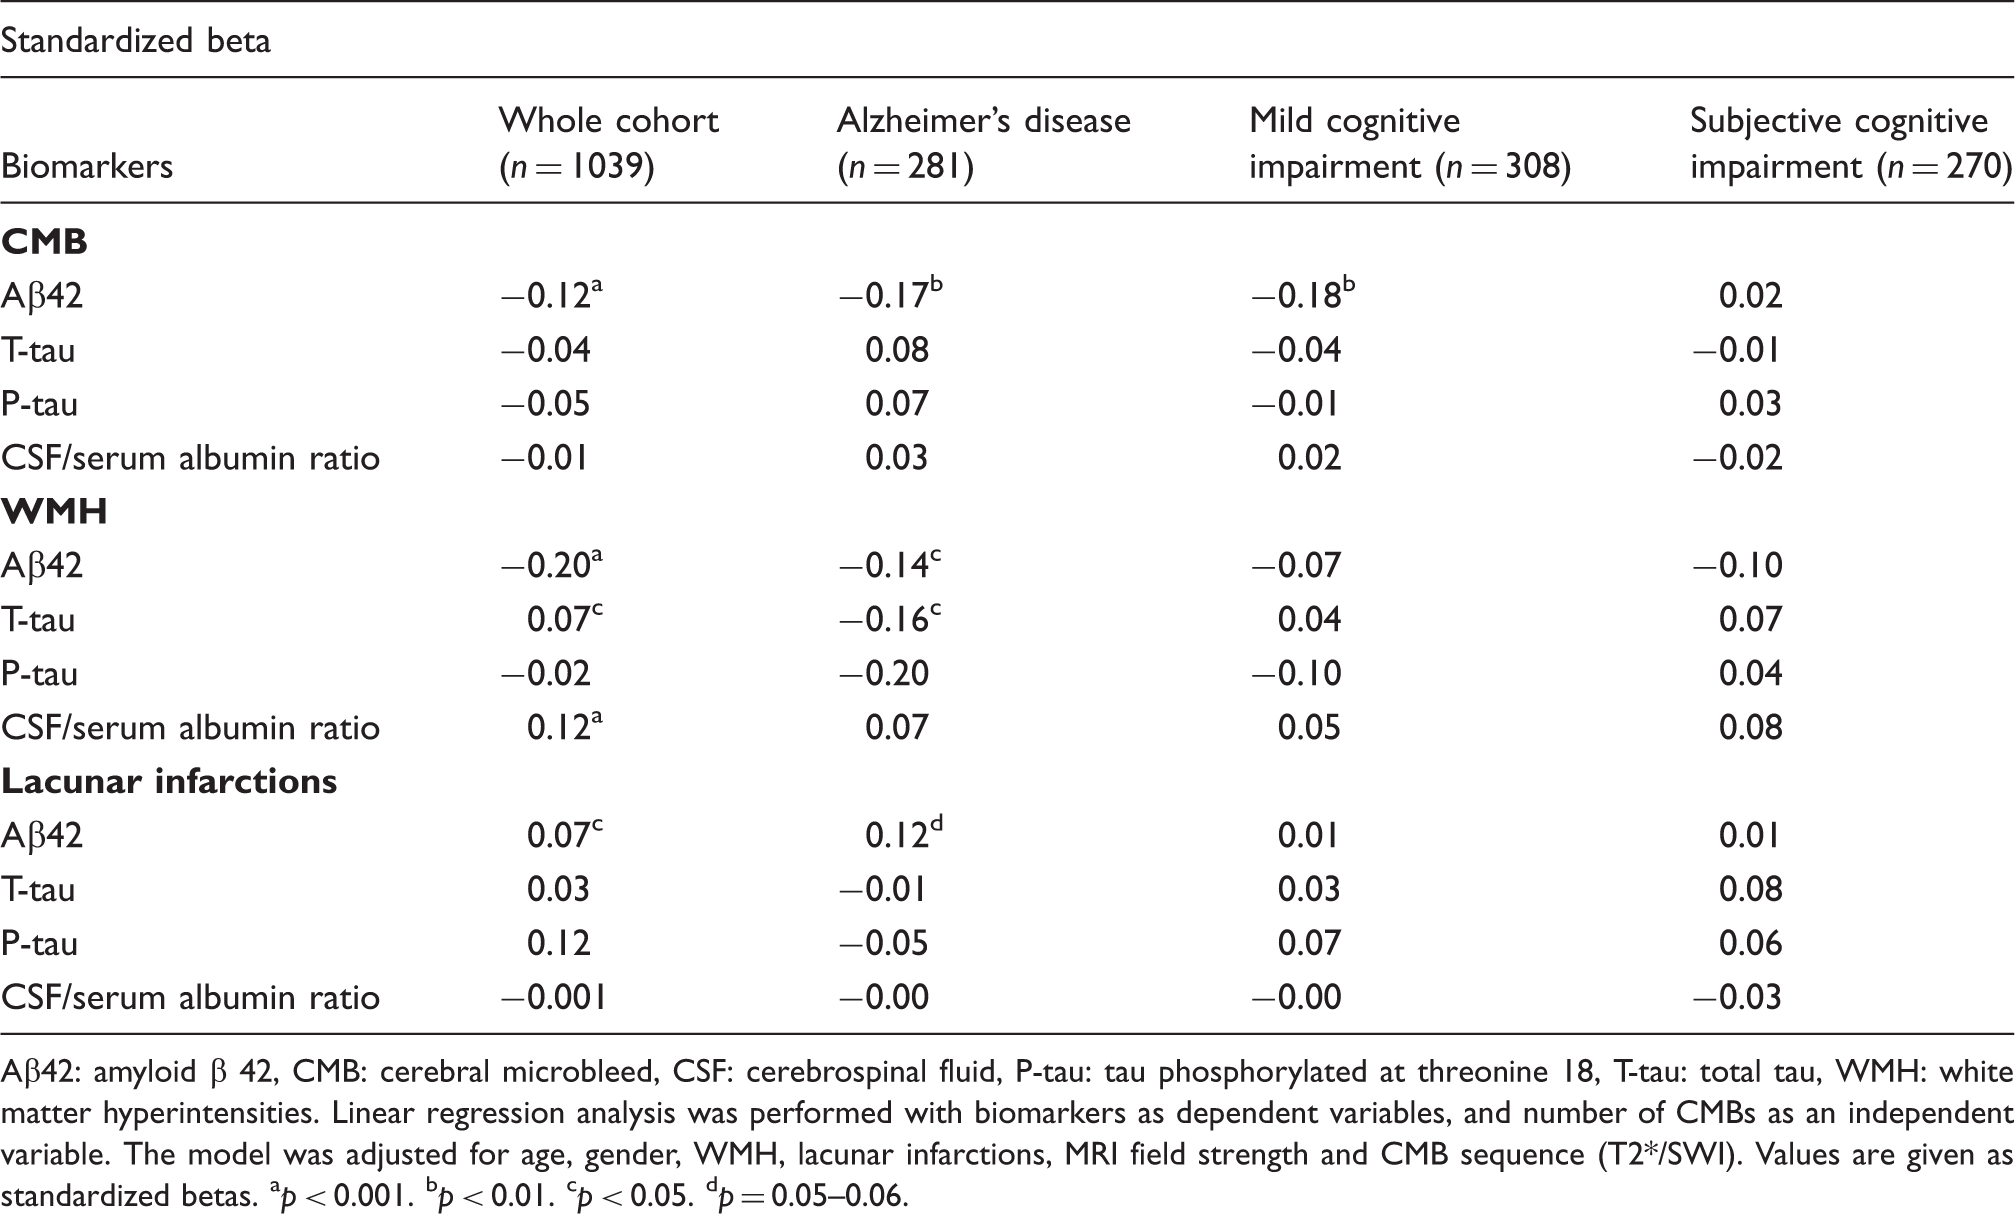
Aβ42: amyloid β 42, CMB: cerebral microbleed, CSF: cerebrospinal fluid, P-tau: tau phosphorylated at threonine 18, T-tau: total tau, WMH: white matter hyperintensities.
Linear regression analysis was performed with biomarkers as dependent variables, and number of CMBs as an independent variable. The model was adjusted for age, gender, WMH, lacunar infarctions, MRI field strength and CMB sequence (T2*/SWI). Values are given as standardized betas.
p < 0.001.
p < 0.01.
p < 0.05.
p = 0.05–0.06.
Discussion
CMBs are independently associated with Aβ42, and Aβ42 levels are decreased with increased number of CMBs, without much effect on other routine clinical CSF-biomarkers. CSF/serum albumin ratios are increased with multiple CMBs, reflecting disrupted integrity of the blood–brain barrier. This suggests that CMBs are associated with Aβ42 deposits in the brain and vasculature, without much association with neuronal degeneration and neurofibrillary tangles, as represented by T-tau and P-tau, respectively.
Previous studies on CMBs and associations with CSF-biomarkers in dementia are scarce. Kester et al. investigated CMBs in a large population of Alzheimer’s disease, subjective cognitive impairment and vascular dementia and demonstrated, in accordance with our results, lower levels of Aβ42 with CMBs in both Alzheimer’s disease and vascular dementia. 11 Similar to our study no clear trend on T-tau and P-tau by CMBs was observed. Besides the study by Kester et al., previous studies on CMBs and CSF-biomarkers in memory clinic populations are scarce and mostly lacking in power. Goos et al. investigated 21 Alzheimer’s patients with multiple CMBs (≥8), comparing them to Alzheimer’s patients without CMBs, and demonstrated low Aβ42 levels with CMBs, as well as high T-tau and P-tau levels with CMBs. 10 In a further study by the group, patients with Alzheimer’s disease and CMBs had lower Aβ42 levels, when compared to patients with Alzheimer’s disease without CMBs; there was no difference in Aβ40, P-tau, T-tau and CSF/serum albumin ratios, between the two groups. 12 Studies comparing CSF profiles between patients with CAA and Alzheimer’s disease have shown lower Aβ4213,14 and Aβ4013,14 levels in CAA, when compared with Alzheimer’s disease.
The change in Aβ42 levels, but not in T-tau and P-tau levels, in our study may imply, either a direct relationship of CMBs with Alzheimer’s disease pathology or with CAA. Aβ42 is one of the first biomarkers to change in the Alzheimer’s disease process,15,16 and has further been shown to decrease in CAA.13,14 However, Aβ42 is not only exclusive for these two diseases but has also been shown to be decreased in vascular dementia, for instance.17,18 Thus our finding possibly reflects the increased Aβ42 deposition in the brain and vasculature with CMBs, implying that intensity of the disease process, reflected by neuronal degeneration, T-tau, is not affected. In Alzheimer’s disease low T-tau and P-tau were noted with increasing CMBs, and this supports the fact that CMBs are not associated with tau, but rather with amyloid pathology. Similarly, PET-studies with the Pittsburgh compound B (PiB) have shown increased retention of PiB with CAA caused CMBs.19,20 Low Aβ42 levels with increasing numbers of CMBs suggests an accumulative effect. The higher CSF/serum albumin ratio with CMBs likely represents the microvascular damage caused by small vessel disease. In the independent analysis increased WMH was shown to be associated with higher CSF/serum albumin ratios, suggesting that WMH is an especially appropriate marker reflecting blood–brain barrier dysfunction. 1 The high T-tau with WMH, seen in the whole cohort, may in turn reflect the fact that WMH represents a disrupted blood–brain barrier, causing neuronal degeneration. Lacunar infarctions were associated with high Aβ42 levels, and this may imply that their pathogenesis differs from CAA or Alzheimer’s pathology, being more often due to hypertensive arteriopathy.
When analysing patients with a presumed higher hypertensive arteriopathy burden, i.e. patients with vascular dementia, and patients with Alzheimer’s disease with hypertension, Aβ42 levels no longer decreased with increasing CMBs, although there was a trend in vascular dementia alone. The lack of association in vascular dementia may be due to low sample size. However, the missing association with decreasing Ab42 levels in Alzheimer’s disease and vascular dementia with hypertension suggests that these patients likely have small vessel disease that is predominantly hypertensive arteriopathy. The decreased T-tau and P-tau with increasing CMBs is in line with our prior results. This analysis is interesting as it highlights the significant overlap between Alzheimer’s disease and vascular dementia. 21
The strengths of our study are a large cohort, with a continuum of cognitive impairment, as well as rigorous and standardized MRI interpretations. The measurement of Aβ40 would have added additional insight, and may have helped in differentiating between Alzheimer pathology and CAA when studying the associations of CMBs. Aβ40 was however not available in our routine clinical protocol, but analyses are planned on a subgroup of this cohort, with CSF samples saved in a biobank. The use of different MRI field strengths, similar to the study by Kester et al., 11 is a limitation. Further the use of different CMB sequences is also a limitation. However we adjusted all regression analyses for varying MRI parameters, to account for the possible effect of differing MRI variables. The memory clinic team assigning final diagnosis of our patients moreover had access to all clinical data, allowing for circular reasoning when assigning the final dementia diagnosis, which may be seen as a limitation. Additionally for conclusions on causality to be drawn between CMBs and CSF-biomarkers, a longitudinal study design is warranted.
We show that CMBs are primarily associated with changes in Aβ42 and that there is an accumulative effect with increasing number of CMBs. CSF/serum albumin ratios are high with CMBs, and reflect accompanying blood–brain barrier dysfunction with small vessel disease.
Footnotes
Funding
The author(s) disclosed receipt of the following financial support for the research, authorship, and/or publication of this article: Stockholm County Council, Karolinska Institutet and the Swedish Dementia Association.
Declaration of conflicting interests
The author(s) declared no potential conflicts of interest with respect to the research, authorship, and/or publication of this article.
Authors’ contributions
SS established the database, planned the study, analysed all MR images, did the statistical data analysis and drafted the manuscript. TG planned the study, did a pilot study to determine final cohort size, analysed the data and established the database. JM analysed the MR images and planned the study. XL planned the study. MS established the database and did statistical data analysis. SMF did statistical data analysis. LC planned the study. PA planned the study and had main responsibility. MKW planned the study and had the main responsibility for MRI scanner logistics in patient recruitment. LOW planned the study and had the main responsibility in patient recruitment. All authors contributed to the interpretation of data and revised the manuscript. SS is guarantor.
References
Supplementary Material
Please find the following supplemental material available below.
For Open Access articles published under a Creative Commons License, all supplemental material carries the same license as the article it is associated with.
For non-Open Access articles published, all supplemental material carries a non-exclusive license, and permission requests for re-use of supplemental material or any part of supplemental material shall be sent directly to the copyright owner as specified in the copyright notice associated with the article.