
Abstract
A hallmark of non-rapid eye movement (REM) sleep is the decreased brain activity as measured by global reductions in cerebral blood flow, oxygen metabolism, and glucose metabolism. It is unknown whether the blood oxygen level dependent (BOLD) signal undergoes similar changes. Here we show that, in contrast to the decreases in blood flow and metabolism, the mean global BOLD signal increases with sleep depth in a regionally non-uniform manner throughout gray matter. We relate our findings to the circulatory and metabolic processes influencing the BOLD signal and conclude that because oxygen consumption decreases proportionately more than blood flow in sleep, the resulting decrease in paramagnetic deoxyhemoglobin accounts for the increase in mean global BOLD signal.
Introduction
Change in OEF, CBF, and CMRO2 during sleep.
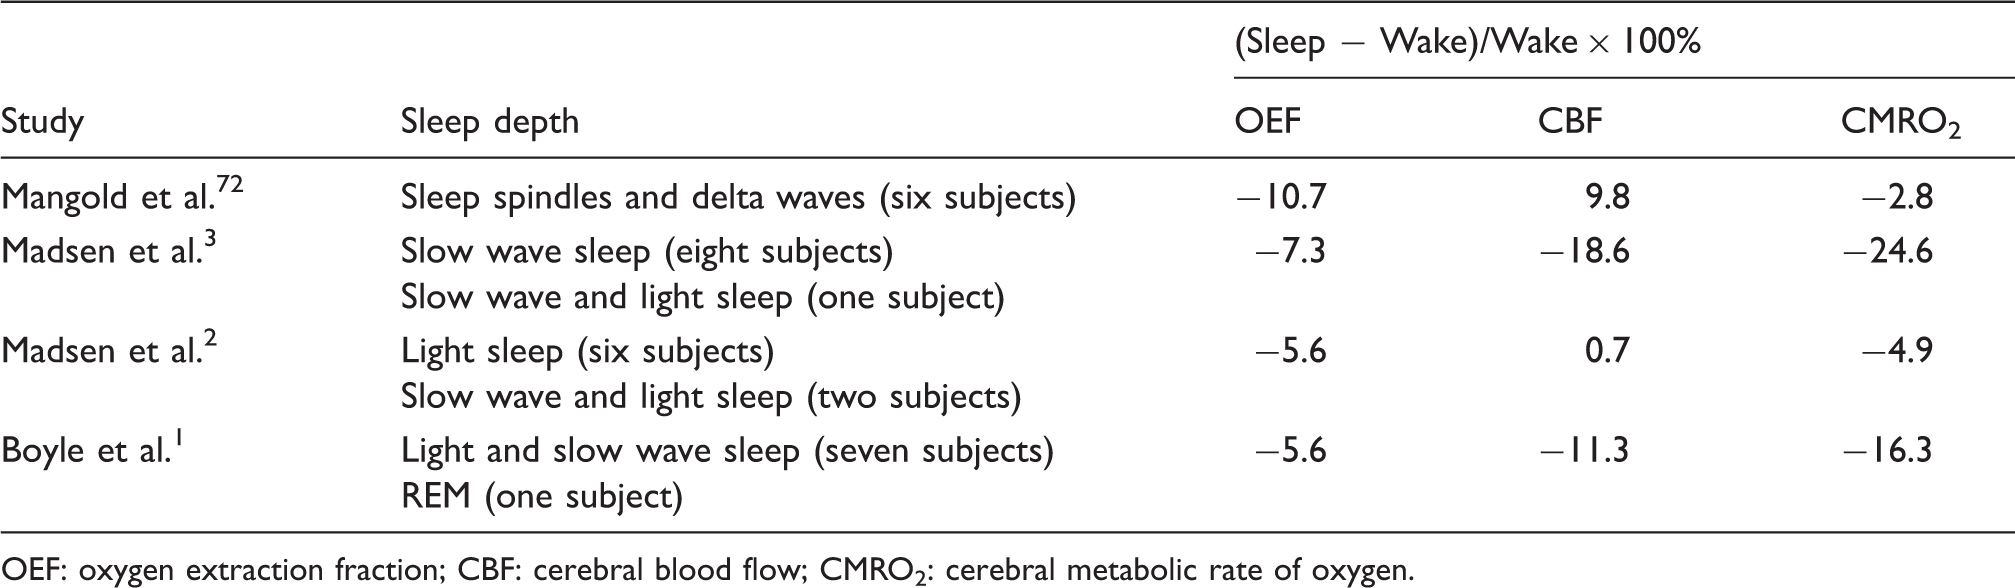
OEF: oxygen extraction fraction; CBF: cerebral blood flow; CMRO2: cerebral metabolic rate of oxygen.
A continued source of controversy in resting-state BOLD functional magnetic resonance imaging (fMRI) has been the whole brain mean signal, termed the global signal, as its removal affects the topography among and relationship between the brain’s systems in studies of intrinsic functional connectivity.23,24 Although the global signal includes nonneuronal components reflecting cardiac signals, 25 respiratory signals, 26 and head movement, 27 simultaneous electrophysiological and fMRI recordings in nonhuman primates suggest the presence of an important neuronal component.28,29
Recent work has found that hemispherical differences in the global BOLD signal’s spontaneous fluctuations can be exploited to map the human brain’s lateralized organization 30 which changes during non-REM sleep. 31 In addition, the amplitude of the global BOLD signal’s spontaneous fluctuations is modulated by arousal, 29 vigilance, 32 sleep depth, 31 and sleep deprivation. 33 By examining changes in the spontaneous fluctuations, these previous studies examined changes in variance. Mean global signal changes were not examined.
BOLD studies of non-REM sleep have investigated spontaneous fluctuations extensively, including changes in amplitude,31,34,35 temporal dynamics,36–38 and functional connectivity,31,39–45 but the mean signal which accompanies these fluctuations has yet to be explored. Do tonic changes in the global signal mirror the reported metabolic decreases? To answer that question, we extracted the global component of the ongoing BOLD signal and show that the mean global signal in gray matter increases significantly with sleep depth.
Material and methods
Subjects, EEG-fMRI acquisition, and artifact correction
The experiments were conducted according to the Helsinki Declaration of 1975 (and as revised in 1983) and were approved by the Ethik-Kommission des Fachbereichs Medizin der Goethe-Universität Frankfurt am Main (Geschaefts-Nr.: 305/07). Written informed consent was obtained from all subjects. Seventy-one right-handed (mean ± SD age 24.3 ± 4.7 years, range 19–48, 44 females) non-sleep-deprived subjects were scanned in the evening at ∼8:00 PM. Subjects were instructed to close their eyes and lie still and relaxed. No specific instruction was given to fall asleep or maintain wakefulness. Acquisition parameters and details for these data have been published previously. 46 Briefly, fMRI was acquired in a single 52.2 min scan using a 3 T Siemens Trio (Erlangen, Germany) (1,505 volumes of T2*-weighted echo planar images, TR/TE = 2.080 ms/30 ms, matrix 64 × 64, voxel size 3 × 3 × 2 mm3, distance factor 50%; FOV 192 mm2) with an optimized polysomnographic setting (chin and tibial EMG, ECG, EOG recorded bipolarly—sampling rate 5 kHz, low-pass filter 1 kHz) simultaneously with 30 electroencephalographic (EEG) channels recorded via a cap (modified BrainCapMR, Easycap, Herrsching, Germany; 5 kOhm safety resistors in all electrodes) with FCz as the reference (sampling rate 5 kHz, low-pass filter 250 Hz, high pass filter 0.016 Hz) using MR compatible amplifiers (BrainAmp MR+, BrainAmp ExG; Brain Products, Gilching, Germany), pulse oximetry, and respiration recorded via sensors from the Trio (sampling rate 50 Hz). The threshold for electrode impedances was 35 kOhm, though impedances typically remained below 30 kOhm. MRI and pulse artifact correction were performed based on the average artifact subtraction method 47 as implemented in Vision Analyzer2 (Brain Products, Germany) followed by independent component analysis based rejection of residual artifact components (Cardioballistogram Correction parameters; Vision Analyzer). Sleep stages were scored in 30 s epochs by an expert according to the American Academy of Sleep Medicine criteria. 48
Image preprocessing
Image preprocessing included the following steps: (1) compensation for slice-dependent time shifts, (2) elimination of odd/even slice intensity differences due to interleaved acquisition, and (3) realignment of all data acquired in each subject within and across runs to compensate for rigid body motion. 49 The functional data were transformed into atlas space 50 by computing a sequence of affine transformations (first frame of BOLD run to MP-RAGE to atlas representative target without compensation for local distortions between echo planar images and anatomy) which were combined by matrix multiplication, resampling to a 2 mm isotropic grid. For cross-modal (i.e. functional to structural) image registration, a locally developed algorithm was used. 51
Modeling and extracting the global signal
The BOLD time series was modeled with a general linear model that included terms for the global signal (global), white matter (WM), and ventricles (CSF: cerebrospinal fluid) that were separated by sleep stage (W, N1, N2, and N3) and whether the scored epoch was less than 60 s (short and long). The global signal regressor was formed from a whole brain mask that included the cerebellum, WM, and ventricles but not extra-axial CSF, while WM and ventricular regressors were formed from each individual’s eroded WM and ventricular masks.
52
Regressors were computed by removing the linear trend and constant at each voxel, averaging over voxels within the respective mask, separated into scored epochs then assigned to the appropriate short regressor if the epoch was less than 60 s or long if otherwise. Although the general linear model included regressors for all sleep stages, during a given epoch as determined by the scoring, only a single regressor had values representing the BOLD fluctuations of that region (i.e. global, WM, and CSF), while the others were set to zero. For example, during an epoch scored as “wakefulness,” the global, WM, and CSF “wakefulness” regressors held nonzero values, while the N1, N2, and N3 sleep regressors held zeros. Thus, the regressors for the different stages were orthogonal. This is clarified in Figure 1 which shows a portion of a design matrix.
Two portions of a design matrix from a single subject illustrating the layout of the global, white matter and CSF regressors and their separation into long and short epochs. This subject lacked a wakefulness epoch less than 60s hence the omission of the Wshort regressor. Time increases downward. Solid gray areas are zero valued. Vertical blocks with changing grayscale contrast reflect varying signal intensity and the extent of the regressor. The solid white horizontal block separates the two portions.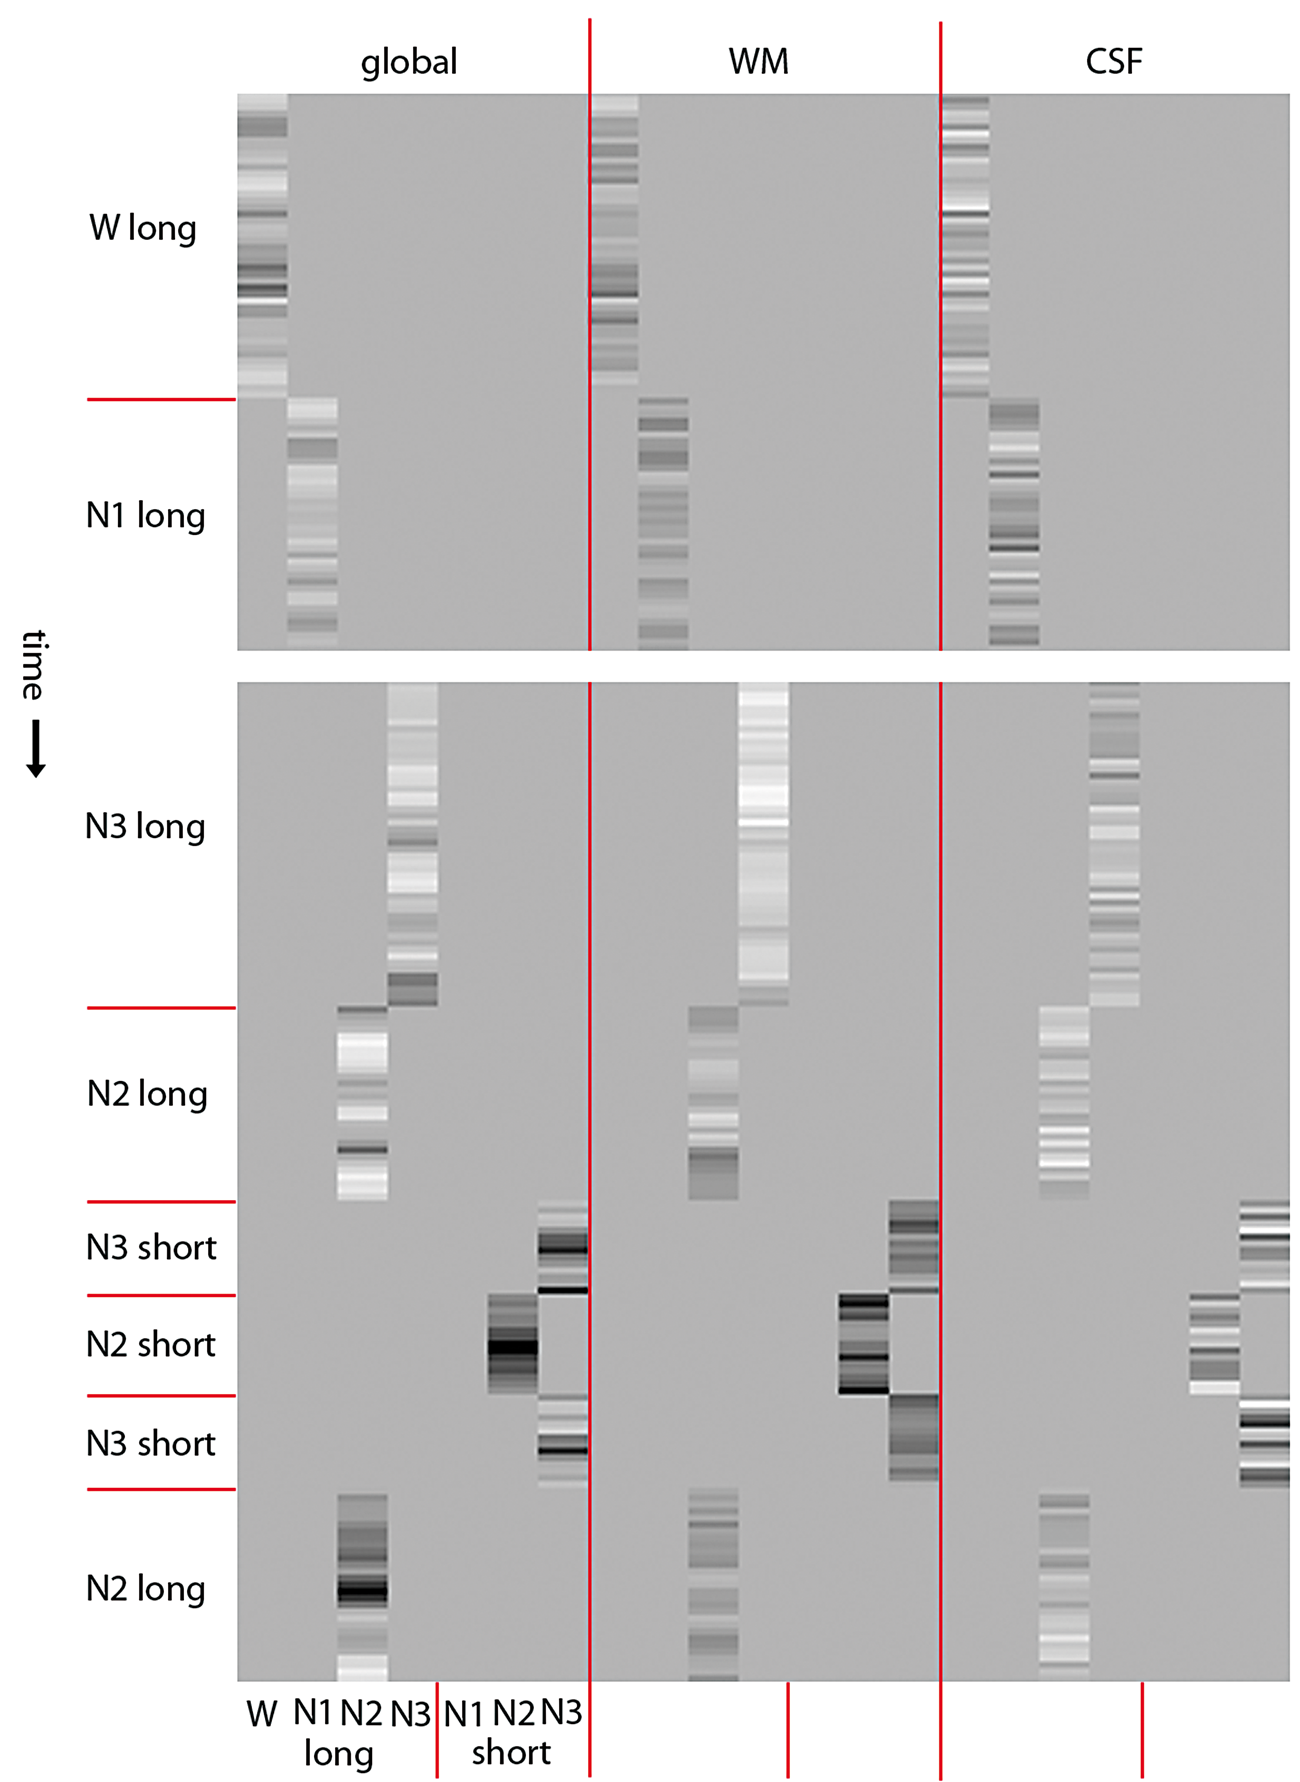
Subject-specific general linear models
53
were fit to BOLD time series at each voxel as shown schematically below
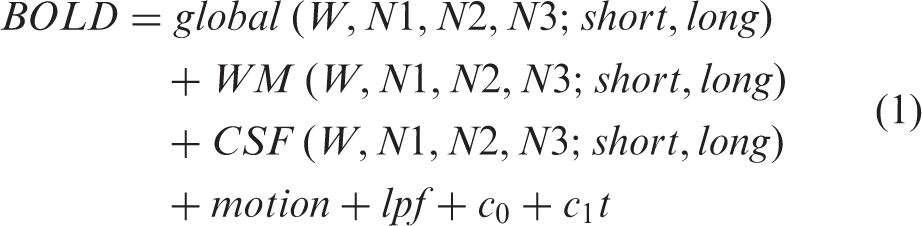
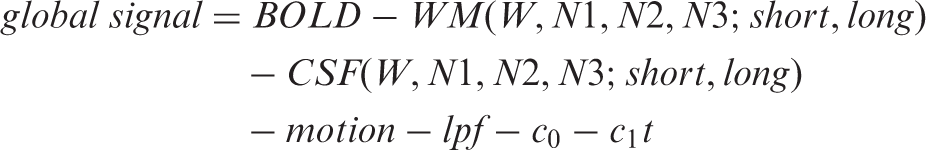
The global signal was extracted from the BOLD time series by regressing all terms in equation (1) except those pertaining to the global signal.
The mean global signal was computed by averaging over all volumes that were part of a long epoch, then normalizing by the constant c0. For example, the mean global signal for wakefulness was
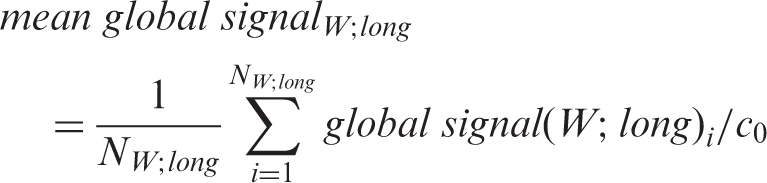
Considering each stage, all 71 subjects had at least a single long epoch (≥60 s) of wakefulness, 58 subjects had at least a single long epoch of N1 sleep, 42 subjects had at least a single long epoch of N2 sleep, and 19 subjects had at least a single long epoch of N3 sleep. Sufficient short epochs were not present for further analysis. 31 For voxelwise analyses, this was followed by spatial smoothing with a 4 mm full width at half maximum three-dimensional Gaussian kernel to blur individual differences in brain anatomy.
Mean global signal: Voxelwise direct statistical comparisons of differential effects
Since only 19 of the 71 subjects were observed with at least a single long epoch for each sleep stage, the direct statistical comparison of the mean global signal with sleep depth over all 71 subjects was one of unbalanced data that were solved with a linear mixed effects model. 57 This random intercept model (i.e. different intercepts for each subject) implements an analysis of variance (ANOVA) with a random factor of subjects at 71 levels and a fixed factor of sleep stage at 4 levels (W, N1, N2, and N3). This analysis produced an F statistic for the main effect of sleep stage reflecting the direct comparison of the four stages of non-REM sleep. The F statistic was z-transformed and corrected for multiple comparisons (|z| ≥ 3.0, minimum 45 face connected voxels, P < 0.05 corrected) with a Monte Carlo-based method.58,59
Mean global signal: Principal component analysis
Group averaged mean global signal maps were formed for each sleep stage. These maps comprised the four features (W, N1, N2, and N3) with all significant voxels from the main effect of sleep stage as the observations for a principal component analysis. The first component was then projected back on the brain by computing the inner product with the group averaged mean global signal maps at each voxel.
Minimally processed signal
Subject-specific general linear models
53
were fit to the BOLD time series at each voxel with a model that included only the constant c0 and linear trend
We wished to compare the mean global signal which is modeled with a complete set of terms (equation (1)) considered appropriate for the analysis of resting-state data 52 to a minimally processed signal that lacks the regression of WM, ventricular and motion signals along with the filtering of signals above 0.08 Hz. For the latter, respiratory and cardiac fluctuations are aliased through the entire frequency spectrum of the BOLD signal, however, above 0.08 Hz the amplitude of these aliased signals is greatly increased. 56 Thus, the minimally processed signal includes a greater contribution from nonneuronal sources. 60
Global-signal-regressed signal
The global-signal-regressed (GSR) signal was extracted from the BOLD time series by regressing all terms in equation (1) including the global signal. This signal is equivalent to that commonly used in resting-state functional connectivity studies. 52 The statistical analysis of the GSR signal paralleled that of the global signal.
Post hoc comparisons: Regional direct statistical comparisons of differential effects
Post hoc comparisons included three regional group level linear mixed effects analyses: wakefulness vs. N1 sleep (71 subjects), N2 vs. N2 sleep (58 subjects), and N2 vs. N3 sleep (42 subjects). Use of linear mixed effects allows the analysis of all subjects even if they experienced only one of the two stages under comparison (i.e. unbalanced data). 57 All analyses used a random intercept model (i.e. different intercepts for each subject) implementing an ANOVA with a random factor of subjects and a fixed factor of sleep stage at the two levels under comparison.
If the region was defined from a different mean signal, then a group-level linear mixed effects analysis over all four stages of non-REM sleep (71 subjects) was initially computed, and the three pairwise post hoc comparisons were performed only if the direct comparison of all four sleep stages was significant. For example, regions defined from the voxelwise, multiple comparisons corrected main effect of sleep stage of the mean global signal were applied to the mean minimally processed signal. Similarly, regions defined from the voxelwise, multiple comparisons corrected main effect of sleep stage of the mean GSR signal were applied to the mean global and minimally processed signals.
Results
Mean global signal and sleep depth
Our null hypothesis is that any changes in mean global signal with sleep depth are within the noise of the BOLD signal. This was tested with direct statistical comparison of mean global signal values across wakefulness, N1, N2, and N3 sleep via a group level linear mixed effects analysis.
57
Figure 2 shows the main effect of sleep stage highlighting regions with changes in mean global signal that differ significantly across the four stages. The group averaged mean signal levels for each stage are plotted. The mean global signal increases with sleep depth over most of gray matter. These increases are not absolute measures but relative to the four stages of non-REM sleep.
The mean global signal increases with sleep depth. Direct statistical comparison of the mean global signal over the four non-REM sleep stages. Shown is the main effect of sleep stage from a group level linear mixed effects analysis of 71 subjects. Displayed regions exhibit significant mean global signal changes across W, N1, N2, and N3 sleep. Color bar reflects the value of gaussianized F statistics corrected for multiple comparisons (P < 0.05). Lateral surfaces are displayed in the first row and medial surfaces in the second row. Highlighted regions include the middle frontal gyrus, insula, and precuneus in the left hemisphere, and postcentral sulcus, inferior frontal junction, and temporoparietal junction in the right hemisphere. Plotted are group averaged mean global signals for W (71 subjects), N1 sleep (58 subjects), N2 sleep (42 subjects), and N3 sleep (19 subjects). Percent BOLD signal was computed for each subject by normalizing to the value of the constant term, then multiplying by 100. Error bars reflect the 95% confidence interval of the means. Included in the plots are three regional post hoc, group-level linear mixed effects analyses: W vs. N1 (71 subjects), N1 vs. N2 (58 subjects), and N2 vs. N3 (42 subjects), with * indicating P < 0.05 for the two stages it is placed between.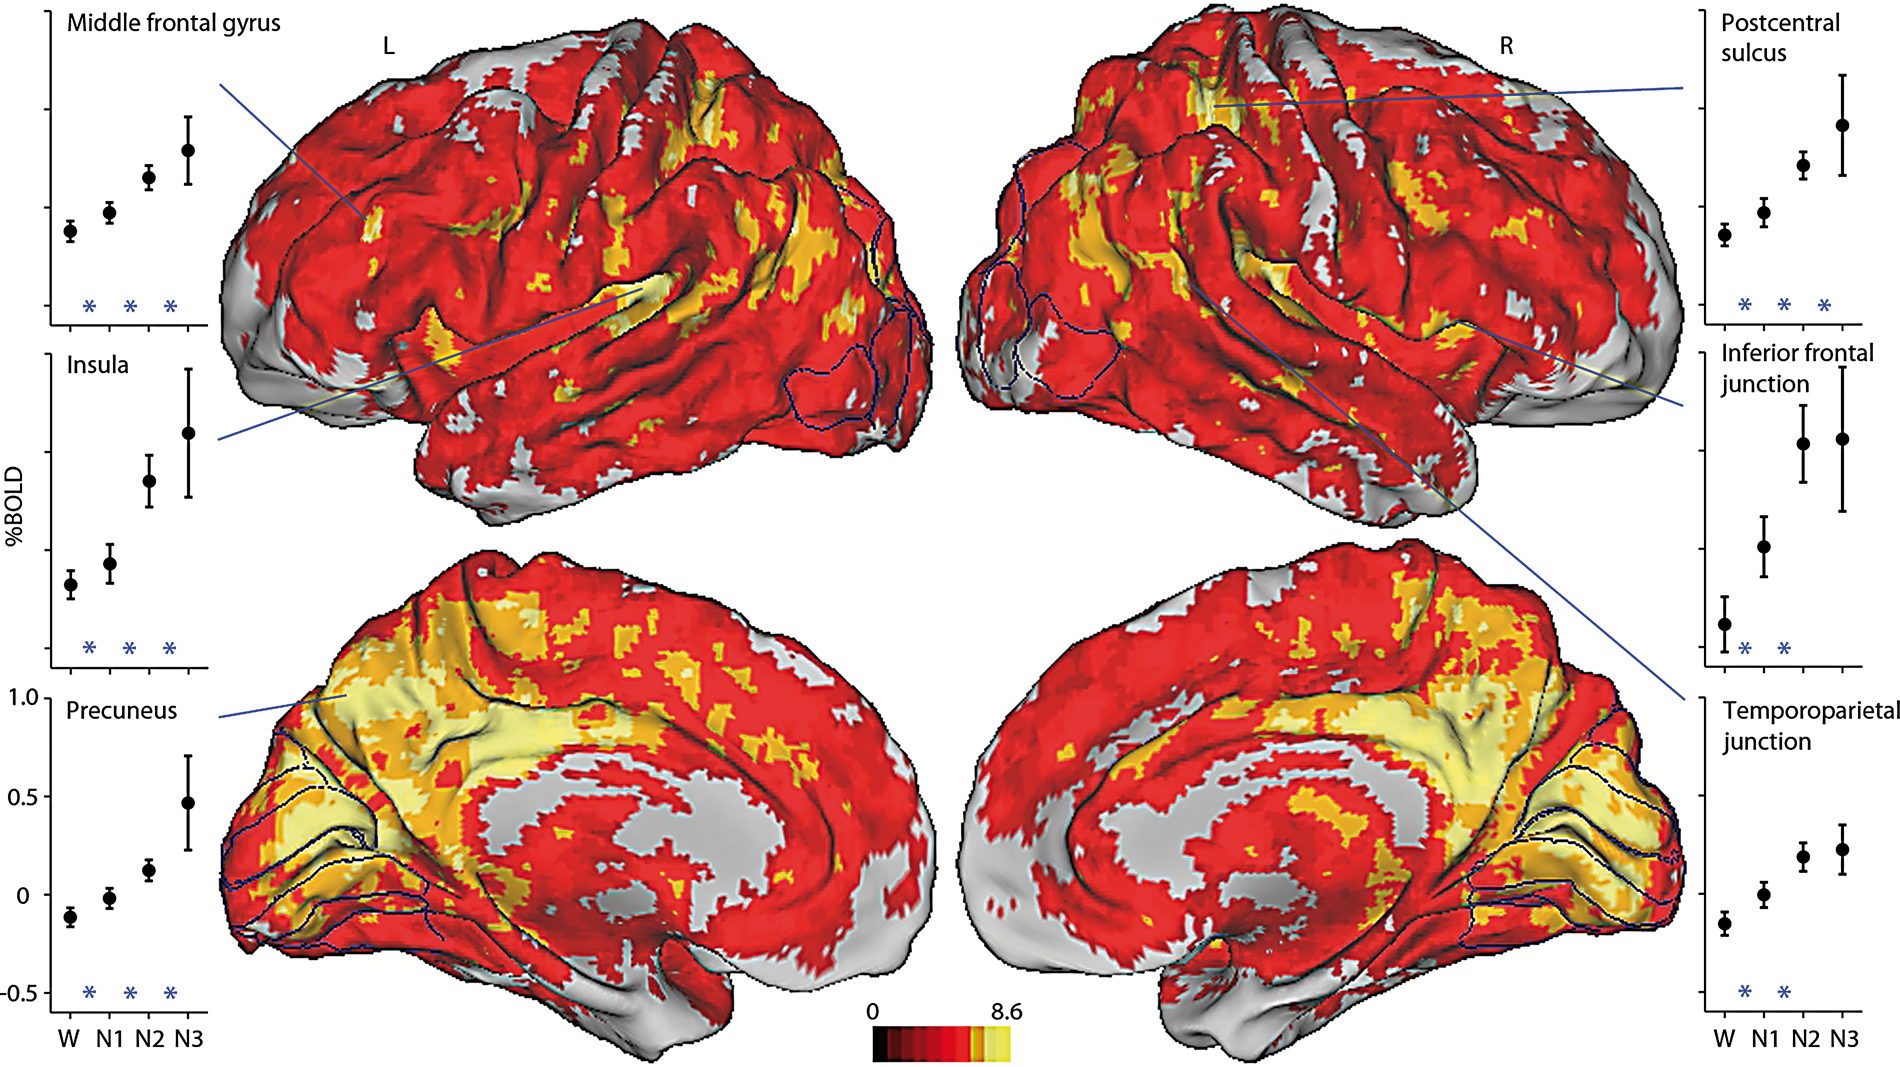
Principal component analysis of the mean global signal
We next sought to quantify these changes in mean signal by performing a principal component analysis across the four stages with each significant voxel from the main effect of sleep stage serving as an observation. The first principal component recapitulated the observed signal increases from wakefulness through N3 sleep, accounting for 83.9% of the variance. Figure 3 shows the projection of the first component. While medial and temporal cortical regions map positively onto the first component, ventricular regions map negatively. This mapping results from increasing mean global signals in cortical regions, consistent with those plotted in Figure 2 and decreases in ventricular regions.
61
In the last column, minimally processed mean signals are plotted. Reduced increases and decreases are observed for all four regions compared to the mean global signals.
Principal component analysis of the mean global signal. The first component accounts for 83.9% of the variance attributed to modulation of the mean global signal by sleep depth. Shown in the axial slices is the projection of the first principal component. Color bar reflects the inner product of the first principal component and the group averaged mean global signal of each sleep stage. Images have been thresholded to highlight regions most strongly correlated with the first principal component. Highlighted are two cortical and ventricular regions. Plotted are mean global and minimally processed (last column) signals reflecting group averages of 71 subjects (W), 58 subjects (N1), 42 subjects (N2), and 19 subjects (N3). In contrast to cortex, the mean global signal decreases with sleep depth in ventricular regions. Percent BOLD signal was computed for each subject by normalizing to the value of the constant term, then multiplying by 100. Error bars reflect the 95% confidence interval of the means. Included in the plots are three regional post hoc, group-level linear mixed effects analyses: W vs. N1 (71 subjects), N1 vs. N2 (58 subjects) and N2 vs. N3 (42 subjects), with * indicating P < 0.05 for the two stages it is placed between. ns, main effect of sleep stage not significant (P > 0.05).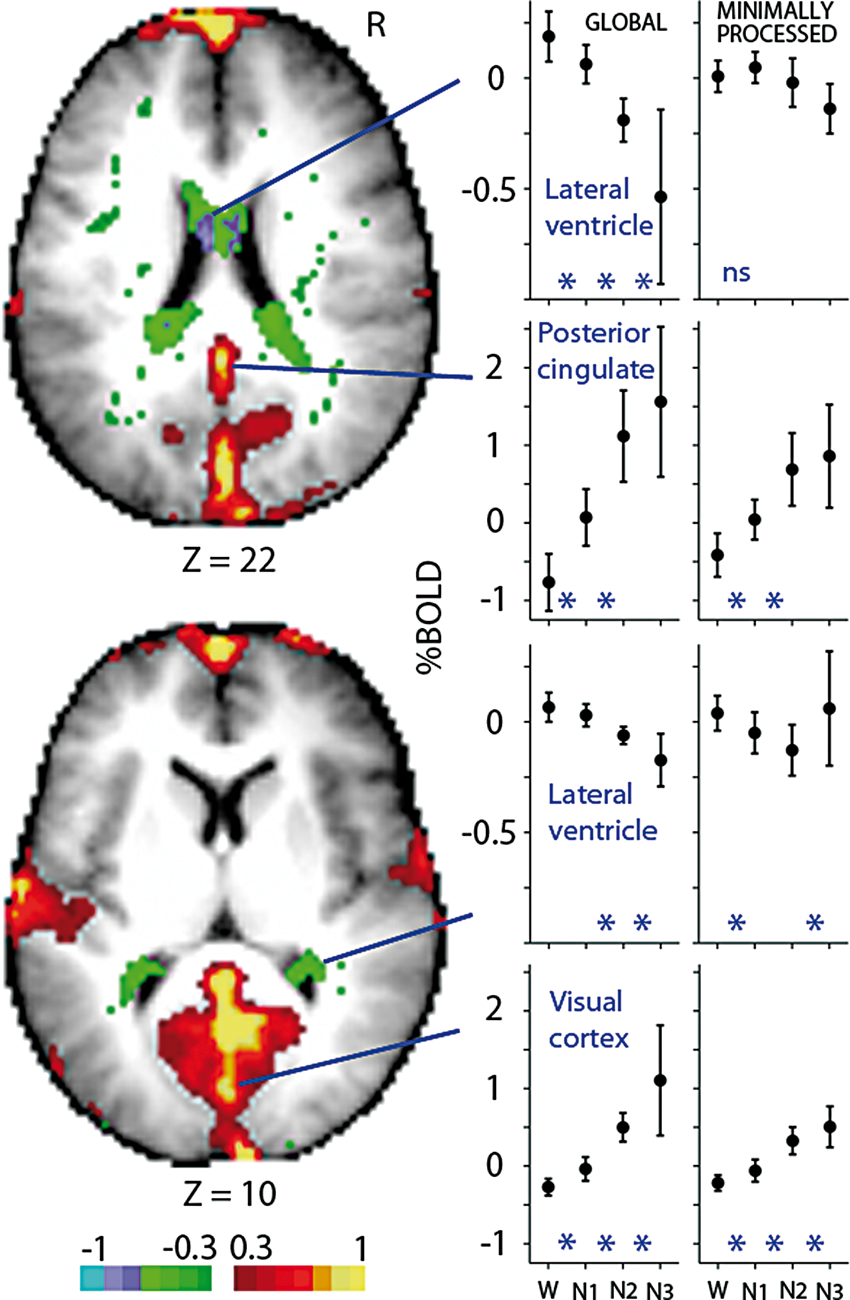
Mean GSR signal and sleep depth
It is possible that the observed global signal increases in gray matter are dominated by much larger local effects. All terms of equation (1) were regressed including those of the global signal. We tested the null hypothesis that changes in this mean GSR signal with sleep depth are within the noise of the BOLD signal with a group-level linear mixed effects analysis.
57
Figure 4 shows the main effect of sleep stage highlighting regions with significant mean GSR signal changes across the four stages. Group-averaged GSR, global and minimally processed signals are plotted. The mean GSR signal is somewhat variable from state to state decreasing from wakefulness in midline and subcortical regions and increasing in extrastriate regions. In contrast, the mean global signal is remarkably consistent across regions as evidenced by increases with sleep depth that are an order of magnitude larger than their GSR counterparts.
The mean global-signal-regressed (GSR) signal decreases with sleep depth in midline and subcortical regions and increases in extrastriate regions. Direct statistical comparison of the mean GSR signal over the four non-REM sleep stages. The main effect of sleep stage from a group-level linear mixed effects analysis of 71 subjects is shown. Displayed regions exhibit significant mean GSR signal changes across W, N1, N2, and N3 sleep. Color bar reflects the value of gaussianized F statistics corrected for multiple comparisons (P < 0.05). Highlighted regions include the anterior cingulate (first row), posterior cingulate, caudate, mediodorsal thalamus, MT and fusiform gyrus (last row). Plotted are mean GSR, global and minimally processed (last column) signals reflecting group averages of 71 subjects (W), 58 subjects (N1), 42 subjects (N2) and 19 subjects (N3). Note different ordinate scales between GSR and global/minimally processed signals. Percent BOLD signal was computed for each subject by normalizing to the value of the constant term, then multiplying by 100. Error bars reflect the 95% confidence interval of the means. Included in the plots are three regional post hoc, group-level linear mixed effects analyses: W vs. N1 (71 subjects), N1 vs. N2 (58 subjects) and N2 vs. N3 (42 subjects), with * indicating P < 0.05 for the two stages it is placed between. ns: main effect of sleep stage not significant (P > 0.05).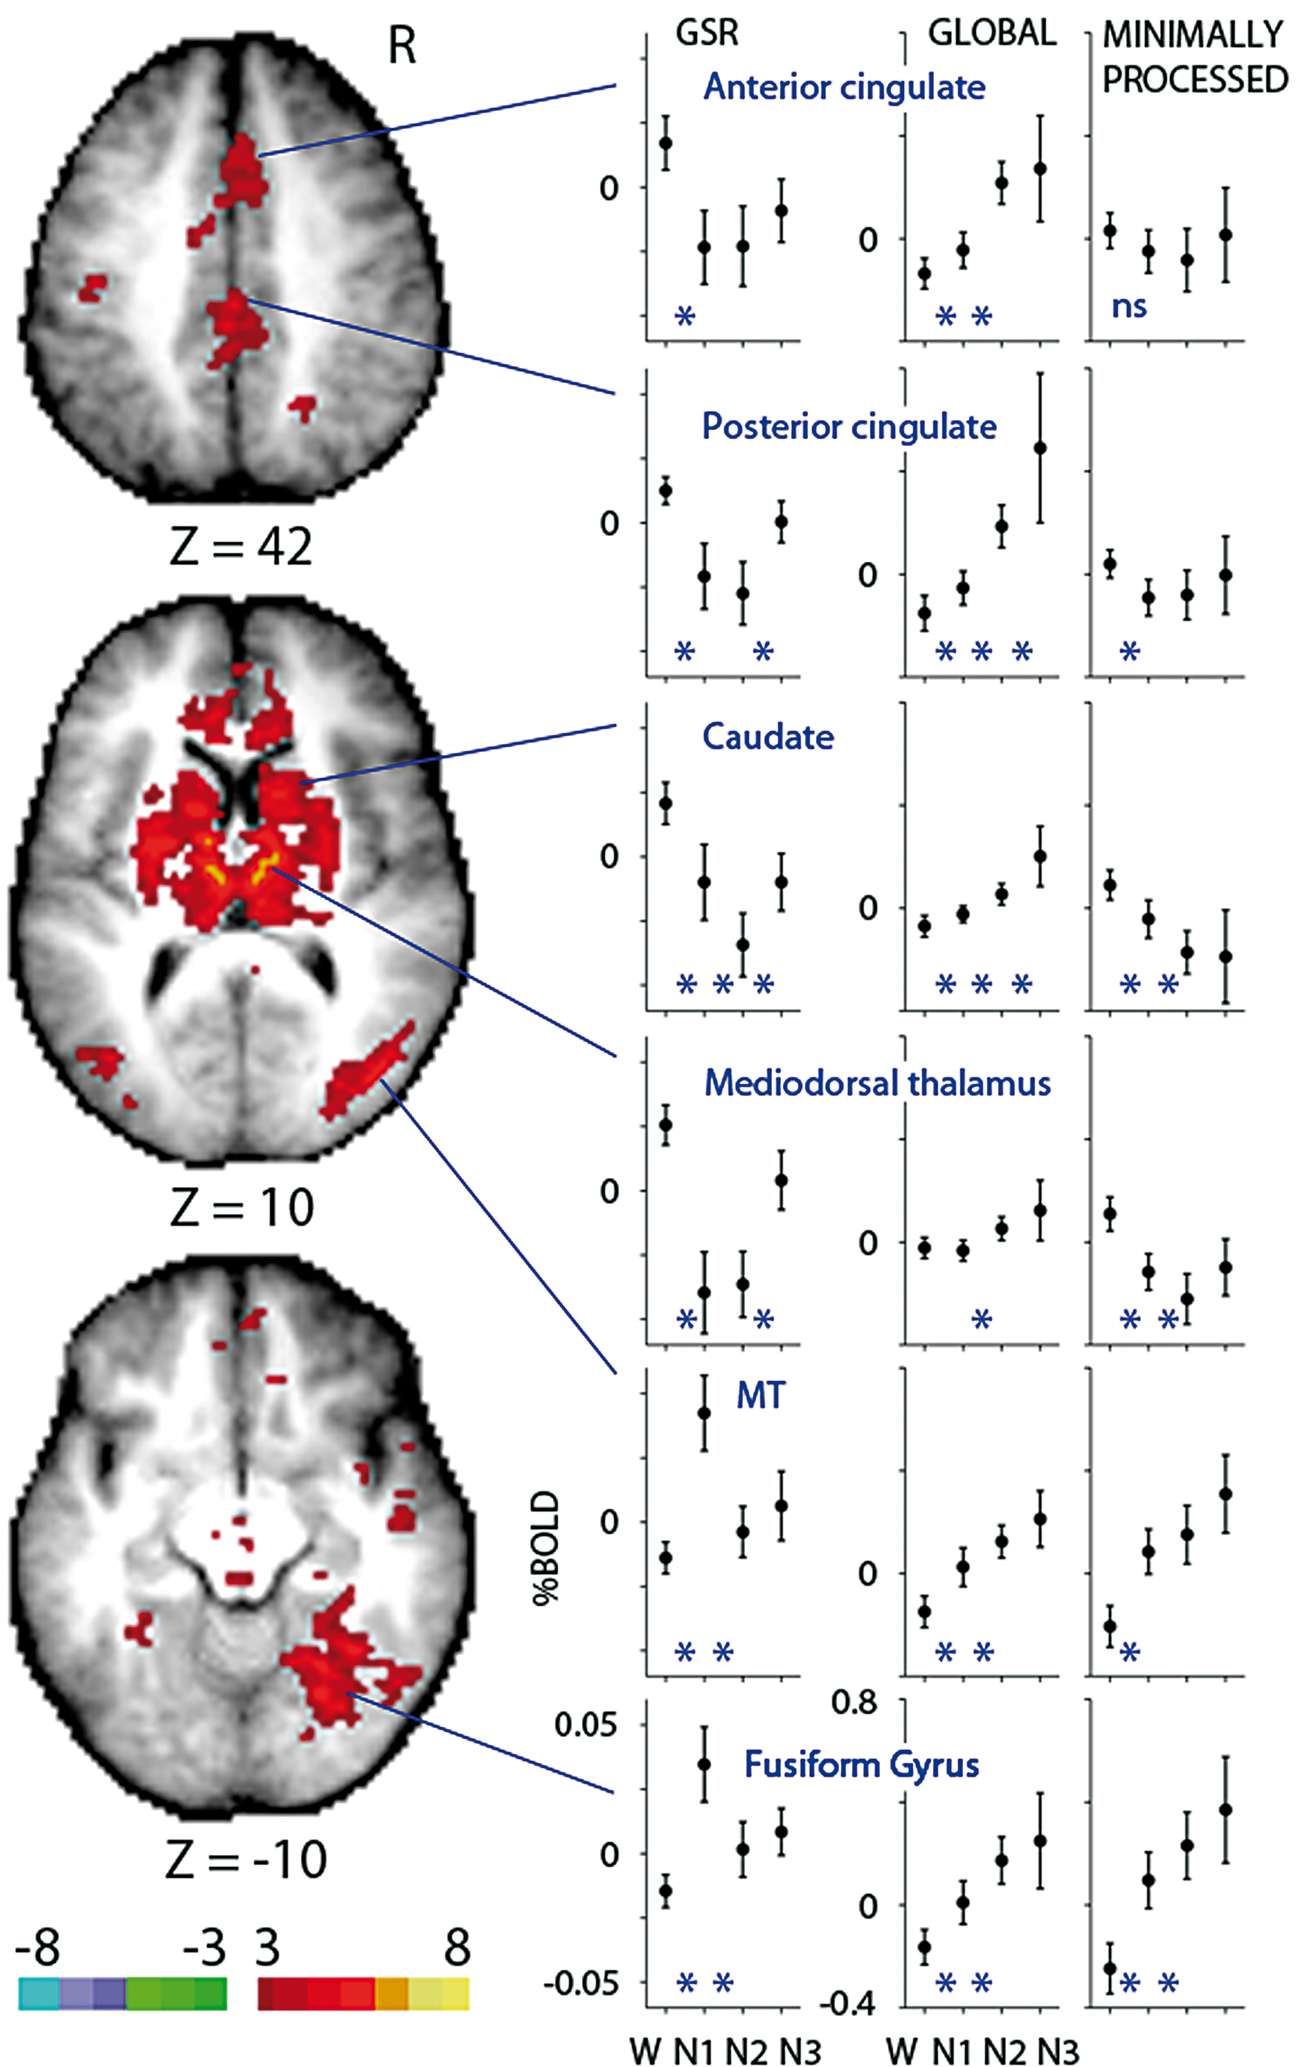
Although magnitudes are directly comparable between GSR and global signals, one must be cautious with comparison to the minimally processed signal (Figures 3 and 4). Unlike the GSR and global signals which are normalized to the same constant weight from equation (1), the constant weight used for normalization of the minimally processed signal is estimated by a reduced model that adds only a linear trend term.
Discussion
Global blood flow and oxygen metabolism in non-REM sleep
During non-REM sleep compared to wakefulness, measurements of global brain blood flow and oxygen consumption have consistently demonstrated that oxygen consumption, which always decreases, does so to a greater extent than blood flow (Table 1). The consequence of this is a decrease in the fraction of oxygen removed from flowing blood in the brain, the oxygen extraction fraction. As a result, the concentration of oxygen-depleted red blood cells in the brain vasculature decreases, thus the concentration of deoxyhemoglobin decreases. Since the BOLD signal is biophysically a measurement of local deoxyhemoglobin concentration, 21 a decrease in deoxyhemoglobin compared to oxyhemoglobin results in an increase in BOLD signal, while an increase in deoxyhemoglobin compared to oxyhemoglobin results in a decrease in BOLD signal. Another way to think of this is that a decrease in BOLD signal reflects a greater proportion of oxygen-depleted red blood cells, while an increase in BOLD signal reflects a lesser proportion of oxygen-depleted red blood cells.
While regional brain blood flow and oxygen consumption are highly correlated in awake, resting, adult human subjects62,63 that relationship can vary depending upon the circumstances under which it is measured. For example, task-induced regional activity in the human brain is accompanied by an increase in blood flow without an increase in oxygen consumption,64,65 an observation that provided the basis for fMRI.15–18 Furthermore, while anoxia can render a person unconscious within seconds, 66 the blood flow response of the human brain to graded hypoxia is a threshold phenomenon which is not initiated until the arterial oxygen tension has reached approximately 50% of its normal level. 67 Under such circumstances, the brain relies first on its ability to increase its oxygen extraction from circulating hemoglobin (i.e. oxygen rich red blood cells). During non-REM sleep alveolar ventilation decreases,68–71 however, the resulting hypoxia, 69 if any,68,72 is likely insufficient to initiate a blood flow response in normal, healthy individuals. 73 Moreover, decreased alveolar ventilation predicts a decrease in the evoked respiratory signal74,75 as breathing becomes shallower and a corresponding decrease in mean global BOLD signal.
Another feature of sleep-induced alveolar under-ventilation68–71 is an increase in alveolar carbon dioxide tension.68,70,76 Abundant evidence accumulated over many years has established the exquisite sensitivity of the brain vasculature to changes in arterial carbon dioxide tension,77,78 which predictably affects the BOLD signal,
21
but the only measurements we have of arterial carbon dioxide tension during sleep indicate that there is no change.
72
The acidosis,
68
if any,
72
from increased alveolar carbon dioxide tension predict a decrease in mean global BOLD signal (Figure 5).
Oxyhemoglobin dissociation curve. As the brain moves from wakefulness to N3 sleep, carbon dioxide production drops, increasing the pH of capillary blood, a leftward shift of the oxyhemoglobin dissociation curve by the Bohr effect and an increase in the ratio of oxyhemogloblin to deoxyhemoglobin as less oxygen is extracted from the alkaline erythrocyte resulting in an increase in mean global BOLD signal.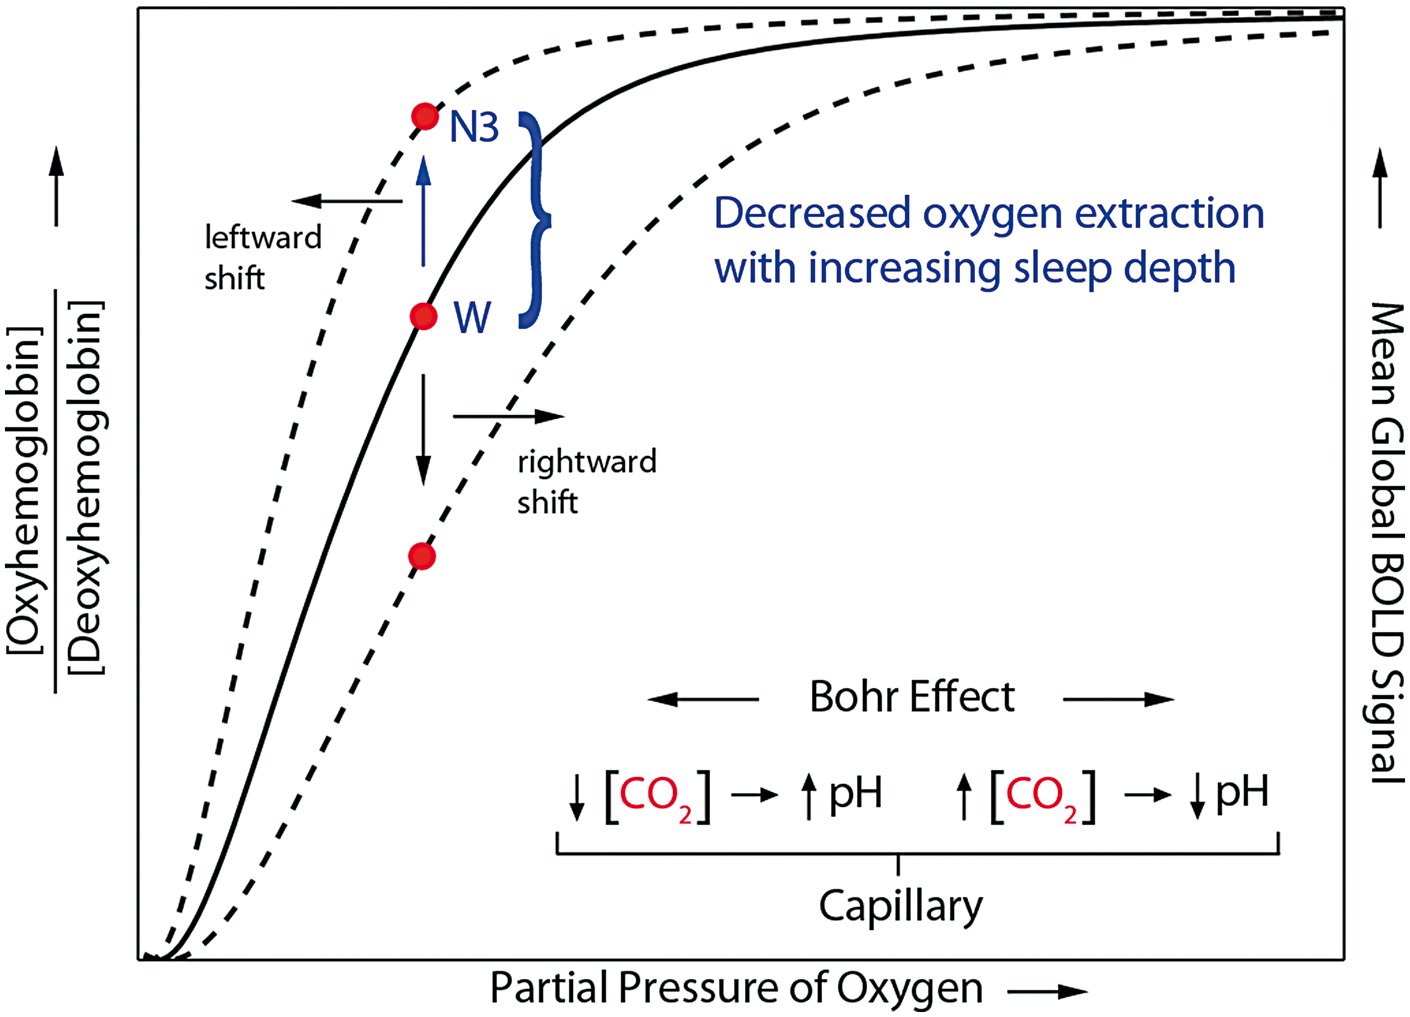
A more complete way to understand the increase in the mean global BOLD signal is to examine events likely occurring in the capillary. Carbon dioxide entering the capillary from brain oxidative metabolism is hydrated in erythrocytes (i.e. red blood cells). In the process, hydrogen ions are produced reducing the pH of the erythrocytes, which in turn decreases the oxygen affinity of hemoglobin facilitating the release of oxygen to the tissue. 79 When brain oxidative metabolism decreases, as it does in non-REM sleep, this process is reversed: the amount of carbon dioxide produced by the brain decreases leading to an increase in erythrocyte pH as governed by the Henderson-Hasselbalch equation 80 and increased oxygen affinity of hemoglobin resulting in a leftward shift in the oxyhemoglobin dissociation curve (Figure 5). As a result, deoxyhemoglobin decreases and the BOLD signal increases. The importance of this process is dramatically demonstrated when the critical enzyme responsible for carbon dioxide hydration, carbonic anhydrase, is inhibited. This causes an immediate increase in brain blood flow and a decrease in oxygen consumption. 81 Accompanying the sleep-induced changes attenuating oxygen release from hemoglobin is an accompanying increase in brain pH due to a reduction in metabolically produced carbon dioxide. The brain compensates for this by reducing its blood flow in order to maintain pH homeostasis. 82
It is important to remember that while the body rests on the flat part of the oxyhemoglobin dissociation curve 68 where it suffers little affect from small changes in blood pH, as it should to robustly maintain a high level of oxygen saturation, the brain resides on the steep portion 83 where brain oxygenation is precisely regulated. 84 The brain fine tunes oxygen delivery at the capillary level by simply adjusting the extraction of oxygen from the circulating blood taking advantage of the oxyhemoglobin dissociation curve’s steepness and the Bohr effect. 79 This keeps tissue levels of oxygen at an optimum regardless of whether it is oversupplied, as is the case of non-REM sleep, or undersupplied when the blood supply is compromised or the environmental oxygen falls (e.g. during a sojourn at altitude). With increasing depth of non-REM sleep, the brain’s demand for oxygen drops resulting in decreased oxygen extraction (Table 1),1–3,72 decreased capillary deoxyhemoglobin, and an increase in the global BOLD signal.
Dissociated gray matter and ventricular signals
In contrast to the mean global BOLD signal increases in gray matter, decreases with sleep depth were observed in large vessels (Figure 3). This dissociation between gray matter and ventricular regions is apparent even with the minimally processed signal (Figure 3) suggesting it is not a result of modelling (equation (1)). As noted above, carbon dioxide is a potent cerebral vasodilator.77,78 Although measurements of arterial carbon dioxide tension found only a trend toward an increase in non-REM sleep, 72 alveolar measurements have consistently reported significant increases.68,70,76 One may speculate that the increase in carbon dioxide tension leads to an increase in cerebral blood volume as a result of vasodilation. 77 In gray matter (and throughout parenchyma), this cerebral blood volume increase is balanced by a decrease in the volume of brain tissue. 61 The ventricles, however, lack brain tissue so the increase in cerebral blood volume is accommodated by a volume decrease in cerebrospinal fluid, 61 which may, in part, shift to spinal regions. 85 In summary, while we attribute mean global signal increases in gray matter to decreases in oxygen extraction, the decreases in ventricular regions we speculate reflect an increase in cerebral blood volume. 86 Furthermore, if changes in gray matter were cogent with those in ventricular regions, this would suggest at least the partial influence of pulsatile effects from cardiac cycles. 25
Mean GSR signal and non-REM sleep
Although an order of magnitude smaller than the mean global signal, the GSR signal separates into a midline/subcortical and an extrastriate pattern (Figure 4). Many of the thalamic and extrastriate regions have been previously identified from mean signal changes of simply opening and closing the eyes. 87 While the mean BOLD signal decreases in thalamic regions upon eye closure, increases are seen in extrastriate cortex. 87 Consistent with this dissociation are the GSR signal increases in extrastriate cortex and decreases in thalamic regions in non-REM sleep. Considering the midline subcortical regions, the thalamus has an important role in the electrophysiological signals that define the different stages of non-REM sleep, 88 and the neighboring basal ganglia (e.g. caudate) are believed to play a significant role in regulating the sleep-wake cycle as damage is associated with disturbed sleep. 89 Midline cortical regions may also have an important role in non-REM sleep as task state fMRI with simultaneous electrocardiography has implicated the anterior cingulate with state changes of the cardiovascular system during task performance compared to rest. 90 Recent speculation concerning the dorsal posterior cingulate has suggested it has a prominent role in adjusting the global focus of the brain as modulated by arousal, attention, and environmental changes. 91 In addition, decreased gray matter volume 92 and increased regional cerebral blood flow during N3 sleep93 in posterior cingulate have been associated with sleep walking. Taken together, regions that show changes in mean GSR signal with sleep depth may interact with the whole brain (and body) in a way that promotes non-REM sleep. Future work should seek to establish the relationship between the global and GSR signal as this has the potential to illuminate the influence of individual areas on global brain function.
Conclusion
Our data suggest that mean changes in the global BOLD signal shed light on important brain physiology as represented by the relationship between cerebral blood flow and oxygen metabolism. Although these changes are not easily explained by head motion or respiratory effects, there is good evidence that the global signal includes contributions from these sources. 52 Our method of modeling the global signal (Eq. 1) is unique in that the full complement of resting-state processing is implemented in a single regression rather than in a series of regressions and filtering steps,23,24,52 as a single regression will account for the greatest amount of variance. 94 The focus of resting-state fMRI methodology has been how to process the data so that the so-called resting-state networks can be identified most effectively.23,24,52 In this context, the global signal has been eschewed as dominated by nonneuronal effects.24,52 Little effort has been devoted to process the global BOLD signal with the goal of uncovering meaningful physiology despite increasing evidence of important signals of neural origin.28,29
It is possible that the increases in mean global BOLD signal are just a curious observation limited to non-REM sleep, but the possibility also exists for a signal of great biological interest. Our global signal measure, although a relative one, can be used comparatively in a pseudo-quantitative manner given that the data were collected in a single scan. The most outstanding feature of Figure 2 is the broad swath bilaterally on the medial surfaces extending from posterior cingulate caudally into precuneus and ventrally into visual cortex. Posterior cingulate and precuneus are among the most metabolically active regions with blood flow and oxygen metabolism significantly greater than the brain’s global mean in wakeful rest. 95 They are key regions in the so-called Default Mode Network, 95 play an important role in memory96–99 and attentional91,100 processing and are currently of great interest in the study of neurodegenerative diseases, as atrophy96,101 hypometabolism,96,101–103 tau pathology,104,105 and amyloid deposition96,99,101,106,107 precede the rest of the brain. Curiously, dementia patients occasionally show greater pathology in visual cortex. 105 Investigating whether the mean global BOLD signal changes with aging and disease progression, and its possible association with other measures would increase our knowledge of the underlying biology of both healthy aging and impaired cognition.
Footnotes
Funding
The author(s) disclosed receipt of the following financial support for the research, authorship, and/or publication of this article: This work was supported by the National Institutes of Health (NINDS NS080675 to M.E.R.), Bundesministerium für Bildung und Forschung (01EV0703 to H.L. and E.T.), LOEWE Neuronale Koordination Forschungsschwerpunkt Frankfurt (H.L. and E.T.) and in part by the Neuroimaging Informatics and Analysis Center at Washington University led by Dan Marcus (1P30NS09857701).
Acknowledgments
The authors thank Dmitriy A Yablonskiy and Anish Mitra for helpful discussions.
Declaration of conflicting interests
The author(s) declared no potential conflicts of interest with respect to the research, authorship and publication of this article.
Authors’ contributions
MPM analyzed the BOLD data. HL and ET designed and conducted the research and analyzed the EEG data. MPM, HL, and MER wrote the manuscript. All reviewed the manuscript.