
Abstract
The purposes of this study are to assess the oxygen extraction fraction (OEF) changes on MRI-based quantitative susceptibility mapping (QSM) in systemic lupus erythematosus (SLE) patients and to determine whether QSM-OEF is associated with disease activity in SLE. We enrolled 42 SLE patients and 20 healthy subjects (HS) who had no pathologies on conventional brain MRI. Disease activity was assessed using SLE Disease Activity Index (SLEDAI). For the measurement of QSM-OEF, QSM data were analysed using the Perfusion Mismatch Analyzer software program. Spearman's or Pearson's correlation coefficients were calculated, and independent predictors were identified through a multiple linear regression analysis. QSM-OEF was significantly higher in SLE than that in HS (51.3 ± 10.1 vs. 40.5 ± 3.7, p < 0.001). QSM-OEF was positively correlated with SLEDAI and the presence of neuropsychiatric symptom (NPS) scores (ρ = 0.663, p < 0.001 and ρ = 0.340, p = 0.028). At multiple linear regression analysis, SLEDAI and NPS were independently associated with QSM-OEF (standardized β = 0.426, p = 0.016 and standardized β = 6.148, p = 0.029). In the SLE patients, QSM-OEF is associated with disease activity, which might predict an increased risk of stroke in SLE.
Keywords
Introduction
Systemic lupus erythematosus (SLE) is an autoimmune disease that predominantly affects the central nervous system (CNS) in women of child-bearing age. 1 The most prevalent manifestation of lupus is neuropsychiatric systemic lupus erythematosus (NPSLE), occurring in as many as 30%–56% of all SLE patients.2,3 NPSLE patients have higher morbidity and mortality rates than SLE patients with non-neuropsychiatric syndrome (non-NPSLE). 4 Large infarcts, cortical atrophy and multifocal gray matter (GM) and/or white matter (WM) lesions are frequently observed on magnetic resonance imaging (MRI) in NPSLE patients. 5 However, a substantial population of patients with NPSLE exhibit normal MRI findings and present with only neuropsychiatric symptoms (NPS), 6 as the metabolic and/or functional alterations of the disease usually may not have anatomic disturbances detectable on conventional MRI. Therefore, methods other than conventional MRI are needed to evaluate brain changes in NPSLE.
Oxygen extraction fraction (OEF) represents an important measurable parameter of brain metabolism, 7 which provides information about the relative deficiencies in cerebral blood supply with the tissue's oxygen demand, so-called ‘misery perfusion’. 8 The risk of stroke recurrence increases with misery perfusion in patients with symptomatic major cerebral arterial occlusive disease.9,10 Brain pathophysiology studies in NPSLE patients have shown that vasculitis in the intramural blood vessels of arterioles, capillaries and venules 11 causes brain parenchymal lesions secondarily. 12 Thus, we hypothesised that the disease activity related to vasculitis and hypoxia may increase the OEF in NPSLE patients. OEF, therefore, would seemingly provide additional information, especially in the monitoring phase of the disease severity.
Traditional approaches with 15O positron emission tomography (PET) are generally considered to be the gold standard approach for OEF measurements; however, there are some notable drawbacks with the technique, such as the limited availability of single-photon emission computed tomography (SPECT) scanners and considerable radiation exposure, which may prevent the potential for repeat scans, especially for young patients including SLE, and the extended scan time that is required. Furthermore, 15O PET cannot be readily applied in the clinics because of the complex setup necessary to administer short half-life radiotracers. Recent advancements in the field of MRI have ushered several new approaches to OEF measurement using quantitative susceptibility mapping (QSM) of MRI. The QSM technique is insensitive to the geometry of veins and dipolar artefacts; both of which affect the measured distribution of measured phase values. Kudo et al. 13 reported that a good correlation was obtained between OEF measurements using QSM of MRI and the gold standard 15O PET in the identification of elevated OEF in affected hemispheres of patients with unilateral chronic steno-occlusive disease. The purpose of this study was to assess the QSM-OEF changes in SLE patients and to determine whether QSM-OEF is associated with disease activity in SLE.
Material and methods
Approval
Our study was approved by the Institutional Review Board of the University of Occupational and Environmental Health School of Medicine (Kitakyushu, Fukuoka, Japan), which waived informed consent because it was retrospective.
Subjects
One radiologist with seven years of neuroradiology experience (M.M.) reviewed the MRI database of patients who were examined between May 2004 and December 2016 who had been diagnosed with SLE according to the American Rheumatism Association criteria for the classification of SLE 14 and selected 60 patients. The disease activity of SLE patients was quantified using a Safety of Estrogens in Lupus Erythematosus National Assessment-SLE Disease Activity Index (SELENA-SLEDAI) score 15 and the British Isles Lupus Assessment Group 2004 (BILAG) index score. 16 We further selected 48 of the 60 patients in whom disease activity was assessed within 15 days of their MRI examinations using the SLEDAI and BILAG index scores. The exclusion criteria included patients with a history of other neurological diseases, unsatisfactory images due to artifacts, and/or MRI abnormalities. With regard to abnormal MR findings, patients with mild or moderate brain atrophy (see ‘Statistical analysis’) and mild WM lesion (WML) (Fazekas grade 1) on T2-weighted imaging (T2WI)/fluid-attenuated inversion recovery (FLAIR) imaging were not excluded. 17 Of the six excluded patients, five had a history of major infarction and one had a motion artifact.
Thus, we enrolled 42 SLE patients (38 women, 4 men; mean age 38.7 ± 15.8 years, range 19–66 years) and 20 healthy subjects (HS) (19 women, 1 man; mean age 40.7 ± 13.0 years, range 22–62 years) to QSM and conventional T2WI/FLAIR imaging. HS were age- and sex-matched with the SLE group, had no history of neurological or psychiatric diseases and underwent MRI including QSM between January 2008 and December 2016. The indications for their examination included screening, headaches or benign positional vertigo.
We reviewed the duration of SLE (i.e. the interval between the initial onset of SLE and the brain MRI study) and demographic data for vascular risk factors (diabetes mellitus defined as a random glucose level of > 11.1 mmol/l, fasting blood glucose > 7.0 mmol/l, hemoglobin (Hb) A1c > 6.5% or the current use of antidiabetic drugs); hypertension (blood pressure > 140/90 mm Hg or current treatment with anti-hypertensive drugs); past or current smoking; dyslipidemia (low-density lipoprotein cholesterol > 3.64 mmol/l, high-density lipoprotein cholesterol < 0.91 mmol/l, triglyceride > 1.7 mmol/l or treatment for dyslipidemia); obesity (body mass index > 26 kg/m2); and treatments (a history of pulse steroid therapy).
MRI
All subjects underwent brain MRI with QSM. All studies were performed on a 3T MR imaging system (Signa Excite 3T; GE Health Care, Milwaukee, Wisconsin, US) using a dedicated 8-channel phased array coil (Invivo, Gainesville, Florida, US). QSM was obtained with a 3D flow-compensated multi-echo spoiled gradient echosequence. 18 The imaging parameters included the following: coronal planes covering the brain; number of TEs: 11; first TE: 4.5 ms; TE spacing: 5 ms; TR: 58.4 ms; flip angle: 15 °; bandwidth per pixel: ± 62.5Hz; FOV: 22 × 16.5 cm; acquisition matrices: 320 × 416; section thickness: 2 mm; imaging time: 7 min, 1 s. A parallel imaging method (the array spatial sensitivity encoding technique) was used with a reduction factor of 2. In this study, 56 axial sections were used to capture the centre of the brain that contains the deep grey nuclei structures. QSM was reconstructed from the complex data obtained during the gradient-echo sequence by using the morphology-enabled dipole inversion technique. 19 After the complex multi-echo MR images were saved, a nonlinear fitting was performed to estimate the magnetic field inhomogeneity, followed by a magnitude-guided phase unwrapping. 20 The background field was further removed by applying the projection to the dipole fields method. 21 Finally, the remaining tissue field was inverted to generate a susceptibility map by using the morphology-enabled dipole inversion method. 20 An empirically determined regularisation parameter of 1000 was consistently applied to all cases. All 11 echoes were used with weightings proportional to their signal-to-noise ratios for reconstructing QSM.22,23
Data processing of OEF
Co-registration of QSM-OEF images was performed using MRI magnitude images and SPM8 software (http://www.fil.ion.ucl.ac.uk/spm/). The registered QSM-OEF images were then imported into a Perfusion Mismatch Analyzer software (version 4.0.4),
24
where automated measurement of regions-of-interests (ROIs) was performed using a previously described method (Figure 1).24,25
Creation of OEF map. QSM in 31-year-old female with severe SLE disease activity (SLEDAI score = 17, BILAG index score = 22) is shown (a). Bright veins indicate amount of deoxygenated hemoglobin. Venous mask image (b) is obtained by using local threshold method. OEF map (c) is created from susceptibility value of these veins. (d) ROI measurements of QSM-OEF. Example of automated measurement of ROIs is shown. Eighteen spherical ROIs are automatically placed along the entire parenchymal surface of the brain. Blue line indicates midline of the brain.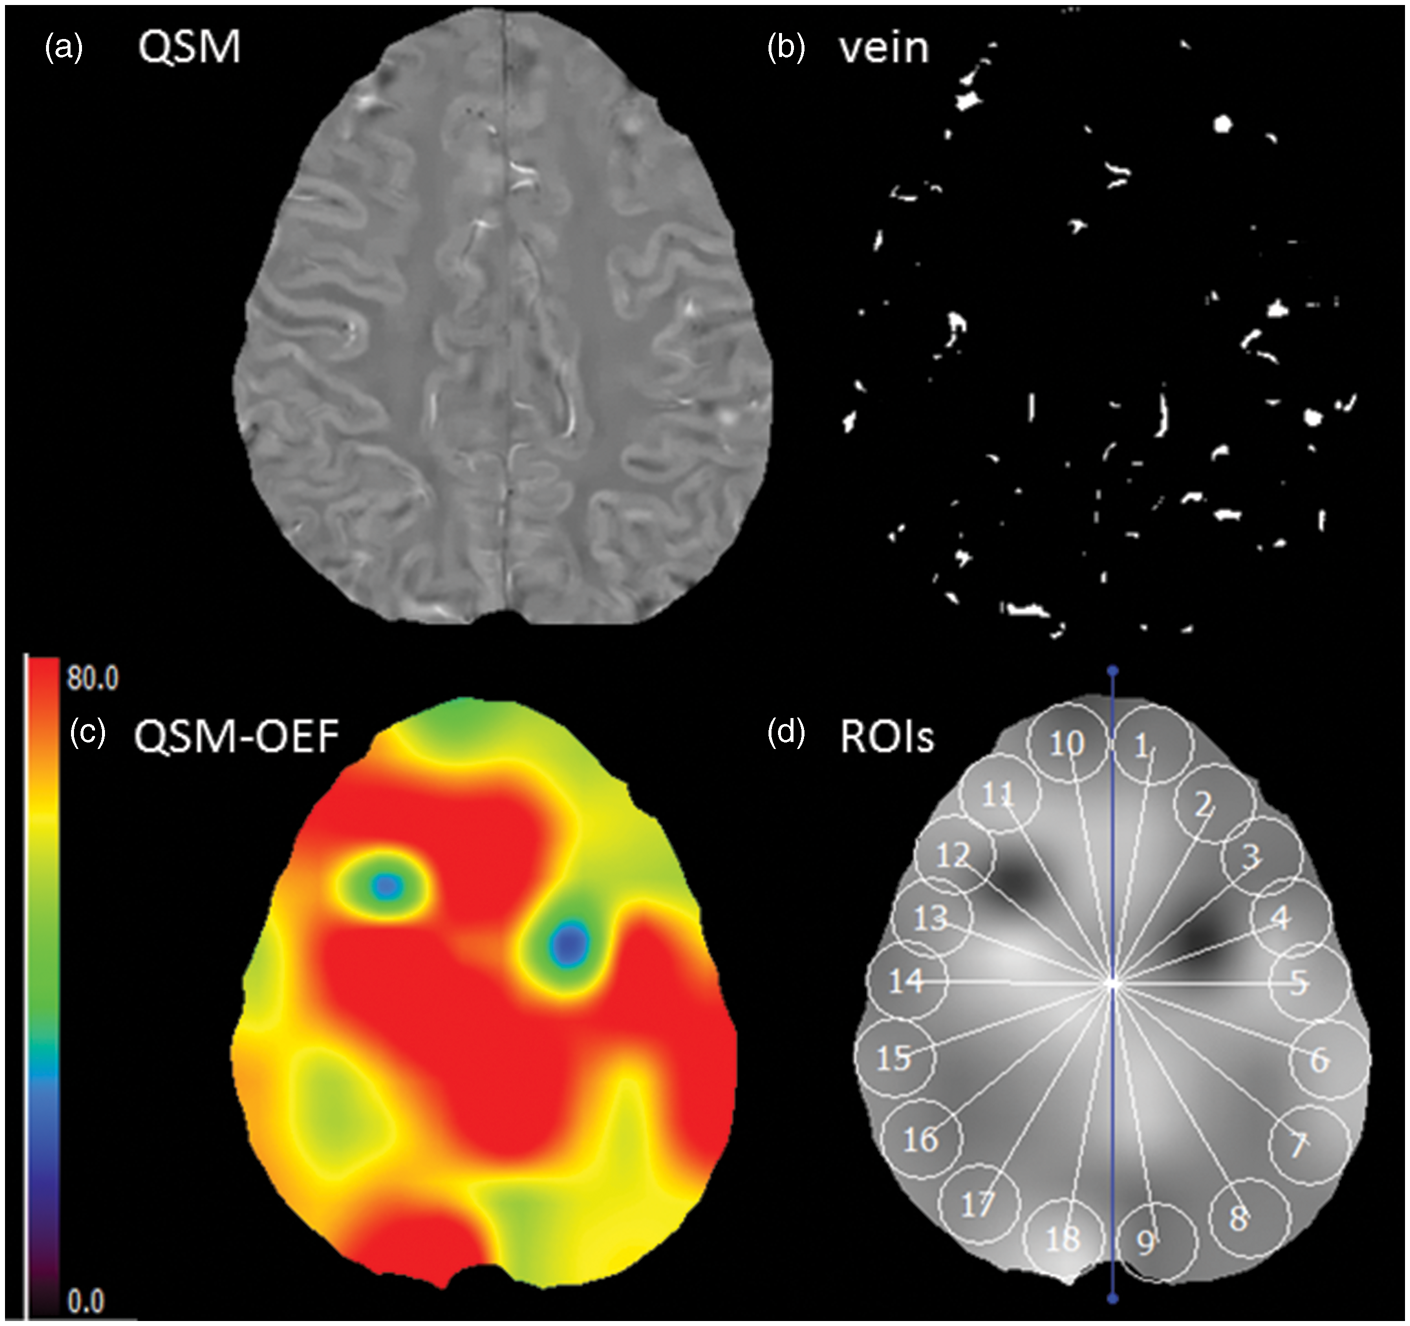
An estimate of QSM-OEF (1-oxygen saturation) can be obtained using following equation OEF =A × hematocrit (Hct) × 1/B.
A is susceptibility difference between the average susceptibility of veins and surrounding tissue was calculated in each ROI. B (1.8 × 10⁻⁷ in CGS units) is the susceptibility difference between fully deoxygenated blood and fully oxygenated blood. For SLE patients, we used actual measurement data of Hct because of high frequency of SLE patients with anaemia. For healthy subjects, we assumed Hct value of 0.40 for female and 0.45 for male.
On a slice at the level of centrum semiovale, 18 spherical ROIs with a diameter of 10 mm (20 pixels) were automatically placed along the entire parenchymal surface of the brain without overlapping each other (Figure 2). For all HS and SLE patients, the mean OEF value of both hemispheres (nine ROIs for each hemisphere) was calculated.
QSM (a) and OEF map (b) in Case A (a 31-year-old woman) with mild SLE activity (SLEDAI score = 0, BILAG index score = 4). QSM (c) and OEF map (d) in Case B (a 36-year-old woman) with severe SLE activity (SLEDAI score = 25, BILAG index score = 22). QSM-OEF is higher in Case B (59.3 %) than in Case A (38.3%).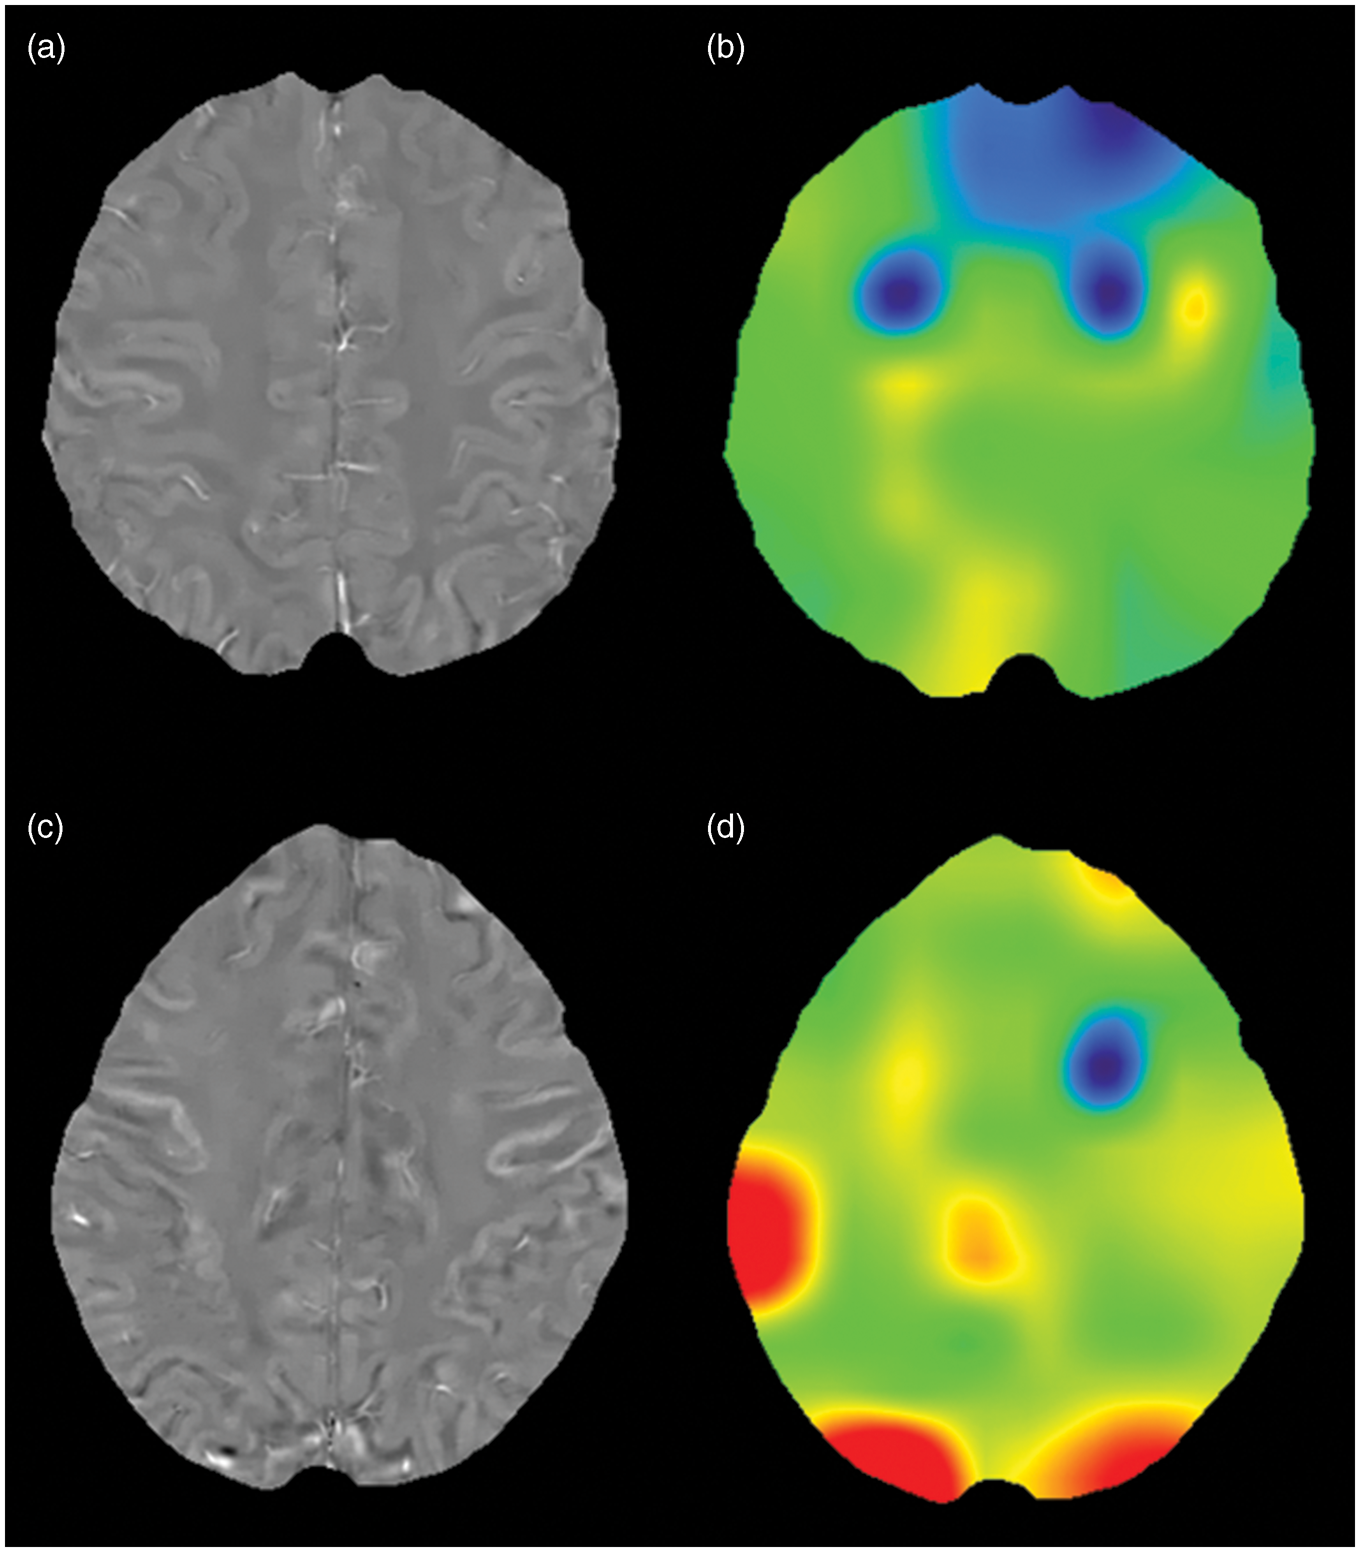
Statistical analysis
All statistical analyses were performed using the R software program. 26 Continuous variables are expressed as mean ± SD; categorical variables are expressed as n (%). A value of p < 0.05 was considered as statistically significant.
For imaging characteristics, brain atrophy was defined as deep (enlargement of the ventricles) or peripheral (enlargement of the gyri) and rated on a subjective scale of 0 to 3 (0 = absent, 1 = mild, 2 = moderate, 3 = severe). 27 We divided the patients into two groups based on presence or absence of the WMH (Fazekas grade 0 vs. grade 1) and the pathologic brain atrophy (grade 0 vs. grade 1 and 2).
On the basis of the SLEDAI and BILAG index scores, we categorised the SLE patients into a severe group (SLEDAI score ≥ 11 or BILAG index score ≥ 6) and a non-severe group (SLEDAI score < 11 or BILAG index score < 6) according to the previous reports.28,29 We also divided the patients with NPS and without NPS into two groups according to their neuro BILAG (nBILAG) index scores (A, B and C vs. D and E). 16 For treatment, patients were divided into two groups based on whether they had a history of pulse steroid therapy. For the analyses, age, duration of SLE, WBC, PLT, Hb, Hct, ESR, CH50, IgG and anti-dsDNA antibody were treated as continuous variables.
We compared the clinical and imaging characteristics, including the QSM-OEF between SLE patients and HS, and between the severe and non-severe groups (as assessed by the SLEDAI and BILAG index scores) using the χ2 test and Fisher's exact test for categorical variables and the two-sample t-test or Mann–Whitney U test for continuous variables, as appropriate.
For the QSM-OEF, we calculated the sensitivity, specificity, and area under the curve (AUC) for the prediction of the SLE disease activity (severe group vs. non-severe group). For this analysis, we used cutoff values in a receiver operating characteristic (ROC) curve analysis, which were determined by using the Youden index.
Pearson's or Spearman's correlation coefficients were calculated to examine bivariate correlations. Independent predictors were identified through a multiple linear regression analysis to identify the factors (patient's characteristics, imaging characteristics, SLE-related factors and vascular risk factors) related to QSM-OEF in SLE patients.
Results
Imaging and clinical characteristics of SLE and healthy subjects.
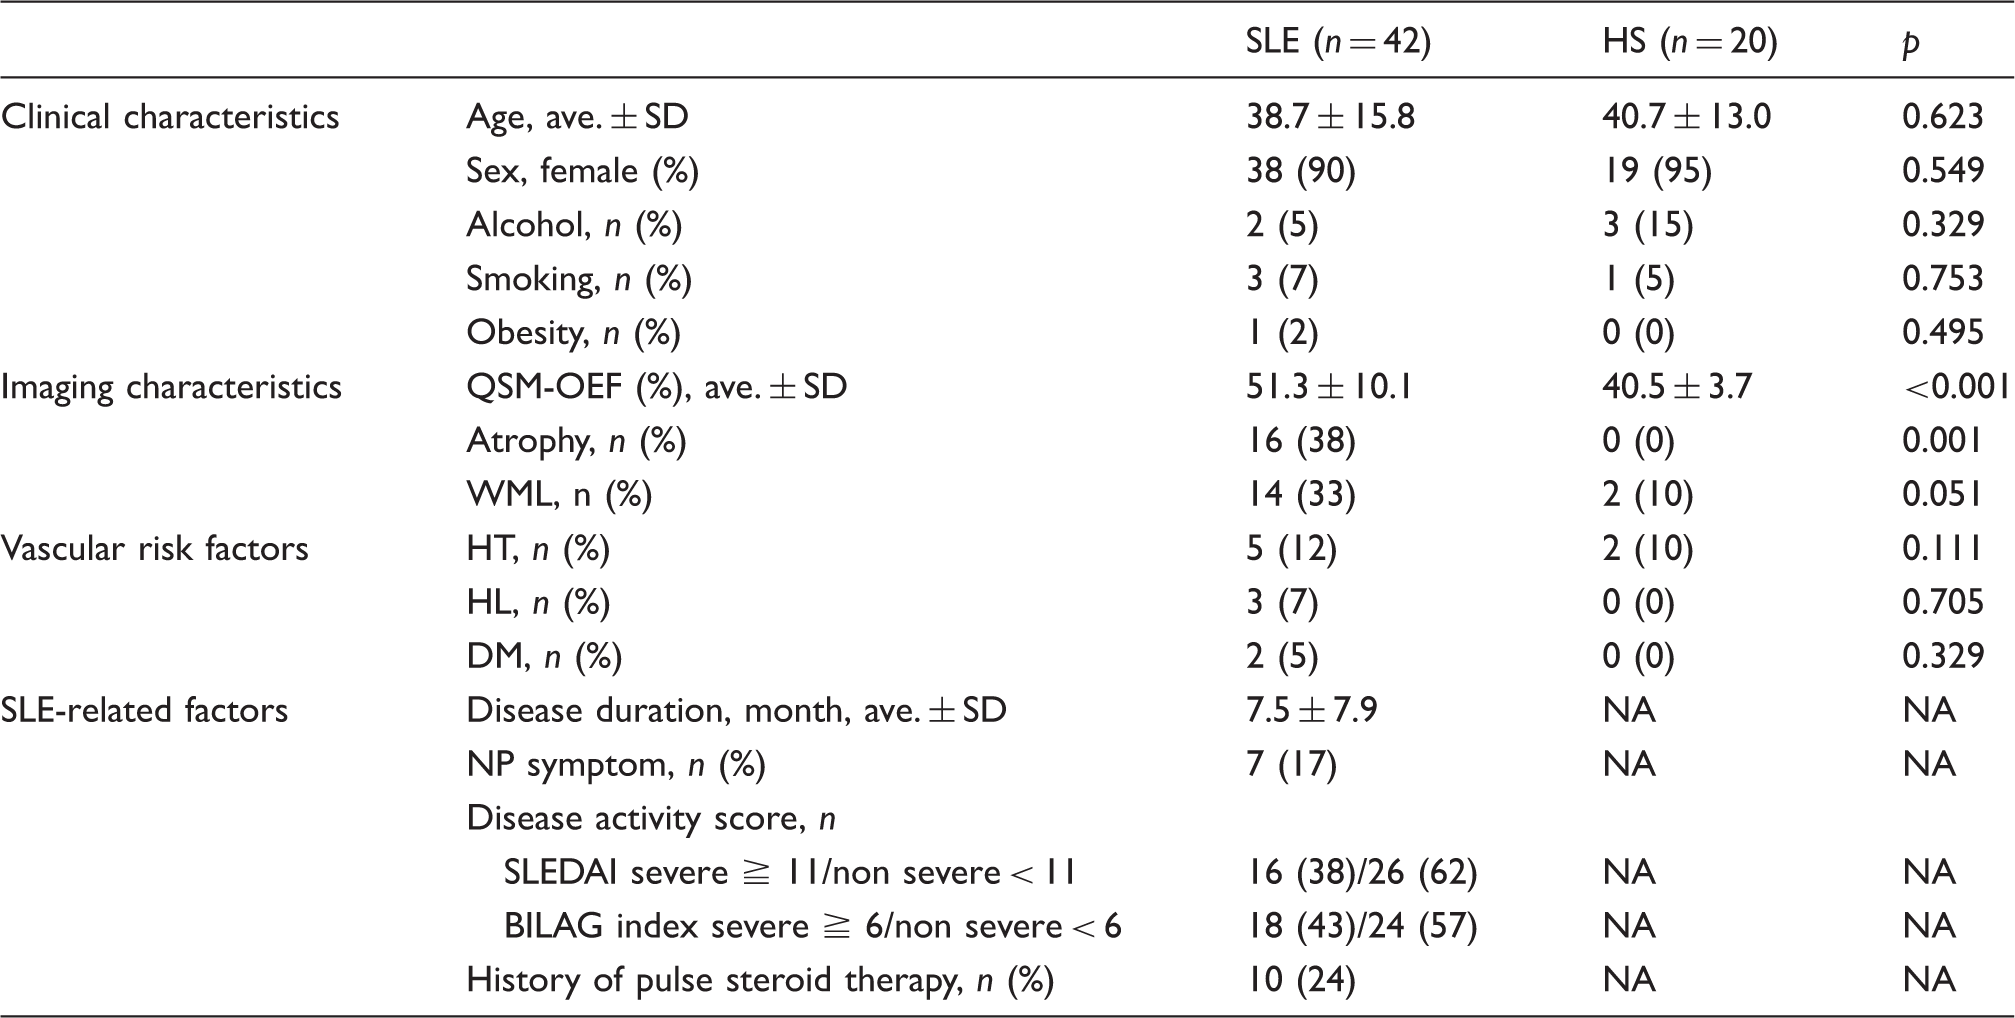
SLE: systemic lupus erythematosus; HS: healthy subject; SD: standard deviation; QSM: quantitative susceptibility mapping; OEF: oxygen extraction fraction; WML: white matter lesion; HT: hypertension; HL: hyperlipidemia; DM: diabetes mellitus; NP: neuropsychiatric; SLEDAI: Systemic Lupus Erythematosus Disease Activity Index; BILAG: British Isles Lupus Assessment Group; NA: not applicable.
The clinical and imaging characteristics for the subgroup comparisons in SLE patients.
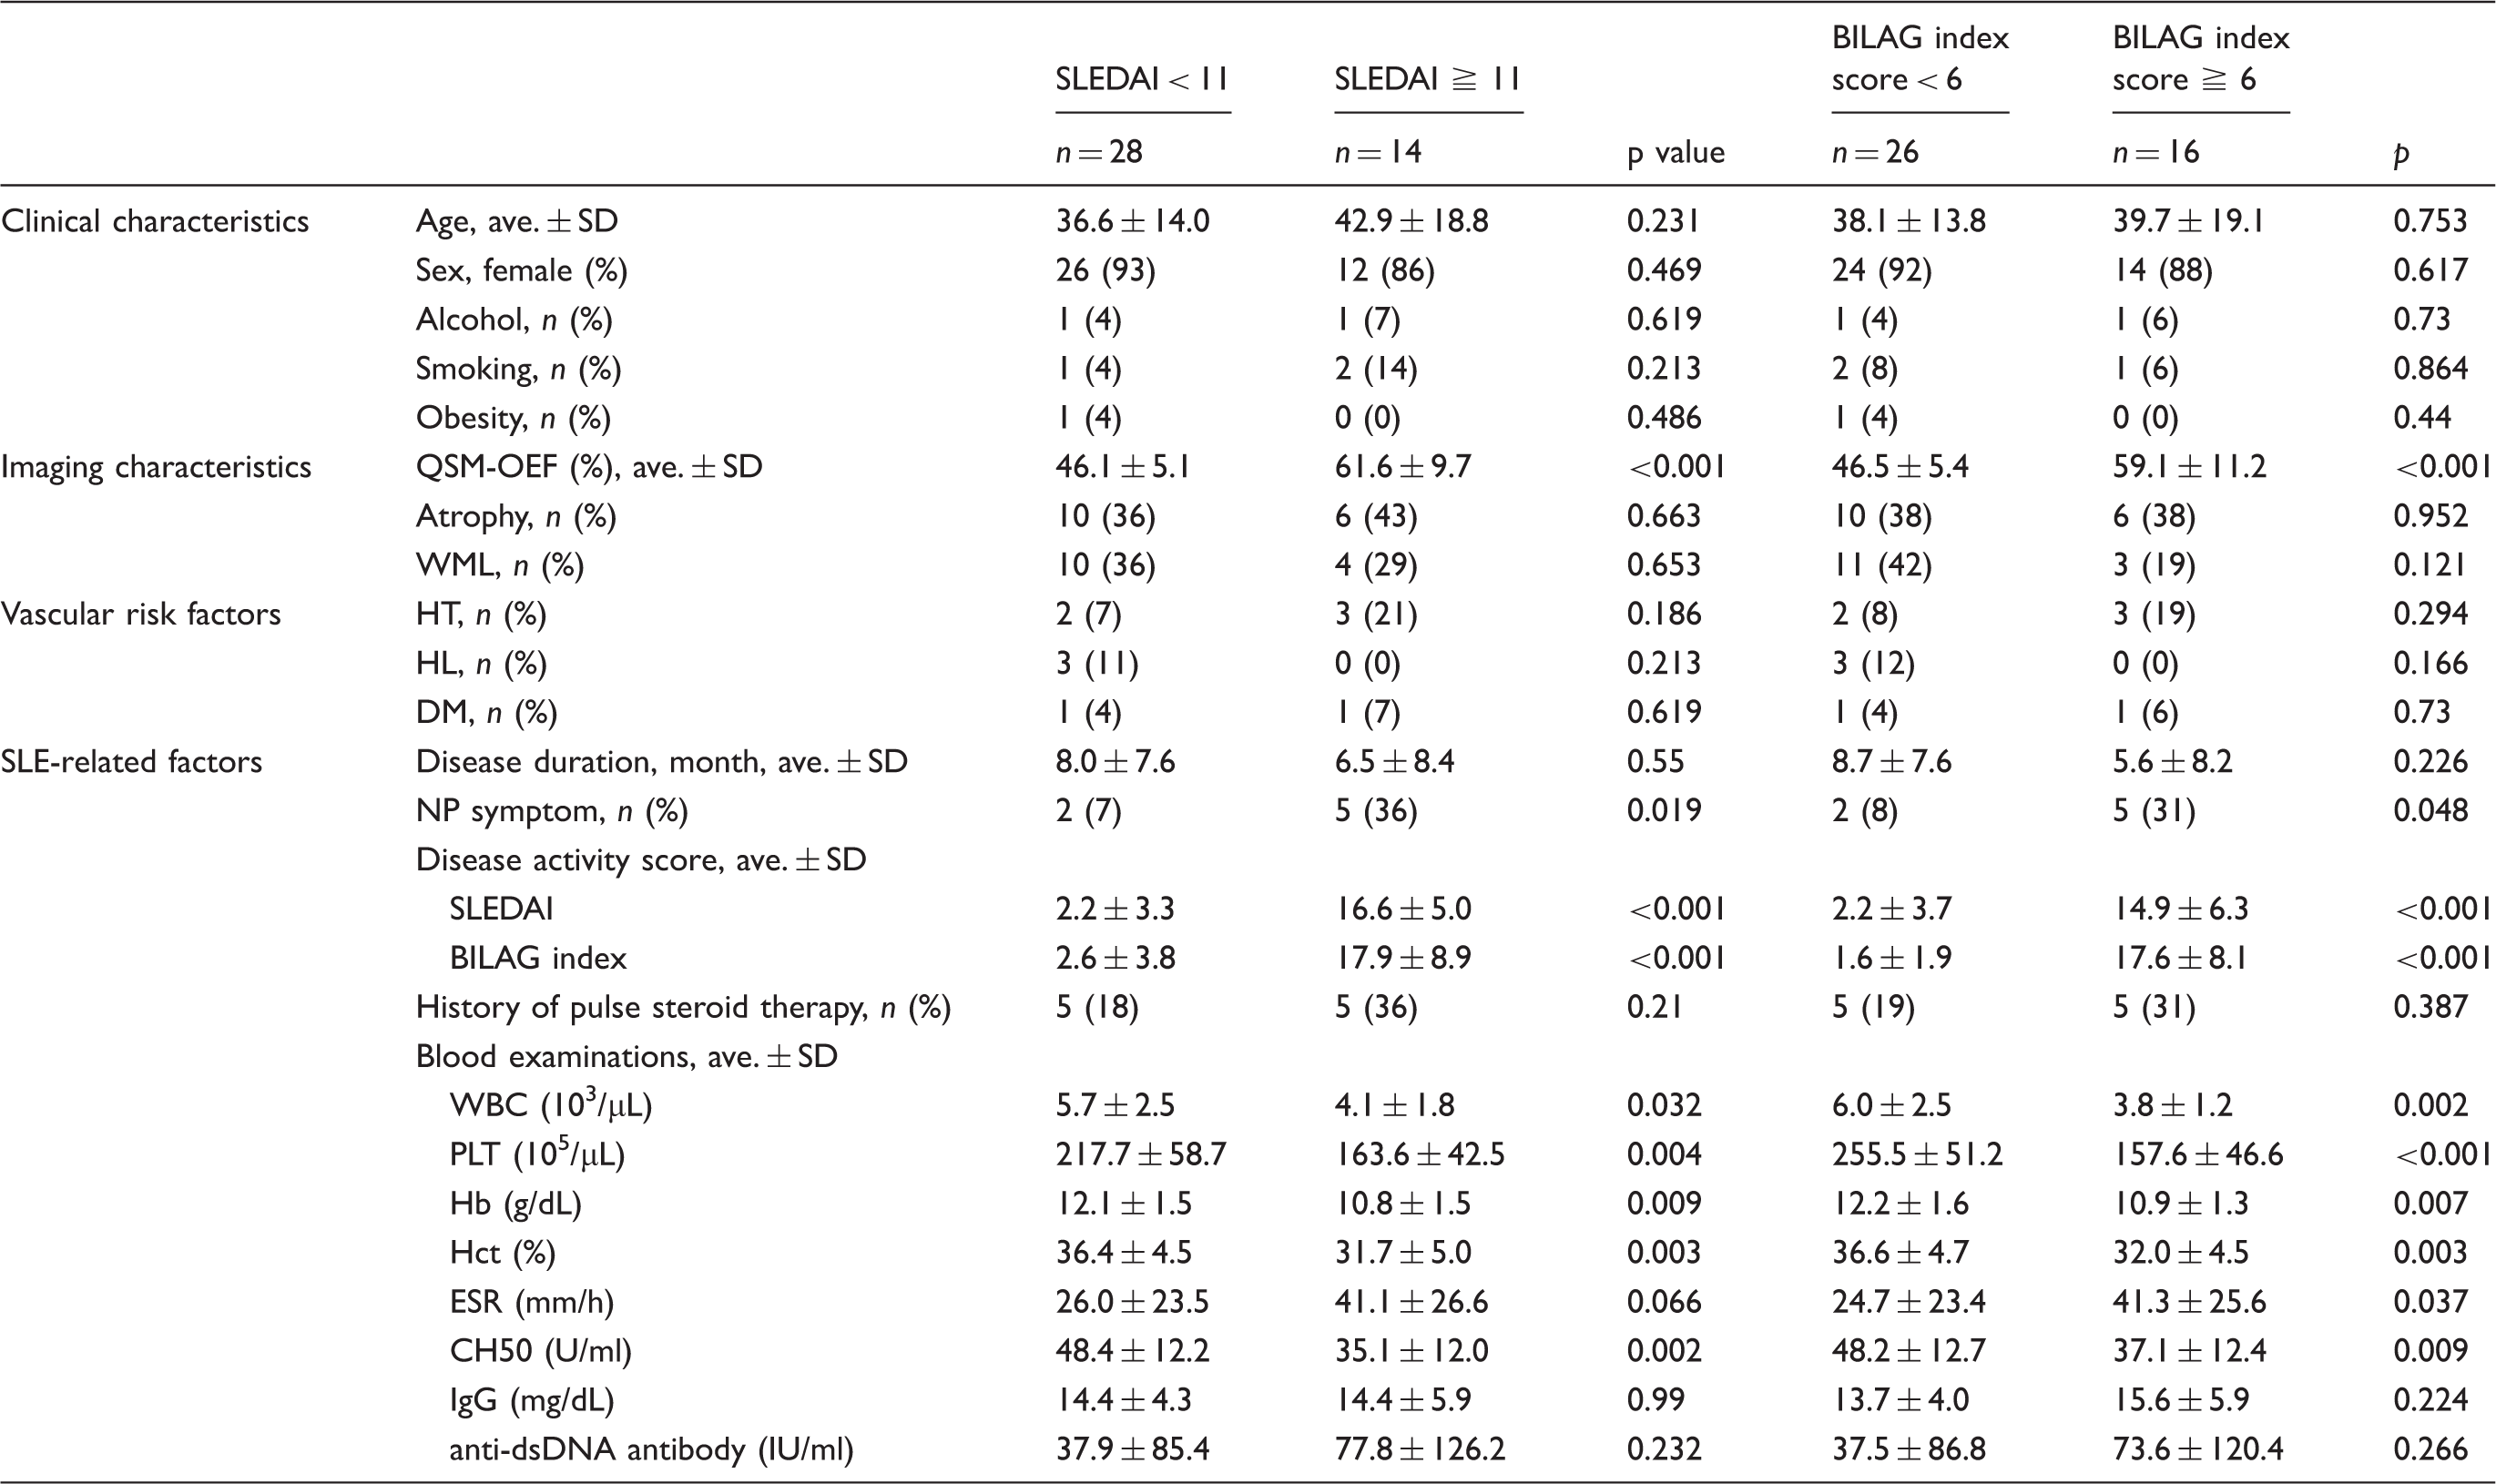
SLEDAI: systemic lupus erythematosus disease activity index; BILAG: British isles lupus assessment group; SD: standard deviation; QSM: quantitative susceptibility mapping; OEF: oxygen extraction fraction; WML: white matter lesion; HT: hypertension; HL: hyperlipidemia; DM: diabetes mellitus; NP: neuropsychiatric; WBC: white blood cell; PLT: platelet; Hb: hemoglobin; Hct: hematocrit; ESR: erythrocyte sedimentation rate; CH50: 50% hemolytic unit of complement; IgG: immunoglobin G; anti-dsDNA antibody: anti-double stranded DNA antibody.
The ROC analysis suggested optimal cutoff levels for the QSM-OEF (49.5 for SLEDAI and 51.3 for BILAG score) for prediction of the SLE disease activity. Therefore, the sensitivity, specificity, and AUC were 100.0% (14/14), 75.0% (21 of 28), and 0.946 for the SLEDAI, and 75.0% (12/16), 84.6% (22/26), and 0.849 for the BILAG score, respectively.
The univariate and multiple linear regression analyses for activity index (SLEDAI, BILAG index score).
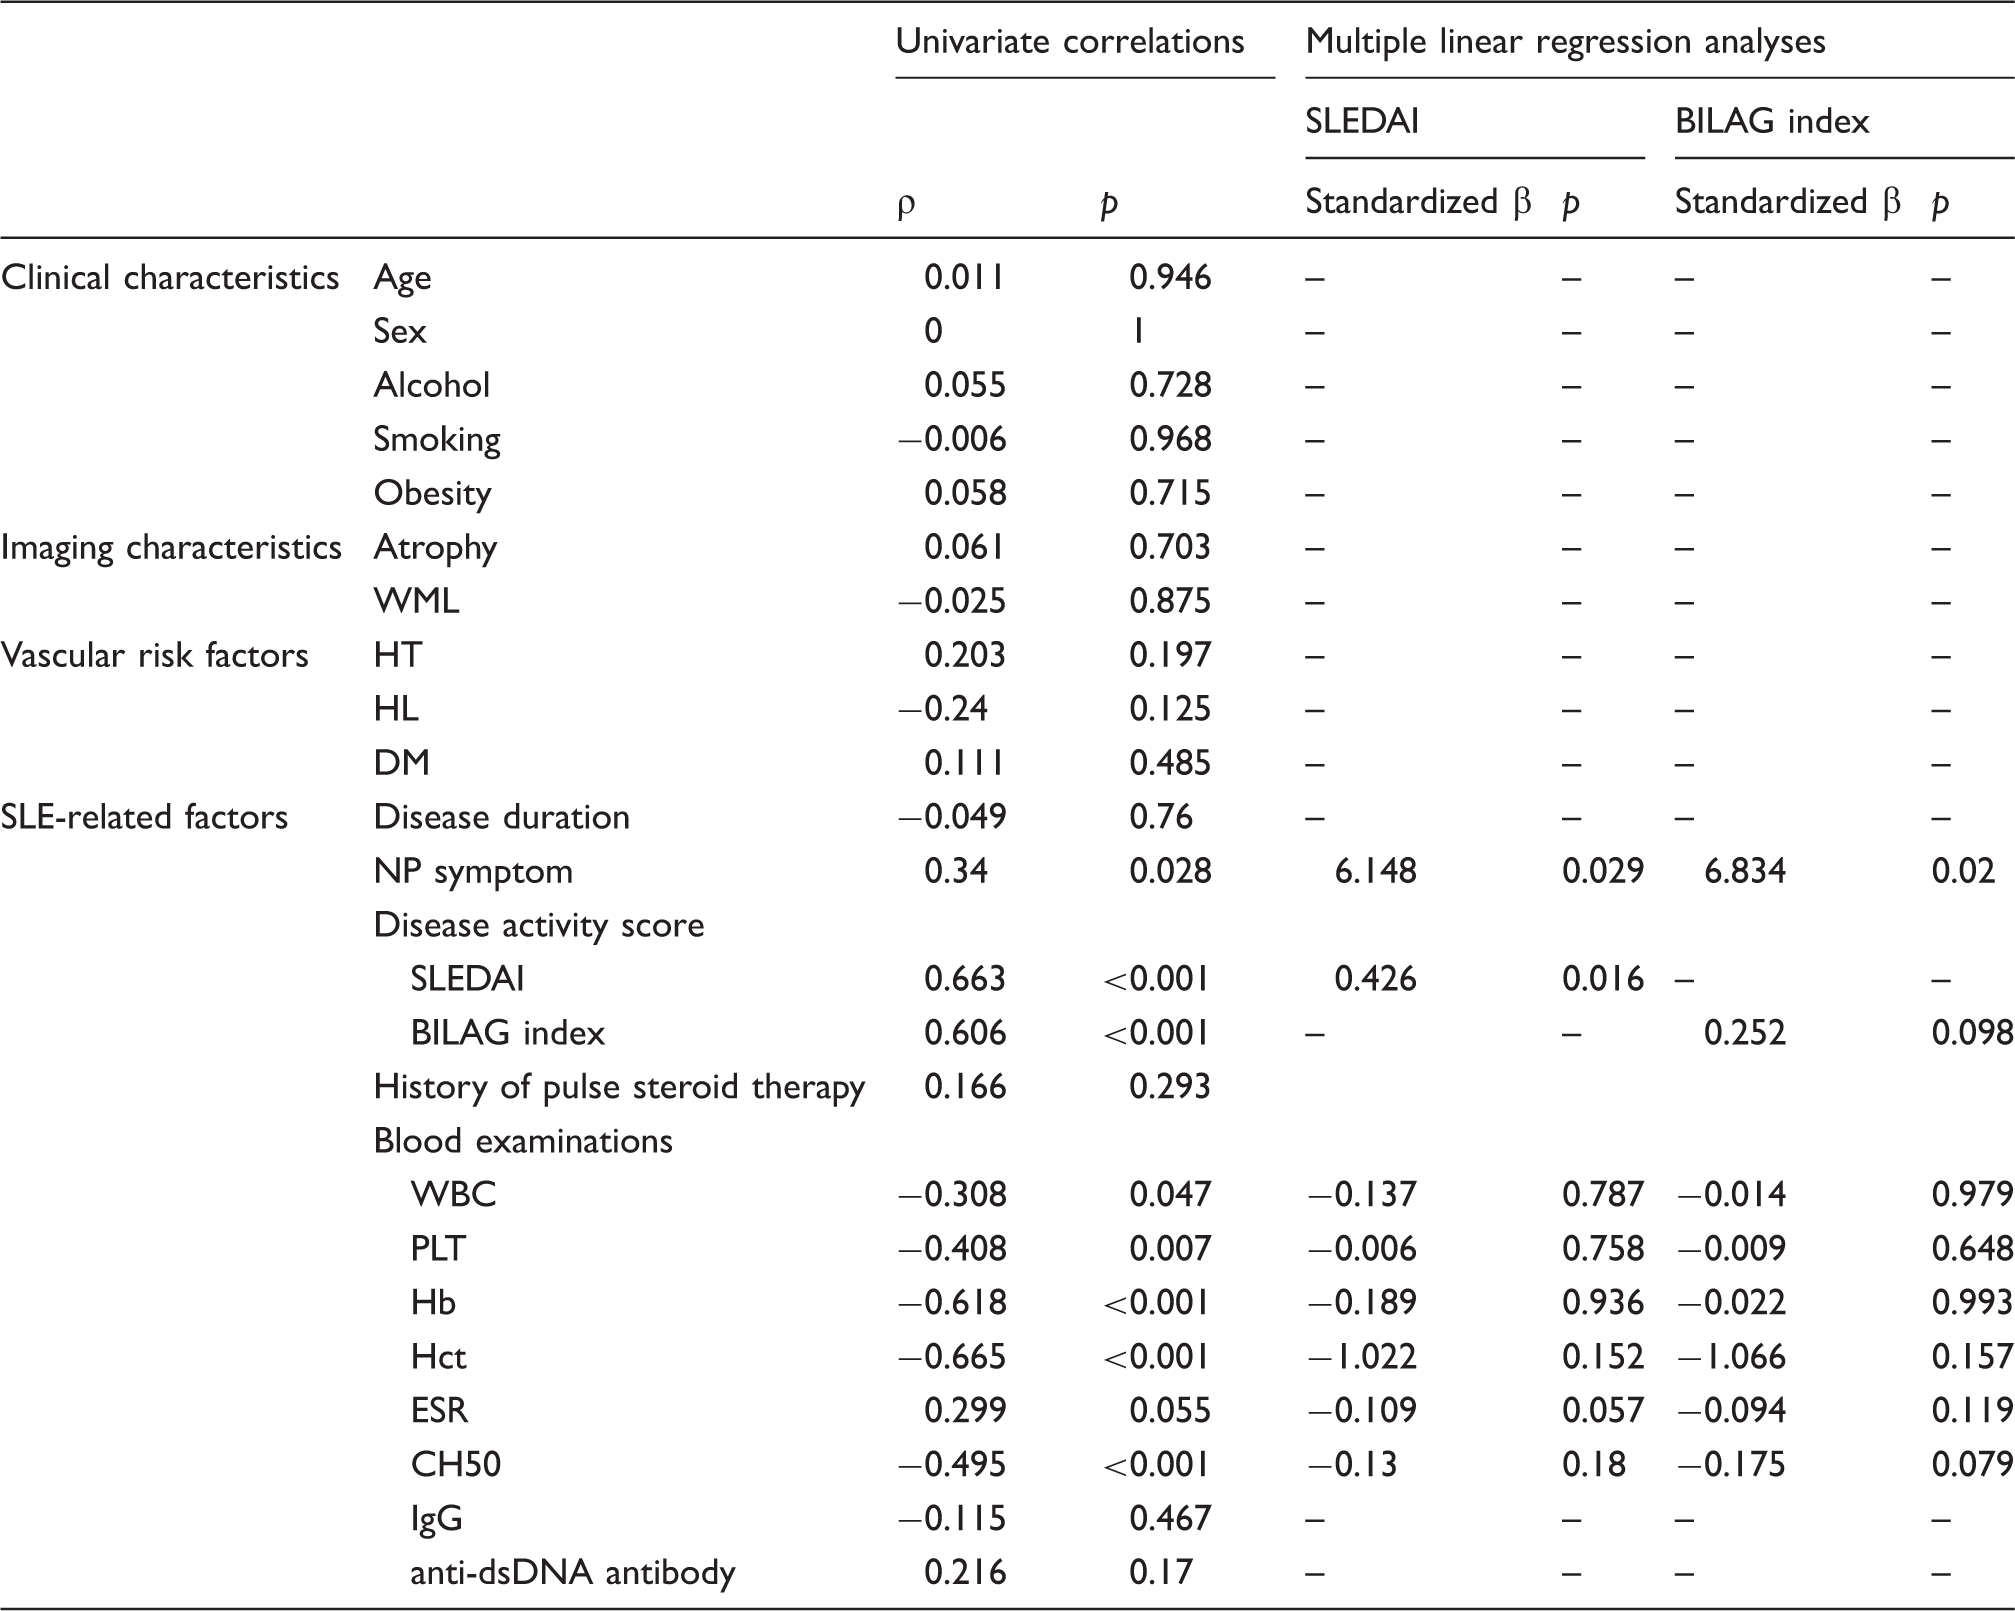
SLEDAI: Systemic Lupus Erythematosus Disease Activity Index; BILAG: British Isles Lupus Assessment Group; WML: white matter lesion; HT: hypertension; HL: hyperlipidemia; DM: diabetes mellitus; NP: neuropsychiatric; WBC: white blood cell; PLT: platelet; Hb: hemoglobin; Hct: hematocrit; ESR: erythrocyte sedimentation rate; CH50: 50% hemolytic unit of complement; IgG: immunoglobin G; anti-dsDNA antibody: anti-double stranded DNA antibody.
Discussion
In this study, OEF measurements using QSM of MRI were significantly higher in SLE patients than those in HS. Despite previous descriptions of cerebral blood flow (CBF) and its patterns in SLE,30–32 the characteristics of cerebral oxygen metabolism have been unclear. Thus, the ability to image brain oxygenation using QSM-OEF offers a non-invasive means to understand brain conditions in the SLE patients, including disruptions to the oxygen supply. Moreover, the novel finding was that OEF was independently and significantly associated with SLEDAI and NPS—which would expect that the SLE-associated systemic inflammatory processes leading to peripheral endothelial dysfunction in SLE brain,33–36 which are a reported brain pathophysiology in SLE patients.
A physiologic change in Hct content affects QSM-OEF measurements. This effect may be important in pathologic conditions, such as anaemia, in which QSM-OEF is known to increase. In this study, the Hb and Hct level in the patients with a high SLE score was low, approaching the level of anaemia, which would result in elevated OEF. However, it is important to note that, in the multiple linear regression analyses for QSM-OEF, the SLEDAI was independently associated with QSM-OEF, but not Hct and Hb values. These results may indicate that, in the SLE patients, the QSM-OEF map may reflects abnormal oxygen metabolism rather than anaemia.
When an artery is narrowed or occluded to compensate for decreasing cerebral perfusion pressure (CPP), brain arterioles dilate to reduce vascular resistance in attempts to maintain constant CBF (autoregulation).37,38 As CPP continues to decrease and CBF is maximally increased, a second compensatory mechanism results in an increase in the fraction of total oxygen extracted from blood (OEF)39,40 to maintain a close to normal oxygen metabolism. This phenomenon termed ‘misery perfusion’ 41 represents ischaemic tissue with elevated OEF. For the mechanism for the increased OEF in this study, we spiculate that similar pathogenesis may occur in the brain of SLE patients. This hypothesis is supported by many previous studies, which demonstrated small vessel injury due to vasculitis in SLE brain. 42 A recent preliminary study using 7T-MRI demonstrated that minute punctate or linear hyperintensity lesions with/without contrast enhancement indicating microvascular inflammation were frequently found in patients with NPSLE. 43 Moreover, many previous studies based on 18FDG PET, H2 150PET and SPECT show GM hypometabolism and hypoperfusion in NPSLE patients.30–32,44,45 On the other hand, the previous 18FDG PET study showed the glucose hypermetabolism was specifically elicited by correlation with disease activity in SLE. 46 Because inflammation increases glucose transporter expression, 47 increased 18FDG uptake would be expected in the presence of inflammation. Therefore, as a different mechanism for our results, other than small vessel injury, the increased oxygen demand would be postulated to be attributable to ischemic state in SLE patients. The previous studies using SPECT or MR perfusion-weighted imaging showed increased cerebral blood volume (CBV) in SLE patients.48–50 The increased CBV reported in stroke may indicate intact vascular beds with potentially salvageable areas in the penumbra of the lesion. 51 Furthermore, increases in CBV with associated decreased arterial resistances and increased vasodilation can be a sign of vasomotor instability, a compensatory mechanism indicating resolving injury or a reduction of compensatory capacity in response to further ischaemia or injury. 52 The previous study also showed that cerebral arterial resistances and impedances are significantly lower in SLE compared with controls, which were also consistent with increased arteriolar dilation and increased CBF. Thus, in SLE patients, we assume that the condition with increased CBV may cause an increased OEF.
SLE fundamentally involves inflammation, which is difficult to detect using conventional MRI. Although many studies with conventional MRI have supplied ample evidence of brain pathology in SLE patients, such as cerebral infarction, brain atrophy and multifocal GM and/or WM lesions, 5 these MR findings may indicate that pathological conditions of the brain occur as a result of SLE-related inflammation. Furthermore, previous investigators have considered that NPSLE may cause changes in brain metabolism and blood flow, which can be detected using several radiographic techniques, including PET, 53 SPECT,54,55 and advanced MRI techniques such as perfusion-weighted MRI, fMRI and MR spectroscopy. 56 However, there are controversial results in the literature concerning brain metabolism and blood flow in NPSLE brain. Although there are widespread reports of hypoperfusion in NPSLE, cerebral hypermetabolism and hyperperfusion in SLE have been noted in a number of previous reports using SPECT, PET or magnetic resonance perfusion-weighted imaging.48–50 Thus, the etiology of and basis for NPSLE-associated brain lesions remains uncertain, and an imaging biomarker of disease status has been desired.
Our results may show importance of QSM-OEF as an imaging biomarker of disease activity in SLE, although the elevated OEF in SLE patients was pathophysiologically relatively small. To our knowledge, there has only been one study to evaluate an imaging biomarker for the disease activity in SLE. 12 In this study using PET, an association was found between the SLEDAI score and increased 18FDG uptake in the WM of SLE patients. Because inflammation increases the expression of glucose transporter, the authors interpret the hypermetabolism of the WM as evidence of acute inflammation. However, PET is limited by its rigid technical requirements and high cost. 57 Thus, our less invasive assessment with QSM-OEF has clinical significance in which it may provide a simple method for investigating disease activity in SLE patients.
Our study has some limitations that should be acknowledged when interpreting the results. First, the main limitation of this study was the lack of cases with contrast-enhanced MR perfusion study. Therefore, the relationship between OEF and perfusion measurement (CBF or CBV) could not be proved. In determining the mechanism for the increased OEF in this study, blood flow measurement was an important factor. Second, we had a relatively small sample size recruited from only one institution which may represent sampling bias. Third, subject selection was also limited by the study's retrospective design. Because many patients received therapy with anti-platelet, anti-hypertensive and anti-lipemic drugs before undergoing MR imaging, we cannot rule out the possibility that these treatments affected the results. Fourth, we used the SLEDAI as a disease activity index in the SLE patients. The SLEDAI was not used as measurement of the degree of CNS involvement alone, but rather as a marker of global disease activity in various organs. Fifth, for the calculation of the QSM-OEF in this study, automated measurement of ROIs was performed at two-dimensional position coordinate (on a slice at the level of centrum semiovale). It would be better to apply standard method such as three-dimensional stereotaxic ROI, which was used in the previous paper regarding the QSM-OEF measurement. 58 Finally, we excluded patients with brain abnormalities on MRI such as large territory infarction and WMH (Fazekas grade 2 and 3) to simplify investigations. Thus, our study included few patients with severe NPS which could affect the results.
In conclusion, we found the elevated OEF of the SLE brain, which may indicate ‘misery perfusion’ in diffuse brain areas in SLE patients. Our results may offer new insights into the characterisation of hemodynamic impairment of the SLE brain and a better understanding of brain injury evidence and altered brain physiology in SLE. Furthermore, OEF in SLE patients is specifically associated with systemic disease activity. This suggests that the elevated OEF is an indication of reactive changes of the small vessels that may occur as a result of neuroinflammatory activity. Further research should be performed to investigate the longitudinal associations among OEF, disease activity, clinical symptoms and the prognosis of SLE to fully ascertain whether OEF can be used as an imaging biomarker for monitoring the disease activity, an early indicator of SLE, and as a prognostic predictor in SLE patients. Furthermore, predictors of the development of brain lesions on MRI in SLE patients also would be of clinical value.
Footnotes
Funding
The author(s) received no financial support for the research, authorship, and/or publication of this article.
Declaration of conflicting interests
The author(s) declared no potential conflicts of interest with respect to the research, authorship, and/or publication of this article.
Authors' contributions
MM, SK, KK, YW and YK planned and designed the study and wrote the manuscript. MM and SK analyzed the data. SI and YT collected study participants and clinical date. All authors reviewed the manuscript.