
Abstract
Although alterations in energy metabolism are known in ALS, the specific mechanisms leading to energy deficit are not understood. We measured metabolite levels derived from injected [1-13C]glucose and [1,2-13C]acetate (i.p.) in cerebral cortex and spinal cord extracts of wild type and hSOD1G93A mice at onset and mid disease stages using high-pressure liquid chromatography, 1H and 13C nuclear magnetic resonance spectroscopy. Levels of spinal and cortical CNS total lactate, [3-13C]lactate, total alanine and [3-13C]alanine, but not cortical glucose and [1-13C]glucose, were reduced mostly at mid stage indicating impaired glycolysis. The [1-13C]glucose-derived [4-13C]glutamate, [4-13C]glutamine and [2-13C]GABA amounts were diminished at mid stage in cortex and both time points in spinal cord, suggesting decreased [3-13C]pyruvate entry into the TCA cycle. Lack of changes in [1,2-13C]acetate-derived [4,5-13C]glutamate, [4,5-13C]glutamine and [1,2-13C]GABA levels indicate unchanged astrocytic 13C-acetate metabolism. Reduced levels of leucine, isoleucine and valine in CNS suggest compensatory breakdown to refill TCA cycle intermediate levels. Unlabelled, [2-13C] and [4-13C]GABA concentrations were decreased in spinal cord indicating that impaired glucose metabolism contributes to hyperexcitability and supporting the use of treatments which increase GABA amounts. In conclusion, CNS glucose metabolism is compromised, while astrocytic TCA cycling appears to be normal in the hSOD1G93A mouse model at symptomatic disease stages.
Keywords
Introduction
Amyotrophic lateral sclerosis (ALS) is a neurodegenerative disorder primarily characterized by progressive loss of motor neurons in the brain and spinal cord. The pathogenic mechanisms by which neurons die in ALS are not yet clear. Among many contributing mechanisms, metabolic abnormalities appear to be important. 1 Various abnormalities in energy metabolism have been reported in ALS. About half of patients with ALS display weight loss and increased energy expenditure that indicates disturbances in energy metabolism.1–3 In addition, changes in expression of genes involved in energy metabolism were found in brain and spinal cord.4,5 At cellular levels, studies have shown functional and morphological abnormalities in mitochondria, reduced oxidative phosphorylation and subsequent generation of ATP.6–8
Selective loss of motor neurons in brain and spinal cord is a characteristic feature of ALS. In addition, several studies have shown the involvement of astrocytes in neuronal death. 9 Astrocytes protect neurons against excitotoxicity through uptake of extracellular glutamate by glutamate transporters. They also release neurotrophic factors that affect motor neuron survival. There is evidence that indicate compromised cross talk between astrocytes and neurons in ALS.5,10 Moreover, reduced transport of glutamate 11 and selective loss of the glutamate transporter GLT-1 12 have been shown in brain and spinal cord of patients with ALS.
Reduced glucose utilization represented by rates of 2-deoxyglucose or fluoro- deoxyglucose uptake and phosphorylation has been shown in various parts of cortex and spinal cord of patients with ALS, while glucose utilization was increased in cerebellum and mid brain.8,13–16 These studies used 18F deoxy-glucose positron emission tomography (PET) and 14C autoradiography that mainly indicate glucose utilization, but cannot inform about its metabolism. 17 Similar to glucose, 2-deoxyglucose is transported into brain cells via glucose transporters. It is then phosphorylated by hexokinase into 2-deoxyglucose 6-phosphate, a metabolite which is not further metabolized. 18 In contrast, quantification of exogenously administered 13C labelled substrate levels, such as [1-13C]glucose and [1,2-13C]acetate using 13C nuclear magnetic resonance (NMR) spectroscopy can inform about the functioning of metabolic pathways in more detail. 19 Each labelled carbon can be tracked to obtain information about CNS metabolism of [1-13C]glucose and [1,2-13C]acetate at the same time. While glucose can be metabolized by all cells in the CNS, acetate is largely taken up and metabolized by astrocytes, but also oligodendrocytes. 20
Although pathological changes in ATP generation and/or utilization pathways are known to modify ALS progression, the specific biochemical alterations and mechanisms leading to energy deficits in this disease are not comprehensively understood. Therefore, the aim of this study was to characterize biochemical defects in the energy producing pathways by following the metabolism of injected [1-13C]glucose and [1,2-13C]acetate (i.p.) in CNS tissues of hSOD1G93A and wild type mice. Specifically, we investigated alterations in neuronal and astrocytic energy metabolism and neuro-glial interactions in cerebral cortex and spinal cord of wild type and hSOD1G93A mice at onset (80 days) and mid (120 days) stages of the disease.21,22
Materials and methods
Animals
Wild-type and hSOD1G93A mice were bred by mating hSOD1G93A males (B6.Cg-Tg(SOD1*G93A)1Gur/J) expressing high copy numbers of the mutated human SOD1 (obtained from Jackson laboratory, Bar Harbor, ME, USA) with C57BL/6 wild type females at the University of Queensland. Female wild type and hSOD1G93A mice were used at onset (80 days of age) and mid stage of disease (120 days of age). Mice were maintained in a 12-h light, 12-h dark light cycle with access to food and water ad libitum. All animal procedures were approved by the University of Queensland Animal Ethics Committee (SBMS/128/14) and complied with the guidelines of the Queensland Animal Care and Protection Act 2001. Efforts were made to minimize the suffering and number of animals and experiments were done in compliance with the ARRIVE guidelines (Animal Research: Reporting in Vivo Experiments https://www.nc3rs.org.uk/arrive-guidelines).
Injection of labelled glucose and acetate
Wild type (n = 16–19) and hSOD1G93A mice (n = 10–13) at onset (80 days), and wild type (n = 10–12) and SOD1G93A (n = 10–12) at mid disease (120 days) were injected intraperitoneally with a combination of [1-13C]glucose (543 mg/kg) and [1,2-13C]acetate (504 mg/kg, Cambridge Isotope laboratories, Tewksbury, MA, USA) 15 min before microwave fixation to the head at 5 kW for 0.74 to 0.80 s (Model MMW-05, Muromachi, Tokyo, Japan). Sample sizes were chosen based on the variations observed in previous data and power analysis to be able to detect 10–30% of variations in metabolite levels with 80% power at α = 0.05 significance. Two animals were taken out from the analysis as they were found to have no labelling from the injection of labelled glucose and acetate. Measures that were outside of two standard deviations from the mean were removed. The microwave instantaneously kills the animal and denatures brain proteins and enzymes which may alter metabolite levels. Afterwards, mice were decapitated and the cerebral cortices and lumbar spinal cords removed and stored in −80℃ until extracted. The spinal cords were subjected to post-mortem metabolism as the microwave fixation did not include the spinal cord.
Methanol–chloroform extraction
Tissue samples of cortex and spinal cord were homogenized with a sonicator (Branson ultrasonics, Danbury, CT, USA) in methanol after the addition of 25 µM α- aminobutyric acid (α-ABA), chloroform and water. The α-ABA is used as an internal standard for high-performance liquid chromatography (HPLC) analysis. Metabolites were extracted using methanol/water/chloroform as previously described in Le Belle et al. 23 Samples were then dried using a Centrivap concentrator (Labconco, Kansas, MO, USA) and stored in −20℃ until the samples were analysed by HPLC, 1H and 13C NMR Spectroscopy. After animal tissues were collected and numbered randomly, the experimentor was unaware of the genotype during extraction and quantifications of samples until analyses were completed.
1H and 13C nuclear magnetic resonance spectroscopy
Measuring the levels of [1-13C]glucose- and [1,2-13C]acetate-derived metabolites provides information about neuronal (glucose) and astrocytic (acetate) metabolism.24,25 Isotopomers from the metabolism of [1-13C]glucose and [1,2-13C]acetate in the spinal cord and cortex of hSOD1G93A and wild type mice at onset and mid-disease and total amounts of selected metabolites were quantified using 13C and 1H NMR spectroscopy. In addition, HPLC was used to measure total levels of metabolites, including amino acids. Dried samples were dissolved in 250 μl deuterium oxide (D2O) (99%, Cambridge Isotope Laboratories) comprising 0.3 g/L 3-(trimethylsilyl) propionic-2,2,3,3-D4 acid sodium salt (TSP) (98.0%, Sigma-Aldrich, St Louis, MO, USA) and 0.1% v/v ethylene glycol (99%, Sigma-Aldrich) as internal standards for 1H and 13C NMR spectroscopy, respectively. All spectra were recorded at 298 K using 5 mm Shigemi tubes (Shigemi, Allison Park, PA, USA) on a Bruker Avance III 600 MHz spectrometer (Bruker BioSpin, Rheinstetten, Germany) with a QCI CryoProbe. All 1H NMR spectra were recorded using a pulse angle of 90°, acquisition time of 2.66 s and a relaxation delay of 10 s. A total of 128 and 256 scans were acquired for cortex and spinal cord, respectively. Proton decoupled 13C NMR spectra were acquired with a pulse angle of 30°, acquisition time of 1.65 s and a relaxation delay of 0.5 s. The numbers of scans acquired were 10,000 and 30, 000 for cortex and spinal cord samples, respectively.
Relevant peaks in the 13C and 1H NMR spectra were identified and integrated using TopSpin 3.5 software (Bruker BioSpin). Metabolites were quantified from the integrals of the peak areas relative to the known concentrations of the internal standards TSP (1H NMR) and ethylene glycol (13C NMR). Amounts from the 1H spectra were corrected for the number of protons constituting the peak, while 13C-labeled metabolites levels were corrected for 1.1% natural abundance of 13C and for nuclear Overhauser enhancement (NOE) and relaxation effects relative to the internal standard. A typical NMR spectrum is shown in supplementary Figure 1.
HPLC
The total amounts of glutamate, glutamine, GABA, aspartate, glutathione and taurine in the sample extracts were quantified using HPLC (1200 series; Agilent Technologies, Santa Clara, CA, USA) followed by fluorescence detection using ophthaldialdehyde as a derivatization agent. Amino acids were separated on a reverse phase column, Zorbax Eclipse XDB-C 18 column (4.6 × 150 mm, 3.5 µm; Agilent Technologies). A gradient of two eluents: phosphate buffer (10 mM, pH 7.3) and methanol were used to achieve better separation and faster elution of the nonpolar analytes. Solutions of amino acids with different concentrations were run with the samples for standard curves. Relevant peaks from the HPLC spectra were identified and integrated. Amounts were corrected for any tissue loss using α-ABA as an internal standard and also for tissue weight. The average recovery of the internal standard for the samples was 88%.
Labelling patterns of [1-13C]glucose and [1,2-13C]acetate
The labelling pattern from [1-13C]glucose and [1,2-13C]acetate is given in Figure 1. Glucose can enter into both neurons and astrocytes via glucose transporters. However, at the acetyl-CoA stage, 66% of [1-13C]glucose is metabolized via pyruvate dehydrogenase (PDH) in neurons.26,27 In addition, 40% of brain glutamine is labelled from glutamate obtained from [1-13C]glucose and gets transferred from neurons to astrocytes.
28
Therefore, [1-13C]glucose-derived metabolite levels primarily are an indicator for neuronal metabolism. [1-13C]glucose is metabolized through a series of enzymatic reactions via the glycolytic pathway into two molecules of [3-13C]pyruvate. PDH catalyzes the conversion of [3-13C]pyruvate into [2-13C]acetyl CoA, which then condenses with oxaloacetate to form [2-13C]citrate. After a series of enzymatic reactions, [4-13C] α-ketoglutarate is formed and partially gets converted into [4-13C]glutamate, [4-13C]glutamine, [2-13C]GABA. The [4-13C]α-ketoglutarate is also further metabolized by the TCA cycle into equal parts of [2-13C] and [3-13C]succinate, which then is metabolized into [2-13C] and [3-13C]oxaloacetate partially giving rise to [2-13C] and [3-13C]aspartate. If [3-13C]oxaloacetate proceeds into a second turn of the TCA cycle [2-13C]glutamate, [2-13C]glutamine and [4-13C]GABA can be formed. Similarly, if [3-13C]pyruvate is metabolized via pyruvate carboxylase, which has been localized to astrocytes, [3-13C]oxaloacetate can give rise to [2-13C]glutamate, [2-13C]glutamine and [4-13C]GABA. As both the second turn of the TCA cycle and pyruvate carboxylase contribute to the formation of the above metabolites, interpretation of the levels is difficult. [1,2-13C]acetate is preferentially taken up by astrocytes
20
and can be converted into [4,5-13C]glutamate, [4,5-13C]glutamine, [1,2-13C]GABA. Most of the glutamate is found in neurons (Ottersen and Storm-Mathisen, 1985). Therefore, [4-13C]glutamate from [1-13C] glucose is mainly labelled in neurons and is sent to astrocytes to form [4-13C]glutamine. The amount of [4-13C]glutamate transferred from neurons to astrocytes can be estimated by the ratio of [4-13C]glutamine over % enrichment of [4-13C]glutamate. Similarly, the amount of glutamine transferred from astrocytes to neurons can be calculated as [4,5-13C]glutamate over % enrichment of [4,5-13C]glutamine.
29
[1- 13C]glucose and [1,2-13C]acetate labelling of metabolites. Labelling patterns derived from injection of [1-13C]glucose via PDH and PC as well as [1,2-13C]acetate in neurons and astrocytes after glycolysis and in the first turn of the TCA cycle. For simplicity, glucose metabolism is not shown in astrocytes. In addition, metabolites from the second turn of the TCA cycle and aspartate are not shown. Abbreviations: GAD: glutamate decarboxylase; Glu: glutamate; Gln: glutamine; GS: glutamine synthetase; OAA: oxaloacetate; PAG: phosphate activated glutaminase; PDH: pyruvate dehydrogenase; PC: pyruvate carboxylase; α-KG: ketoglutarate.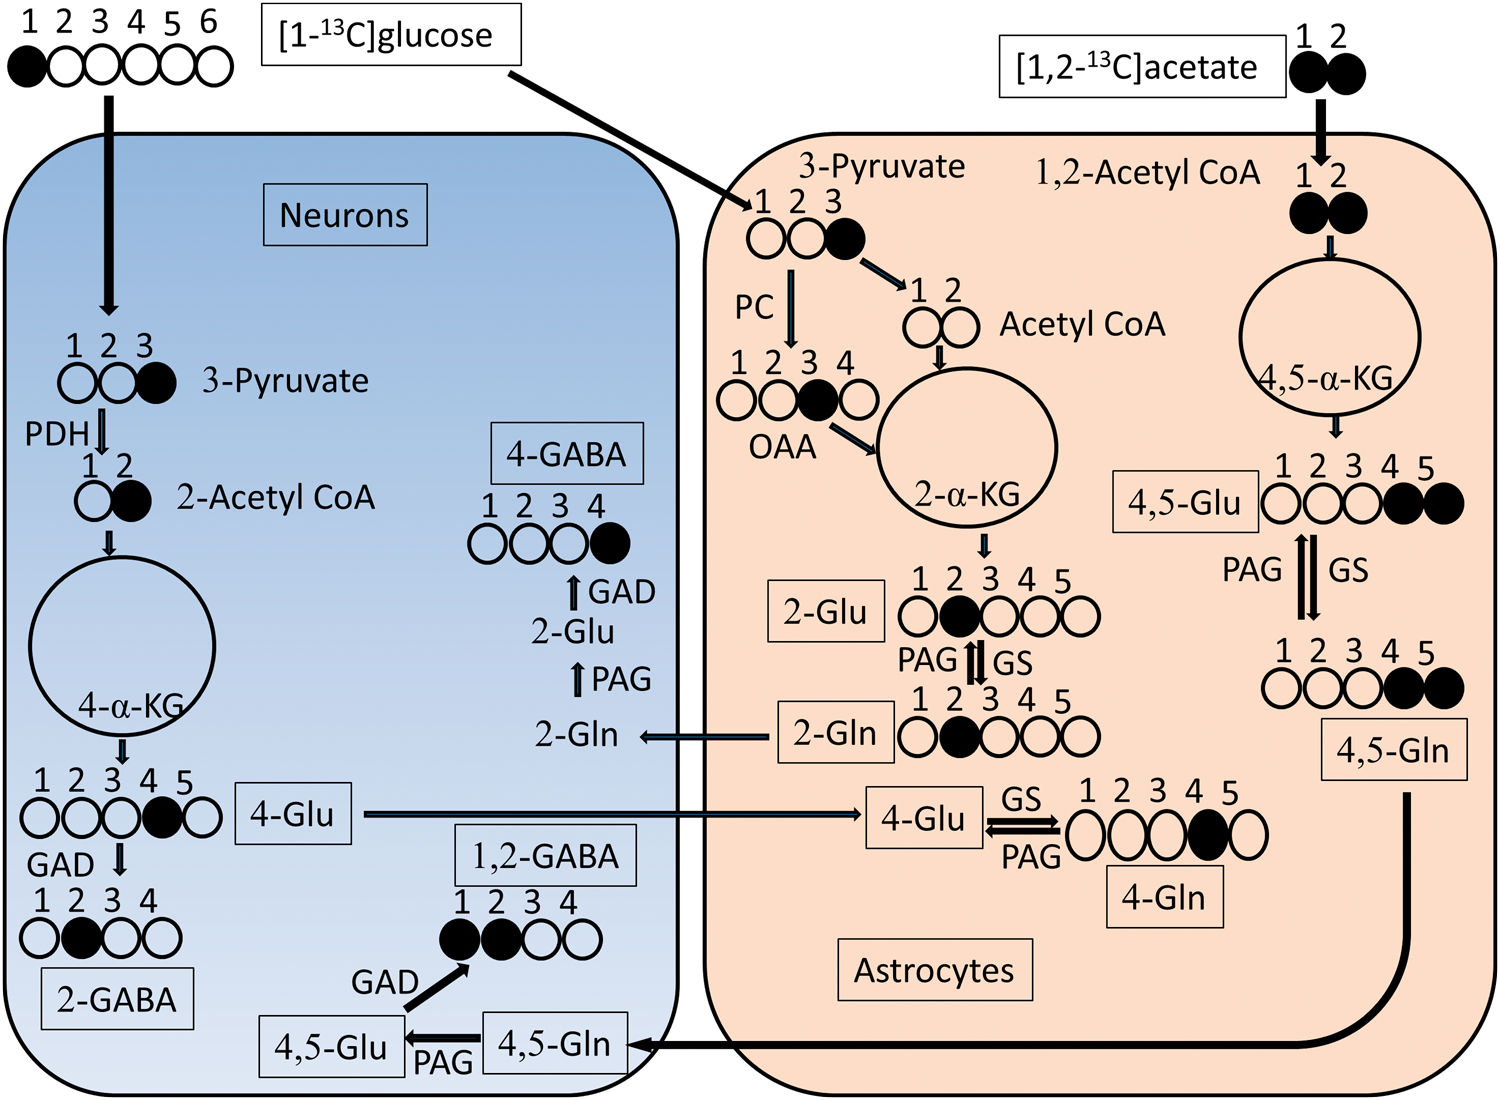
Data analysis
First, two-way ANOVAs were performed and if significant differences were found between genotypes, selected comparisons between genotypes at a specific disease stage were done using a Fisher's least significant difference (LSD) test. The numbers given in the results reflect the significance obtained from the post hoc test. For comparisons of two groups, unpaired Student's t-tests were used.
Results
Glycolysis-derived metabolites
There were no differences in total cortical glucose amounts and 13C labeled amounts of [1-13C]glucose between hSOD1G93A and wild type mice. Also, the % 13C enrichment of [1-13C]glucose was unchanged in cortex of hSOD1G93A mice (33.8%) compared to wild type mice at onset (30.1%), and in mid stage hSOD1G93A mice (32.7%) compared to wild type mice (33.7%). However, levels of various glycolytic-derived metabolites were reduced in hSOD1G93A mice cortex, namely total lactate by 25% (p = 0.028), [3-13C]lactate by 53% (p = 0.023), total alanine by 20% (p = 0.013) and [3-13C]alanine by 45% (p = 0.04, Figure 2(a) and (b)) at onset of disease compared to wild type mice. At mid stage, levels of total lactate were lowered by 28% (p = 0.024), [3-13C]lactate by 57% (p = 0.009), total alanine by 14% (p = 0.007) and [3-13C]alanine by 69% (p = 0.002, Figure 2(a) and (b)). Similarly, in the spinal cord, the levels of glycolytic-related metabolites were reduced in hSOD1G93A mice, total lactate by 32% (p = 0.012) and [3-13C]lactate by 55% (p = 0.012, Figure 2(c) and (d)) at onset of disease. Similarly, at mid stage, the amounts of total lactate were decreased by 23% (p = 0.036) and [3-13C]lactate by 53% (p = 0.012, Figure 2(c) and (d)).
Diminished concentrations of glycolysis-related metabolites derived from [1-13C]glucose in cortex and spinal cord extracts indicate impaired neuronal glucose metabolism in hSOD1G93A mice at symptomatic stages of disease. Total amounts of glycolysis-related metabolites were obtained using 1H and 13C NMR spectroscopy analyses of extracts of (a, b) cortex and (c, d) spinal cord from wild type (black bars) and hSOD1G93A mice (white bars). The graphs show the total amounts of glucose, lactate and alanine and 13C labelled levels of [1-13C]glucose, [3-13C]lactate and [3-13C]alanine. Data represent mean ± SEM and were analyzed using two-way ANOVAs followed by Fisher's LSD test where *p < 0.05, **p < 0.01 indicate statistically significant difference between hSOD1G93A and wild type mice.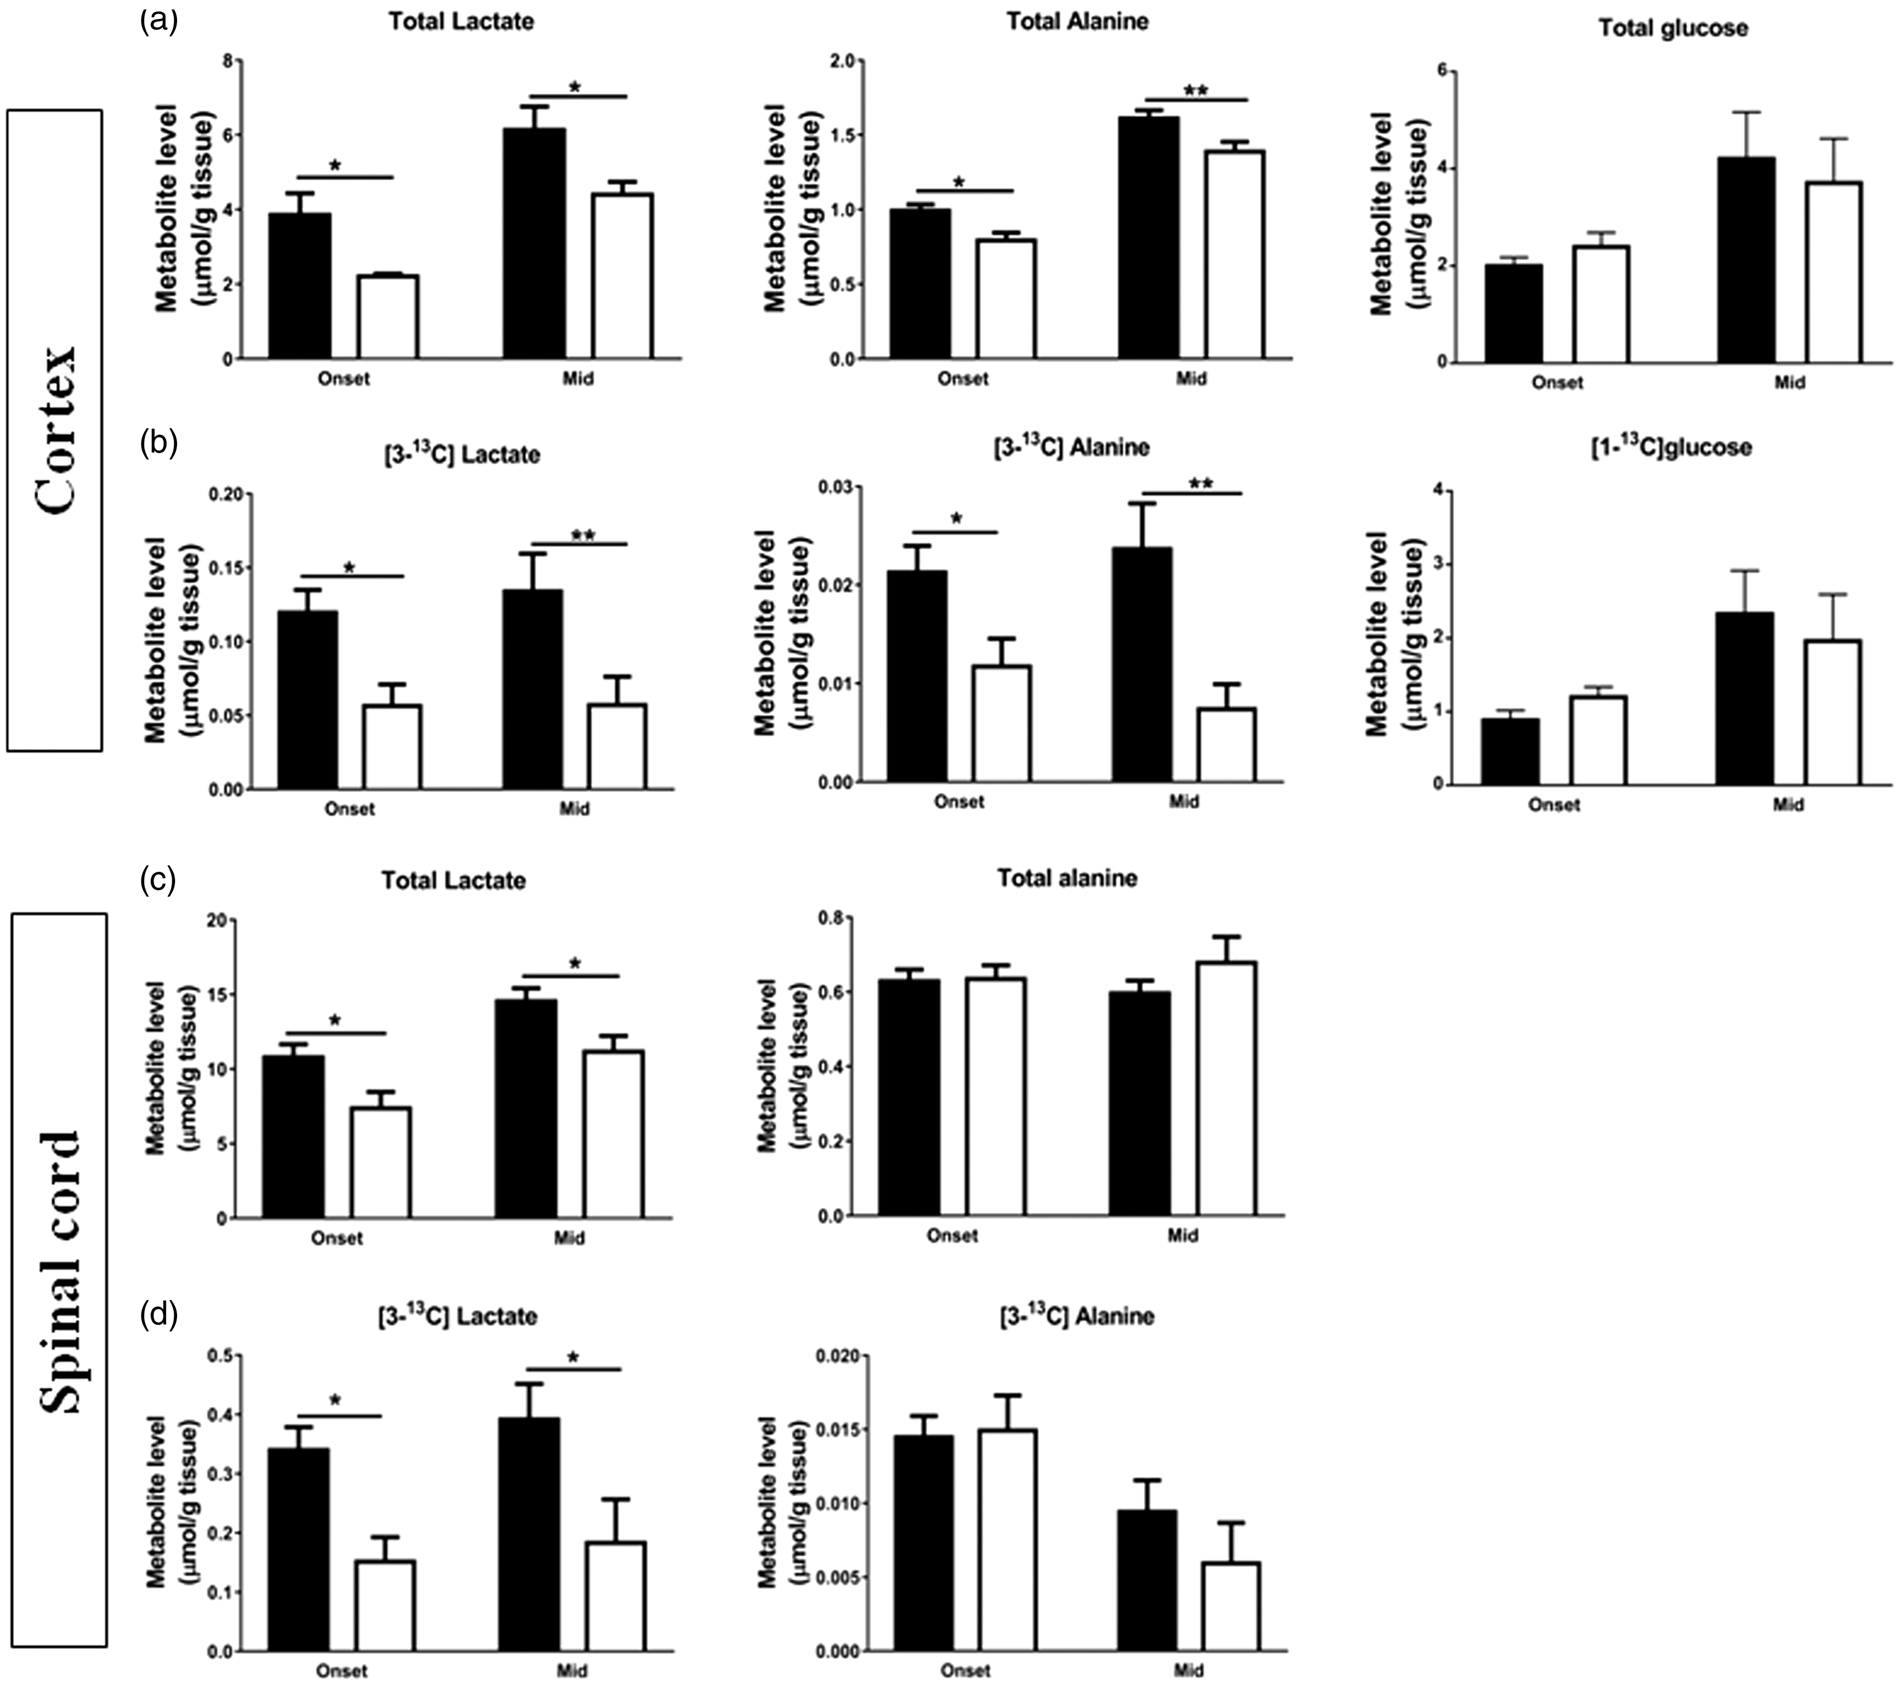
TCA cycle metabolites and [1-13C]glucose-derived metabolites
No differences were seen in the total amounts of glutamate, glutamine, GABA and aspartate (Figure 3(a)) at onset and mid stage of disease in cortex. However, in the spinal cord (Figure 3(c)), the total amounts of GABA (p = 0.003) and aspartate (p < 0.035) were significantly reduced in hSOD1G93A mice by 13% and 11%, respectively, at onset of disease, while other metabolites such as glutamate and glutamine were unchanged at both time points. Similarly, total GABA (p = 0.0003) and aspartate (p = 0.034,) levels in hSOD1G93A mice spinal cord were reduced at mid stage by 18% and 9% (Figure 3(c)).
Alterations in total and 13C-labelled amounts of glutamate, glutamine, GABA and aspartate derived from [1-13C]glucose in the cerebral cortex and spinal cord extracts indicate reduced entry of [3-13C]pyruvate into the TCA cycle of hSOD1G93A mice at symptomatic stages of disease. Total and 13C-labelled metabolite concentrations from [1-13C]glucose derived from the first turn of the TCA cycle in extracts of (a, b) cortex and (c, d) spinal cord. Total amounts were obtained using HPLC. Data represent mean ± SEM and were analyzed using two-way ANOVAs followed by Fisher's LSD test where *p < 0.05, **p < 0.01, ***p < 0.001 indicate statistically significant difference between hSOD1G93A (white bars) and wild type (black bars) mice.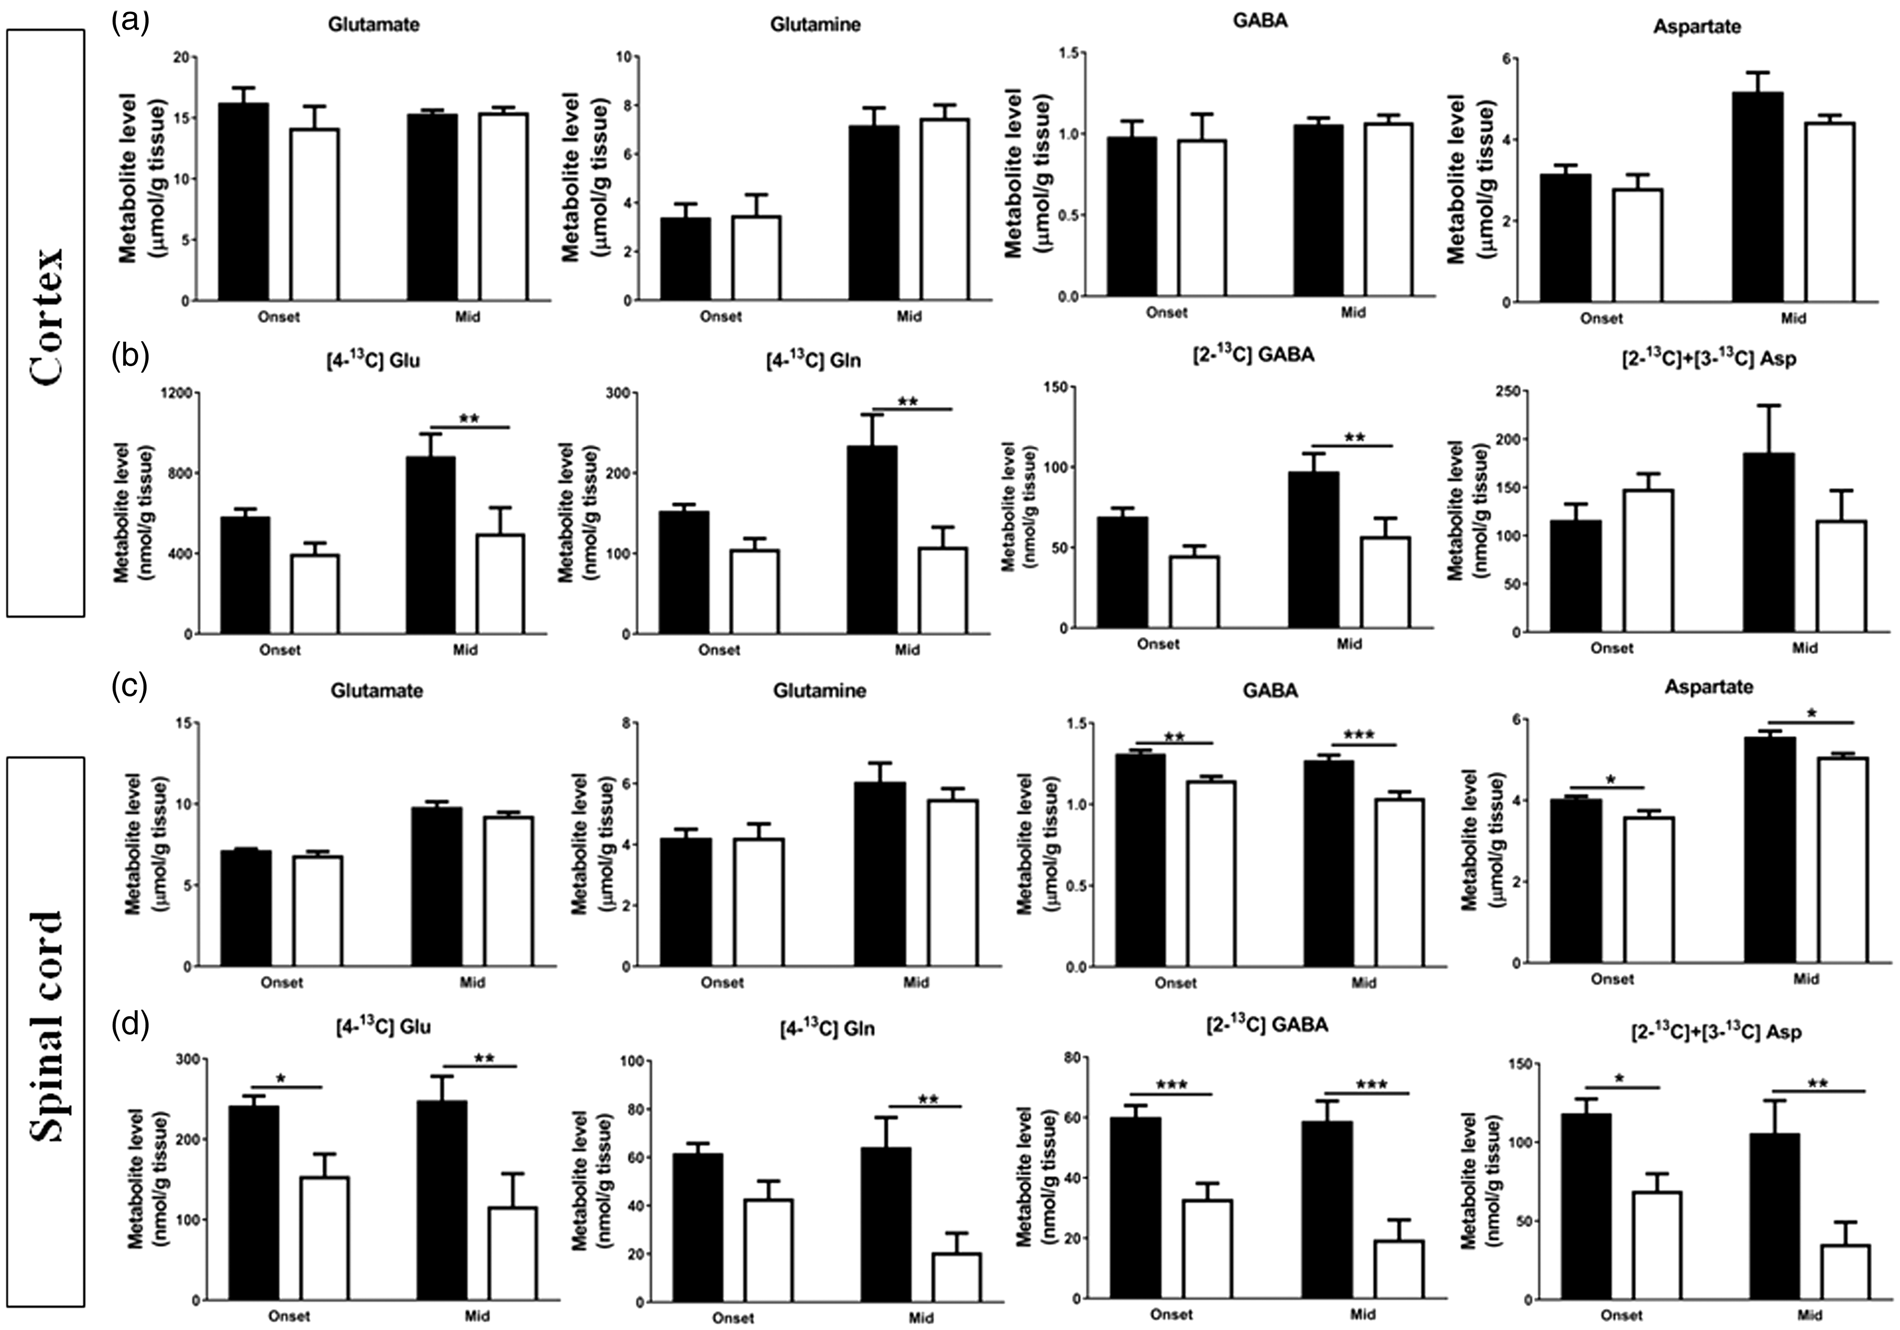
In cortex (Figure 3(b)), no differences were seen in the levels of the first turn TCA cycle metabolites derived from [1-13C]glucose, such as [4-13C]glutamate (p = 0.16), [4-13C]glutamine (p = 0.20), [2-13C]GABA (p = 0.08), and [2-13C] + [3-13C]aspartate (p = 0.14) at onset of disease. However, at mid stage of disease, the amounts of 4-13C]glutamate were decreased by 44% (p = 0.008), [4-13C]glutamine) by 54% (p = 0.002) and [2-13C]GABA by 42% (p = 0.006) in hSOD1G93A mice cortex (Figure 3(b)). There were no changes in neuron to astrocyte transfer of glutamate, calculated as the ratio of [4-13C]glutamine over % enrichment of [4-13C]glutamate, and astrocyte transfer of glutamine to neurons, calculated as [4,5-13C]glutamate over % enrichment of [4,5-13C]glutamine in cortex at both time points (Supplementary Figure 2(a) and (c)).
In the spinal cord of hSOD1G93A mice (Figure 3(d)), the levels of the first turn TCA cycle metabolites derived from [1-13C]glucose, namely [4-13C]glutamate (p = 0.023), [2-13C]GABA) (p = 0.0009) and [2-13C] +[3-13C]aspartate (p = 0.013) were reduced by 37, 46 and 42%, respectively, at onset of disease. Also, there was a trend towards a reduction in levels of [4-13C] glutamine (p = 0.09, Figure 3(d)). Moreover, the reduction was further pronounced at mid stage evidenced by the diminished levels of [4-13C]glutamate) by 53% (p = 0.004), [4-13C]glutamine by 69% (p = 0.013), 2-13C]GABA by 67% (p = 0.0001) and [2-13C] +[3-13C]aspartate by 67% (p = 0.0026, Figure 3(d)). The neuron to astrocyte transfer of glutamate was significantly reduced in the spinal cord at mid stage by 70% (p < 0.0001, Supplementary Figure 2(b)). However, there was no change in astrocyte transfer of glutamine to neurons, in the spinal cord at both time points (Supplementary Figure 2(d)).
TCA cycle: [1,2-13C]acetate-derived metabolites
Levels of metabolites of 13C-acetate were unchanged in both cortex and spinal cord at both onset and mid stage of the disease as evidenced by unaltered incorporation of 13C in [4,5-13C]glutamate and [4,5-13C]glutamine and [1,2-13C]GABA derived from [1,2-13C]acetate (Figure 4(a) and (b)). However, in the spinal cord, there was a trend towards reduction in the labelling (p = 0.058) of [1,2-13C]GABA at mid stage of disease.
Unaltered levels of 13C-labelled metabolites derived from [1,2-13C]acetate in the cerebral cortex and spinal cord extracts signify unchanged astrocytic acetate metabolism in hSOD1G93A mice. The amounts of 13C labelled metabolites from [1,2-13C]acetate derived from the first turn of the TCA cycle are given in (a) cortex and (b) spinal cord. Data represent mean ± SEM and were analyzed using two-way ANOVA followed by Fisher's LSD test where *p < 0.05, **p < 0.01, **p < 0.00001 indicate statistically significant difference between hSOD1G93A (white bars) and wild type (black bars) mice.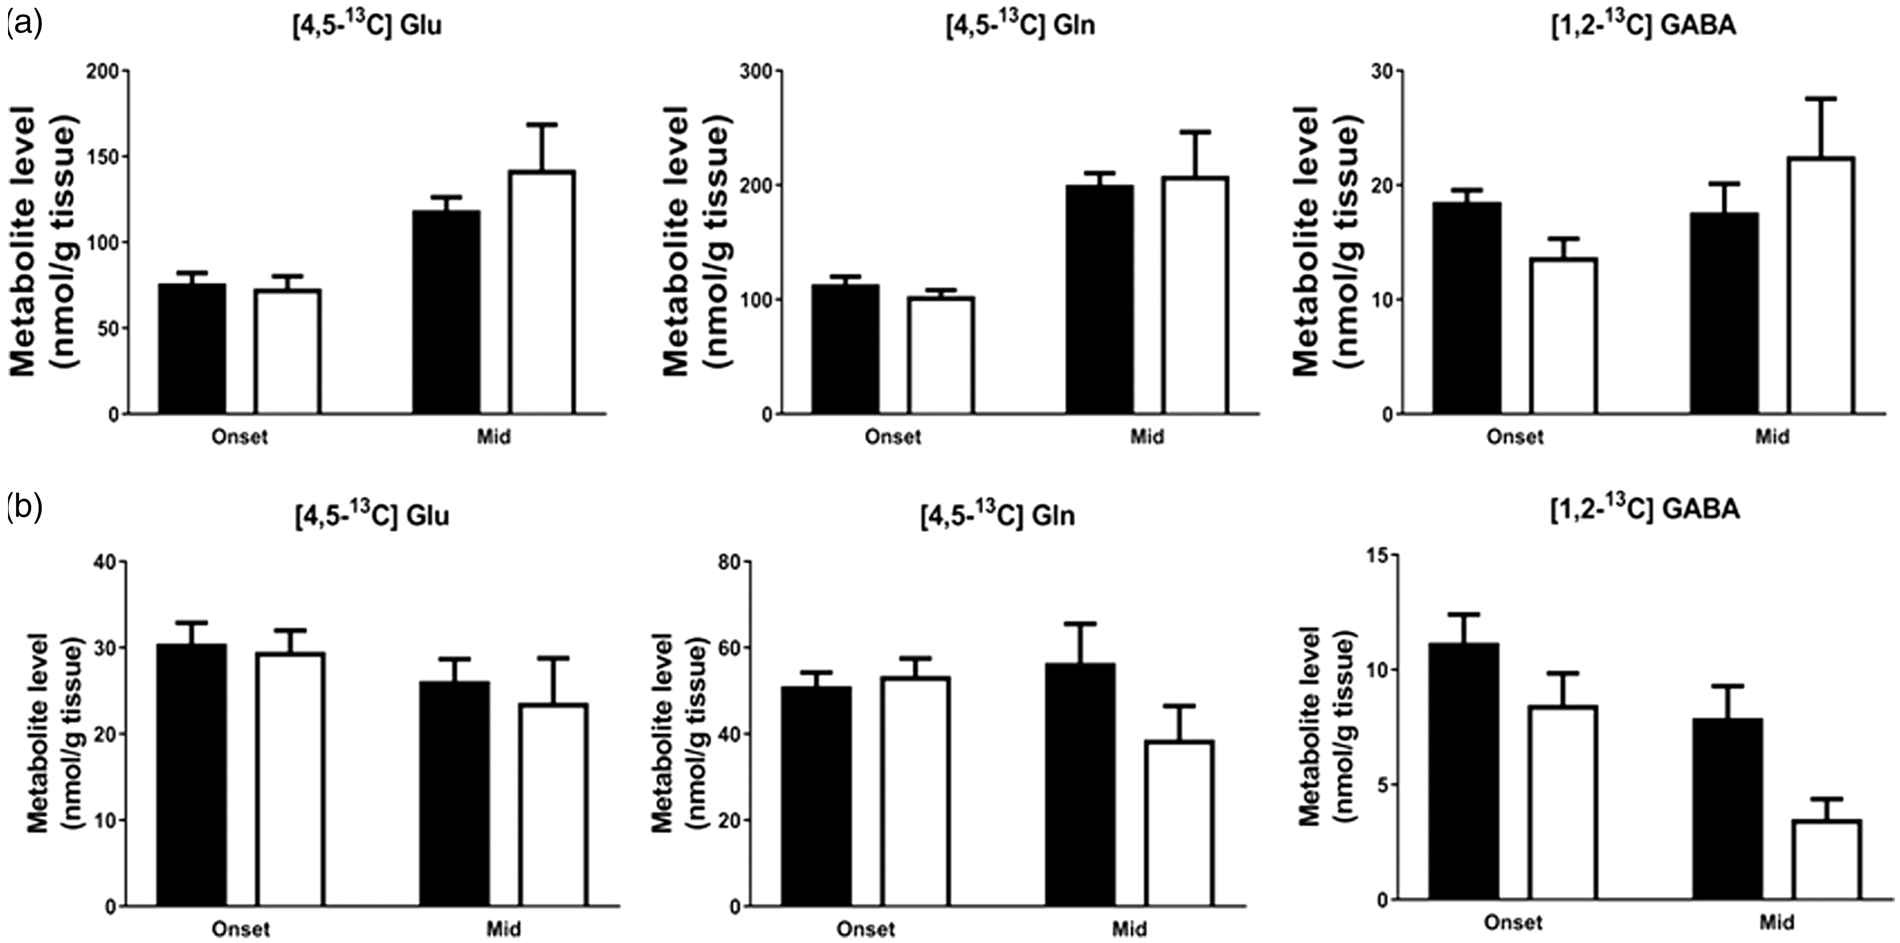
Branched chain amino acids and other amino acids
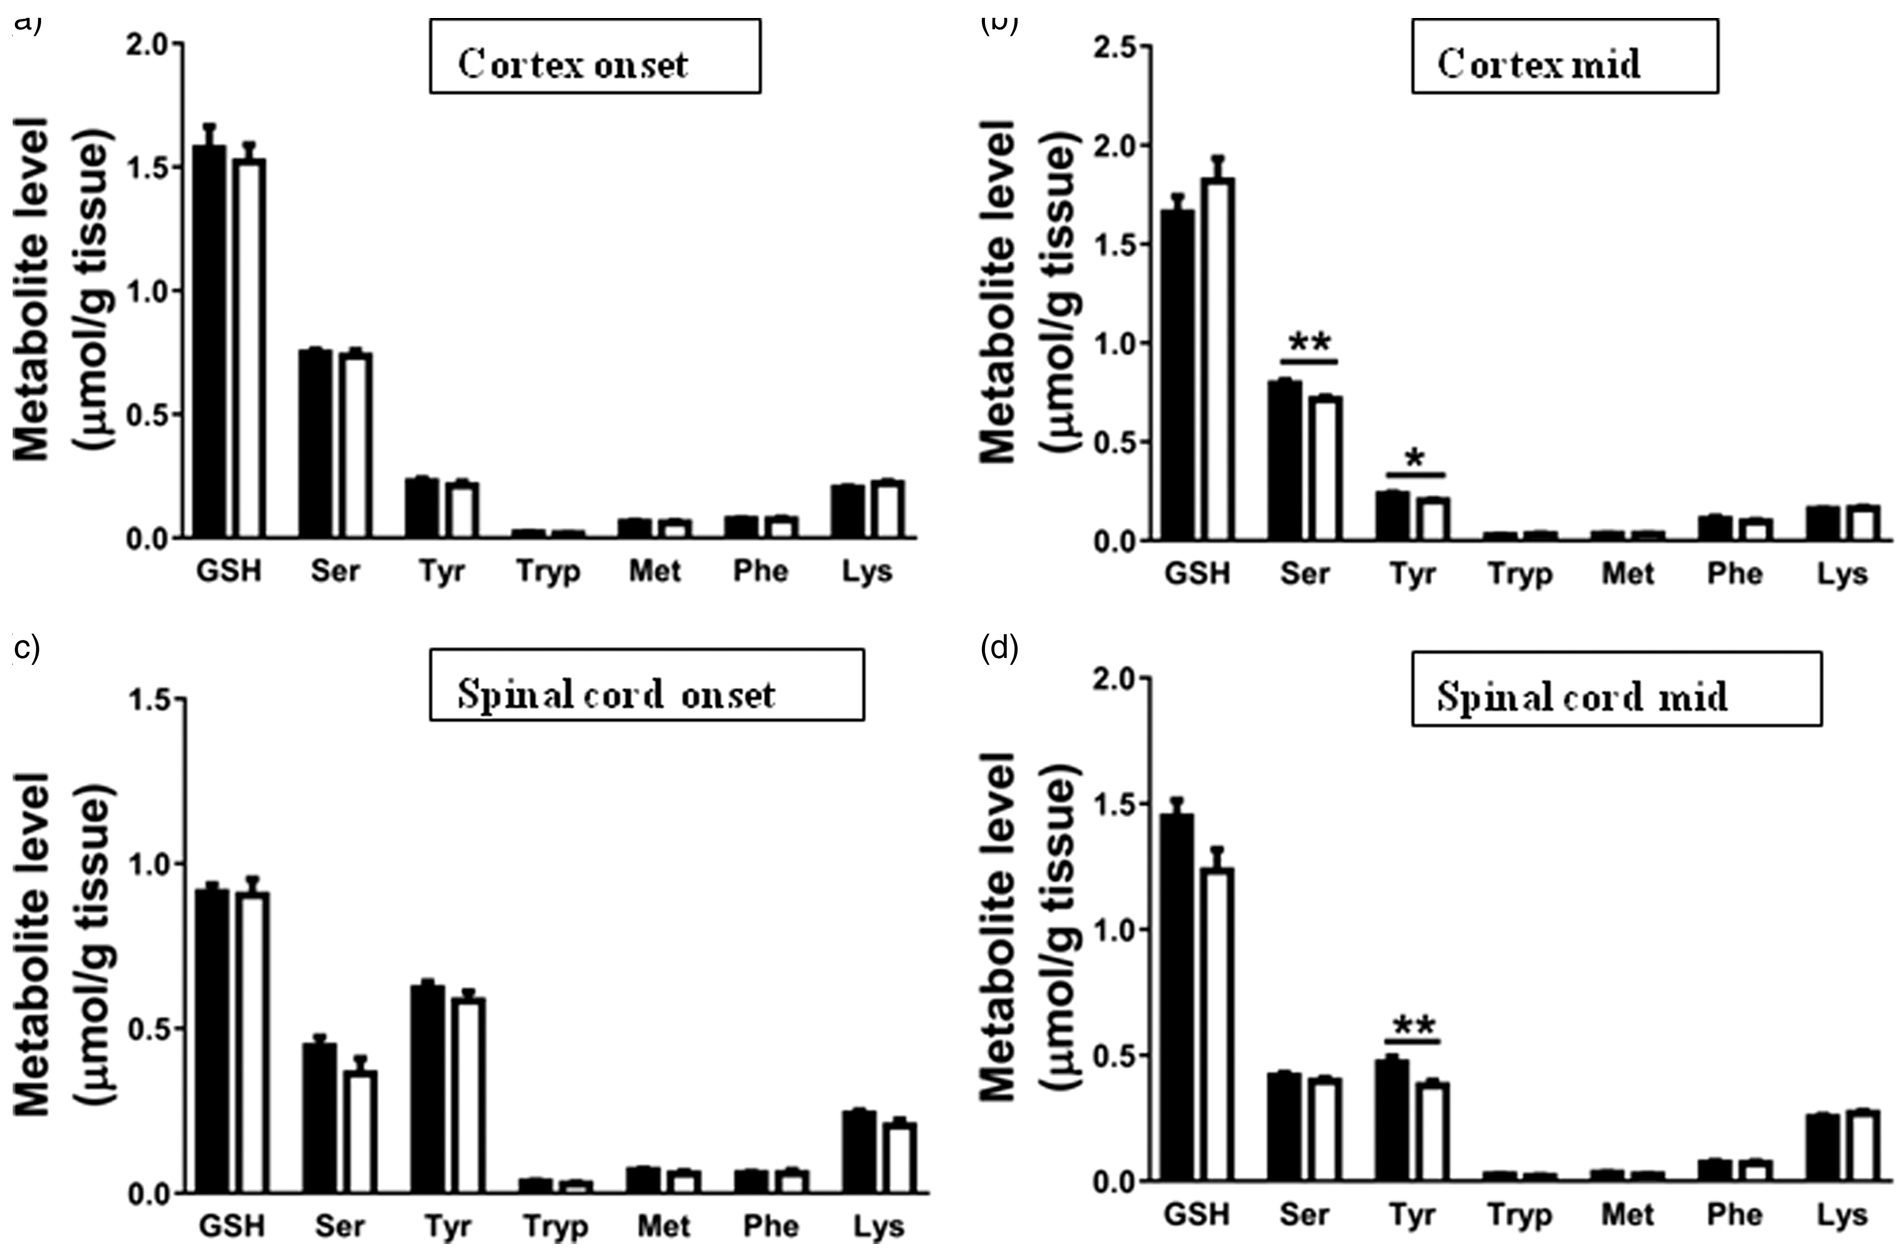
In the cortex of hSOD1G93A mice, the concentrations of the branched chain amino acids (BCAAs) isoleucine (p = 0.019) and leucine (p = 0.035) were significantly reduced by 14 and 18% at onset compared to wild type mice, and isoleucine (p = 0.048) and leucine (p = 0.039) by 12 and 19% at mid stage, while valine was unchanged (Figure 5(a)). Similarly, in the spinal cord, the concentrations of valine (p = 0.013), isoleucine (p < 0.0001) and leucine (p = 0.036) were significantly decreased by 11 to 32% in hSOD1G93A mice compared to wild type mice at onset, as well as isoleucine (p = 0.026) and leucine (p = 0.037) by 25 and 17% at mid stages of the disease (Figure 5(b)). The levels of other amino acids including glutathione, serine, tyrosine, tryptophan, methionine, phenyl alanine and lysine were not altered in both cortex and spinal cord at onset of disease (Figure 6(a) and (c)). However at mid stage, levels of tyrosine were reduced in both cortex by 13% (p = 0.014) and the spinal cord by 19% (p = 0.008, Figure 6(b) and (d)), while those of serine (p = 0.002) were lowered by 10% only in cortex (unpaired t test, Figure 6(a) and (b)).
Changes in total concentrations of branched chain amino acids in brain and spinal cord extracts of hSOD1G93A and mice indicate a compensatory breakdown to refill TCA cycle intermediate levels. Total amounts of branched chain amino acids, valine, isoleucine and leucine, in (a) cortex and (b) spinal cord were obtained using HPLC. Data represent mean ± SEM and were analyzed using two-way ANOVA followed by Fisher's LSD test where *p < 0.05, **p < 0.01, **p < 0.00001 indicate statistically significant difference between hSOD1G93A (white bars) and wild type (black bars) mice. Total concentrations of amino acids in brain and spinal cord extracts suggest little abnormal amino acid metabolism in hSOD1G93A mice at symptomatic stages of disease. Total amounts of glutathione (GSH), serine (Ser), tyrosine (Tyr), tryptophan (Trp), methionine (Met), phenylalanine (Phe) and lysine (Lys) in extracts of (a, b) cortex and (c, d) spinal cord. Total amounts of metabolites were obtained using HPLC. Data represent mean ± SEM and were analyzed using unpaired t tests where *p < 0.05, **p < 0.01 indicate statistically significant difference between hSOD1G93A (white bars) and wild type (black bars) mice.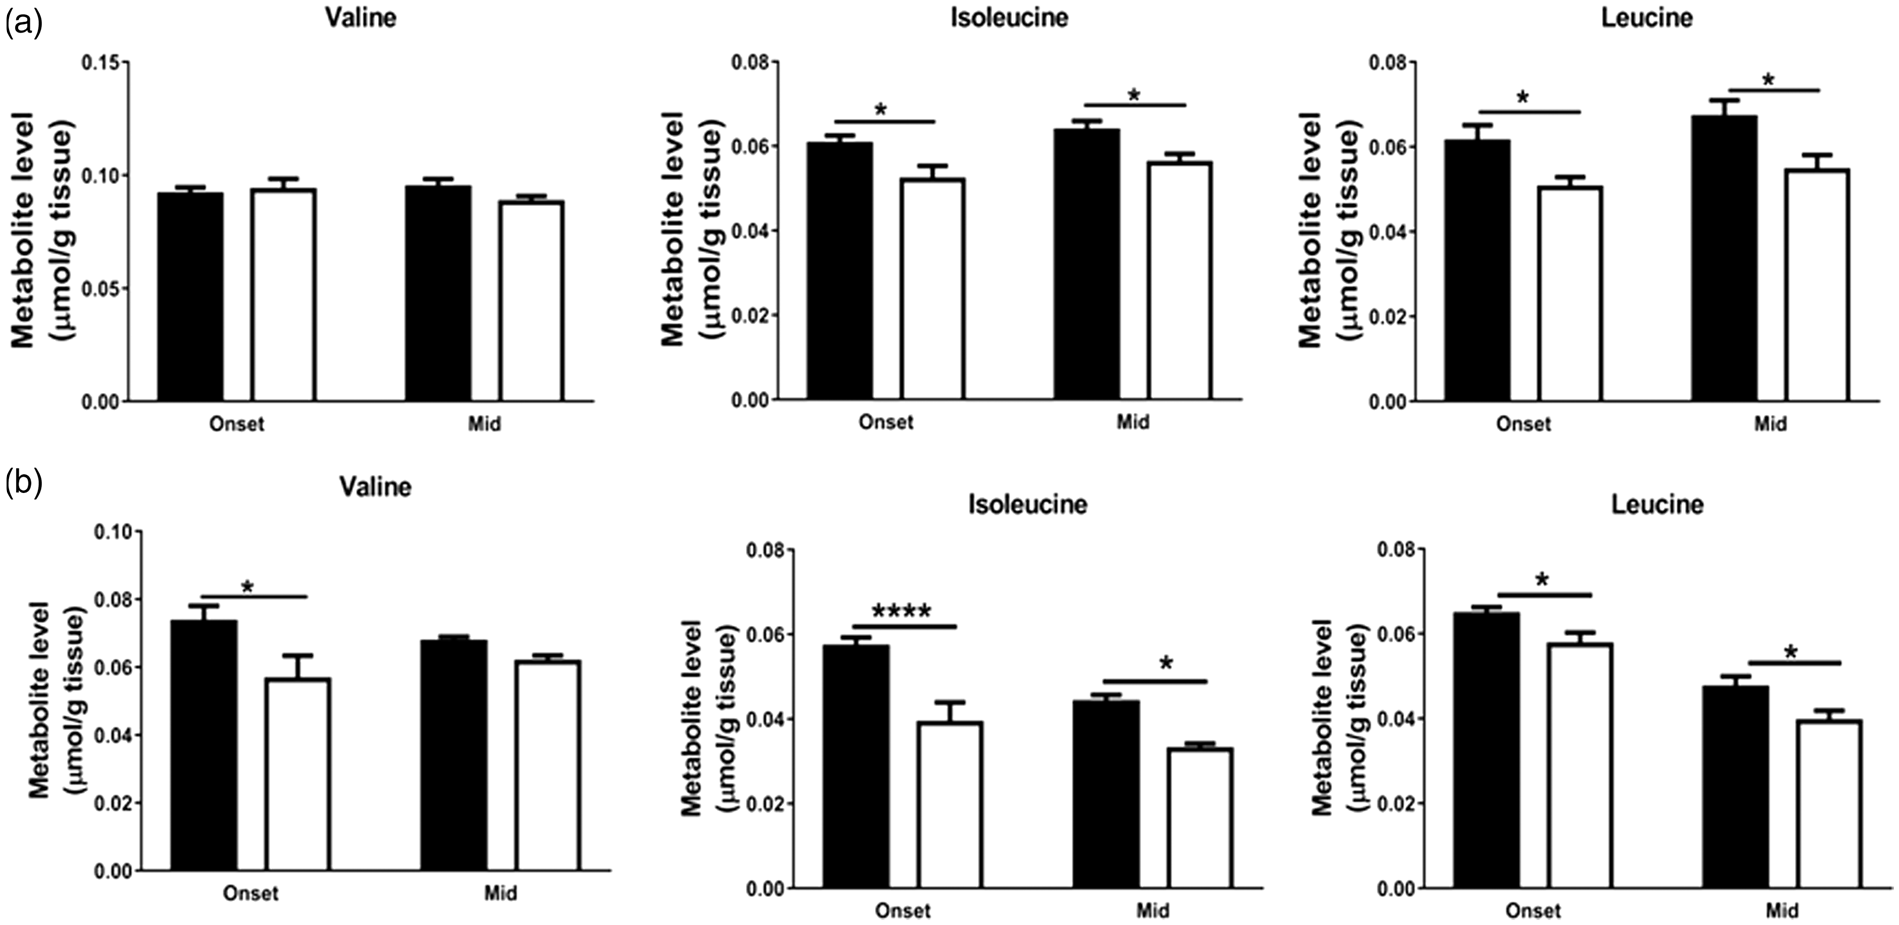
Energy-related metabolites
The levels of metabolites such as myoinositol (p = 0.025, unpaired t test) and succinate (p = 0.037, unpaired t test) were decreased at onset of disease, while creatine (p = 0.019, unpaired t test) levels were reduced at mid stage in hSOD1G93A mice cortex compared to wild type mice (Supplementary Table 1a). No changes were observed in total amounts of N-acetyl-aspartate (NAA), taurine, formate, fumarate in cortex at both stages of the disease (Supplementary Table 1a). We found reductions in the amounts of NAA by 13% (p = 0.011, unpaired t test) and creatine by 13% (p = 0.025, unpaired t test) in hSOD1G93A mice spinal cord compared to control mice at onset of disease, while other total metabolite levels including those of myoinositol, taurine and formate were unchanged. NAA concentrations were also reduced by 14% (p = 0.028, unpaired t test) at mid stage in the spinal cord of hSOD1G93A mice (Supplementary Table 1b).
Pyruvate carboxylation
Pyruvate carboxylation as assessed during the first turn of the TCA cycle by the amounts of [2-13C]glutamate and [2-13C]glutamine was unchanged in cortex at onset (Figure 7(a)). However, significant reductions were observed in [4-13C]GABA by 44% (p = 0.019) at onset, and at mid stage in [2-13C]glutamine by 46% (p = 0.012) and [4-13C]GABA by 34% (p = 0.017, Figure 7(a)). In the spinal cord (Figure 7(b)), the levels of [2-13C]glutamate (p = 0.002) and [4-13C]GABA (p = 0.019) were significantly reduced at onset by 42 and 47%. Similarly, at mid stage, significant reductions were found in [2-13C]glutamate by 56% (p = 0.016), [2-13C] glutamine by 59% (p = 0.0223) and [4-13C]GABA by 51% (p = 0.018) in the spinal cord (Figure 7(b)).
Concentration changes of 13C-labelled metabolites derived from [1-13C]glucose via pyruvate carboxylase from the first turn of the TCA cycle in extracts of cortex and spinal cord from hSOD1G93A (white bars) and wild type (black bars) mice suggest reduced pyruvate carboxylation in hSOD1G93A mice. 13C-Labelled metabolites derived from [1-13C]glucose are given in (a) cortex and (b) spinal cord. Data represent mean ± SEM and were analyzed using two-way ANOVAs followed by Fisher's LSD test where *p < 0.05, **p < 0.01 indicate statistically significant difference between hSOD1G93A and wild type mice.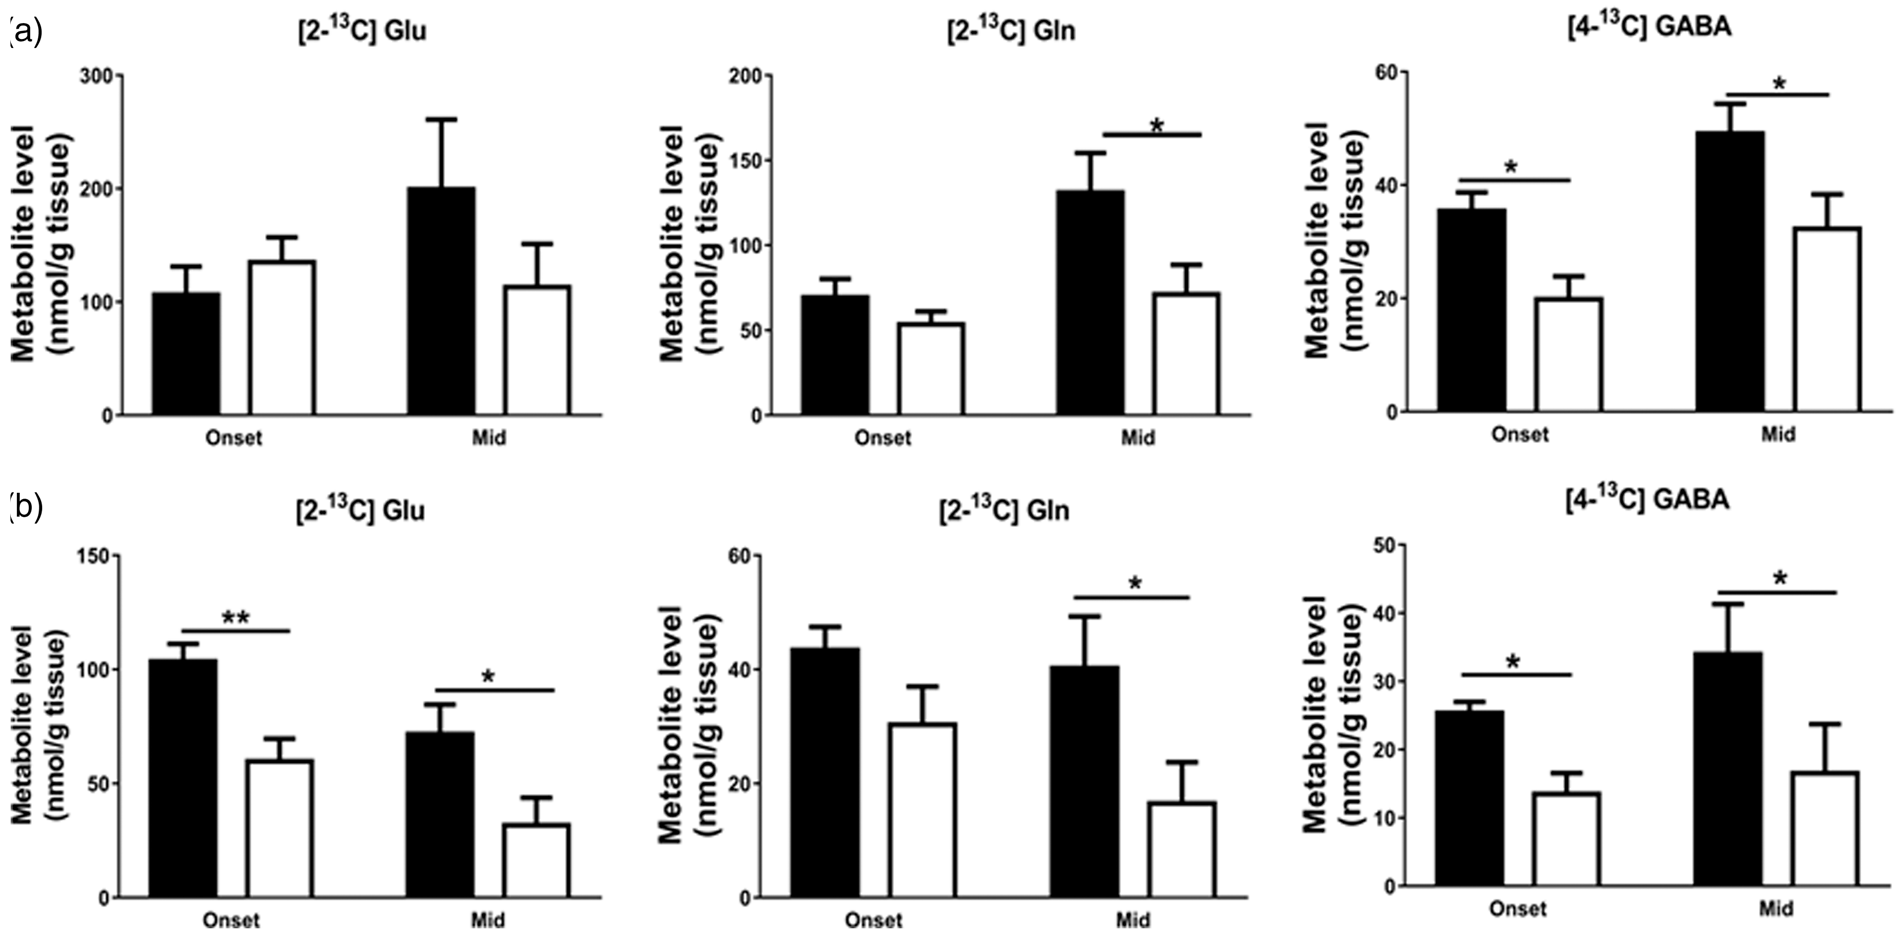
Discussion
In this study, we quantified the levels of metabolites of injected [1-13C]glucose and [1,2-13C acetate] in the CNS of wild type and hSOD1G93A mice at onset and mid stages of the disease using HPLC, 1H and 13C NMR spectroscopy. Our main findings are as follows. (1) Glycolysis is reduced in the symptomatic stages of the disease in cortex and spinal cord in the hSOD1G93A mouse model of ALS. This is based on the finding of reduced levels of 13C-glucose-derived cytosolic metabolites and first turn TCA cycle metabolites primarily at mid stage in cortex and at both time points in the spinal cord. (2) No significant differences were observed in astrocytic acetate metabolism suggesting normal TCA cycle function in astrocytes. However, neuronal transfer of glutamate to astrocytes was reduced in spinal cord at mid stage of disease. The reductions found in the13C-derived metabolite levels produced from pyruvate carboxylation may be due to reduced glycolysis in astrocytes and/or pyruvate carboxylase activity. (3) The amounts of spinal cord total and 13C-labeled GABA were lowered indicating that the reduction in glycolysis may contribute to the loss of this important neurotransmitter. (4) The decreases measured in branched chain amino acids and tyrosine amounts signify an increased energy need in CNS tissues and their compensatory breakdown to replenish shortage of TCA cycle metabolites. (5) NAA levels were slightly reduced in the spinal cord, which is most likely a reflection of neuronal metabolic dysfunction, but also motor neuron death. Taken together, alternative fuels to glucose seem to be warranted to overcome these impairments in energy metabolism.
Limitations
In this study, we used the hSOD1G93A mouse model, a commonly used model of ALS that exhibits progressive motor neuron loss, denervation of muscle and eventually paralysis, similar to patients with ALS. Mutations in the hSOD1 gene are found in 20% of familial and 1–2% cases of sporadic ALS. Also, some features found in this model appear to be only specific to the overexpression of the hSOD1G93A mutation. 30 It is therefore important to examine these results in other models of ALS.
Quantification of metabolite levels only provides a snapshot of metabolism and interpretation can be difficult. Please note that in the spinal cord tissue, post mortem metabolism occurred due to ischemia, which explains the high lactate levels. Also, the spinal cord glucose levels were very low and are therefore not shown. Stress during i.p. injection and microwave fixation may contribute to high lactate levels. Also, it is possible that different stress levels occurred in the older mice. The progression of symptoms may affect stress levels in hSOD1G93A mice and also the wild type mice, which were co-housed in the same cages. Also, the mid stage mice were collected during a different season and time in the animal house, which may alter stress levels. As these confounding factors make it difficult to compare the metabolism between two different time points, we refrained from those comparisons.
NAA and cell loss
We found small reductions in the levels of NAA in the hSOD1G93A mice spinal cord at both time points, but no significant differences in cortex. Our result is in agreement with studies where reductions in NAA levels in spinal cord of hSOD1G93A mice and patients with ALS were shown.31,32 NAA is predominantly found in neurons but not in glial cells and is considered a marker for neuronal viability and cellular function. 33 The levels of NAA diminish during both neuronal loss and/or metabolic dysfunction, with cellular dysfunction causing more depletion of NAA than neuronal loss. 34 In addition, several other studies demonstrated lack of correlation between NAA depletion and neuronal death suggesting that depletion of NAA is mostly reflective of mitochondrial dysfunction.35,36 At onset, there is 30% of motor neuron loss in the lumbar spinal cord, while at mid to end stage, the loss increases up to 65%. 22 The fact that at both disease stages there was only 13% and 14% reduction in NAA levels agrees with the earlier studies showing that neuronal cell loss has little effects on NAA. Most of the other metabolite levels quantified here showed more pronounced decreases than NAA amounts indicating that neuronal loss cannot fully explain the changes observed. Neuronal loss in cortex is minor and therefore it is unlikely to be responsible for the reduction in metabolite levels. Overall, our results indicate neuronal metabolic dysfunction; however, the contribution of neuronal loss to changes in spinal cord metabolite levels cannot be ruled out.
Glycolysis is disturbed in the cortex and spinal cord of the hSOD1G93A mice
The total amounts as well as 13C labelling of the glycolysis-derived metabolites lactate and alanine in cortex, and total and 13C labelling of lactate in the spinal cord were decreased in both onset and mid stages of the disease indicating reduced glucose metabolism through the glycolytic pathway. The amounts and labelling of alanine were only changed in cortex may be due to higher activities of alanine aminotransferase enzymes in cortex than in the spinal cord, 37 which again is an indicator for reduced pyruvate production via glycolysis. A reduction of glucose transport or utilization could result in decreases in lactate and alanine levels. Many studies have shown reduced glucose utilization and impairments in blood–brain or blood–spinal cord barrier in several brain areas and/or the spinal cord.13,14,16,38,39 However, in our study, no differences were seen in % 13C enrichment of [1-13C]glucosein cortex indicating unchanged glucose transport. On the other hand, increased glycogen formation has been reported, which would also reduce glycolysis and at least in part can explain our results. 40 The reduction in total levels of lactate in both areas of the CNS and alanine in the cortex could also be explained by increased entry of pyruvate into the TCA cycle. However, this is unlikely as we also found reduced 13C-labelled first turn TCA cycle metabolites in these tissues at mid stage of disease.
These findings are in agreement with other studies that showed alterations in metabolite levels and abnormalities in enzymes involved in the energy producing pathways. In motor cortex of patients with ALS, the expression of 6-phosphofructo-2-kinase was reduced. 41 6-phosphofructo-2-kinase regulates glycolytic flux by controlling the levels of fructose 2,6-bisphosphate which in turn regulates phosphofructokinase 1. In addition, decreased expression of the glycolytic enzyme phosphoglycerate kinase (pgk1) was found in astrocytes from hSOD1G93A mice spinal cord. 5 On the other hand, in vitro studies in NSC-34 cells showed an increase in glycolytic enzyme activities such as hexokinase and pyruvate kinase. 42 Similarly increased glycolytic flux was reported in SOD1 ALS fibroblasts. 43 This may be due to a compensatory increase in the early stage of the disease to provide more energy to energy deficient cells. Overall, our study is in line with studies that show impaired glucose metabolism in the brain and spinal cord of hSOD1G93A mice at symptomatic stages of disease.
Reduced neuronal glucose metabolism via the TCA cycle
In cortex, the total amounts of glutamate, glutamine, GABA and aspartate were unchanged at both disease stages, while in the spinal cord, total amounts of GABA and aspartate were reduced at both onset and mid stage. Significant losses were also found in the amounts of the first turn TCA cycle metabolites from [1-13C]glucose, including [4-13C]glutamate, [4-13C]glutamine, and [2-13C]GABA in cortex at mid stage, and [4-13C]glutamate, [4-13C]glutamine, [2-13C]GABA and [2-13C] + [3-13C]aspartate at both symptomatic stages in the spinal cord of the hSOD1G93A mice. Thus, in the spinal cord, the changes in the first turn TCA cycle metabolites started early and these effects became more pronounced at mid stage. The reduction in levels of these metabolites is most likely indicating reduced entry of 13C-pyruvate into the TCA cycle due to impairments in the glycolytic pathway. However, additional abnormalities in the enzymes and reactions of the TCA cycle pathways or amino acid producing enzymes cannot be ruled out. Studies have demonstrated impairments in the TCA cycle in the hSOD1G93A mouse model and patients with ALS. Metabolomic analysis by 44 in hSOD1G93C astrocyte-neuron co-cultures showed impaired glutamate and TCA cycle metabolism. Likewise, several other studies have shown reductions in the gene expression of enzymes involved in the TCA cycle pathways such as isocitrate dehydrogenase 3 α, 2-oxoglutarate dehydrogenase and cytosolic malate dehydrogenase in hSOD1G93A mice spinal cord and motor cortex of patients with ALS.4,5,45–47 Also, PDH kinase 1 which downregulates PDH activity by phosphorylation was expressed at increased levels in motor neuronal cultures obtained from SOD mice, which is expected to reduce the entry of glucose-derived pyruvate into the TCA cycle. 48 The TCA cycle generates most of cellular ATP and is essential for production of energy and biosynthesis of amino acids and neurotransmitters. Therefore, impairments in the TCA cycle could lead to reduced availability of energy and bioprecursors to brain cells and could contribute to subsequent neuronal death in this disease. Consistent with this, in a study performed in hSOD1G93A mice, improving PDH activity by dichloroacetate (an inhibitor of PDH kinase enzyme) was shown to delay grip strength loss, improved mitochondrial function in spinal cord and survival of hSOD1G93A mice. 49 This suggests that the conversion of pyruvate into acetyl CoA and its entry into the TCA cycle is impaired in this disease. Our previous study also showed that treatment of hSOD1G93A mice at P35 with anaplerotic triheptanoin (35% caloric content), a triglyceride of heptanoate, delayed hind limb grip strength loss and slowed loss of motor neurons in the spinal cord. 45 Heptanoate or derived metabolites can enter into the TCA cycle as acetyl- and succinyl-CoA to provide an alternative fuel source independent from glucose and PDH activity and thereby replenish lost TCA cycle intermediates. Taken together, these studies suggest that metabolic dysfunctions in energy producing pathways that could lead to energy deficiency in cells could be alleviated using metabolic treatment (reviewed in Tefera and Borges 50 and Tefera et al. 51 ).
Alterations in excitatory amino acids levels
Amino acid neurotransmitter metabolism is closely linked with glucose metabolism. This is evidenced by our findings of reductions in the labelled concentrations of [4-13C]glutamate in hSOD1G93A mice cortex at onset and in the spinal cord at both onset and mid stage of disease compared to control mice. In the spinal cord, labelling in [2-13C] + [3-13C]aspartate and total amounts of aspartate were also reduced at mid stage. This is in agreement with studies that indicated abnormal excitatory amino acid metabolism in CNS of patients with ALS. In patients with ALS, a reduction in levels of aspartate in the spinal cord and glutamate in CNS regions such as cerebellar cortex, frontal cortex and the spinal cord was found.31,52 In addition, Rothstein et al.11,12 found downregulation astrocytic glutamate transporters that lead to a reduction in glutamate uptake and an increase in glutamate concentration in the synapse and subsequent excitotoxicity.
GABA level changes and excitotoxicity
We found reduced amounts of GABA and [2-13C]GABA in hSOD1G93A mice spinal cord at symptomatic stages of the disease, indicating that metabolism of glucose into GABA in spinal GABAergic neurons is impaired, which may contribute to excitotoxicity in these mice. This is in agreement with a study by Niessen et al. 32 where decreases in GABA levels were found in hSOD1G93A mice spinal cord at 75 days. Hyperexcitability has been shown in spinal motor neurons and in acute slice preparations from hSOD1G93A mice before onset of disease.53,54 Likewise, in cortex, although total amounts did not change, reductions in labelling of [2-13C]GABA at mid stage indicate abnormal GABA metabolism in hSOD1G93A mice. In patients with ALS, downregulation of GABAA receptor expression 55 and reduced GABA levels were found in motor cortex.56,57 Also, Zhang et al. 58 showed lowered GABAergic transmission, subsequent hyperexcitability and excitotoxicity in motor cortex of TDP43 mice. Similarly, in a wobbler mouse model of ALS, reduced GABA-mediated inhibition as a result of loss of GABAergic interneurons was found in motor cortex. 59 No significant benefit with gabapentin, which was originally thought to increase GABA levels, but later shown to interact with calcium channel auxiliary subunits, was found. 60 In light of this, increasing GABA amounts appears to be a worthwhile strategy to slow disease progression in patients with ALS.
Acetate metabolism is unaltered in cortex and spinal cord
Concentrations of 13C-acetate-derived metabolites were unchanged in cortex and spinal cord at both onset and mid stage of disease as evidenced by unaltered incorporation of 13C in [4,5-13C]glutamate and [4,5-13C]glutamine from [1,2-13C]acetate. Acetate is preferentially taken up by astrocytes via monocarboxylate transporters, and therefore it largely indicates astrocytic metabolism.20,61 In glutamatergic synapses, astrocytes normally take up glutamate from the synapse and convert it to glutamine via glutamine synthetase. 62 In this work, we found lower amounts of [4-13C]glutamine in both cortex and the spinal cord at mid stage of disease. In addition, the neuron-astrocyte glutamate transfer ratio was reduced in hSOD1G93A mice spinal cord at mid stage indicating reduced shuttling of glutamate to astrocytes. This is in agreement with studies in patients with ALS, which have shown decreased expression of the astrocytic glutamate transporters in cortex and spinal cord.11,12,63 Furthermore, a recent study in hSOD1G93A co-cultures of astrocyte-neurons showed compromised glutamate-glutamine cycle. 64 On the other hand, astrocytic TCA cycling appears to be normal in our study. This indicates that astrogliosis found in ALS brain and spinal cord65,66 appears not to alter the astrocytic TCA cycle.
Pyruvate carboxylation
The amounts of [2-13C]glutamate, [2-13C]glutamine and [4-13C]GABA were decreased in cortex and spinal cord mostly at mid stage of disease. These metabolites are derived from [1-13C]glucose via the pyruvate carboxylase (PC) pathway. However, the metabolites [2-13C]glutamate, [2-13C]glutamine, and [4-13C]GABA can also be produced via PDH in the second turn of the TCA cycle. Therefore, the reduction of labelling in [2-13C]glutamate, [2-13C]glutamine and[4-13C]GABA is likely a result of reduced PC activity as well as reduced TCA cycling. PC is an anaplerotic enzyme found in astrocytes (but not in neurons) that converts pyruvate into oxaloacetate 67 and replenishes lost TCA cycle intermediates used in the synthesis of neurotransmitters. Decreased PC activity would decrease the levels of oxaloacetate and could contribute to the diminished first turn TCA cycle metabolite levels found.
Reduced levels of BCAAs
The BCAAs are normally metabolized into branched chain α-ketoacids by branched chain aminotransferase enzymes and further metabolized into Co-enzyme A derivatives that can enter into the TCA cycle. 68 We found lowered levels of these amino acids in cortex and spinal cord of hSOD1G93A mice. These reductions might be due to breakdown of BCAAs to compensate the critical need for more energy in brain and spinal cord during ALS. This has also been suggested for other neurologic diseases with metabolic dysfunctions such as Huntington's disease. 69 Similarly, a recent study in SOD1G93A astrocyte-neuron co-cultures increased uptake of BCAAs were found in astrocytes. 64 In addition, BCAAS are thought to be a source of amino groups for the synthesis of glutamate. 70 As we also found reduced labelling in glutamate, glutamine and GABA levels, BCAAs might be broken down to aid in the synthesis of these neuroactive amino acids. On the other hand, alterations in blood levels of BCAAs or their uptake could also contribute to these changes. However, no changes in plasma levels of BCAAs were found in patients with ALS.71,72
Reduced levels of tyrosine
The levels of tyrosine were reduced at mid stage of disease in both cortex and the spinal cord. Tyrosine is a non–essential amino acid that can be synthesized in the liver from phenylalanine. It can be transported into the brain and is used in the synthesis of monoamine neurotransmitters. When there is an increased energy need, it can be converted into fumarate and enter the TCA cycle. 26 Thus, the reduction in tyrosine levels could be due to a compensatory breakdown to replenish loss of TCA cycle intermediates.
Alterations in creatine levels
We found slightly diminished levels of creatine in cortex at mid stage and spinal cord at onset of hSOD1G93A mice. This is similar to another study showing reductions in levels of creatine in hSOD1G93A mouse brain and spinal cord at symptomatic stages of disease. 8 Adequate amounts of creatine and creatine phosphate are required to prevent energy depletion. In light of this, creatine has been investigated in the treatment of patients with ALS but without beneficial outcomes. 73
Conclusion
In conclusion, cortical and spinal glucose metabolism is compromised in glutamatergic and GABAergic neurons, while astrocytic TCA cycling appears to be normal in the hSOD1G93A mouse model of ALS at symptomatic stages of disease. Increasing GABA levels could be used as a strategy to slow disease progression in ALS. These results justify additional research into alternative fuels to glucose to delay progression of ALS.
Supplemental Material
Supplementary Figure and Table Legends -Supplemental material for Neuronal glucose metabolism is impaired while astrocytic TCA cycling is unaffected at symptomatic stages in the hSOD1G93A mouse model of amyotrophic lateral sclerosis
Supplemental material, Supplementary Figure and Table Legends for Neuronal glucose metabolism is impaired while astrocytic TCA cycling is unaffected at symptomatic stages in the hSOD1G93A mouse model of amyotrophic lateral sclerosis by Tesfaye W Tefera and Karin Borges in Journal of Cerebral Blood Flow & Metabolism
Supplemental Material
Supplementary Table -Supplemental material for Neuronal glucose metabolism is impaired while astrocytic TCA cycling is unaffected at symptomatic stages in the hSOD1G93A mouse model of amyotrophic lateral sclerosis
Supplemental material, Supplementary Table for Neuronal glucose metabolism is impaired while astrocytic TCA cycling is unaffected at symptomatic stages in the hSOD1G93A mouse model of amyotrophic lateral sclerosis by Tesfaye W Tefera and Karin Borges in Journal of Cerebral Blood Flow & Metabolism
Supplemental Material
Supplementary figures -Supplemental material for Neuronal glucose metabolism is impaired while astrocytic TCA cycling is unaffected at symptomatic stages in the hSOD1G93A mouse model of amyotrophic lateral sclerosis
Supplemental material, Supplementary figures for Neuronal glucose metabolism is impaired while astrocytic TCA cycling is unaffected at symptomatic stages in the hSOD1G93A mouse model of amyotrophic lateral sclerosis by Tesfaye W Tefera and Karin Borges in Journal of Cerebral Blood Flow & Metabolism
Footnotes
Funding
The author(s) disclosed receipt of the following financial support for the research, authorship, and/or publication of this article: This work was supported by grants from National Health and Medical Research Council (1044007) and Motor Neurone Disease Research Institute Australia.
Acknowledgements
We thank the National Medical Research Council (1044007) and the Motor Neurone Disease Research Institute Australia for funding provided to KB. We are grateful for the excellent technical assistance of Dr. Peta Harvey from the Institute of Molecular Biosciences NMR facility and Dr. Neville Butcher from School of Biomedical Sciences, and Queensland Brain Institute and Dr. Shuyan Ngo for providing animals. TWT is a recipient of University of Queensland International scholarship.
Declaration of conflicting interests
The author(s) declared no potential conflicts of interest with respect to the research, authorship, and/or publication of this article.
Authors' contributions
Both KB and TWT conceived and designed the study and also analysed and interpreted the data. TWT performed the experiments and drafted the article, which was revised by KB. All authors approved the manuscript.
References
Supplementary Material
Please find the following supplemental material available below.
For Open Access articles published under a Creative Commons License, all supplemental material carries the same license as the article it is associated with.
For non-Open Access articles published, all supplemental material carries a non-exclusive license, and permission requests for re-use of supplemental material or any part of supplemental material shall be sent directly to the copyright owner as specified in the copyright notice associated with the article.