
Abstract
The 13C nuclear magnetic resonance (NMR) studies together with the infusion of 13C-labeled substrates in rats and humans have provided important insight into brain energy metabolism. In the present study, we have extended a three-compartment metabolic model in mouse to investigate glutamatergic and GABAergic tricarboxylic acid (TCA) cycle and neurotransmitter cycle fluxes across different regions of the brain. The 13C turnover of amino acids from [1,6-13C2]glucose was monitored
Keywords
INTRODUCTION
Glutamate (Glu) and gamma-aminobutyric acid (GABA) are the most abundant neurotransmitters in the cerebral cortex and are responsible for the excitatory and inhibitory neurotransmissions in the matured central nervous system. These neurotransmitters are involved in many functions such as motor behavior, cognition, and emotion.1,2 Perturbation in glutamatergic and GABAergic neurotransmission is associated with several neurological and psychiatric disorders.
3
Extensive 13C NMR studies of cerebral metabolism in rat4,5,7–10 and human11–13 brain have given important insights into neurotransmitter energetics.
In the present study, we have extended the three-compartment metabolic model
4
in mice to investigate glutamatergic and GABAergic fluxes in cerebral cortex (Cx), hippocampus (Hip), striatum (Str), thalamus-hypothalamus (THt), and cerebellum (Cb) regions. The 13C turnover of amino acids from [1,6-13C2]glucose was measured
MATERIALS AND METHODS
Animal Preparation
All experiments were conducted in accordance with the protocols approved by Institutional Animal Ethics Committee of CCMB. ARRIVE guidelines were followed in the preparation of the manuscript. Thirty-five male C57BL6 (2 months old) mice were fasted for 12 hours before infusion of 13C-labeled substrates. Mice were anesthetized with urethane (1.5 g/kg, intraperitoneally). Core body temperature of the animal was measured using a rectal probe and maintained at ~ 37°C by placing it supine on a heating pad connected to a temperature-regulated circulating water bath. The tail vein was cannulated for infusion of 13C-labeled glucose or acetate. Animal respiration was monitored throughout the experiment by using the BIOPAC device (Santa Barbara, CA, USA) interfaced to a computer.
Infusion of [1,6-13C2]Glucose and [2-13C]Acetate
A solution of [1,6-13C2]glucose (99 atom%, Cambridge isotope, Andover, MA, USA) was infused in mice through the tail vein for 7, 15, 30, 60, and 90 minutes (
Preparation of Brain Extracts for Nuclear Magnetic Resonance Analysis
The mouse brain was dissected in a cryostat (maintained at − 20°C) to isolate cerebellum, cerebral cortex, hippocampus, striatum, and thalamushypothalamus regions. Metabolites were extracted from frozen tissue as described previously. 17 In brief, the frozen tissue was weighed (Supplementary Table 2S) and powdered with 0.1 N HCl in methanol (1:2 w/v) in a dry ice/ethanol bath. The [2-13C]glycine (100 μl; 2 mmol/L) was added as an internal concentration reference. The tissue powder was thoroughly homogenized with ice-cold ethanol (1:6 w/v; 60% ethanol), and the homogenate was clarified by centrifugation at 20,000 g. The tissue extract was passed through the chelex column, and the pH of the extract was adjusted to 7.0. The extract was lyophilized and dissolved in phosphate-buffered (50 mmol/L, pH = 7.0) deuterium oxide containing sodium 3-trimethylsilyl[2,2,3,3-D4]-propionate (TSP) (0.5 mmol/L) as a chemical shift reference.
The brain extracts obtained from short-time infusion of [2-13C]acetate were passed through an AG 1-X8 anion exchange column to separate Gln and Glu. Gln and neutral molecules were eluted using deionized water, whereas Glu and anionic molecules were eluted using 2 mol/L acetic acid. 17 Both fractions were lyophilized and resuspended in a phosphate-buffered (50 mmol/L, pH = 7) deuterium oxide solution containing 0.5 mmol/L TSP for further 1H-[13C]-NMR analysis.
Nuclear Magnetic Resonance Analysis of Brain Extract and Plasma
All NMR measurements were carried out on a 600-MHz (Bruker Biospin, Rheinstetten, Germany) spectrometer. The 1H-[13C]-NMR spectra of tissue extracts were acquired using a pulse sequence that incorporates adiabatic pulses for 1H and 13C frequencies.16,18 Concentrations of metabolites were determined relative to [2-13C]glycine, added during tissue extraction as an internal concentration reference. The concentration thus obtained represents weighted average of gray matter, white matter, and cerebrospinal fluid in the given brain region. The 13C atom percent enrichment of metabolites at different carbon positions was determined as the ratio of the peak areas in the 1H-[13C]-NMR difference spectrum (2 × 13C only) to the nonedited spectrum (12C + 13C). The percent enrichment of metabolites was corrected for 13C natural abundance by subtraction of 1.1%.
Blood plasma was mixed with deuterium oxide containing 0.5 mmol/L sodium formate and passed through a centrifugal filter (10-kDa cut off) to remove macromolecules. Plasma samples were analyzed using 1H NMR spectroscopy to determine the total concentration and 13C enrichment of glucose and acetate. Water resonance was suppressed by continuous irradiation during the relaxation delay. The concentration of glucose and acetate was determined using formate as reference. The isotopic 13C enrichment of glucose-C1α (5.2 p.p.m.) and acetate-C2 (1.9 p.p.m.) was calculated by dividing the areas of the 13C satellites with the total area (12C + 13C).
Determination of Glutamate Pool in Neurons and Astroglia
Astroglial Glu pool size, which is required for the three-compartment metabolic modeling, is not established across different regions of the mouse brain. The pool size of Glu in astroglia was estimated by using a very short-time infusion of [2-13C]acetate. The measured Glu labeling from [2-13C]acetate is the weighted average of neuronal and astroglial fraction:

where GluC4(

Determination of V cyc/V TCA from [2-13C]Acetate Studies
The ratio of
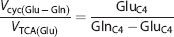
where GluC4 and GlnC4 are the labeling of neuronal [4-13C]glutamate and astroglial [4-13C]glutamine, respectively, from [2-13C]acetate at the steady state. Glutamine and GABA were assumed to be entirely localized in astroglia and GABAergic neurons, respectively, whereas Glu was distributed in glutamatergic neurons, GABAergic neurons, and astroglia in the ratio 82:2:16 in cerebral cortex, as determined using Equation (2) (Table 1). Enrichment of neuronal [4-13C]glutamate was calculated under the assumption that at the steady state 13C enrichment of astroglial Glu is equal to Gln. The 13C Labeling of amino acids from [1-13C]/[6-13C]glucose generated from [2-13C]acetate via gluconeogenesis was corrected by subtracting the [3-13C]lactate enrichment.
Astroglial Glu pool and
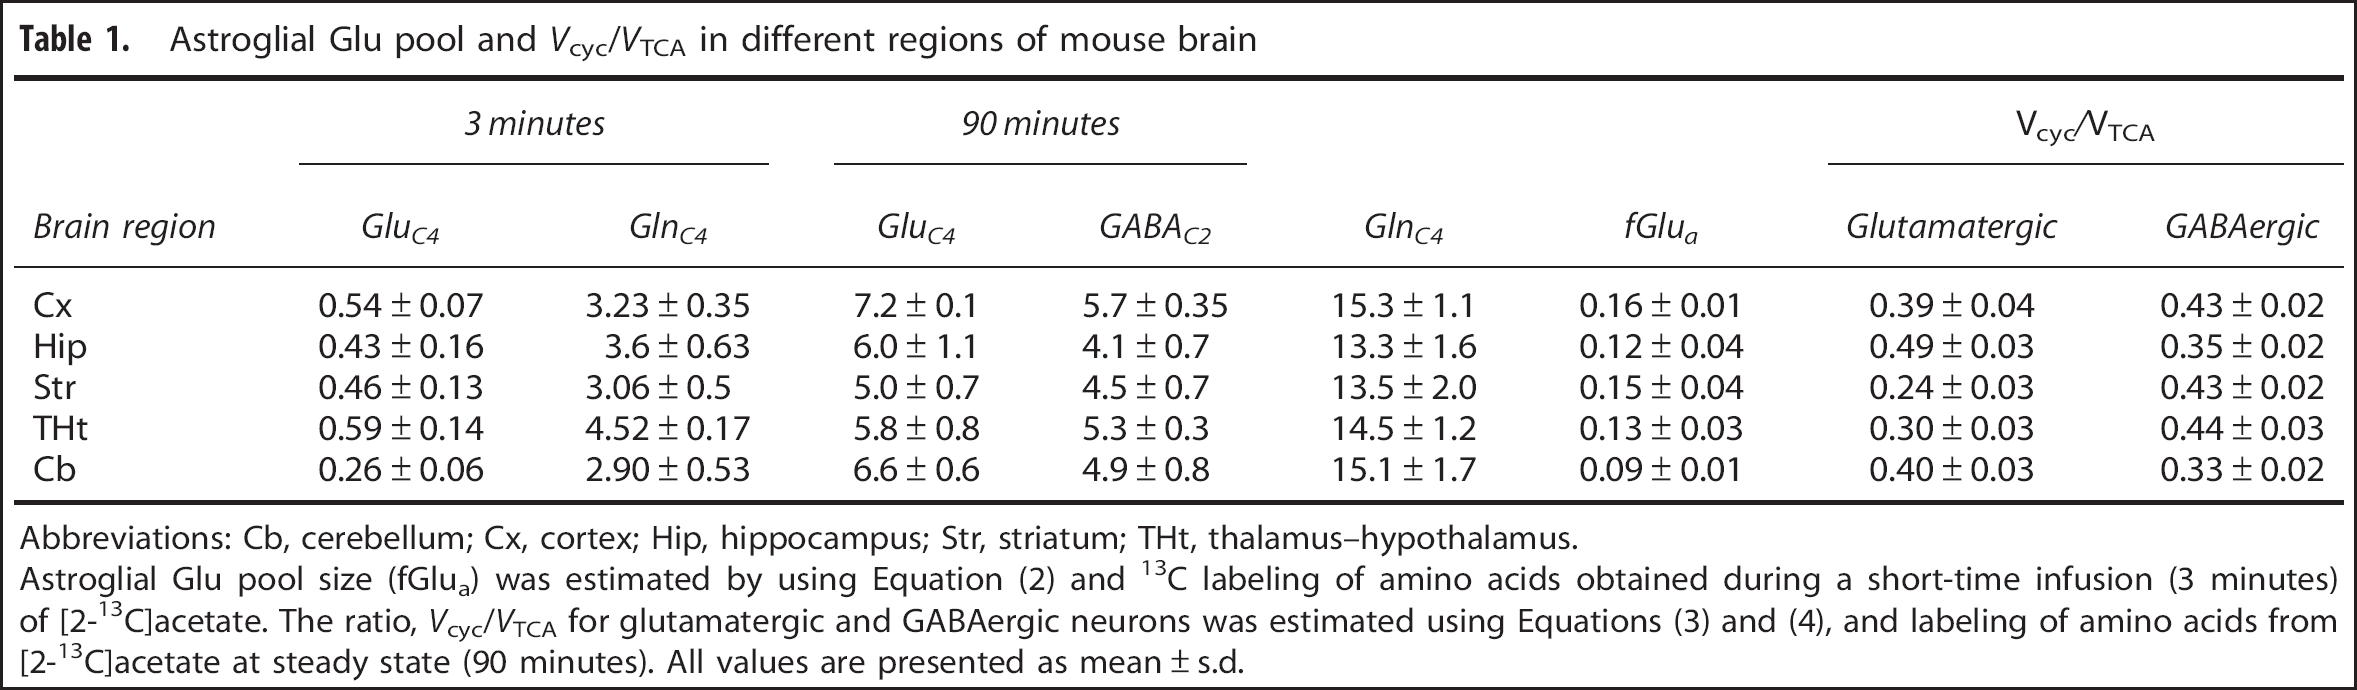
Abbreviations: Cb, cerebellum; Cx, cortex; Hip, hippocampus; Str, striatum; THt, thalamus-hypothalamus.
Astroglial Glu pool size (fGlua) was estimated by using Equation (2) and 13C labeling of amino acids obtained during a short-time infusion (3 minutes) of [2-13C]acetate. The ratio,
Similarly, the ratio of GABA-Gln cycle to GABAergic TCA cycle (
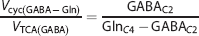
where GABAC2 is the steady-state 13C labeling of [2-13C]GABA from [2-13C]acetate.
Determination of Metabolic Rates
The 13C turnover of amino acids from [1,6-13C2]glucose was constructed using the measured 13C labeling in tissue extract for different infusion times. Metabolic rates were determined by fitting a three-compartment metabolic model (Figure 1; glutamatergic neurons, GABAergic neurons, and astroglia) to the 13C turnover of GluC4, GluC3, GABAC2, GABAC3, GlnC4, and AspC3 from [1,6-13C2]glucose.
4
The metabolic model consists of a series of coupled differential equations reflecting mass balance and 13C isotope flowing from [1,6-13C2]glucose (Supplementary Table 1S) into neuronal and astroglial amino acids using the CWave software package executed in Matlab (Mathworks, Natick, MA, USA).
19
The mass and isotope balance equations for the three-compartment metabolic model were similar to those described previously in detail.
4
The differential equations were solved using the Runge-Kutta algorithm, and the fitting was done using a Levenberg-Marquardt algorithm.
20
The cerebral metabolic fluxes were determined from the best fits of the model to the 13C turnover data. In the case of the cerebral cortex, Glu pool was distributed among glutamatergic neurons (82%), GABAergic neurons (2%), and astroglia (16%) (Table 1). The ratios
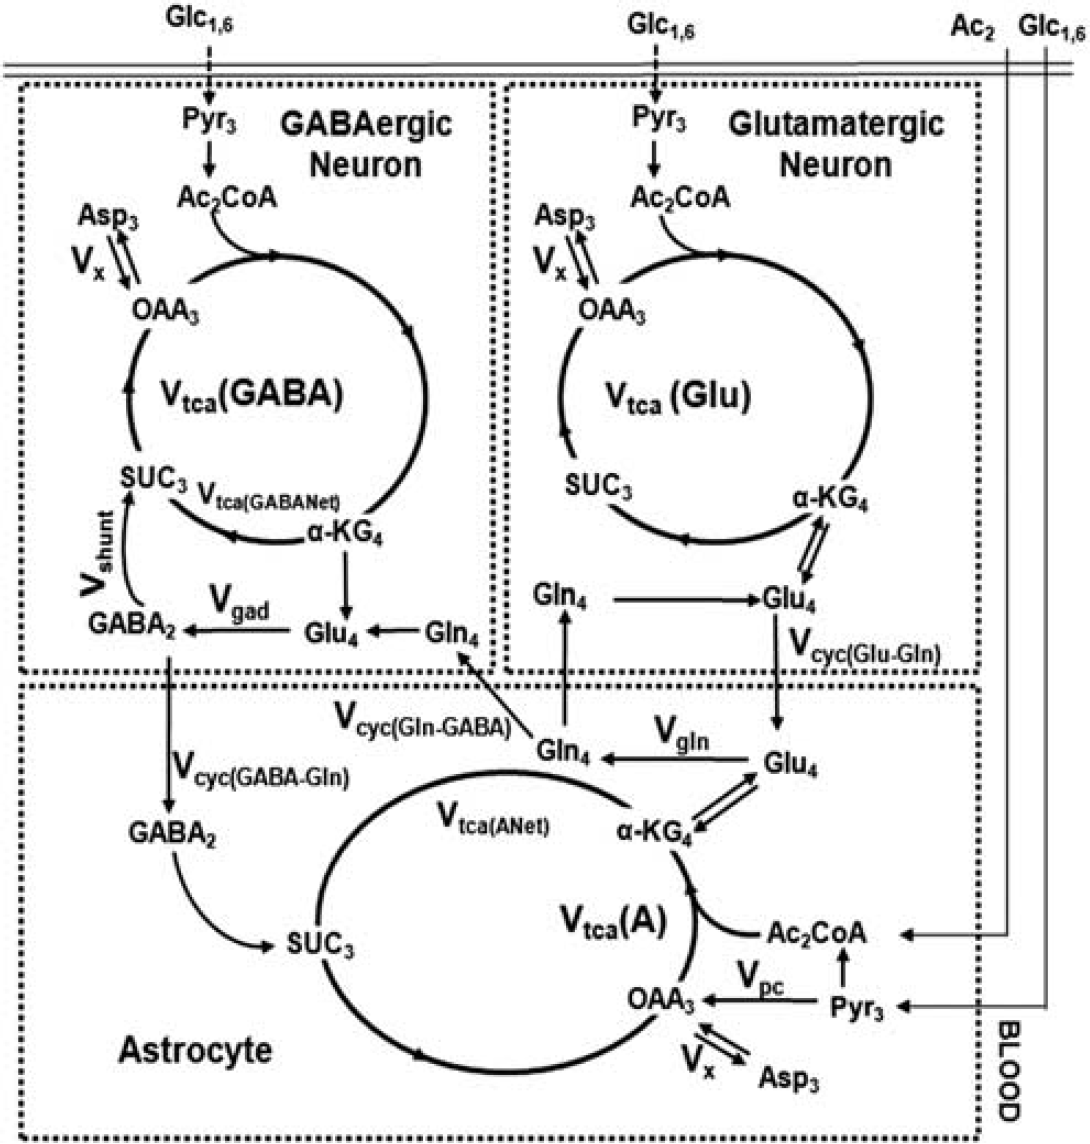
A three-compartment metabolic model showing the 13C labeling of cerebral metabolites from [1,6-13C2]glucose and [2-13C]acetate. Although [1,6-13C2]glucose is metabolized in the neurons and astroglia, [2-13C]acetate is selectively transported and metabolized in astroglia. Metabolism of [1,6-13C2]glucose via glutamatergic and GABAergic tricarboxylic acid (TCA) cycle labels GluC4. In GABAergic neurons, GluC4 is decarboxylated to GABAC2. Labeling of GlnC4 occurs from GluC4 and GABAC2 via Glu-Gln and GABA-Gln cycle, respectively. Further metabolism in the TCA cycle labels GluC2/3, GlnC2/3, GABaC3/4, and AspC2/3. The [2-13C]acetate metabolism in astroglia labels GlnC4 by combined action of astroglial TCA cycle and glutamine synthetase activity. GluC4 and GABAC2 are labeled from GlnC4 via Glu-Gln and GABA-Gln substrates cycling, respectively, between astroglia and neurons. Subsequent metabolism through TCA cycle incorporates labels into GluC2/3, GlnC2/3, GABAC3/4, and AspC2/3
Statistical Analysis
The statistical significance of differences for metabolite levels and metabolic rates among different brain regions was determined using analysis of variance. All results are presented as mean±s.d.
RESULTS
Plasma Glucose and Acetate Level and Enrichment
Infusion of [1,6-13C2]glucose led to a rapid increase in total glucose level from 8.8±0.7 mmol/L to 15.9±1.7 mmol/L within 7 minutes and remained elevated during the entire course of experiment. The 13C enrichment of glucose-C1 also increased rapidly to 37.9% in 7 minutes, and thereafter remained at ~ 40% throughout the infusion of [1,6-13C2]glucose. Plasma acetate level and 13C enrichment were found to be 3.7±0.8 mmol/L and 81.2±5.2%, respectively, after 90 minutes of [2-13C]acetate infusion.
Level of Metabolites in Different Regions of the Mouse Brain
Metabolite levels in different brain regions were measured from nonedited 1H-[13C]-NMR spectrum (Figure 2 upper panel). The levels of metabolites were found to vary across the brain and were distinct in the different regions of the brain (Figure 3). The levels of Glu (13.8±0.1 μmol/g) and N-acetylaspartate (NAA) (8.1 ± 0.2 μmol/g) were highest in the cerebral cortex. However, the level of GABA was highest in the thalamus-hypothalamus (4.3±0.1 μmol/g) and least in the cerebellum (2.3±0.1 μmol/g). The level of inositol was higher in the thalamus-hypothalamus (8.4±0.2 μmol/g) and striatum (8.3±0.3 μmol/g) and least in the cerebral cortex (6.5±0.2 μmol/g). Glutamine level was highest in the cerebral cortex (5.5±0.1 μmol/g) and lowest in the striatum (4.8±0.1 μmol/g).
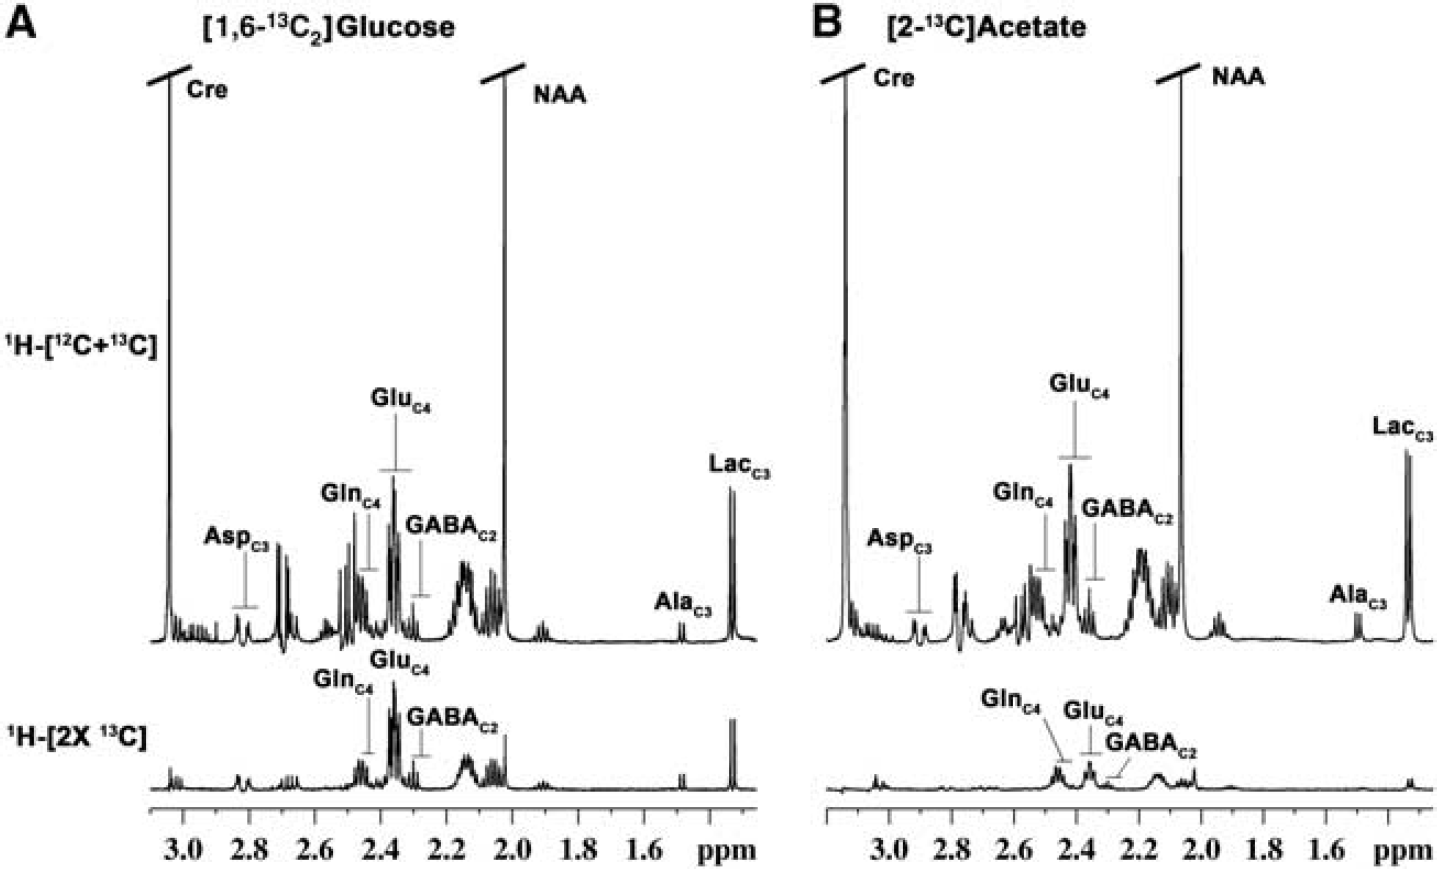
Typical 1H-[13C]-nuclear magnetic resonance (NMR) spectra from cortical tissue extract prepared after 90 min of (
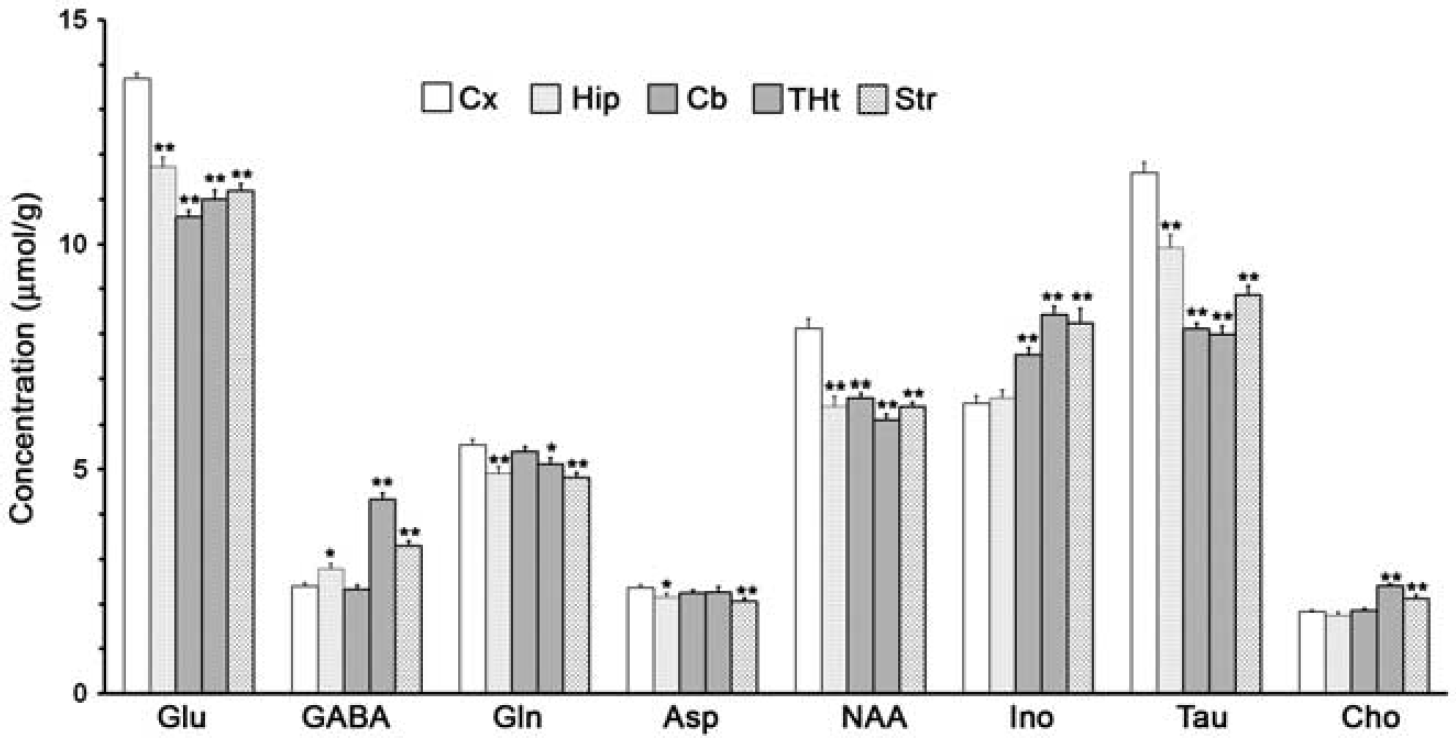
Metabolite concentration (μmol/g) in different brain regions. The concentration of metabolites was determined from 1H-[13C + 12C]-nuclear magnetic resonance spectrum using [2-13C]glycine as the internal reference. The values are mean ± s.e.m. (
Labeling of Cerebral Amino Acids from [1,6-13C2]Glucose and [2-13C]Acetate
Typical 1H-[13C]-NMR spectra obtained from the cerebral cortex of the mouse infused with either [1,6-13C2]glucose or [2-13C]acetate for 90 minutes are shown in Figure 2. The 13C intensity of amino acids from [1,6-13C2]glucose (Figure 2A lower panel) is much higher than that of [2-13C]acetate (Figure 2B lower panel), thus suggesting glucose as the preferred energy substrate over acetate in the brain. Further, the magnitude of labeling of GluC4 and GlnC4 from [2-13C]acetate is opposite to that of [1,6-13C2]glucose. In the cerebral cortex, 13C enrichment of GlnC4 (15.3±1.1%) was found to be significantly higher than GluC4 (7.2±0.1%) and GABAC2 (5.7±0.3%) in [2-13C]acetate experiment, whereas labeling of GlnC4 (23.6±0.5%) was lower than GluC4 (36.1±0.5%) and GABAC2 (29.6±1.1%) in [1,6-13C2]glucose experiment (Supplementary Table 2S). Moreover, labeling of amino acids from glucose was observed to be higher than acetate. The higher labeling of GlnC4 than GluC4 from [2-13C]acetate is in accordance with the preferential utilization of acetate in astrocytes, whereas higher labeling of GluC4 and GABAC2 over GlnC4 from glucose suggests preferential utilization of glucose by neurons.
Spectral time course of 13C labeling of cortical amino acids from [1,6-13C2]glucose is shown in Figure 4. Early-time-point infusion spectra (7 and 15 minutes) show well-resolved signals from GluC4 and GABAC2, which are labeled via the first turn of the TCA cycle; furthermore, later-time-point spectra (30, 60, and 90 minutes) exhibited signals from GluC3, AspC3, GABAC3, and GABAC4, which are labeled in the subsequent turn of the TCA cycle. Spectral time course displayed well-resolved signals from GluC4C3, GlnC4, GABAC2C3C4, and AspC3, which increased with time. The 13C turnover of amino acids from [1,6-13C2]glucose at different carbon positions, constructed by plotting the normalized 13C enrichment of amino acids with plasma glucose enrichment with time, was used for metabolic flux analysis.
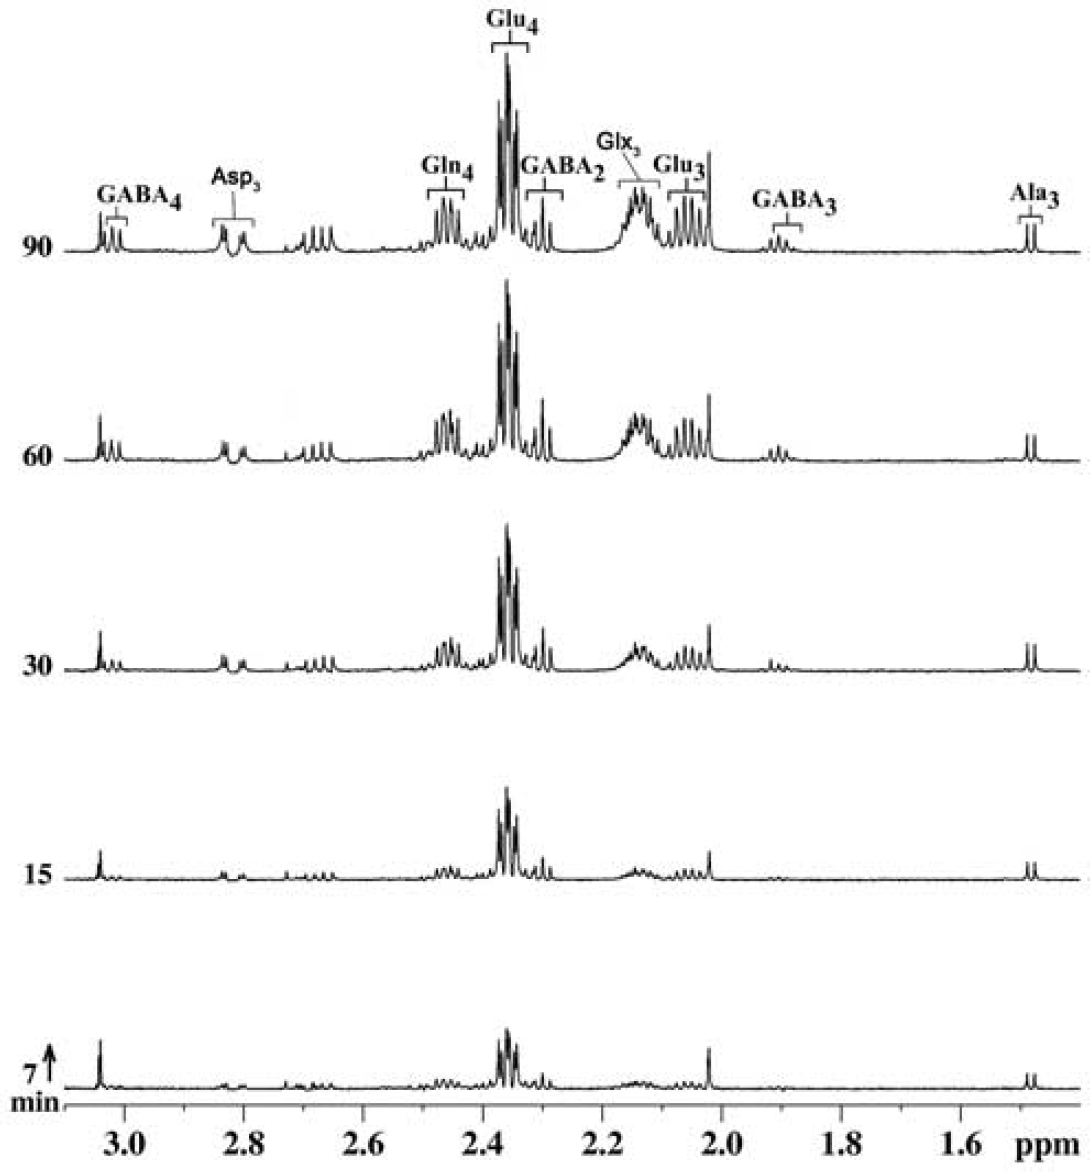
Representative ‘H-[13C]-nuclear magnetic resonance (NMR) spectra of cortical extract with time showing the 13C labeling of cortical metabolites from [1,6-13C2]glucose. Mice were infused with [1,6-13C2]glucose for a predefined duration, and ‘H-[13C]-NMR spectra were recorded from cortical tissue extracts. Peak labeling is the same as in Figure 3.
Glutamate Pool Distribution in Neurons and Astroglia
Glutamatergic and GABAergic TCA cycle and neurotransmitter cycle fluxes in different regions of the mouse brain were evaluated by fitting a three-compartment metabolic model (Figure 1; Supplementary Table 1S) to the 13C turnover of amino acids from [1,6-13C2]glucose. One of the important parameters in the model is the astroglial Glu pool size, which is not established in different regions of the mouse brain. Astroglial Glu pool was estimated from a short infusion of [2-13C]acetate and was found to vary from 9% to 16% in different regions of the mouse brain (Table 1). Astroglial Glu pool was found to be highest in the cerebral cortex (16%) and least in the cerebellum (9%), whereas other regions (hippocampus 12%; thalamus-hypothalamus 13%; striatum 15%) showed an intermediate value.
Glutamatergic and GABAergic Fluxes
The ratio of
The fit of the metabolic model to 13C turnover of amino acids in the cerebral cortex is depicted in Figure 5. The random distribution of residual together with low value of the least-square standard deviation between measured and predicted turnover suggests a good fit of the model to the measured data. The quality of the fit of the model to 13C turnover of amino acids was similar for other brain regions, as revealed by similar least-square standard deviation. The glutamatergic TCA cycle rate in the cerebral cortex (0.91±0.05 μmol/g per minute) was observed to be significantly higher (F[1,48] = 231,
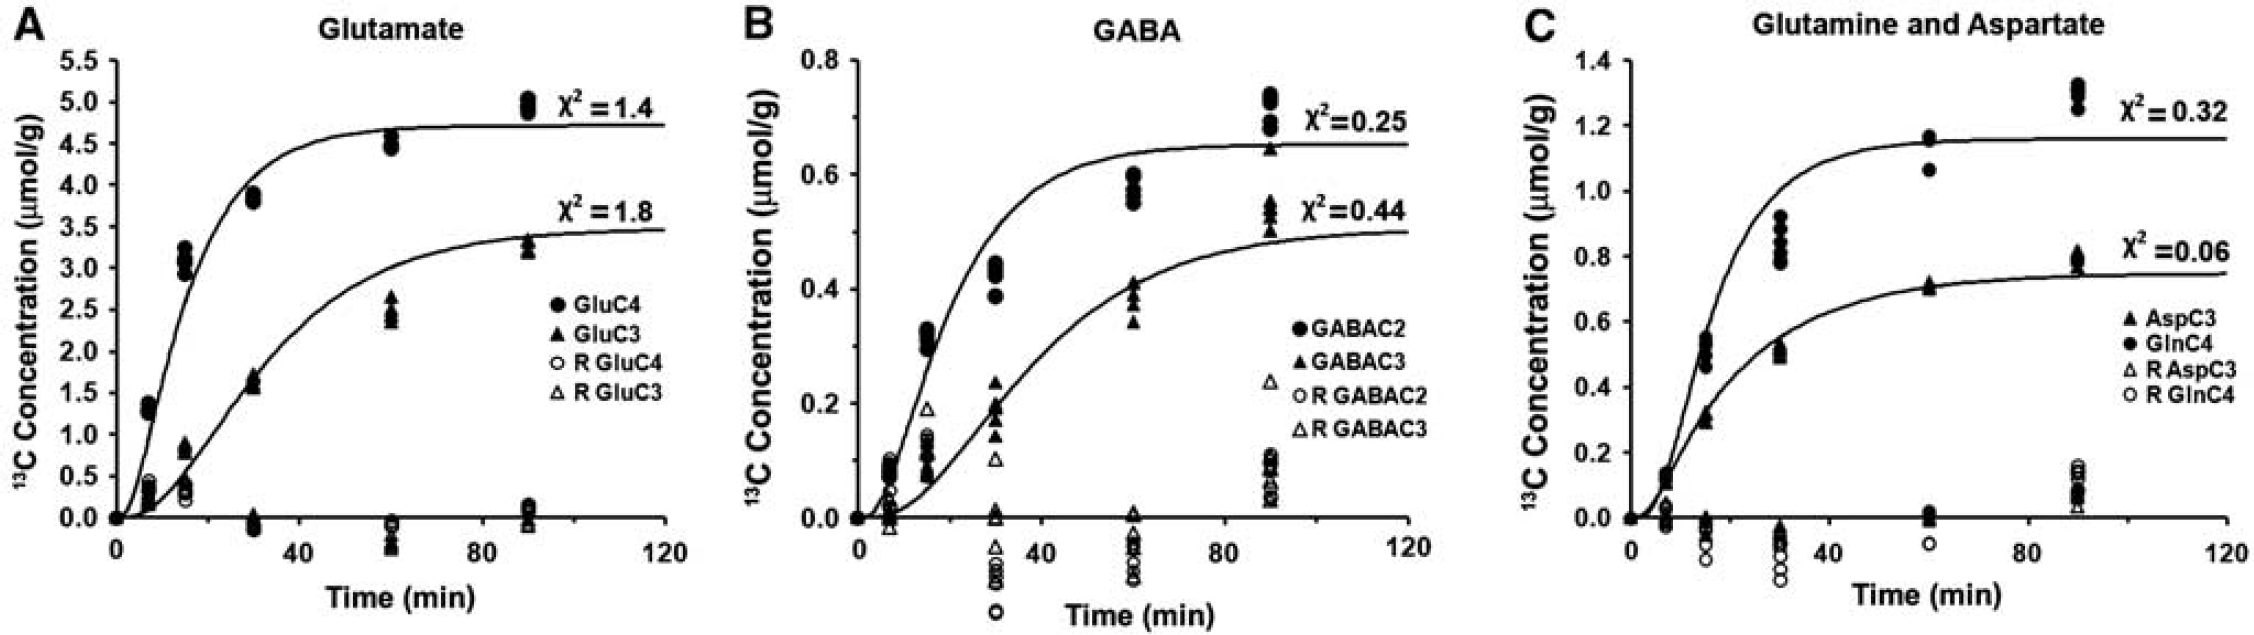
The fit of the metabolic model to the 13C turnover of cortical (
The GABAergic TCA cycle flux was significantly (
DISCUSSION
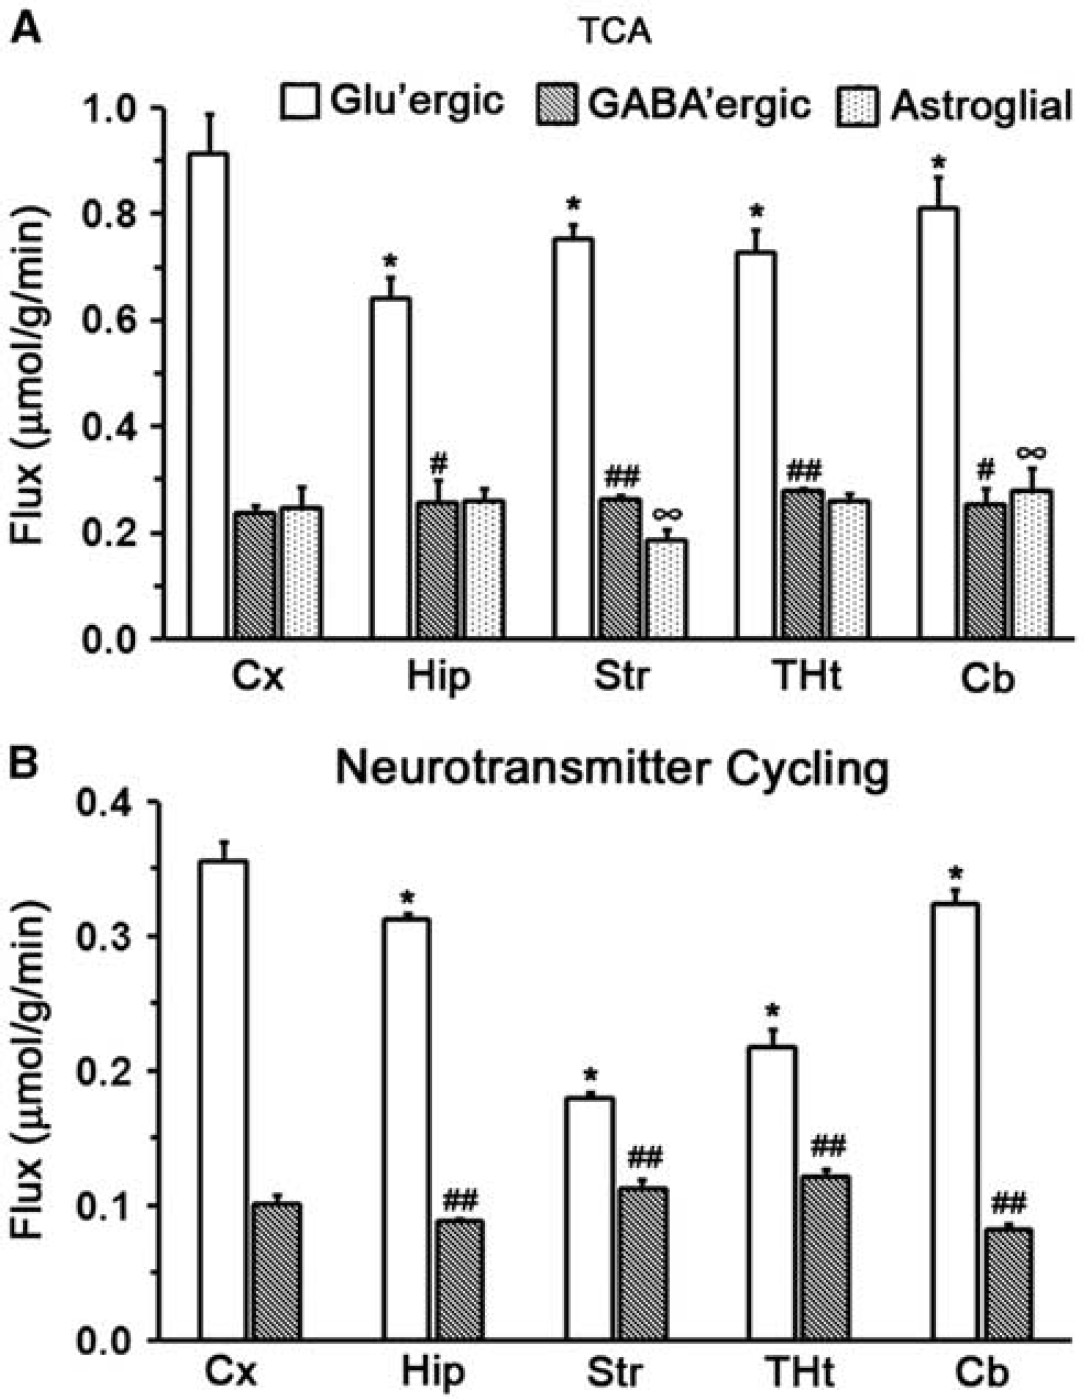
Cerebral metabolic rates in different regions of the mouse brain. (
The current study provides, for the first time, the quantitative fluxes associated with different metabolic pathways across the mouse brain. A particular region of the brain is attributed to specific function, which depends on the strength of the neuronal firing of the task associated with the brain region. Hence, the magnitude of energy consumed and neurotransmitter cycling rate is expected to vary across the brain. Usually, a particular region of the brain is affected in a given neurological condition. Hence, the understanding of neurotransmitter energetics across the brain may be useful for the diagnosis of the disease and to understand the disease manifestation during the treatment. In the present study, the three-compartment metabolic model was extended in mice to quantify the glutamatergic and GABAergic TCA cycle and neurotransmitter cycle rates in different regions of the mouse brain. To the best of our knowledge, this is the first comprehensive study that has evaluated the glutamatergic and GABAergic TCA cycle and neurotransmitter cycle flux across the brain of young adult mice. Our findings indicate that both the glutamatergic and GABAergic TCA cycle and neurotransmitter cycle rates are very distinct across different brain regions.
Neurochemical Profile in the Mouse Brain
Neurochemical profile has been extensively evaluated in the rat brain using
Glu and NAA levels were found to be highest in the cortical region, indicating more excitatory synapses and density of neurons in the cerebral cortex. The finding of higher level of Glu in the cortical region is consistent with earlier reports, which stated that the excitatory synapses outnumber the inhibitory synapses in the cerebral cortex.28,29 Higher level of GABA in the thalamus-hypothalamus and striatum may be due to higher density of GABAergic neurons/synapses in these regions. Indeed, the hypothalamus and striatum in rats have been shown to have higher densities of GABAergic neurons when compared with other brain regions. 30 Nuclear magnetic resonance studies have also suggested a higher value of GABA in the hypothalamus when compared with other brain regions.15,25 The level of inositol is comparatively higher in the striatal and thalamic regions, suggesting that these regions may have a higher astroglial population.
The Metabolic Model
The metabolic model used for the analysis of the 13C turnover data in the present study is the same as that used in the rat brain.
4
The model is well parameterized for rat cerebral cortex and has not yet been tested for other brain regions, which may have different proportions of cellular population. Glutamate, GABA, Gln, and aspartate (Asp) are readily labeled from [1,6-13C2]glucose or [2-13C]acetate in different regions of the mouse brain, indicating that trafficking of neurotransmitters, Glu and GABA, between neurons and astrocytes is operational across the mouse brain. The total pool of Glu, GABA, Gln, and Asp was measured across different brain regions in the present study. Astroglial Glu pool size, an important parameter of the model, was determined using a short-time infusion of [2-13C]acetate. Similar to rat brain, GABA and Gln were assumed to be localized exclusively in GABAergic neurons and astrocytes, respectively. The pool size of α-ketoglutarate and oxaloacetate was the same as that in Patel et
Glucose Metabolism and Neurotransmitter Cycling in the Cerebral Cortex
Over the past two decades, glucose metabolism and neurotransmitter cycle have been studied in rat4,7–10 and human brain.11–13 It has been well established that cerebral metabolic rates depend on the type and dose of anesthetics used, which affect the brain activity.5,17 Urethane (1.5 mg/kg) may be treated as a light anesthetic; hence, studies conducted under light anesthetics or awake conditions are considered for further discussion. A very recent study conducted in an awake rat has indicated cortical glucose oxidation in the range of 0.45 to 0.55 μmol/g per minute. 15 However, another study conducted in the whole brain has reported a very high value (0.91 μmol/g per minute) for neuronal glucose oxidation. 31 Moreover, a three-compartment modeling of 13C turnover of amino acids from glucose in halothane-anesthetized rat has revealed the rate of total (glutamatergic + GABAergic) neuronal glucose oxidation to be 0.60 μmol/g per minute. 4 The total neuronal glucose oxidation, 0.55±0.04 μmol/g per minute (1.11±0.07÷2), obtained in the present study in mouse cerebral cortex was found to be lower than the reported value under awake conditions; 31 however, it is very close to the rates in halothane-anesthetized rats. 4
In an awake rat cortex, total neurotransmitter cycling flux has been reported to be in the range from 0.47 to 0.57 μmol/g per minute.15,31 The total cortical neurotransmitter cycling has been reported to be 0.57 μmol/g per minute in halothane-anesthetized rat. 4 Our finding of total neurotransmitter cycle flux (0.45±0.03 μmol/g per minute) in the mice cerebral cortex was found to be in good agreement with these values. In the rat cerebral cortex, neurotransmitter cycle flux has been reported to be 80% of the neuronal glucose oxidation.5,17 In the present study, neurotransmitter cycle rate was found to be ~ 83% of the neuronal glucose oxidation, suggesting that in the mouse cortex also most of the energy is used for supporting the processes associated with neurotransmission.
Glucose Metabolism and Neurotransmitter Cycling in Different Brain Regions
Until now, most of the regional cerebral metabolic studies have been carried out in rats,15,32 and very little information is available for regional glucose metabolism and neurotransmitter cycling flux in brain of mice. The 14C deoxyglucose measurements of cerebral glucose utilization has indicated a decrease in the local glucose consumption in the following order: cerebral cortex > thalamus-striatum > hippocampus. 14 The 13C NMR study in rats has indicated that glucose oxidation and neurotransmitter cycle flux decreased in the order of cerebral cortex>corpus callosum>sub-cortex in rat brain, 7 suggesting that total glucose oxidation and neurotransmitter cycle might decrease in the order of cortex> striatum ~ thalamus > hippocampus. Moreover, glucose oxidation was reported to decrease in the order of cerebral cortex > striatum ~ cerebellum ~ hippocampus > thalamus-hypothalamus in rats in awake condition. 15 Our data indicate that neuronal glucose oxidation in the mouse brain decreases in the order of cerebral cortex>cerebellum>striatum ~ thalamus-hypothalamus> hippocampus (Supplementary Table 3S). The slight variation in the pattern of metabolic flux in the current study may be due to differences in the animal species studied.
Contribution of Excitatory and Inhibitory Fluxes in Different Regions of the Brain
The contribution of GABA to total neurotransmission and neuronal glucose oxidation has been evaluated in anesthetized rat cortex. The glucose oxidation by glutamatergic and GABAergic neurons in rat cerebral cortex under halothane anesthesia was 0.50 and 0.11 μmol/g per minute, respectively, and the corresponding neurotransmitter cycle fluxes were 0.45 and 0.14 μmol/g per minute, respectively. 4 The contribution of GABA to total neuronal glucose oxidation and neurotransmitter cycling fluxes was estimated to be 18% and 23%, respectively.4,6 The present study indicates that the contribution of GABA to total neuronal TCA cycle is 21% (glutamatergic 0.91; GABAergic 0.24 μmol/g per minute), whereas it is 22% (glutamatergic 0.36 μmol/g per minute; GABAergic 0.10 μmol/g per minute) for the neurotransmitter cycle in mouse cerebral cortex, which is similar to the values reported in rat cortex. Further, our findings also indicate that the contribution of GABA to neurotransmitter cycle flux increases in the order of cerebellum (20%) < cerebral cortex (22%) ~ hippocampus (22%) < thalamus-hypothalamus (36%)<striatum (39%) (Figure 6B, Supplementary Table 3S). The glutamatergic neurotransmission increases in the following order: striatum<thalamus-hypothalamus<hippocampus<cerebellum<cerebral cortex (Figure 6A). The finding of maximum contribution of GABA to neurotransmitter cycling in striatum and thalamus is in good agreement with the higher density of GABAergic neurons in these regions.30,33
Neurons and astrocytes function in a coordinated manner to achieve optimum brain functions. The total energy demand of the brain to carry out neurotransmitter activity is the sum total of TCA cycle flux of neurons and astrocytes. The data from the present study revealed that astroglial TCA cycle flux was highest in the hippocampus (22%;
Implications for Functional Neuroimaging
Traditionally, functional studies using fMRI and PET were concerned with the energy requirement of excitatory neurons.34,35 Inhibition of the human motor cortex evoked no measurable changes in the blood-oxygenation-level-dependent signal in the no-go condition, indicating that inhibition is less metabolically demanding.
36
However, energy budget analysis has suggested that the energetic requirement for inhibitory neurons may be similar to its excitatory counterpart.
37
Recently, the relationship between baseline GABA levels and functional signal in human visual cortex has been investigated.
38
The finding indicates that blood-oxygenation-level-dependent fMRI signal is inversely correlated with baseline GABA levels, thus predicting that the functional response in the thalamus, where GABA level is significantly higher than other brain regions, will be lesser.
Limitations
The metabolic analysis carried out in the current study involves macrostructures such as the cerebral cortex, cerebellum, hippocampus, hypothalamus-thalamus, and striatum. It will be interesting to study the metabolic fluxes in microstructures such as the amygdala and substantia nigra, which are involved in different disorders such as addictions and Parkinson's disease. The astroglial Glu pool was estimated using a strategy of short-time infusion of [2-13C]acetate. The estimation of astroglial Glu pool involves the assumption that 13C label is not transferred from astroglial Gln to neuronal Glu. However, small leakage of 13C label into neurons cannot be ruled out. Furthermore, assumption of the labeling of glial Glu pool equal to Gln may also not be fully valid in a short-time infusion. Hence, the fraction of astroglial Glu pool obtained by Equation (2) will be overestimated to the extent that the 13C label is transferred into neuronal Glu.
CONCLUSION
Our findings reveal that the metabolite levels are very different across the various regions of the mouse brain. Cortical regions exhibited the highest level of Glu and NAA, which shows a higher number of excitatory neurons and density, whereas the thalamic and striatal regions exhibited higher GABAergic density. The finding of higher 13C labeling of cerebral amino acids from glucose than acetate is consistent with the view of glucose as the preferred energy substrate for the brain than acetate. The neurotransmitter cycle in the mouse brain was found to decrease in the order of cerebral cortex > cerebellum > hippocampus > thalamus-hypothalamus > striatum. Glutamatergic activity was found to be highest in the cerebral cortex, whereas the GABAergic activity was observed to be maximum in the subcortical regions. To the best of our knowledge, the present investigation is the first comprehensive study that has evaluated the glutamatergic and GABAergic TCA cycle and neurotransmitter cycle fluxes across different regions of the mouse brain. These findings indicate that both the glutamatergic and GABAergic TCA cycle and neurotransmitter cycle rates are very distinct across different brain regions.
Footnotes
The authors declare no conflict of interest.
ACKNOWLEDGEMENTS
We thank Dr Robin A de Graff and Dr Graeme Mason, Yale University for providing the POCE sequence and CWave software, respectively, Dr M Jerald Mahesh Kumar for providing animals in good health, Mr Bhargidhar Babu for his assistance in conducting animal study, Mr KS Varadarajan for his help with NMR experiments, Dr C Suguna for help with statistical analysis, and Dr Yamini Asthana for the critical editing of the manuscript.
References
Supplementary Material
Please find the following supplemental material available below.
For Open Access articles published under a Creative Commons License, all supplemental material carries the same license as the article it is associated with.
For non-Open Access articles published, all supplemental material carries a non-exclusive license, and permission requests for re-use of supplemental material or any part of supplemental material shall be sent directly to the copyright owner as specified in the copyright notice associated with the article.