
Abstract
Perivascular compartments surrounding central nervous system (CNS) vessels have been proposed to serve key roles in facilitating cerebrospinal fluid flow into the brain, CNS waste transfer, and immune cell trafficking. Traditionally, these compartments were identified by electron microscopy with limited molecular characterization. Using cellular markers and knowledge on cellular sources of basement membrane laminins, we here describe molecularly distinct compartments surrounding different vessel types and provide a comprehensive characterization of the arachnoid and pial compartments and their connection to CNS vessels and perivascular pathways. We show that differential expression of plectin, E-cadherin and laminins α1, α2, and α5 distinguishes pial and arachnoid layers at the brain surface, while endothelial and smooth muscle laminins α4 and α5 and smooth muscle actin differentiate between arterioles and venules. Tracer studies reveal that interconnected perivascular compartments exist from arterioles through to veins, potentially providing a route for fluid flow as well as the transport of large and small molecules.
Introduction
Perivascular compartments surrounding cerebral vessels have recently attracted attention because of newly proposed concepts on fluid flow between the subarachnoid space, which contains the cerebrospinal fluid (CSF), and the brain parenchyma, which contains interstitial fluid (ISF). This has important implications for nutrient supply to and waste removal from the CNS parenchyma and consequently drug delivery to the CNS, and immune surveillance mechanisms within the brain.
At the surface of the brain, the pial and inner arachnoid layers border the subarachnoid space. Historically, perivascular compartments (fluid compartments surrounding arterioles and veins, also termed Virchow-Robin spaces in the older literature) were considered to connect the subarachnoid space to the CNS parenchyma by providing a route for CSF to reach and ISF to leave the CNS parenchyma.1,2 Some early electron microscope and CSF tracer perfusion studies suggested that these Virchow-Robin spaces were cul-de-sacs or dead ends,3,4 but other studies involving infusions of horseradish peroxidase (HRP), Evans blue and other tracers into the CSF and investigation of later time points revealed a direct link between the subarachnoid space and perivascular compartments around arterioles,2,5–8 venules2,5–12 and even capillaries.5,13,14 More recent studies with radio- and fluorophore-labelled tracers have largely confirmed these findings, but the details remain unsettled.8–12
Within the CNS parenchyma, there is evidence that waste products can move by convective flow along low-resistance perivascular pathways, 15 the direction of which still remains unclear but has been proposed to occur along capillary basement membranes towards the arterial system.9,11,16–18 Recent two photon laser scanning microscopy studies that allow real-time tracking of fluorescently tagged tracers injected into the subarachnoid space have also suggested that perivascular compartments act as ducts along arteries from which CSF can enter the brain parenchyma,10,19 mix with the ISF, and exit again along venules. 5 While a large body of work suggests diffusion governs transport through the neuropil and is likely to be the dominant mechanism for CSF–ISF mixing,15,20,21 the intravital studies have proposed that a convective flow through the neuropil may also contribute.10,19 Whether the volume and rate of tracer injection are issues that confound the interpretation of the results from such intravital studies15,22,23 requires further investigation.
The different compartments of the brain where fluid flow could occur, including the subarachnoid space, the sub-pial space, the sub-ependymal zone, the perivascular compartments and the white matter of the brain parenchyma were typically identified by tracer localization studies combined with transmission electron microscopy analyses.1,3,4,6,8,24–26 Little work has been done since these early analyses, and the use of molecular markers for the identification of the different meningeal layers has been extremely limited,27–29 with no consideration of the associated extracellular matrix (ECM), which also contributes to barrier function and compartmentalization. 30
Our previous work on experimental autoimmune encephalomyelitis (EAE), a neuroinflammatory model, has shown that perivascular compartments can be formed by basement membranes (BMs). At least two BMs occur in association with all blood vessels within the CNS parenchyma, an endothelial BM and an astroglial31,32 or so-called parenchymal BM, as it marks the border to the CNS parenchyma.6,29,33 Around arterioles, the parenchymal BM includes the closely associated BM secreted by the pial epithelial cells that co-migrate with arterioles as they penetrate the brain surface during development. 6 At the level of post-capillary venules where immune cell extravasation occurs, the endothelial and parenchymal BMs define the inner and outer borders of a perivascular compartment in which leukocytes accumulate during acute EAE.31,32,34 The fact that EAE symptoms do not occur when the leukocytes are trapped between the two BMs but only become apparent when they breach the outer parenchymal BM34,35 indicates that these BMs act as barriers and form a compartment that can confine cells. A similar accumulation in BM-bordered perivascular compartments along capillaries has been reported for fluorophore-labelled tracers injected into the striatum, 9 indicating that cerebral vessel BMs also restrict movement of soluble macromolecules. Model systems investigating the delivery of differently charged and sized ferritins and dextrans across the BM of the dermo-epidermal junction, the glomerular BM, glomerular capillary BMs and Bruch’s membrane underlying the retinal pigment epithelium in the eye have shown that BMs exclude macromolecules the size of albumin (hydrodynamic diameter of ∼7 nm) and nanoparticles of ∼30–50 nm.36–43 Electron microscopy of brains after infusion of tracer substances has shown limited transport beyond the peri-endothelial cell BM of molecules ranging in size from HRP (∼40 kDa; 6 nm) up to ferritin (∼460 kDa; 13 nm). 44
Endothelial and parenchymal BMs are molecularly distinct 30 ; like all BMs, they are composed of collagen type IV and laminin networks, interconnected by heparan sulphate proteoglycans 45 and nidogens, 46 but differ critically in their expression of laminin isoforms. Laminins are composed of an α, β and γ chain, named according to their chain composition, e.g. laminin 411 is composed of laminin α4, β1 and γ1 chains. 47 There are five laminin α chains that carry the cell receptor binding sites and are therefore responsible for functional activity. In addition, laminin α chains are secreted in a cell-specific manner; hence, their expression patterns provide information on the origin of the cells subjacent to the BM. 48 Laminin α4 and α5 chains are expressed by endothelial cells and deposited into the endothelial BM of cerebral vessels, 31 while laminin α2 is characteristically expressed by myogenic and neural tissues49–51 and occurs in the parenchymal BM.31,51 Laminin α1 also occurs in the parenchymal BM but has a more restricted distribution than laminin α2; due to its epithelial cell origin,52–55 it is thought to be secreted by pial cells that co-migrate with arterioles into the brain.6,31
Based on this knowledge of laminin isoform expression by different cell types, in combination with specific cell markers, we here molecularly define the arachnoid and pial layers and their association with different blood vessel types. We show that arteries can be distinguished from veins by their association with BMs containing distinct laminin isoforms. Through the use of fluorescently labelled IgG-tracer infused into the CSF, we show that a perivascular pathway associated with arteries has direct connection to the subarachnoid space. Furthermore, this perivascular pathway has the potential to exist from arteries through to veins and may provide a site for movement of CSF, a variety of tracer substances, and endogenous molecules.
Material and methods
Animal preparation
Experiments on mice conducted at the University of Münster were approved by the Landesamt für Natur, Umwelt und Verbraucherschutz Nordrhein-Westfalen (LANUV; animal permit license number: 84-02.05.50.17.004), carried out in accordance with the German Animal Welfare Act guidelines and reported according to the ARRIVE (Animals in Research: Reporting in Vivo Experiments) guidelines. In total, 18 C57BL/6 mice (both male and female mice, 2–8 months old and 20–30 g in weight) were sacrificed and intracardially perfused with 2% paraformaldehyde (PFA) for 5–10 min before brains were excised and post-fixed overnight in 2% PFA. The brains were then washed in PBS and sectioned into 100 µm coronal sections using a Vibratome (HYRAX V50, Zeiss, Germany).
Fluorescent-labelled tracer studies in rats were conducted at the University of Wisconsin-Madison. Experimental protocols were approved by the Institutional Animal Care and Use Committee (IACUC; animal permit license number: M02445) at the University of Wisconsin-Madison, performed in accordance with USA National Institute of Health Guide for the Care and Use of Laboratory Animals (8th edition; 2011) and reported according to the ARRIVE guidelines. Six adult Sprague–Dawley rats (female, ∼3 months old and 180–240 g in weight) were anesthetized with urethane (1.3 g/kg, i.p.), tracheotomised, and placed in a stereotaxic frame (Stoelting, USA). Animals were surgically prepared as described previously. 56 Briefly, muscles overlying the cisterna magna and the atlanto-occipital membrane were retracted, and a 33 GA PEEK cannula inserted 1 mm into the CSF of the cisterna magna through a small puncture in the intact dura. The cannula was sealed in place with cyanoacrylate and a low-flow infusion (80 µl at 1.6 µl/min), controlled by Quintessential Stereotaxic Injector (Stoelting) of Alexa Fluor 488 labelled goat anti-rabbit immunoglobulin G (IgG) (A-11034, Life Technologies) was then infused into the cisterna magna. Thirty minutes after the infusion was complete (50 min), the rats were intracardially perfused with 50 ml ice cold 0.01 M PBS followed by ∼450 ml of 2% PFA. The brains were then excised, post-fixed in 2% PFA overnight and washed in PBS before being sectioned as described above. In addition, brain sections from three rats were co-stained as described below with antibodies against laminin γ1 in order to identify and locate basement membranes.
Immunofluorescence microscopy
Sections (100 µm) were treated with 1% bovine serum albumin (BSA)/0.5% TritonX-100 in PBS before incubation overnight at 4℃ with primary antibodies (listed in Supplementary Table 1). Bound antibodies were visualized using Alexa 488 -, Cy5- or Cy3-conjugated goat or donkey anti-rat, or Cy3- or Cy5-conjugated anti-rabbit secondary antibodies (Dianova and Molecular Probes) diluted in PBS containing 1 µg/ml DAPI (Molecular Probes, Germany) and 0.5% Triton X-100. Sections were examined and documented using a LSM 700 confocal microscope (Zeiss, Germany). Images were analysed using Volocity 6.3 software (PerkinElmer, USA). All stainings were repeated a minimum of three times on three different mice.
Intensity correlation analysis
A representative confocal image stack was converted using Fiji software 57 to give maximum projection for each channel. The region of interest (a line as shown in Figure 2(c)) was selected, and the plot profile function was used to calculate fluorescent intensity for each channel. The ratio of fluorescent intensity for laminin α2 to laminin α1 was calculated for venules, post capillary venules, capillaries, arteries and at the brain surface, using three vessels of each type or three regions of the brain surface from three different animals. Using Fiji software, 57 the region of interest (area encasing each vessel/brain surface) was selected, and the ‘analyse and measure’ functions were used to calculate the fluorescent intensities for laminin α1 and α2.
Results
Cellular markers to define the leptomeninges.
The arachnoid layer in the murine brain is more closely associated with the pial layer than it is in the human brain; however, several studies have described it as a multi-layered sheet of arachnoid cells similar to that in humans.63,64 As it was not possible to preserve the outer arachnoid layers in the murine brain preparations, our results focus on the inner arachnoid and pial layers at the surface of the brain and the cellular and BM layers associated with penetrating arteries and arterioles, parenchymal capillaries, and cortical postcapillary venules and veins. Analyses were restricted to the cortex in coronal brain sections between locations 0.8 mm anterior and 2.5 mm posterior to Bregma.
Pial brain surface
As we have previously reported, laminin α2 is broadly present in the parenchymal BM that marks the border to the brain parenchyma
31
and is distinct from the laminin α4 and α5 positive endothelial and smooth muscle BMs (Figure 1(a) to (c)). Double staining for laminin α1 and α2 revealed a more restricted staining for laminin α1, which occurred at the brain surface and in association with penetrating SMA-positive arterioles (Figure 1(d) and (e)), ending abruptly a short distance beyond the smooth muscle cell layer (inset Figure 1(f)). SMA-negative venules exhibited limited laminin α1 staining, which extended only a short distance from the brain surface into the parenchyma (Figure 1(e)). Quantitative analyses of pixel intensity of laminin α1 and laminin α2 stainings revealed high laminin α1 and low laminin α2 staining at the surface of the brain and around larger SMA-positive arterioles penetrating into the brain parenchyma compared to SMA-negative venules, post-capillary venules and capillaries (Figure 1(d), (f) to (h) and Figure 2a). Hence, differential expression of laminin α1, laminin α2 and SMA permitted distinction between arterioles (SMA+, laminin α2low, laminin α1high) and venules (SMA−, laminin α2high, laminin α1−). Only a small number of venules that were double positive for laminin α1 and α2 were detected (Supplemental Figure 1). A clear orientation of laminin α2 and α1 staining was also apparent, with laminin α1 occurring towards the external surface of the brain and laminin α2 towards the brain parenchyma (Figure 2a). Whether this reflects two separate BMS is not clear, as immunofluorescence staining alone does not permit distinction between two closely juxtaposed BMs.
Differential distribution of basement membrane laminin α chains. Adult mouse brain tissue sections (100 µm) were immunofluorescently stained for the BM proteins laminin α1, α2 and α5, and smooth muscle actin (SMA) to identify smooth muscle cells. The diagram on the right side shows the locations where images were taken. (a) Low-magnification image showing broad distribution of both laminin α2 and laminin α5 along blood vessels and at the surface of the brain. (b) The laminin α2 positive BM, which marks the border to the brain parenchyma, is distinct from the laminin α5 positive BM of the endothelial and smooth muscle cells. (c) High magnification images of the boxed area in (b) reveal a perivascular compartment between the outer laminin α2 positive BM and the laminin α5-positive BM of the smooth muscle cells in which different cell layers (adventitial layer of the arteriole, pial cells and perivascular macrophages) are present (white arrows indicate DAPI stained nuclei). Images shown are representative of five independent experiments performed on five mice. (d) Intense laminin α2 staining occurs around blood vessels within the CNS and weaker staining at the surface of the brain (yellow arrowheads) and along penetrating SMA+ arterioles (yellow arrows). (e) Laminin α1 staining is restricted, occurring mainly at the brain surface and surrounding SMA+ penetrating arterioles. In contrast to arterioles, laminin α1 staining around SMA− venules (white arrows) extends only a short distance into the parenchyma. (f) Merge of image (d) and (e) showing clear distinction between arterioles and venules/veins. Inset shows the abrupt ending of the laminin α1 BM. (g) Plot profile showing the differential fluorescence intensities (arbitrary units) for laminin α1, α2 and SMA across vessels as indicated by the yellow bar in (f). Images shown are representative of seven independent experiments performed on seven mice. (h) Fluorescence intensity ratios of laminin α2 to laminin α1 highlight the low expression of laminin α2 along arterioles and at the brain surface, and high expression along venules, post-capillary venules (PCV) and capillaries. Data are means ± S.E.M of three mice and three images/mouse. Scale bars: (a) 50 µm, (b) 25 µm, (c) 10 µm, (d, e, f) 100 µm, (inset) 30 µm. Distinct orientation and differential expression of the parenchymal BM laminin α chains. Adult mouse brain tissue sections (100 µm) were immunofluorescently stained for the parenchymal BM proteins laminin α1 and laminin α2, smooth muscle actin (SMA) and glial fibrillar acidic protein (GFAP) or aquaporin-4 (AQP4) to identify astroglia. (ai) Penetrating arterioles, identified by the presence of SMA positive smooth muscle cells (aii) are surrounded by low laminin α2 (aiii) and high laminin α1 staining (aiv). Note low laminin α2 staining at the surface of the brain. Inset shows the orientation of the laminin α1 BM towards the CSF and the laminin α2 BM towards the parenchyma. Images shown are representative of seven independent experiments performed on seven mice. (bi) Intense laminin α1 staining occurs at the surface of the brain and along penetrating arterioles at sites where astroglia endfeet show strong GFAP staining. (bii) High magnification image of the boxed area in (bi). Images shown are representative of three independent experiments performed on three mice. (ci) By contrast, intense laminin α2 staining occurs around vessels associated with astroglia expressing AQP4 but no GFAP. (cii) High-magnification image of the boxed area in (ci). Lower left diagram in (ai), and lower right in (bi) and (ci) shows where images were taken. Images shown are representative of three independent experiments performed on three mice. Scale bars: (ai–iv) 30 µm, (bi, ci) 130 µm, (bii, cii, inset) 50 µm; SAS: subarachnoid space.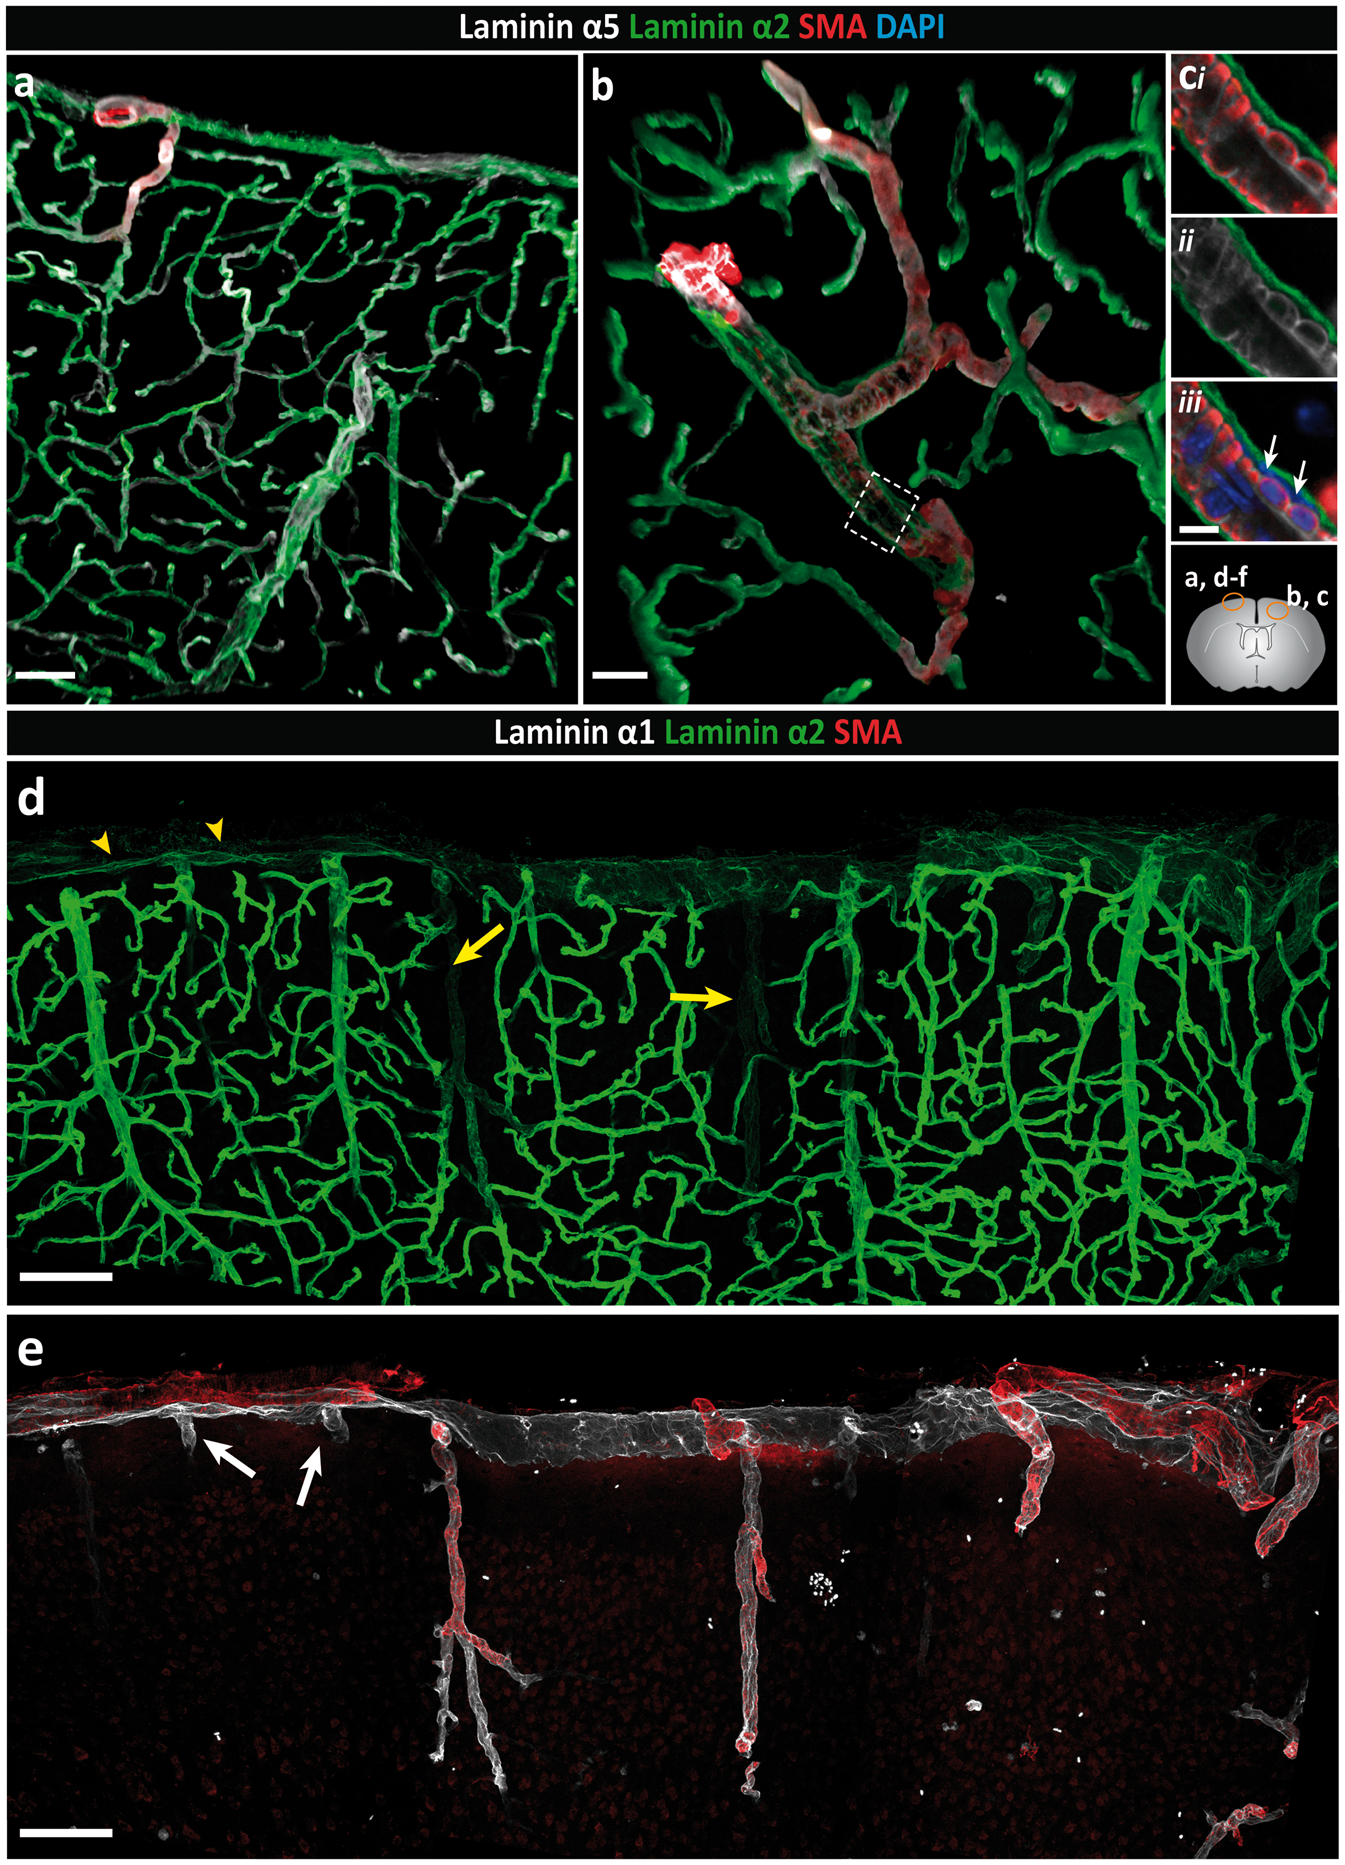
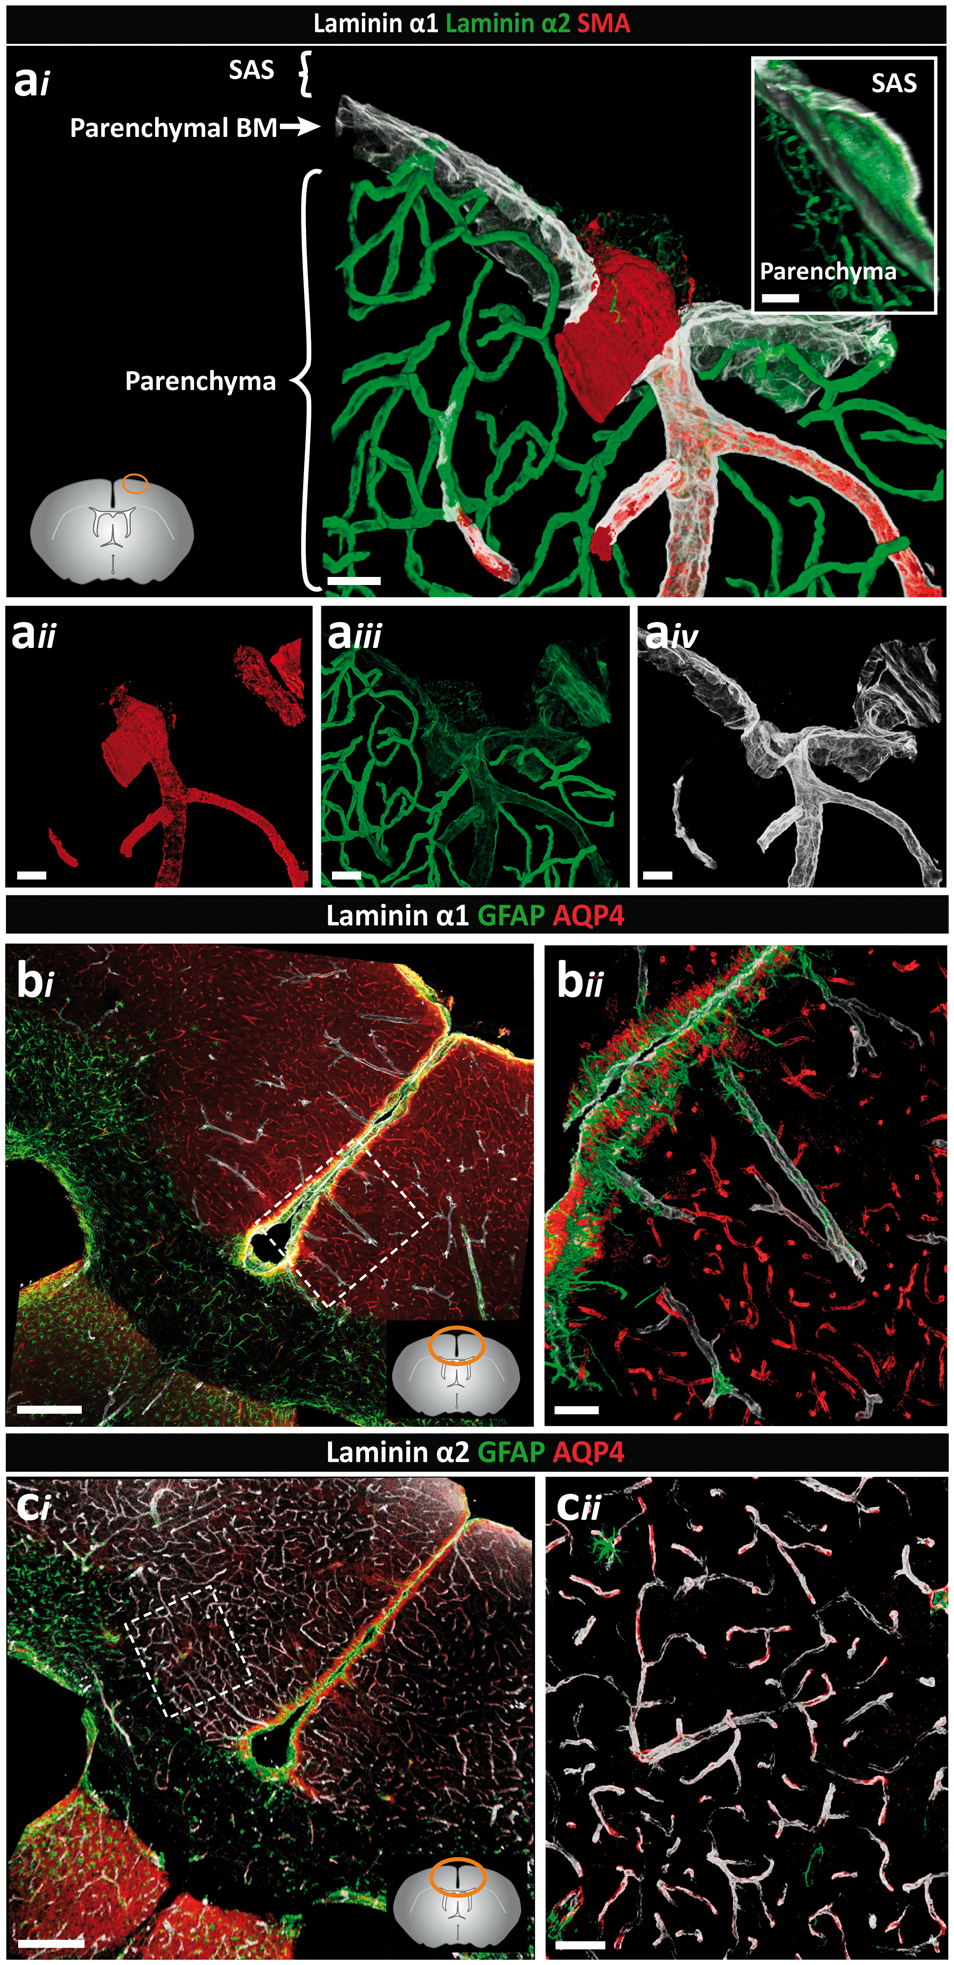
Analysis of glial markers revealed a population of GFAPhigh, AQP4+ astroglial cells mainly along the surface of the brain and around the penetrating laminin α2low and laminin α1+ arteries/arterioles (Figure 2(bi) and (cii), while in the cortex GFAPlow, AQP4+ astroglial cells occurred juxtaposed to the laminin α2high venules (Figure 2(ci) and (cii)). Our previous in situ hybridization analyses of mouse brains 31 and knockout out studies31,51 suggest that laminin α2 originates from astroglial cells. Hence, the data are consistent with differential expression of laminin α2 by different astroglial cell types61,62 and may reflect an influence of the pial cells on astroglial laminin α2 expression, i.e. at sites where pial cells occur as defined by laminin α1 expression, astroglial secretion of laminin α2 is low or absent.
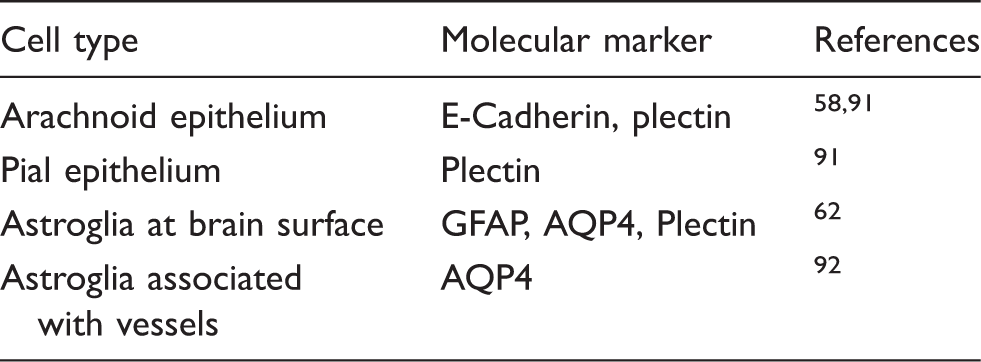
At the surface of the brain, pial and arachnoid epithelial layers were both plectin+ (Figure 3(a)). In addition, plectin stained a subpopulation of astroglia at the surface of the brain, as reported by others
65
(Table 1 and Supplemental Figure 2). E-cadherin+ staining of the arachnoid layer permitted clear distinction from the pial layer (Figure 3(a) and (b)), with laminin α1 occurring in close association with the plectin+, E-cadherin− pial cells only (Figure 3(a) and (b)). Notably, only laminin α5 occurred beneath the E-cadherin+ arachnoid layer (Figure 3(c)). Both laminin α1 and α5 can be expressed by epithelial cells, but while laminin α1 occurs mainly in BMs of developing epithelium or the specialized epithelium of glands and some kidney tubules,52,66 laminin α5 occurs in most mature epithelial BMs and rarely overlaps with laminin α1.
67
Rather than the intensive continuous staining seen in the laminin α1+ pial epithelial BM, the arachnoid BM typically appeared filigree with areas of high and low laminin α5 staining (Supplemental Figure 3). Electron microscopy studies have also revealed segments of BM, rather than a continuous layer, associated with the inner arachnoid epithelial layer,
64
consistent with our findings. Staining for SMA showed the presence of arterioles between the laminin α1+ pial BM and the E-cadherin+ arachnoid layer (Figure 3(c) and (d)), strongly suggesting that the laminin α1+ BM is not produced by the arachnoid layer. This E-cadherin+, laminin α5+ arachnoid layer also showed continuous staining across the sulcus (Figure 3(b)), as has been observed with electron microscopy.
1
Basement membranes of the pial and arachnoid layer are molecularly distinct. Adult mouse brain tissue sections (100 µm) were immunofluorescently stained for E-cadherin, plectin and laminins α1 and α5. (a) Arachnoid and pial layers are positive for plectin. The laminin α1 BM occurs in close association with the plectin+ pial cells which is distinct from the E-cadherin+ arachnoid layer (b). (c) Laminin α5-positive BMs underlie the inner arachnoid layer, surround each smooth muscle cell and underlie endothelial cells. (d) Staining for SMA showing the presence of arterioles between the laminin α1+ pial BM and the E-cadherin+ arachnoid layer, confirming that the arachnoid layer does not produce laminin α1. (e–h) Quadruple staining for plectin, GFAP, laminin α1 and laminin α2 demonstrating close association of GFAP+ astrocytes with the laminin α2 low astroglial BM, which correlate with the laminin α1+ plectin+ pial layer. Abrupt loss of laminin α1 staining is coincident with loss of plectin+ pial epithelial cells. Diagrams in the lower right of panels (a–d, f) show the location of images. Scale bars: (a) 20 µm, (b) 50 µm, (c) 30 µm, (d–h) 20 µm. Images shown are representative of eight independent experiments performed on eight mice.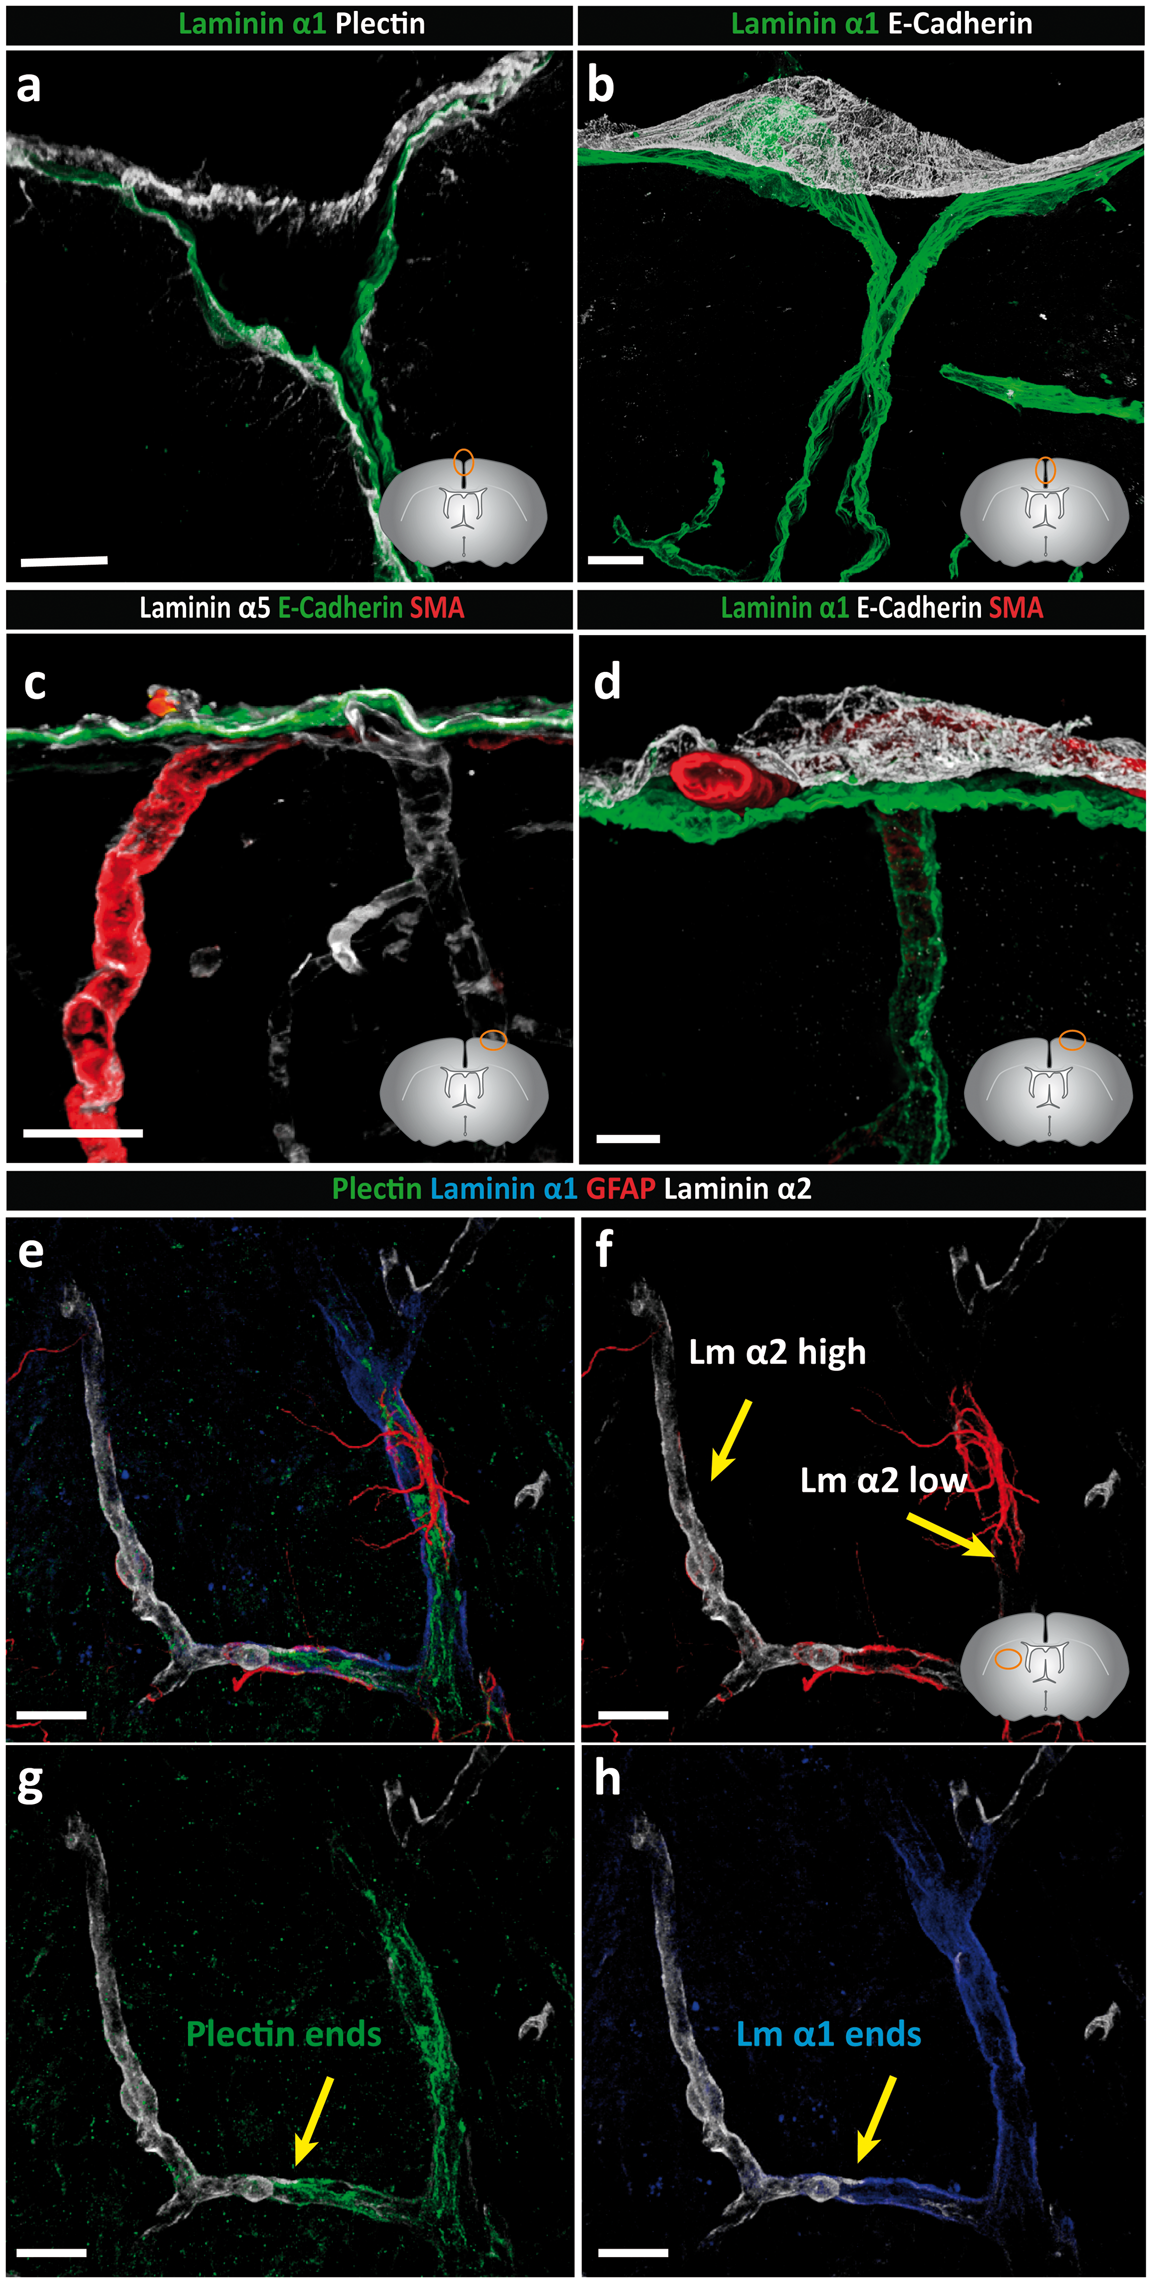
Quadruple staining for plectin, GFAP, laminin α1 and laminin α2 confirmed the distinct orientations of laminin α1 and α2 and their close association with plectin+ pial epithelial cells and GFAP+ astroglia, respectively (Figure 3(e) to (h)). This suggests the existence of a laminin α1+ BM underlying plectin+ pial cells and an adjacent laminin α2+ BM overlying astrocyte endfeet. These stainings also clearly show the loss of laminin α1 staining concurrent with loss of the plectin+ layer and the associated enhanced staining for laminin α2 at the level where arterioles lead to capillaries (Figure 3(e) and (f)). At the surface of the brain, it was more difficult to discern the orientation of plectin+ pial cells with respect to the laminin α1 and α2 stainings. This was because plectin antibody strongly stained a subpopulation of astroglia only at the surface of the brain (Supplemental Figure 2). Nevertheless, the orientation of laminin α1 remained towards the CSF and laminin α2 towards the CNS parenchyma (Figure 2(ai) inset).
Taken together, these findings suggest that the arachnoid and pial layers and their associated BMs at the brain surface are molecularly distinct, with the arachnoid layer being plectin+ and E-cadherin+ and associated with a laminin α5+ BM, while the pial layer is plectin+ and E-cadherin− and is associated with laminin α1high, laminin α2low BM.
Cortical vessels
In arterioles, laminin α4 and α5 mark the endothelial BM
31
as well as the BMs of individual SMA+ smooth muscle cells that ensheath the endothelial tube (see Figure 1(c)).
68
These two sets of vascular cell layers and BMs are therefore spatially distinct, not only from each other, but also from the laminin α1+, laminin α2low parenchymal BM (Figure 1(c)). Notably, the vascular BMs (endothelial and smooth muscle) constitute the outer border of the vessels, while the parenchymal BM marks the border to the CNS parenchyma, thereby defining a perivascular compartment. Immunofluorescence analyses revealed that this compartment is occupied by fibrillar type I and III collagens (Figure 4(a) to (d)) that are most likely associated with the adventitial layer surrounding the vascular smooth muscle cells. In addition, staining for the reticular fibroblast marker, ERTR7, revealed positive staining covering the brain surface and around arteries in the leptomeningeal space and penetrating down into the CNS (Figure 4(e) and (f); Supplemental Figure 4). The leptomeningeal perivascular compartment therefore contains plectin+ cells and ERTR7+ fibroblasts as well as perivascular F4/80+ macrophages (Figure 4(g)).
Identification of the adventitial layer. Adult mouse brain tissue sections (100 µm) were immunofluorescently stained for fibrillar type I and III collagens and reticular fibroblast (ERTR7) or macrophage (F4/80) markers. Both collagen types I (a, b) and III (c, d) are detected in the meninges and surrounding penetrating arterioles. Cross-sectional views (position indicated by dotted white line) demonstrate the localisation of collagen types I (b) and III (d) between the SMA+ smooth muscle layer and the laminin+ pial BM. (e) ERTR7+ fibroblasts are abundantly present in the meninges and around vessels, both penetrating into the parenchyma and in the subarachnoid space (SAS) (yellow arrowhead). (f) Cross-sectional views (position indicated by dotted white line in (e)) demonstrating that ERTR7 staining occurs outside of the SMA+ smooth muscle layer. Images shown (a–f) are representative of seven independent experiments performed on seven mice. (g) Perivascular macrophages (F4/80) (yellow arrowheads) occur between the smooth muscle actin layer of the arterioles and the laminin α1+ pial BM. Boxed area is enlarged. The diagram in (g) showing the location of the different images. Scale bar: (a, b) 30 µm, (c,) 25 µm, (e) 40 µm, (d, f, g) 20 µm. Images shown are representative of three independent experiments performed on three mice.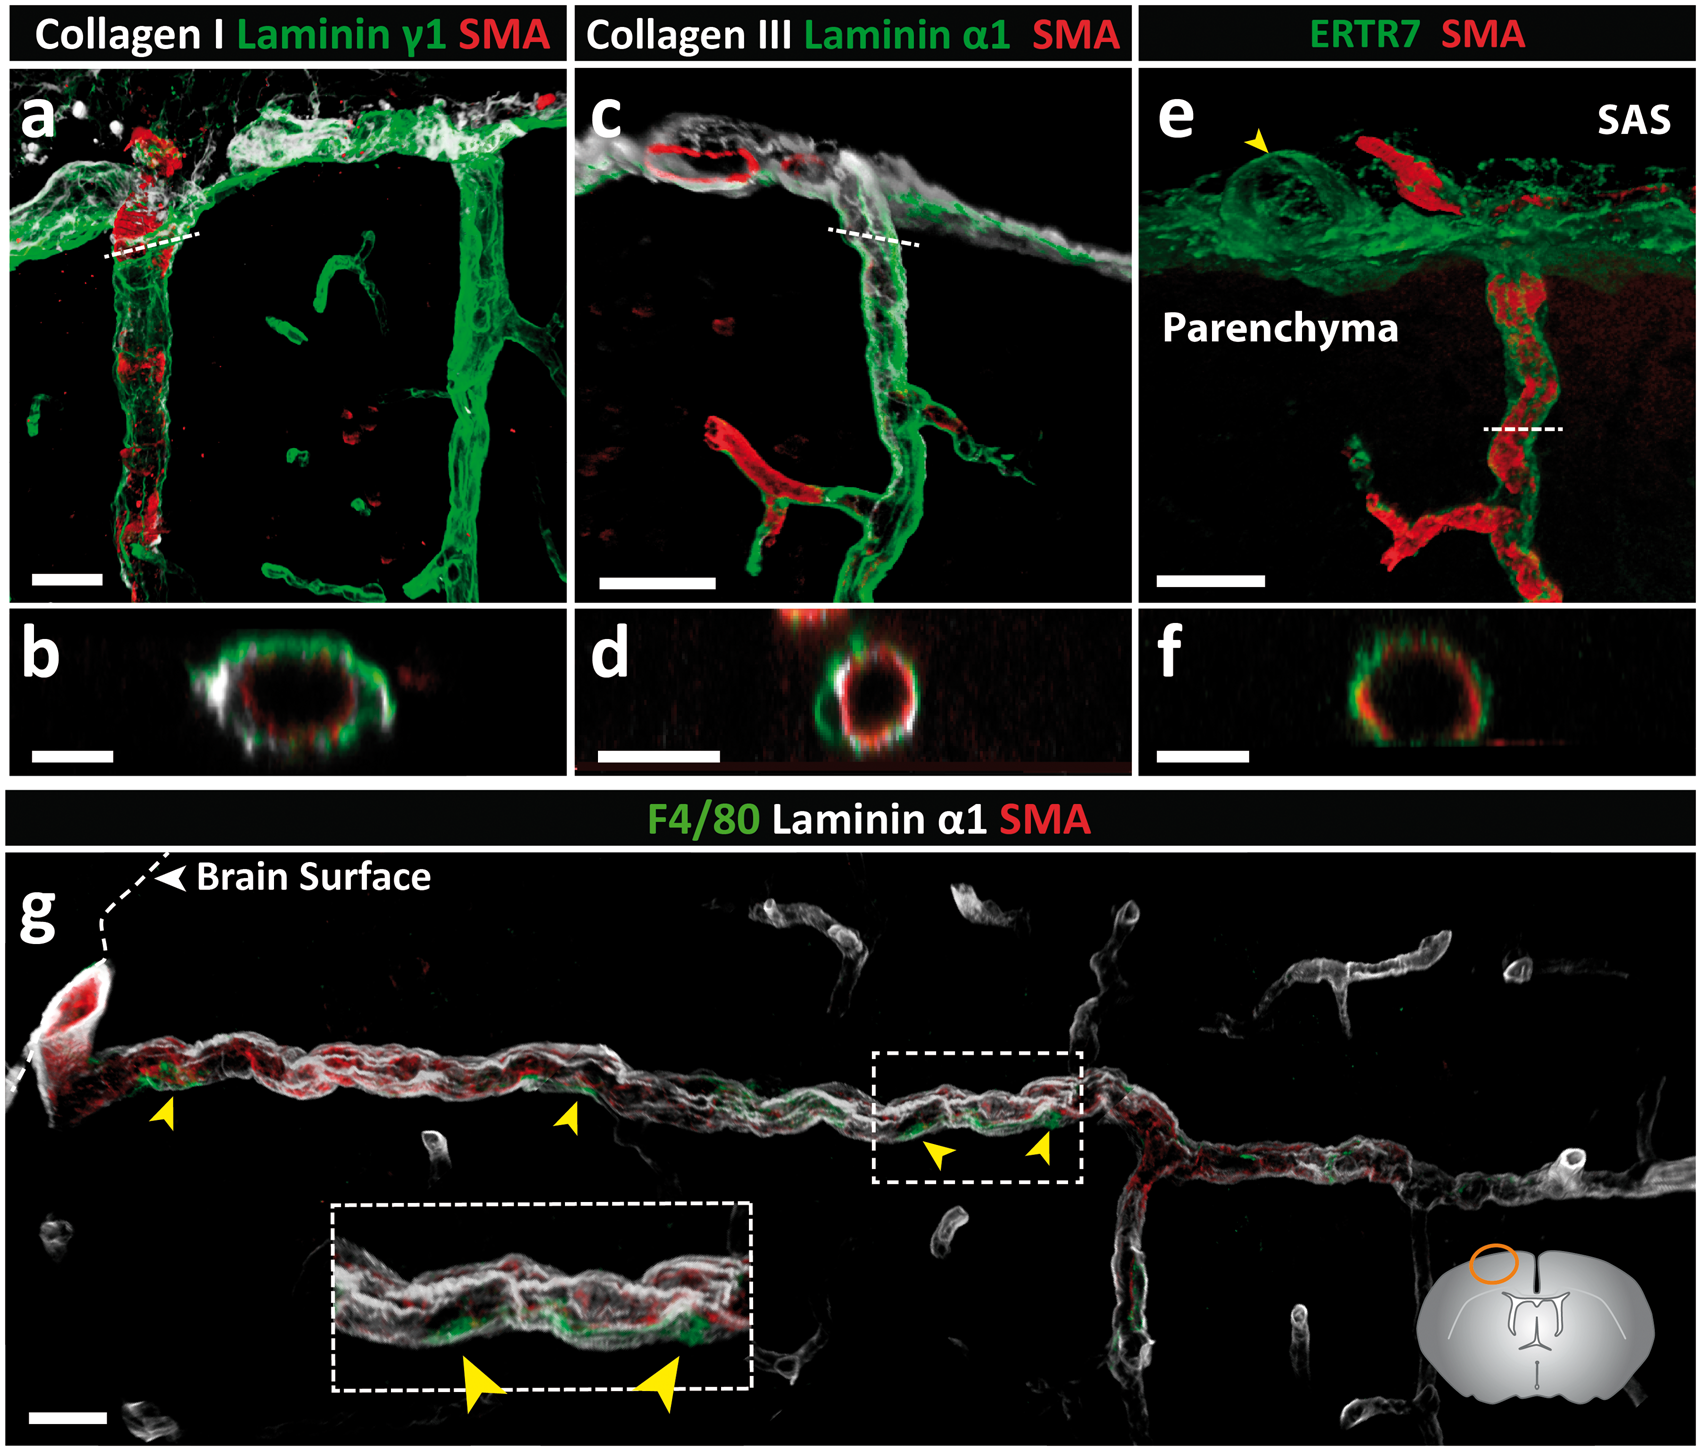
Along vessels where SMA+ cells are no longer detected and laminin α1 and plectin+ cells end abruptly (inset in Figure 1(f)), and also at the level of capillaries, postcapillary venules and venules, only the laminin α2+ parenchymal BM and AQP4+ astroglia are detected (Figure 2(ci) and (cii)). Double staining for endothelial laminins α4 or α5 versus parenchymal laminin α2 revealed distinct polarized staining patterns both in capillaries and venules (Supplemental Figure 5), suggesting the potential continuation of two separate BMs, and hence, the possibility of a perivascular fluid compartment between them.
Tracer studies with intrathecally infused IgG
The use of the cellular and BM markers described above suggests the existence of a perivascular compartment that commences at the brain surface surrounding arterioles, where it is defined by a spatially distinct layer of smooth muscle cells and an outer laminin α1high, laminin α2low parenchymal BM. From capillaries to veins, the inner and outer borders of this perivascular compartment become more difficult to distinguish at the light microscope level, but remain molecularly detectable, with the inner border being defined by the laminin α4 or laminin α5 positive endothelial BM and laminin α2 marking the outer parenchymal BM. To investigate whether this compartment plays a role in conducting fluid and to assess its relationship to the CSF, we performed tracer studies involving infusion of goat anti-rabbit IgG-conjugated to Alexa Fluor 488 into the cisterna magna.
As tracer studies in mouse are hampered by the small volume of CSF and, consequently, difficulty in delivering detectable amounts of tracer using physiological infusion rates, we employed rats for our tracer studies, allowing larger intracisternal infusion volumes and giving higher signal-to-noise ratios. We first characterized laminin chain staining patterns in the rat brain and confirmed the same pattern of results as observed in mouse tissues (Supplemental Figure 7). Importantly, clear separation of vascular BMs and parenchymal borders was possible using laminin α4 or α5 and laminin α2, respectively, from arterioles through to veins.
Intracisternal infusion of 80 μl of IgG tracer was performed with animals in a prone position; a constant infusion rate of 1.6 µl/min, which is approximately half the rate of CSF production in the rat (∼4 µl/min),69,70 was used as such a rate does not appreciably affect intracranial pressure.
71
The use of laminin chain specific antibodies to define the localization of the infused tracer in brain sections was restricted due to their non-specific binding to the infused goat anti-rabbit IgG. Brain sections were therefore stained with a mouse anti-human laminin γ1 chain antibody, which marks all BMs (e.g. laminin 411, 511, etc.) but nevertheless permits distinction of the inner borders of the vessels and the outer pial/parenchymal BMs. Figure 5(a) shows the distribution of tracer at the brain surface, revealing association with the arachnoid and pial BMs as well as the arterioles penetrating into the brain and, to a limited extent, the venules leaving it, which was confirmed by co-staining with anti-laminin γ1 (Figure 5(b)). The reticular staining between the arachnoid and pial layers probably represents the trabeculae of the subarachnoid space. The fact that these structures are not laminin γ1 positive supports their fibrillar collagen nature.63,64 Indeed, collagen types I and III are abundantly expressed in the subarachnoid space of mice and are also associated with larger penetrating arterioles and venules (Figure 4(a) to (d)).
Intracisternally infused immunoglobulin G (IgG) tracer studies in the rat. Tracer (goat anti-rabbit IgG-Alexa Fluor 488) was infused into the CSF of adult rats via the cisterna magna at a rate of 1.6 µl/min for 50 min; 100 µm thick sections were stained with the mouse anti-human laminin γ1 antibody. (a) At the surface of the brain, tracer associated with the arachnoid and pial layers and the smooth muscle cells of arteries. A limited amount of tracer associated with venules close to the surface of the brain (yellow arrow). Macrophages (yellow arrowhead) in the subarachnoid space phagocytise the tracer. (b) Laminin γ1 staining showing that tracer associates with both the arachnoid and the pial BMs, and laminin γ1-negative trabeculae composed of fibrillar collagens (white arrowhead). (c–e) A longitudinal optical slice (taken from f) showing the accumulation of tracer around the smooth muscle cells of a penetrating arteriole; (g, h, i) corresponding cross-section images show tracer accumulation in smooth muscle BMs (white arrowhead) and parenchymal BMs (white arrow) but not in endothelial BMs (yellow arrow). (j) Highlighted area in (f) shows tracer around capillaries (white arrowheads). (k) Tracer is detectable around a penetrating cortical artery down to the level of capillaries (white arrowheads). Boxed areas in k (i, ii) are shown at higher magnifications to the left. Scale bars: (a) 50 µm, (b, f) 30 µm, (c–e, g–j) 20 µm, (k) 45 µm. Images shown are representative of three independent experiments performed on three rats.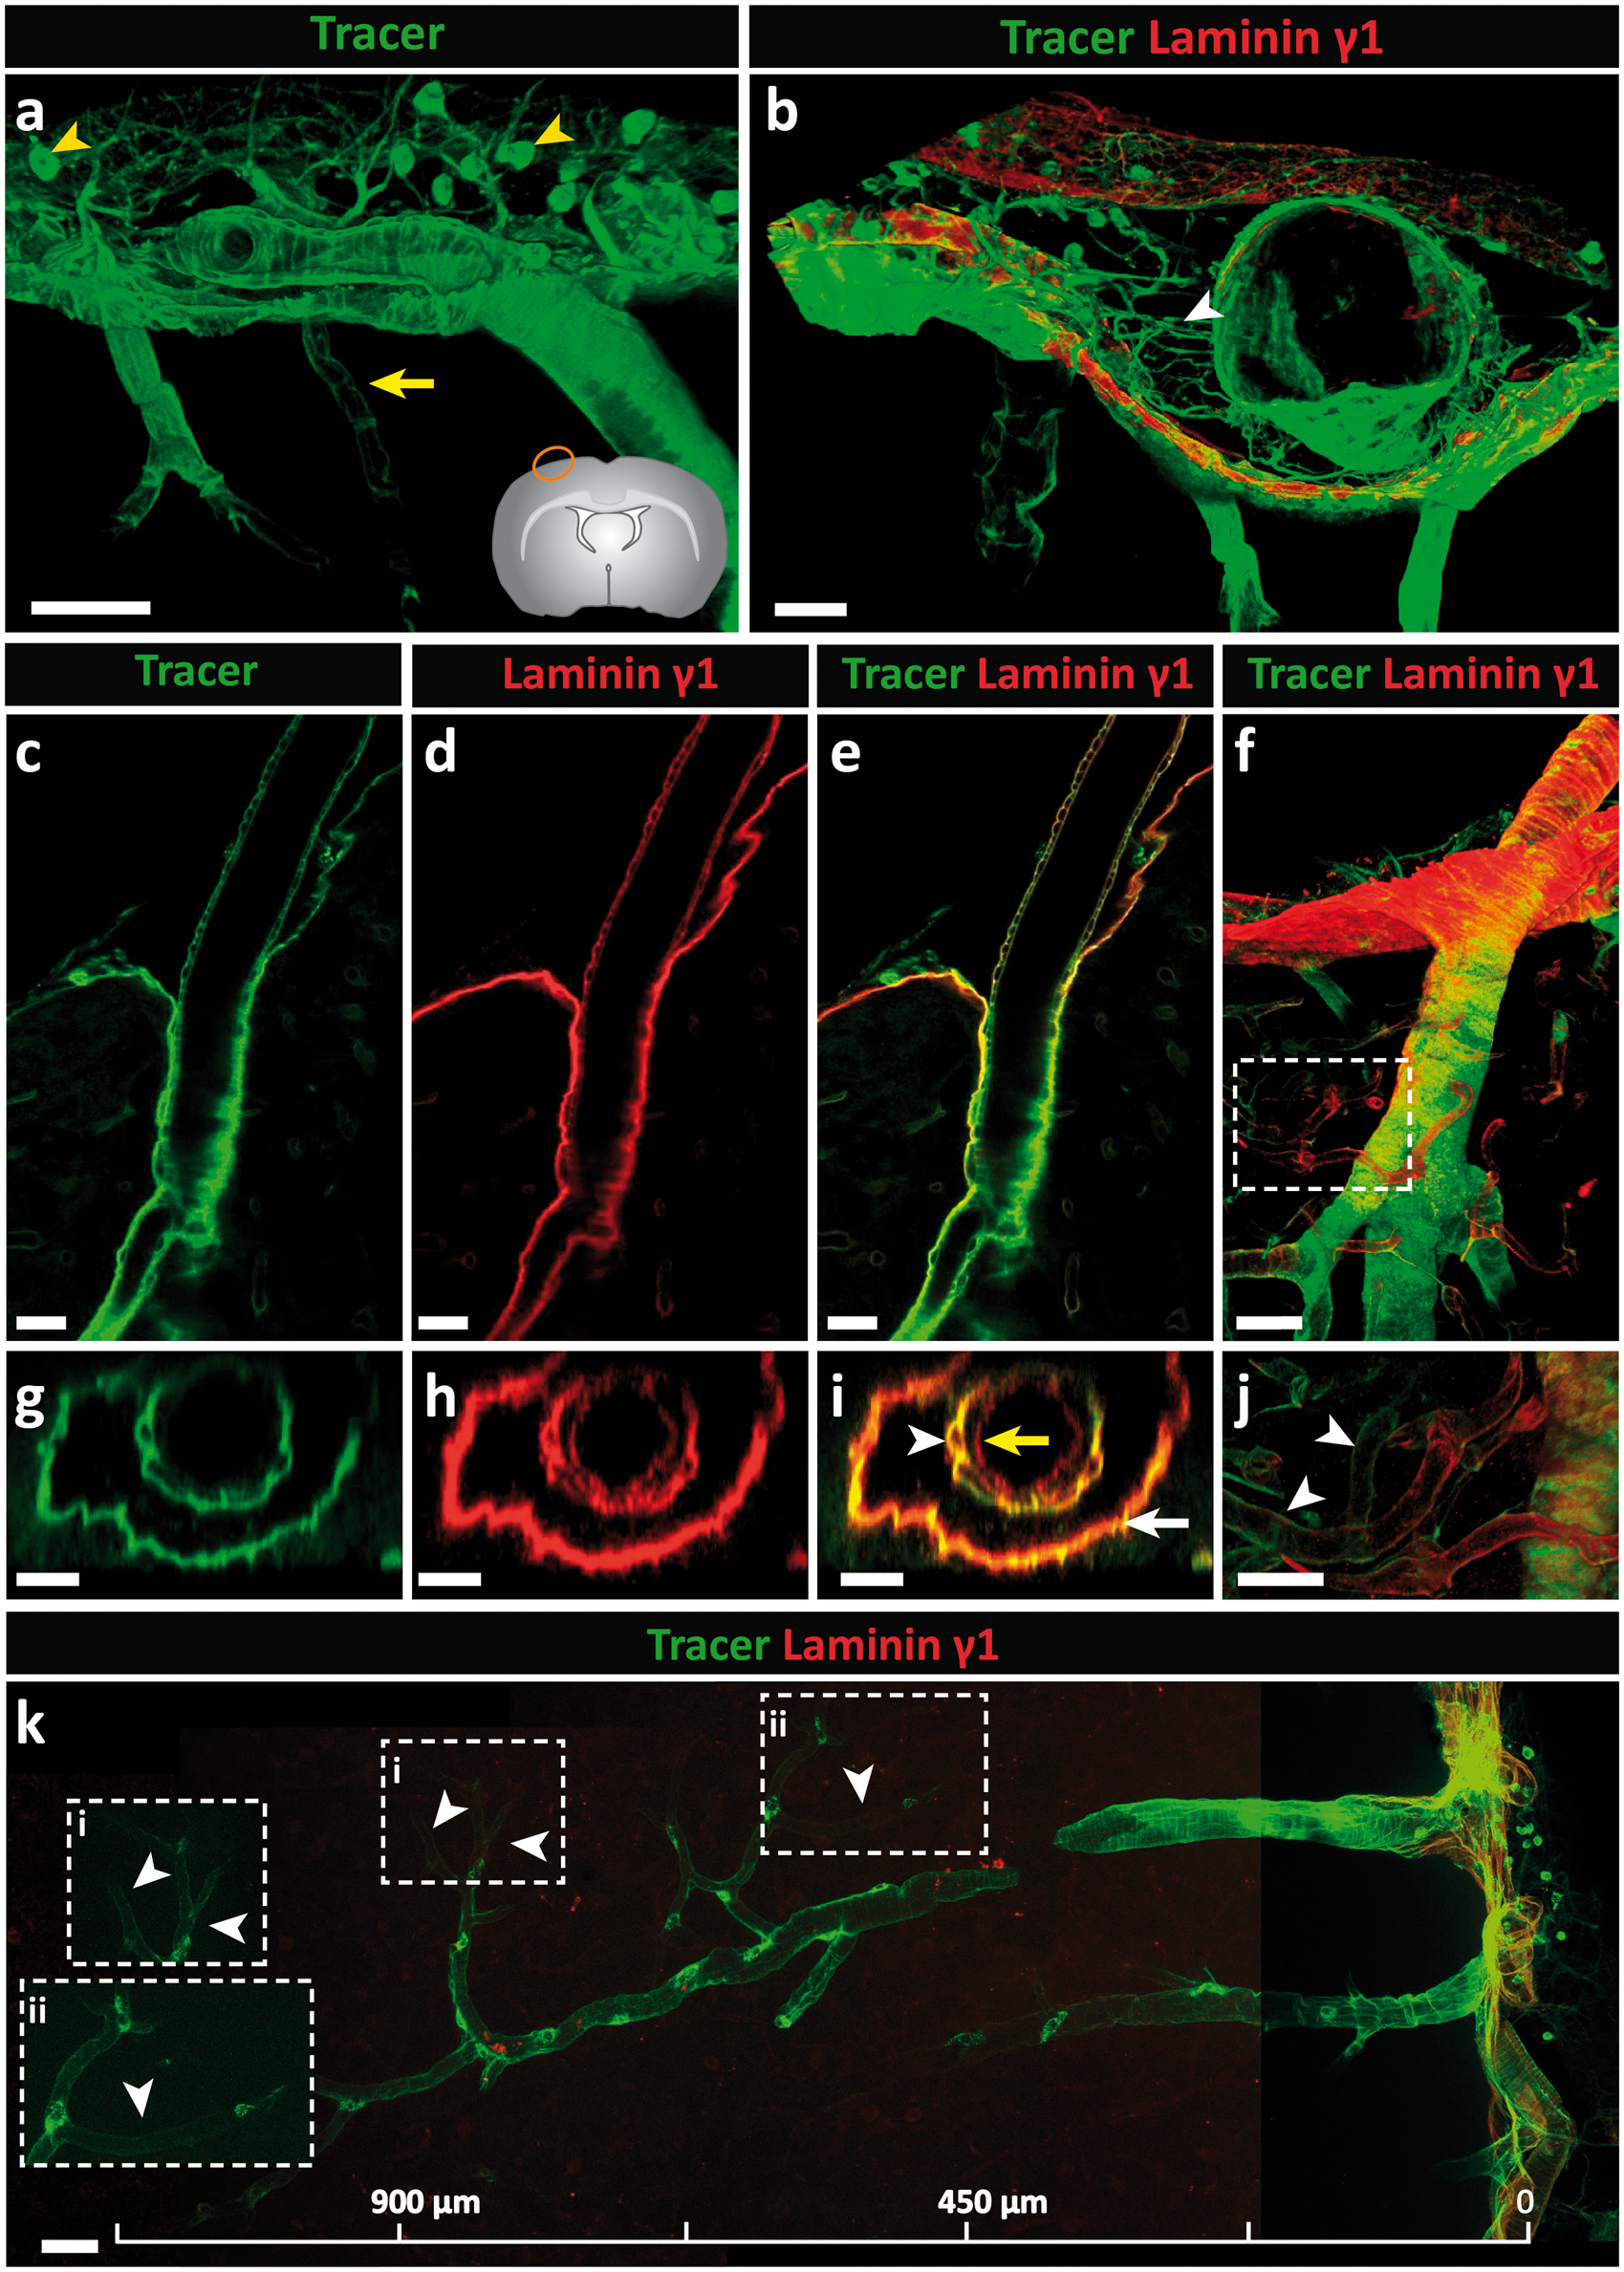
The round cells that intensely take up tracer in the subarachnoid space and surrounding vessels are macrophages as suggested by their location and positive co-staining with Iba-172 (Supplemental Figure 8). In addition, tracer intensely decorated arteriole walls (Figure 5(c)), which is more precisely shown with a longitudinal optical slice, and reveals tracer accumulation in the BMs of vascular smooth muscle cells and the pial/parenchymal BM but not in the endothelial BM (Figure 5(c) to (e)). Optical cross-sections reinforce the absence of tracer in the endothelial BM (Figure 5(g) to (i)). Importantly, tracer decoration of the pial/parenchymal BM indicates direct access of CSF to the perivascular pathways surrounding arterioles. A longitudinal view of an arteriole penetrating into the CNS shows the persistence of tracer along the vessel wall down to the level of capillaries (10 µm diameter), suggesting perivascular IgG transport from arteriole to capillaries (Figure 5(f), (j) and (k)).
Discussion
We show here that by using plectin, E-cadherin and laminin α1, α2 and α5 as markers, it is possible to distinguish the pial and arachnoid layers at the surface of the brain; the arachnoid is E-cadherin+ and plectin+ associated with a laminin α5+ BM, while the pial layer is E-cadherin− and plectin+ associated with a laminin α2low, laminin α1high BM. By using laminin α4 or α5 as markers of the endothelial and smooth muscle BMs together with SMA to define arterioles, it was possible to define perivascular compartments surrounding different vessel types (Figure 6). Such analyses revealed a clear perivascular compartment at the level of arterioles but also the persistence of two molecularly distinct BMs and, hence, potentially a perivascular pathway through to the level of capillaries, postcapillary venules and veins. This was further supported by accumulation of CSF-infused Alexa Fluor 488-IgG tracer not only around arterioles but also around capillaries. This suggests that CSF-infused substances could potentially move from the subarachnoid space to perivascular pathways of arterioles, capillaries, venules and veins, without passage through the CNS parenchyma.
Schematic diagram showing the cellular and extracellular matrix markers of cerebral vessels and potential perivascular compartments. Depicted is a leptomeningeal artery in the subarachnoid space as it penetrates the brain parenchyma and gives rise to an arteriole, capillary and finally a post-capillary venule. The subarachnoid space is bordered by the inner E-cadherin+, plectin+, laminin α5+ arachnoid epithelial layer and the E-cadherin−, plectin+ laminin α1+ pial epithelial layer, the latter lying subjacent to the GFAP+ glial limitans and its associated laminin α2low BM. ERTR7+, collagen types I and III positive fibroblasts exist in the subarachnoid space and surround arteries in the leptomeninges. The ERTR7+, SMA+ penetrating arteries are ensheathed by the pial layer and glial limitans, and their respective BMs, as they penetrate the CNS allowing for a perivascular compartment to form between the outer smooth muscle cell layer of the arteriole and the pial border to the CNS parenchyma. The pial layer and its laminin α1+ BM end abruptly at the transition from arteriole to capillary as defined by the loss of smooth muscle actin staining. However, the laminin α2high parenchymal BM produced by the GFAP−, AQP4+ astroglial layer continues to the level of capillaries, postcapillary venules and venules and is subjacent to the laminin α4/α5 positive endothelial BM, thereby, providing a potential route for passage of solutes from the subarachnoid space to the capillaries, postcapillary venules and venules.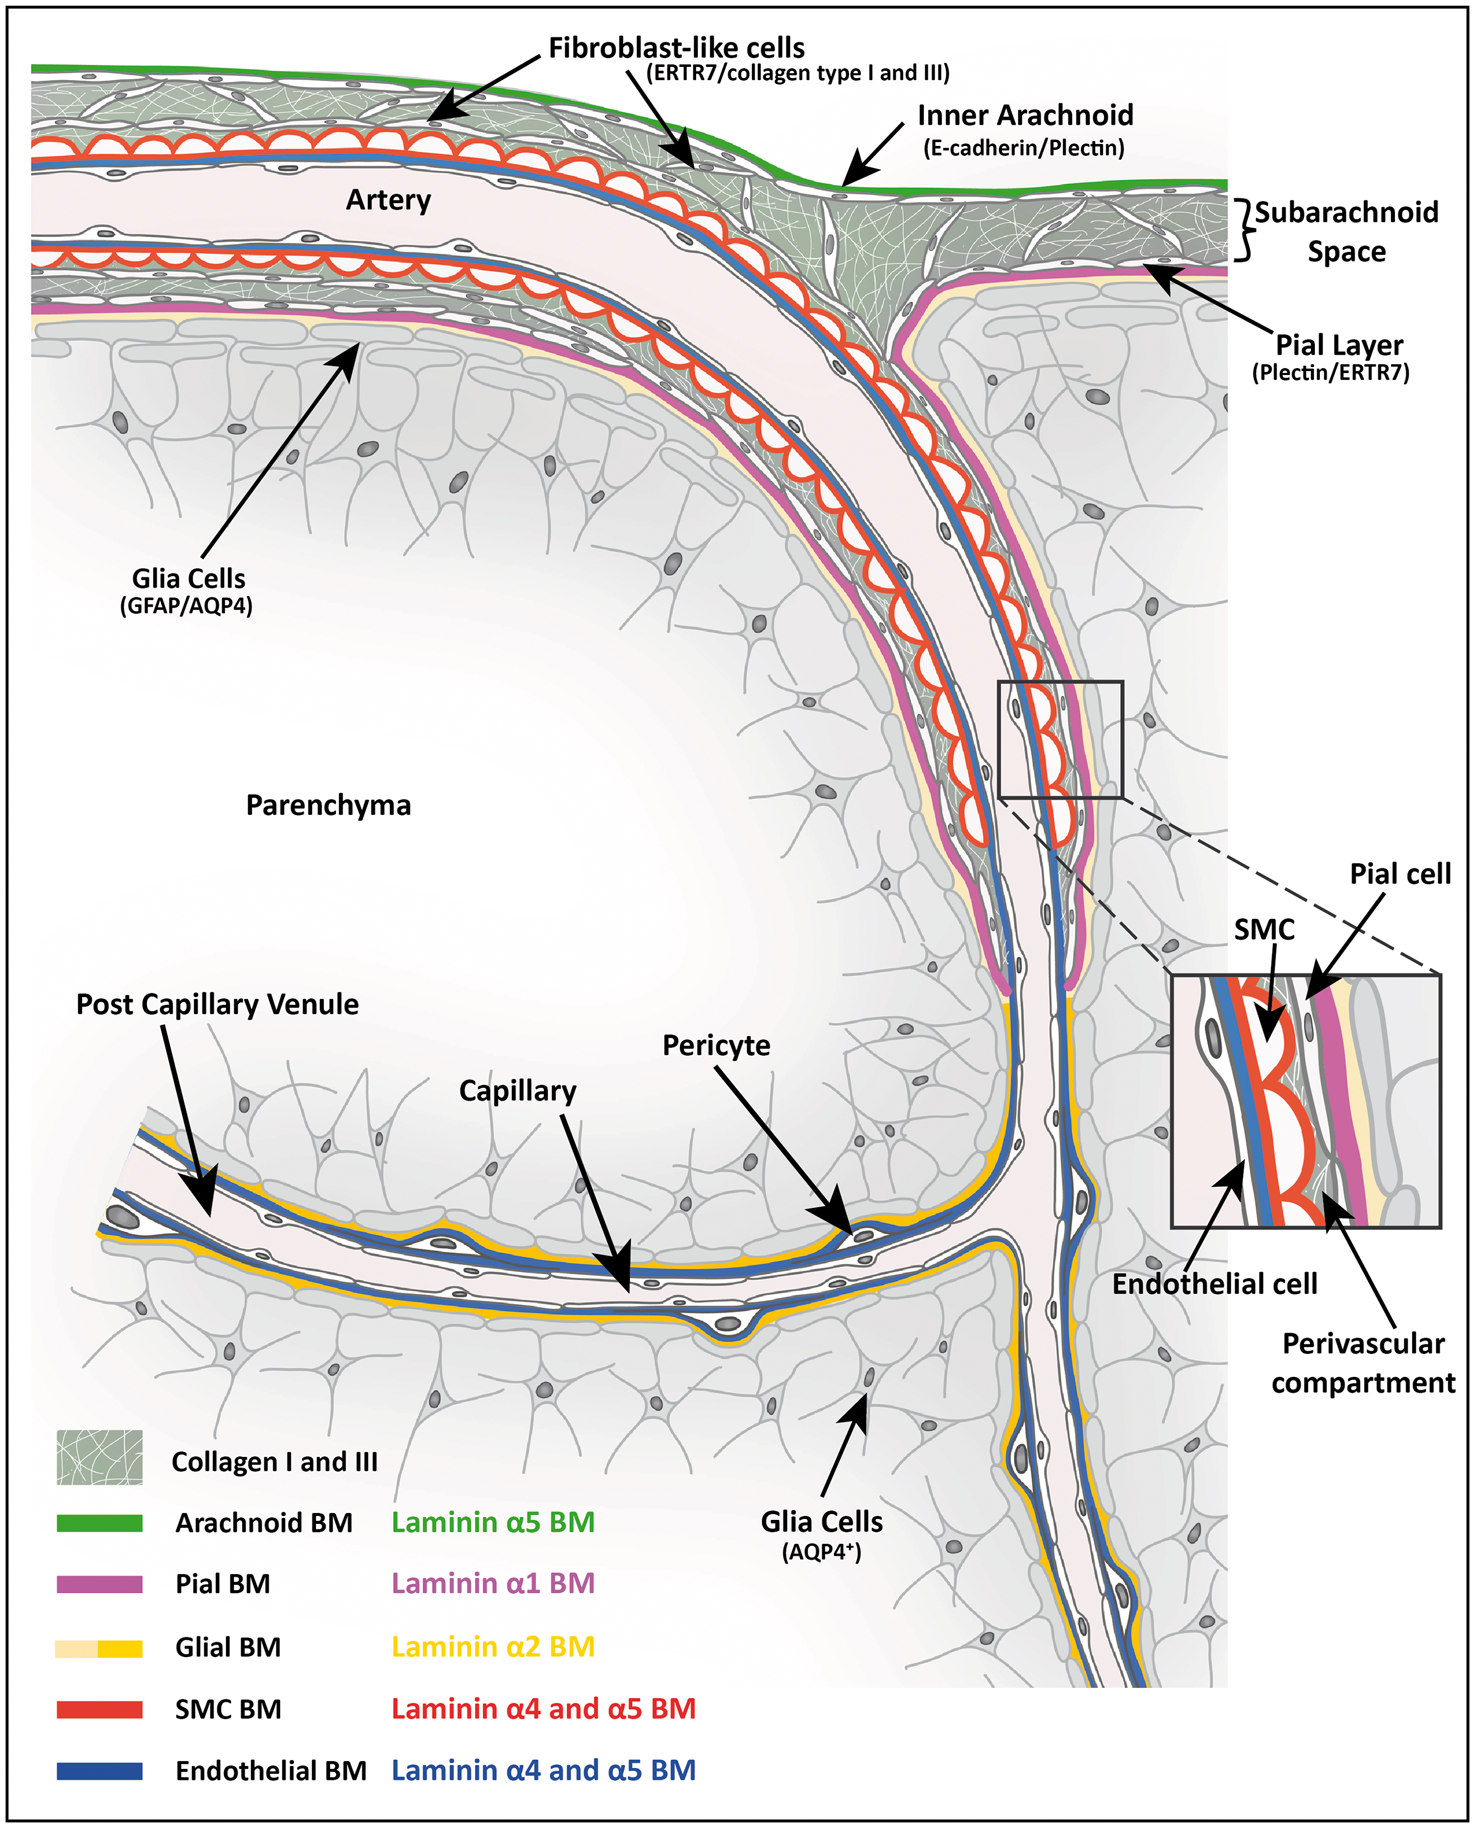
The close association of laminin α1 with the plectin+ pial cells suggests that it is produced by these cells, consistent with the epithelial origin of this laminin chain 53 and previous in situ hybridization studies performed on developing mouse brains.31,54,55 The presence of laminin α1 and plectin ending prior to the capillaries therefore suggests that the pial layer co-migrates with penetrating arteries and persists to a defined level in accordance with previous EM data from human brain.1,3,4,6,25 Tracer studies performed here also indicate that this morphological change does not restrict the movement of CSF beyond this point.
The absence of a laminin α1 BM enveloping arteries or veins situated in the subarachnoid space suggests the absence of pial or arachnoid epithelial cells surrounding these blood vessels. This is in contrast to previous electron microscopy morphological studies, which showed the existence of a continuous layer of cells along the brain surface that extended along the length of leptomeningeal vessels in the subarachnoid space. The association with the brain surface led to the interpretation that these cells were pial epithelial cells.1,2,6,25,73–75 Such epithelial cells, however, should produce a BM, which was not detectable in our studies or in EM studies.2,63,64 Rather, we found the interstitial matrix proteins, collagen types I and III, in the subarachnoid space, suggesting the association of fibroblastic cells with the leptomeningeal vessels. This was substantiated by detection of ERTR7, a reticular fibroblast marker, 76 around arteries and veins in the meninges as well as around penetrating arterioles and venules in the CNS parenchyma. 77 It is also consistent with the recent identification of PDGFRα-positive fibroblasts within the meninges of new-born mice 78 and the reported absence of BM surrounding leptomeningeal cells around arteries in human brain. 6 It might be, therefore, that the ERTR7+ cells surrounding leptomeningeal vessels are continuous with the pial layer but that they change their profile and become more fibroblast-like when they lose contact with the gial limitans, which would be consistent with the published EM data.1,29
While both the laminin α1+ pial and laminin α2+ parenchymal BMs occur at the surface of the brain and around penetrating arterioles, only the laminin α2+ parenchymal BM continues beyond the level of capillaries to post-capillary venules and veins (Figure 6). The weak staining for laminin α2 at the brain surface and surrounding SMA+ arterioles, compared to the strong staining around capillaries, venules and veins, suggests the existence of different phenotypes of astrocytes, as previously reported, 62 that express different levels of laminin α2 depending on their location. Our data suggest that GFAP+AQP4+plectin+ astroglia at the brain surface and surrounding SMA+ arterioles express low levels of laminin α2, while GFAP−AQP4+plectin− astroglia are associated with the laminin α2high BM that unsheathes the remaining vasculature. Interestingly, molecular identification also showed invagination of only the pial layer and not the arachnoid layer into the sulci. This has also been shown for humans with EM1,29; however, the absence of molecular markers to distinguish between pia and arachnoid epithelia has often resulted in confusion about the connection of the meningeal compartments and their possible contribution to physiology including fluid flow pathways.
The localization of laminin α4 and α5 in vascular BMs underlying the endothelium and encasing individual smooth muscle cells but not in the parenchymal BM indicates that the parenchymal BM is distinct from vascular BMs. Therefore, laminin α4 or α5 staining together with laminin α2 staining permit clear definition of a perivascular compartment which is evident at the level of arterioles, capillaries and post-capillary venules (Figure 6). 32 These perivascular compartments thus encase adventitia, leptomeningeal cells and perivascular macrophages and, as discussed above, fibrillar collagens and fibroblasts, in accordance with previous EM studies.1,6,8,26 Even at the level of capillaries where EM studies have suggested fusing of the two BMs,79,80 a clear molecular orientation of laminin α2 relative to laminin α4/α5 persists, raising the possibility that a perivascular route could exist from the arteriole through to the level of capillaries and beyond. This explains the detection of two biochemically distinct BMs, separated by a cuff of infiltrating leukocytes, in postcapillary venules during neuroinflammation,31,32 the separation of the two BMs along capillaries in the striatum by fluorospheres after intra-parenchymal injection, 9 as well as our result demonstrating the accumulation of intracisternally infused Alexa Fluor 488-IgG tracer in arterioles through to the level of the capillaries. 15
Importantly, analysis of rat tissue performed here showed the same laminin isoform distribution in association with cerebral blood vessels as we found in the mouse. Limited studies on human multiple sclerosis tissues suggest the same, with laminin α4 and α5 occurring in endothelial BMs and laminin α2 marking the parenchymal BM at the level of capillaries and post-capillary venules. 81 This indicates that the markers identified here are not just specific for the mouse but relevant across species.
Our tracer studies revealed accumulation of Alexa Fluor 488-IgG around arterioles and capillaries, and more limited signal around venules near the brain surface. The tracer signal around venules is probably derived from the CSF and is less than around arteries because of a considerably smaller perivascular compartment. It is likely that with increasing time more tracer would accumulate around venules as it moves along the perivascular route. This is suggested by studies employing longer tracer infusion times and analysis of tracer localization at later time points after infusion, which show accumulation of tracer around capillaries 15 which is not seen in studies employing short tracer infusion times and /or analysis of tissue immediately after tracer infusion.12,23,82 We chose IgG, a macromolecule of ∼10 nm, 56 as a tracer because it is one of the main proteins found in the CSF83,84 and, furthermore, many of the drugs used for treating CNS pathologies are antibodies or are antibody-based.85,86 Therefore, the demonstration of IgG transport within and access to BMs at different sites might have important consequences for the effectiveness of CNS-directed immunotherapies involving antibodies. The limited entry of IgG tracer observed from the perivascular compartment into the CNS parenchyma is consistent with the barrier function of the parenchymal BM.15,36–42 It has been proposed by Weller et al. that the influx of CSF to the brain occurs along the outer aspects of the perivascular compartment surrounding cortical arteries (i.e. the laminin α1/α2 parenchymal BM/glia limitans), while efflux of ISF occurs along its inner aspects (i.e. laminin α4/α5 BMs of capillaries and smooth muscle cells of arterioles).2,8,9,87 While we have not addressed the efflux of molecules from the ISF here, we propose that in the case of influx, the outer aspects of the perivascular compartment include both the laminin α1/α2-positive glia limitans, the outer border of the smooth muscle BMs and the interstitial collagen that lies between these two BMs, which could collectively act as a ‘conduit’ for the transport of a variety of macromolecules, as has been described in lymph nodes. 88 This would make it theoretically possible for flow to occur along the entire vessel bed given the potential existence of a perivascular compartment beyond capillaries.
The movement of molecules along this perivascular pathway from arteriole to venule/vein is also likely to be controlled by the barrier and permeability properties of the endothelial and parenchymal BMs that are closely juxtaposed around capillaries and venules. The tight network structure of BMs and their high negative charge permits the free migration of smaller macromolecules with low charge such as ferritin (13 nm) 44 but larger or highly charged molecules will be retained for long periods or perhaps even repelled.21,44 Thus, these properties will influence not only the movement of molecules across the BM from the perivascular space into the CNS, but also the movement of molecules along the narrowing perivascular compartment towards the capillaries and then the venules. As astrocyte endfeet lack tight junctions, these properties are also likely to define the permeability of the parenchymal border. It is possible that soluble tracer in fluid compartments may be washed away during perfusion and tissue preparation, leaving behind only the tracer that was adjacent to fixable structures, e.g. basement membranes or fibrillar collagens of the vessels or pia. Interestingly, CSF-infusion of tracer decorated smooth muscle BMs of arterioles but not the endothelial BM, as reported also by others. 12 It is likely that the permeability characteristics of the outer smooth muscle basement membrane hinder transport of the large IgG protein tracer, such that the endothelial BM was less accessible.
The existence of such a perivascular pathway continuum from arterioles through to venules/veins may explain live imaging studies 10 that have challenged the historical concept of bulk fluid flow of the CSF predominantly in ventricular and subarachnoid spaces, with minimal mixing and exchange with the ISF in the brain parenchyma. Our data suggest that, in part, the accumulation of tracer around venules detected by live imaging could arise from its passage through a perivascular pathway, rather than convection transport through the brain parenchyma; our data would therefore argue against the recently proposed ‘glymphatic’ clearance 10 which has been challenged by others.22,23,15 Earlier studies using HRP as a tracer have already suggested a perivascular route in larger mammals5,14,89 but the details of this older work have received little attention. Transport of molecules along this pathway will be defined by a molecule’s weight, size, geometry and charge. 90 Iliff et al. 10 noted that large molecular weight molecules (2000 kDa dextran) within the CSF in the subarachnoid space entered the perivascular compartment surrounding arterioles but were confined there, failing to escape the PVS into the extracellular spaces of the brain. Similar observations were made by others using dextran tracers of 500 kDa 12 and 2000 kDa. 23 This size dependence of perivascular solute entry into the parenchyma has been ascribed to the astrocyte endfeet functioning as a sieve 10 ; however, we postulate that the parenchymal BM plays a role in restricting the movement of such large molecules. While BMs may allow smaller macromolecules to pass relatively unimpeded, the large amounts of small molecular weight tracers (with sizes of ∼3 nm or less, e.g. 759 Da fluorophore and 3 kDa dextran) in the CNS parenchyma observed by Iliff et al. 10 may also have resulted from the high pressure application of the tracer molecules into the CSF (with intracisternal infusion rates in the mouse that exceeded CSF production by several orders) and/or the time of analysis. Consistent with this possibility, studies employing more physiological rates of tracer application12,23 have observed the absence of extensive mixing of CSF and interstitial CNS fluid. The movement of molecules and cells across the pial surface and into the CNS parenchyma will also affect the mixing of CSF and ISF. The lack of tight junctions within the pial layer would indicate communication of the CNS with the subarachnoid space; however, the glia limitans and the parenchymal BM clearly contribute to limiting this exchange. Taken together, current results highlight that size is not the only determining factor in deciding whether a molecule can transverse a BM, but that its geometry and charge may also play a significant role.
In conclusion, we have identified molecular markers for the cell layers and BMs in the CNS that (1) allow distinction between the E-cadherin+ arachnoid layer and its laminin α5+ BM, and the plectin+ pial layer and its laminin α1+ BM; (2) clearly identify SMA+ penetrating arterioles surrounded by pia and bordered by laminin α2low astrocyte BMs, and the SMA− venules which lack a pial sheath and are bordered by laminin α2+ astrocyte BMs; and (3) permit molecular characterization of a perivascular space around vessels of all calibres that is connected to the subarachnoid space and potentially constitutes a route for the passage of molecules, depending on their molecular size and charge, along the entire vascular tree. Furthermore, our work highlights the importance of BMs in defining the perivascular compartments, the characteristics of which are also likely to play a role in regulating which molecules are able to cross the astrocyte BM and reach the CNS parenchyma, thus potentially limiting the mixing of the CSF with the brain ISF. This has important implications for the understanding of fluid flow and therefore of molecular distribution including drug delivery to the brain.
Footnotes
Funding
The author(s) disclosed receipt of the following financial support for the research, authorship, and/or publication of this article: This work is supported by grants to LS from the German Research Foundation (SFB 1009 A02, TR128 B03, EXC 1003), the EU FP7 European Stroke Network (grant n202213) and from the SVDs@target consortium, funded by the European Union’s Horizon 2020 research and innovation programme under grant agreement No 666881. Support was also provided by the University of Wisconsin-Madison School of Pharmacy, the Clinical and Translational Science Award program administered through the NIH National Center for Advancing Translational Sciences (NIH UL1TR000427 and KL2TR00428 – R.G.T.), and a National Science Foundation Graduate Research Fellowship (DGE-1256259 – M.E.P.).
Acknowledgements
The authors thank Roxana Carere and Roy Weller for critical reading of the manuscript.
Declaration of conflicting interests
The author(s) declared no potential conflicts of interest with respect to the research, authorship, and/or publication of this article.
Authors’ contributions
M-JH, MEP and JH designed and performed experiments; TD carried out the intensity correlation analysis: NJA and RGT designed some experiments and imparted valuable knowledge about the topic; RGT supervised the tracer study experiment; LS designed experiments and supervised the work; and M-JH and LS wrote the manuscript.
References
Supplementary Material
Please find the following supplemental material available below.
For Open Access articles published under a Creative Commons License, all supplemental material carries the same license as the article it is associated with.
For non-Open Access articles published, all supplemental material carries a non-exclusive license, and permission requests for re-use of supplemental material or any part of supplemental material shall be sent directly to the copyright owner as specified in the copyright notice associated with the article.