
Abstract
Subarachnoid hemorrhage (SAH) in 95% of cases results in long-term disabilities due to brain damage, pathogenesis of which remains uncertain. Hindrance of cerebrospinal fluid (CSF) circulation along glymphatic pathways is a possible mechanism interrupting drainage of damaging substances from subarachnoid space and parenchyma. We explored changes in CSF circulation at different time following SAH and possible role of brain tissue factor (TF). Fluorescent solute and fluorescent microspheres injected into cisterna magna were used to track CSF flow in mice. SAH induced by perforation of circle of Willis interrupted CSF flow for up to 30 days. Block of CSF flow did not correlate with the size of hemorrhage. Following SAH, fibrin deposits were observed on the brain surface including areas without visible blood. Block of astroglia-associated TF by intracerebroventricular administration of specific antibodies increased size of hemorrhage, decreased fibrin deposition and facilitated spread of fluorophores in sham/naïve animals. We conclude that brain TF plays an important role in localization of hemorrhage and also regulates CSF flow under normal conditions. Targeting of the TF system will allow developing of new therapeutic approaches to the treatment of SAH and pathologies related to CSF flow such as hydrocephalus.
Keywords
Introduction
The incidence of subarachnoid hemorrhage (SAH), accumulation of blood in the subarachnoid space (SAS), 1 is approximately 10–20 in 100,000 individuals. Out of about 60% of ictus survivors up to 95% experience permanent disabilities2,3 resulting from brain morphological changes.4–6 The mechanisms of the brain damage following SAH remain uncertain.
The insufficient blood supply due to global vasoconstriction following SAH, delayed cerebral ischemia (DCI) or delayed ischemic neurological deficit, is considered to be a major pathogenic mechanism of the long-term neurologic deficits.7–10 Recent attention has been shifted toward early brain injury (EBI).7,8,10–13 Occurrence of neuronal damage following the SAH is well documented.14–17 Neuronal damage initiated within minutes after the hemorrhage 18 constitutes EBI.19,20 In about 30% of patients, condition deteriorates further without obvious intracranial or systemic causes and is ascribed to DCI, 21 which includes neuronal damage.15,22,23 Numerous mechanisms of early and delayed neuronal damage have been proposed8,13,23 including mechanical factors (intracranial pressure), molecular alterations, ionic disbalance, disturbance of vascular integrity, spreading depression and spreading ischemia.8,13
Following SAH, blood spreads in SAS mixing with cerebrospinal fluid (CSF). 24 Blood and products of hemoglobin degradation are capable to damage neurons directly being introduced into SAS.25–28 SAH also triggers an inflammatory response. Numerous inflammatory mediators are being released into CSF along with neutrophil influx and collectively aggravate neuronal damage.29–31 It is thus conceivable that following SAH various blood products introduced into CSF may exert brain damaging effects.
It has been suggested that CSF through the paravascular space joins the interstitial fluid (ISF) and drains along the paravenous space back to SAS, and further to veins, along the cranial nerves to the neck lymphatic nodes, and to nasal mucosa through the cribriform plate.32,33 This path of bulk flow movement of CSF from SAS along the paraarterial route through the brain parenchyma into paravenous space was named “glymphatic pathway,”34,35 and was suggested to provide path for elimination of waste products from SAS and brain parenchyma under various conditions.32,36–38 Recent data support the suggestion that CSF flow clears potentially damaging solutes from the brain.34,35,39,40 Following the SAH, various blood cells and microparticles appear in SAS. 41 Toxic solutes and particulates delivered into SAS by SAH can be moved along the glymphatic pathways to the sites remote from the hemorrhage and enter the brain parenchyma. 24 It was suggested that microparticles, such as microspheres, are drained differently from the brain parenchyma 39 suggesting that cellular elements are moved differently by the interstitial flow. Overall available observations allow hypothesizing that abnormalities of CSF flow may be an important component of the pathogenesis of SAH consequences.
According to clinical observations, SAH is accompanied by deep disturbances in CSF flow.42–45 The clinically observed hindrance of CSF flow following SAH has been confirmed in animal models.46,47 Using different models of SAH, circle of Willis perforation or prechiasmatic cistern blood injection, and employing methods of dye injections or contrast MRI, it was demonstrated that for 24 h after the SAH, CSF is severely slowed, including clearance of the contrast from the parenchyma. However, the mechanisms and duration of CSF flow abnormalities remain unknown. Observations that CSF flow attenuation can be partially reversed by intraventricular or intracisternal administration of tissue plasminogen activator (tPA) suggest that fibrin deposition in the paravascular space following SAH plays an important role.46,47
Fibrin deposition in SAS results from activation of the extrinsic coagulation cascade by binding of circulating coagulation factor VII (FVII) to integral cell membrane surface glycoprotein tissue factor (TF, coagulation factor III).48–50 Brain expresses high levels of TF51–54 predominantly by astrocytes. 55 TF forms complex with and activates FVII. In turn, complex TF:FVIIa activates factor X, which cleaves prothrombin generating thrombin followed by fibrin generation. 54 It is conceivable that TF may play a critical role in the localization of the blood spread in the SAS following aneurysm rupture by increasing fibrin formation and subsequent slowing of CSF flow. The partial reversal of CSF flow attenuation by tPA administration supports this proposal.46,47
In this study, we demonstrate that SAH-induced hindrance of CSF flow is long-lasting extending previous observations.46,47 We also demonstrate lack of direct correlation between the extend of hemorrhage and severity of CSF flow disturbances. Our experiments suggest the important role of brain TF in the localization of hemorrhage and CSF flow regulation in normal conditions.
Material and methods
Animal experimental procedures were conducted in accord with the U.S. National Institutes of Health “Guide for the care and use of laboratory animals” and in in compliance with the ARRIVE guidelines. All experimental procedures were approved by the Institutional Animal Care and Use Committee of Houston Methodist Research Institute, Houston, TX. Animals were housed in the institutional animal facilities on 12-h day/night cycle with ad libitum access to food and water. Studies were performed in 91 10–14 weeks old male C56BL/6J mice (Jackson Labs). Eleven experimental groups were formed: in 14 naive animas, CSF flow was analyzed using fluorotracers, in 7 naïve animals, distribution of TF and Fibrin was studied; in 4 animals, acute effects of SAH on CSF flow were explored using MRI; in 41 animals, long lasting consequences of SAH were studied (each time point included SAH and sham SAH groups); in 20 animals, we explored effects of TF block on the spread of fluorophores and hemorrhage following SAH. Specific numbers of animals in each group are provided in the Supplemental Table 1. Twelve animals were excluded from the study due to lethality following long-term recovery (4 and 30 days survival groups, 3 and 2, respectively) or leakage of fluorophore during intracisternal injection.
General procedures
Anesthesia was induced by placing animals in the induction chamber at 3% isoflurane in air, after reaching the surgical plane, anesthesia was maintained by 1.5–1.75% isoflurane in 80%/20% N2/O2 mixture delivered by facemask. Core body temperature was maintained at 37℃ using thermoblanket with the rectal probe feedback.
SAH induction
Subarachnoid hemorrhage was induced by monofilament perforation of the circle of Willis as described.56–58 Anesthetized animals were fixed in the supine position. Through the midline incision, left common, external and internal carotid arteries were exposed and carefully separated from the surrounding tissue. Care was taken not to damage vagus and other nerves. All three arteries were mobilized using silk (7–0). The external carotid artery was cut between two ligatures, and the stump was formed. Proline monofilament (6–0) was introduced into the stump and advanced into the internal carotid artery until slight resistance was felt. The filament was advanced further forward for ∼1 mm and withdrawn. Stump was ligated, the wound was closed, and the animal was allowed to recover. In the sham group, filament was advanced to the resistance point and withdrawn without perforation.
SAH scoring
To score the hemorrhage following the circle of Willis perforation, we employed the modified grading scale developed by Sugawara et al.,
59
as this hemorrhagic score scale correlates with the neurological status. After euthanasia, the brain was removed from the skull and high-resolution picture of the ventral surface of the brain was taken. The ventral surface of the brain was divided into six areas based on the anatomical landmarks (Figure 1(c) and Supplemental Figure 1(a)). Rostrally to the pons, the ventral brain surface was divided into quadrants one through four based on the division of the ventral surface by sagittal midline and a perpendicular line passing through the hypophyseal stalk; area 5: from the caudal to the rostral border of the pons; area 6: from the caudal border of the brainstem to the caudal border of the pons. The outer boundary of all sectors was the outer visible contour of the brain. The scoring of the blood distribution and fluorescence distribution was done for each sector and summed up to obtain the summary score. SAH score was based on the visibility of blood: grade 0 was assigned to the segment without subarachnoid blood; grade 1 was assigned to minimum blood presence in the subarachnoid space; grade 2 – moderate blood presence with clearly distinguishable blood vessels; grade 3 – blood obliterated arteries. Scoring (from 0 to 18 by summing up scores of all segments) was done by two independent observers blinded to the experiment. Summary score or score for each segment were used for analysis.
(a) Spread of the dye, Evans Blue 15 min after intracisternal injection. (b) Distribution of fluorescent tracers (Alexa 594, red (1)) and 0.02 µm diameter carboxylated polystyrene microspheres (green, 2) along the paravascular subarachnoid space over the ventral surface of the brain (3) and superimposition of fluorescent and visual images (4) 1 h after their injection into cisterna magna. (c) Graph reflects % of fluorescent area of the area of the segment in six different segments (R1–R6, insert) and summed fluorescence in R1–R4, R5–R6 of the ventral brain surface of fluorophores, microspheres (red boxes, n = 4) in 15 min (blue boxes) and 60 min (green boxes) and Alexa 594 (blue boxes, n = 4), in 60 min (green boxes, n = 7) after the intracisternal administration. Box plot: Line – median, box – 25%–75% percentile, whiskers – non-outlier range.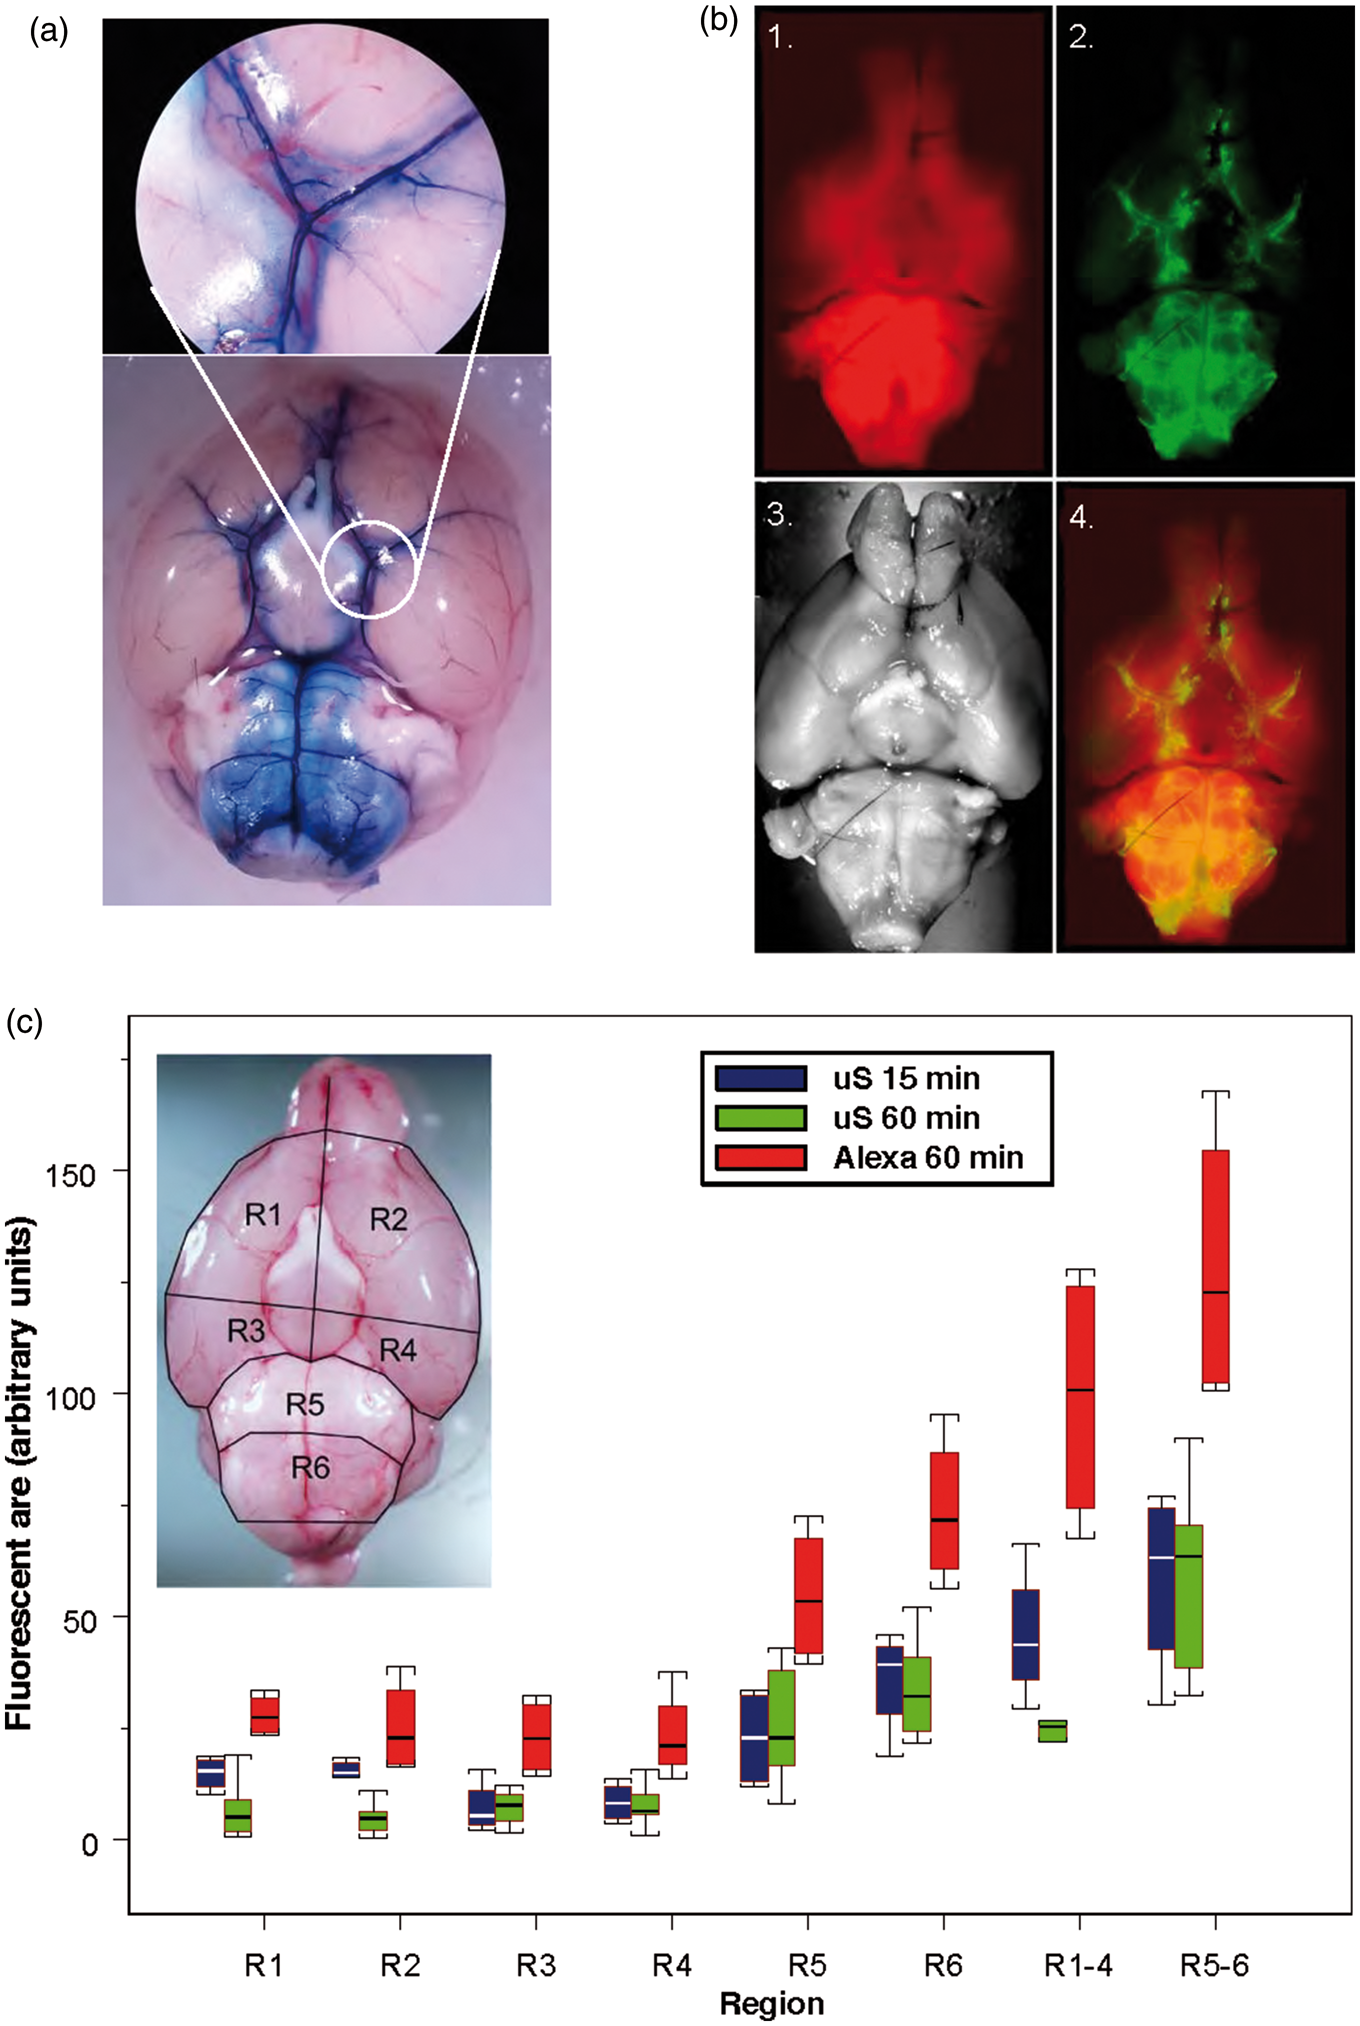
Cisterna magna injection
After anesthetization, animals were placed in the stereotaxic frame and through the midline incision, atlantooccipital membrane was exposed. Needle (36GA) attached to the micromanipulator was introduced under visual control into cisterna magna (CM) for 1–1.5 mm in such way that the needle tip would be in the open subarachnoid space. Injections of tracers were made using micropump at 1–2 µl/min rate. After the injection, the needle was kept in place for 5 min to allow tracer to diffuse and then withdrawn. Immediately after withdrawal, the opening in the atlantooccipital membrane was closed with cyanoacrylate glue to prevent outflow of CSF. The wound was closed and animals were allowed to recover.
Intraventricular injection
For intraventricular injections, anesthetized animals were placed in the stereotaxic frame. After exposure, at the dorsal surface of the calvarium, a small hole (∼1mm in diameter) was drilled (−0.7 mm from bregma, 1.2 mm lateral from the midline). Stainless steel needle (36GA) attached to the micromanipulator was introduced to the depth of 2.0 mm. Injections were made using micropump at a rate of 2 µl/min. After the injection, the needle was left in place for additional 5 min before withdrawal to allow the injectate to diffuse. After the withdrawal of the needle, the bone opening was closed with surgical wax, and the wound was closed. The animal was allowed to recover.
Intracranial pressure
To measure intracranial pressure, after anesthetization and placing in the stereotaxic frame, the dorsal surface of the skull was exposed through a midline incision and a small hole (∼1 mm) was drilled at −0.7 mm from bregma and 1.2 mm lateral from the midline. The Mikro-Tip ™ Pressure catheter, 0.33 mm diameter (Millar, Houston, TX) attached to the micromanipulator was introduced to 2.0 mm depth. After the experiment, the catheter was withdrawn and the hole was closed with surgical wax.
Laser Doppler flowmetry
For regional cerebral blood flow (rCBF) measurement, needle probe (1.5 mm diameter, Moor Instruments, Wilmington, DE) fixed to the stereotaxic holder was placed over the intact skull over the parietal cortex after animal anesthetization and placement in stereotaxic frame. A drop of mineral oil was applied to the skull for optical contact between the probe and the skull.
Arterial pressure
Arterial pressure was monitored through a catheter introduced into the femoral artery using blood pressure transducer (ADInstruments, Colorado Springs, CO).
All data were acquired and digitized using PowerLab (ADInstruments, Colorado Springs, CO) stored on the computer and analyzed by LabChart software package (ADInstruments).
MRI
MRI was performed on a Bruker Biospec 9.4T (Bruker Inc., Billerica, MA) with horizontal bore magnet equipped with a 450 mT/m gradient, and controlled by Paravision 5.1 software. EPI-optimized 35 mm I.D. Temporal FLASH MRI was used to explore the flow of CSF in the SAS cisterns enhancing them accordingly. T1-weighted 3D fast low angle shot (FLASH) imaging sequence was used to image the flow-related redistribution of contrast agent in the CSF. The following imaging parameters were used: TR/TE=3.7 ms/21.4 ms, flip angle = 25°, at high spatial resolution of 78 µm×78 µm×133 µm with a 7.5-min temporal resolution to explore the temporal dynamics of contrast agent.
To study the dynamics of CSF flow, we injected 5 µL of 469 µg/ 1 µL solution of gadopentetate dimeglumine (Gd) (Magnevist®, Bayer Healthcare LLC) into CM using stainless steel tubing (36 GA) attached to the stereotaxic holder at the rate of 0.2 µl/min as described. The first images were acquired about 15 min after the injection with subsequent images acquired every 7.5 min until 45 min after injection. All the images were aligned automatically using ventricular landmarks to an MRI mouse brain atlas for better visualization of the aqueduct and ventricles using Statistical Parametric Mapping version 12 (http://www.fil.ion.ucl.ac.uk/spm/software/spm12/, University College of Lon-don, UK). To aid visualization of the contrast enhancement around circle of Willis after SAH, maximum intensity projection of the image along the horizontal view was reconstructed.
Fluorescent imaging
To evaluate the spread of fluorescent tracer, the fluorescent images of the ventral surface of the brain were taken using standard exposure time by blinded to the experiment observer. Using ImageJ software, color channels were split and equally thresholded after subtraction of the background and converted into binary images. 35 Regions of interests (ROI) corresponding to the ventral surface segments described above were defined for each brain based on the visible images of the particular brain. Percentage of the area of each segment with fluorescence above the threshold was determined for each of the six areas 59 and summed up to produce the overall score of the fluorescence of the ventral surface (Supplemental Figure 1(b) to (e)) or used separately to compare changes in fluorescence in each of the segments.
Brain processing and immunohistochemistry
At the end of the experiment, animals were euthanized, and the brains were harvested. Care was taken to minimize the damage to the surface membranes. Immediately after brain extraction, high-resolution pictures in visible and fluorescent light were taken of the ventral and dorsal surfaces of the brain. Subsequently, brains were fixed in 4% formaldehyde solution for three to four days at 4℃, cryoprotected in 30% sucrose solution for three days and sliced at 10 µm using cryotome.
Whole brain immunohistochemistry
Under deep anesthesia, animals were transcardially perfused with phosphate-buffered saline (PBS) followed by 4% formaldehyde in PBS. After the brains were harvested, they were postfixed in 4% formaldehyde for three days at 4℃. The whole brains were washed for 1 h in 0.3% Triton X-100 PBS solution, pH 7.4 on a shaker at 50 r/min at room temperature and blocked with 2% normal donkey serum in 0.3% Triton X-100 PBS solution for 3 h at room temperature. After blocking, brains were incubated overnight with primary antibodies (rabbit polyclonal anti-mouse full-length fibrinogen, 1:500, Abcam) at room temperature. After washing, samples were incubated with secondary antibodies conjugated with Alexa Fluor 488 or 594 (donkey anti-rabbit, 1:1000, Life Technologies) for 3 h at room temperature. After washing (3 times × 20 min in 0.3% Triton X-100) and rinsing with PBS, brains were visualized using an epifluorescent microscope (Olympus) and pictures were taken using the digital camera with the standard exposure time for all brains.
Brain slices immunohistochemistry
For immunohistochemistry, after the experiment, deeply anesthetized animals were transcardially perfused with PBS followed by 4% formaldehyde in PBS. Following the perfusion, the brain was removed from the skull, postfixed in 4% PFA for 24 h at 4℃ and cryoprotected in 30% sucrose for three days at 4℃. Processed brains were sliced using cryotome at 10 µm sections, mounted on glass slides and processed for immunohistochemistry. Glass mounted slices were washed in 0.3% Triton X-100 for 30 min at room temperature, rinsed in distilled water and air-dried. Non-specific binding was blocked with normal donkey serum for 2 h at room temperature. After blocking, slides were incubated overnight (12–14 h) with primary rat anti-mouse GFAP antibodies (1:500, Life Technologies) and primary monoclonal rabbit anti-mouse TF antibodies (1:500, Abcam). Slides were washed three times for 15 min in 0.3% Triton X-100 in PBS with additional blocking step for 15 min in 2% normal donkey serum and 0.3% Triton X-100 in PBS. Detection was done with donkey anti-rat secondary antibodies and donkey anti-rabbit secondary antibodies conjugated with Alexa Fluor 488 or Alexa Fluor 594 (1:1000, Life Technologies) by incubation for 3 h at room temperature. Slides were washed 3 times × 15 min in 0.3% Triton X-100 in PBS solution, rinsed in PBS and distilled water. In control slices, the primary antibodies were omitted. Stained brain slices were coverslipped with protective Fluorescent Mounting Medium with DAPI (GBI Labs) and sealed. Fluorescent labeling was visualized using Nikon Eclipse TE2000-U microscope, acquired using Roper Camera and processed with Nikon NIS software.
Substances and delivery
Evans blue (EB) (Fisher Scientific) was dissolved in aCSF (Fisher Scientific) to obtain 1% solution. Fluorescent carboxylated polystyrene microspheres suspension (0.02 µm, Life Technologies, Thermo Fisher) was diluted to 1% solids suspension after sonication. Alexa 594 hydrazide (Thermo Fisher) was dissolved in aCSF (Fisher Scientific) to the concentration of 0.5%. All solutions were freshly prepared before the experiment.
Statistics
Statistical analysis was done using SPSS or Statistica 13.0 package. Data presented as MEAN (STANDARD DEVIATION). Non-parametric one-way ANOVA, (Kruskal–Wallis and Mann–Whitney tests with Bonferroni correction were used for non-continuous variable (hemorrhagic score). All other data were tested for normality of distribution and variance equality before one-way ANOVA test followed by post hoc Bonferroni test was used to determine significant differences between groups. Spearmen non-parametric test has been used to determine correlation between two variables. No additional adjustments for variance equality were made. Two-tailed values were used for significance of difference evaluation.
Results
Circulation of CSF under normal conditions
In the first group of experiments, we explored the distribution of tracers (Evans blue (EB) and fluorescent tracer Alexa after injection of 10 µl of tracer solution into CM. In the first group (n = 3), path of CSF flow in the subarachnoid space was visualized using EB (1%, MW 960 Da) as a tracer. Following the CM injection (10 µl, 2 µl/min), dye was allowed to circulate for 1 h before the animal was euthanized. Following the injection, EB was observed in the pontomedullary and interpeduncular cisterns. Rostrally, EB prevalently spread along the arteries of circle of Willis and reached olfactory bulbs. EB was also observed along the initial segments of the posterior, middle and anterior cerebral arteries. Interestingly, EB prevalently delineated vessel walls and perivascular space; however, it failed to spread in the subarachnoid space over the hemispheric convexities (Figure 1(a)).
EB easily binds to albumins, 60 the most abundant CSF protein, 61 which may affect the distribution of EB in the SAS. To explore the CSF flow pathways and distribution of the tracer in the subarachnoid cisterns further, we used fluorescent dye Alexa 594 (MW 758 Da, 0.1%, 10 µl, 1 µl/min) as a low-molecular weight solute (LMWS). In naïve animals (n = 4), we allowed the tracer to circulate for 15 min. Within this time, it was able to fill ventral cisterns and perivascular space of ventral surface arteries reaching olfactory bulbs and readily penetrated brain parenchyma.
To compare the distribution of LMWS and particulates, microspheres, we compared the distribution of LMWS and microspheres (µS) after injection of 10 µl of a mixture of LMWS and µS at appropriate concentration after circulation time of 60 min (n = 4). The highest accumulation of Alexa and µS was in the basal cisterns and along the basal arteries and was comparable after 15 min of circulation, suggesting that LMWS and µS are capable of reaching the olfactory bulbs within this time (Figure 1(b)). The overall distribution of Alexa and µS on the ventral brain surface was comparable to that of EB filling pontomedullary and interpeduncular cisterns and perivascular spaces of circle of Willis and branching arteries. Fluorescence distribution in six defined segments showed highest accumulation of the tracer in pontomedullary and interpeduncular cisterns and along the major arteries of the ventral brain surface (Figure 1(c), Supplemental Table 2). Only very light fluorescence was observed on the dorsal surface of the brain at any time. Analysis of LMWS tracer distribution in the brain parenchyma demonstrated that it readily penetrated the brain parenchyma creating a gradient from the subarachnoid space, which decreased proportionally to the distance from the surface. The gradient distribution of fluorescent dye indicated entrance of the brain parenchyma mostly from the ventral cisterns (Figure 2(a)).
Distribution of the fluorescent microspheres (0.02 µm) and fluorophore Alexa 594 on the ventral brain surface and in the brain parenchyma at different levels 1 h after intracisternal injection in (a) sham-operated animal and (b) immediately following the subarachnoid hemorrhage. Note penetration of the brain parenchyma by Alexa 594, block of the distribution of fluorophores following the subarachnoid hemorrhage, and increase of parenchymal autofluorescence (360/460 emission/excitation) after the SAH. Arrows indicate microspheres.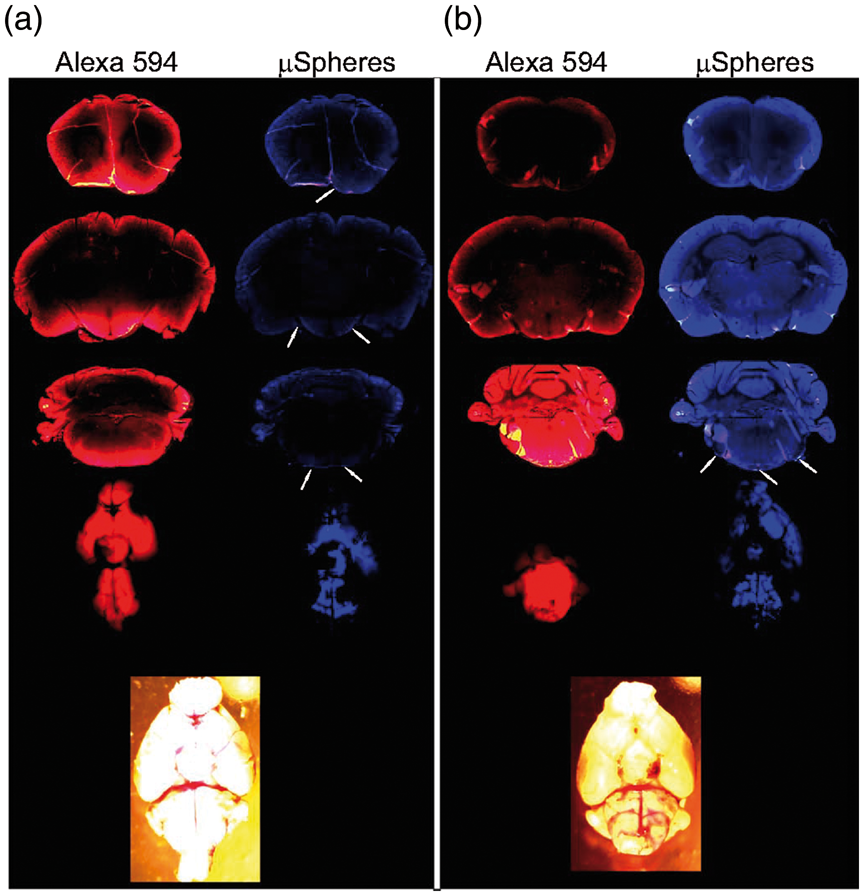
As it was suggested that particulates/cells could be moved by ISF flow differently than solutes, 39 we explored spread of fluorescent microspheres (20 nm in diameter) along the SAS by injecting microsphere suspension (original 2% solids, diluted to 1%, Life Sciences) into the CM either alone (n = 7) or in combination with LMWS (n = 4) and allowed them to circulate for 15 min or 1 h. Microspheres followed the distribution pathways similar to EB and Alexa, i.e. they were prevalently distributed in the infratentorial cisterns: pontomedullary, interpeduncular, spreading along the paravascular path on the basal surface of the brain and reaching olfactory bulbs. Following paraarterial route, they were observed along the initial segments of ascending cerebral arteries (Figure 1(b) and (c)), while only a small amount reached the dorsal surface of the brain within 1 h after the injection. No microspheres were noticed to enter the brain parenchyma (Figure 2(a)). Fluorescent imaging of the ventral brain surface established that most of the pontomedullary area (R5-R6) demonstrated fluorescence, while in the rostral segments (R1-R4), amount of fluorescence was less (Figure 1(c), Supplemental Table 2,). While LMWS was distributed more widely than µS, the pattern of distribution was comparable between the two tracers suggesting that they move in SAS with the CSF flow in a comparable way.
To explore the temporal dynamic of the CSF flow, we used Gd contrast MRI. After the Gd injection into the CM (5 µmol in 5 µl, 0.2 µl/min), contrast quickly filled pontomedullary and interpeduncular cisterns and following paraarterial path reached olfactory bulbs within 15 min (Supplemental Figure 2(a)). Contrast also spread along the proximal segments of ascending cerebral arteries. In 25 min, the contrast was noted along the internal carotid arteries and in cervical lymph nodes suggesting draining of CSF along these pathways. By 45 min, the intensity of contrast in the pontomedullary cisterns started to decrease. No significant contrast accumulation was noted in the subarachnoid space over the hemispheric convexities.
Effect of subarachnoid hemorrhage on CSF flow
SAH model
After establishing pathways and temporal parameters of the CSF flow from the CM, we explored effects of subarachnoid hemorrhage (SAH) on the CSF flow. Perforation of the circle of Willis allowed blood to enter ventral cisterns. In our model, acute lethality due to the hemorrhage was 13% (6 out of 48 animals in this particular study and 4 out of 31 animals participating in other currently ongoing investigations). Following the perforation, rCBF (n = 5) in the ipsilateral hemisphere within 5 s dropped by 80(13)% in 45 s and within an hour remained at 31(30)% below the baseline. Arterial pressure decreased by 13(18)% by 29 s and returned to the baseline of 93.6(17.6) mmHg in 2 min. Intracranial pressure acutely increased reaching a maximum of 290(90)% (from 6.1(2.6) mmHg to 23.8(7.7) mmHg) within 60 s and remained increased by 51(22)% over the baseline by the end 1-hour observation period. Ninety-five (40/42) percent of animals exerted bradypneic response to perforation. While normal period between breaths was 0.9(0.22) s, the first inspiration following perforation was extended to 30.1(26.8) s. In 26% of animals (18 out of 69), apneic period lasted over 1 min. If spontaneous respiration did not restore within 1 min after the perforation, mechanical chest massage was initiated until animal made the first spontaneous breath.
As a result of the circle of Willis, perforation blood accumulated in the ventral cisterns and along the perivascular space. In our model, blood distribution was relatively limited. The summary score of the hemorrhage 4 h after the perforation was 9.6(2.9) (n = 7). Beyond the blood accumulation at the perforation site, blood spreads preferentially along the paravascular paths. Specific scores of hemorrhage for each segment are provided in Supplemental Tables 3 to 5. The amount of blood in the SAS over the hemispheric convexities was limited (Figure 3(a)). Hemorrhage scores were higher significantly (H(3) = 15.934, p = .0012) by 4 h after the hemorrhage compared to the score at 1 h or four days after the perforation (Supplemental Figure 3). Thirty days after the perforation, no visible blood was observed in SAS (Supplemental Table 5).
(a) Distribution of 0.02 µm fluorescent microspheres 1 h after injection into cisterna magna 4 h, 4 and 30 days after SAH or sham procedure in representative animal. (b) Averaged total fluorescence in rostroventral (R1-R4) cisterns and (c) pontomedullary cisterns (R5–R6) in sham (green bars, n = 2–5/group) and SAH animals (red bars, n = 4–7/group). Box plots: Line – median, box – 25%–75% percentile, whiskers – non-outlier range. *One-way ANOVA, F1,9.3931, p = 0.008 (for 1 h) and F1,18.078, p = 0.002 (for 4 h) – significant differences between sham and SAH animals. Rhombs – individual data points.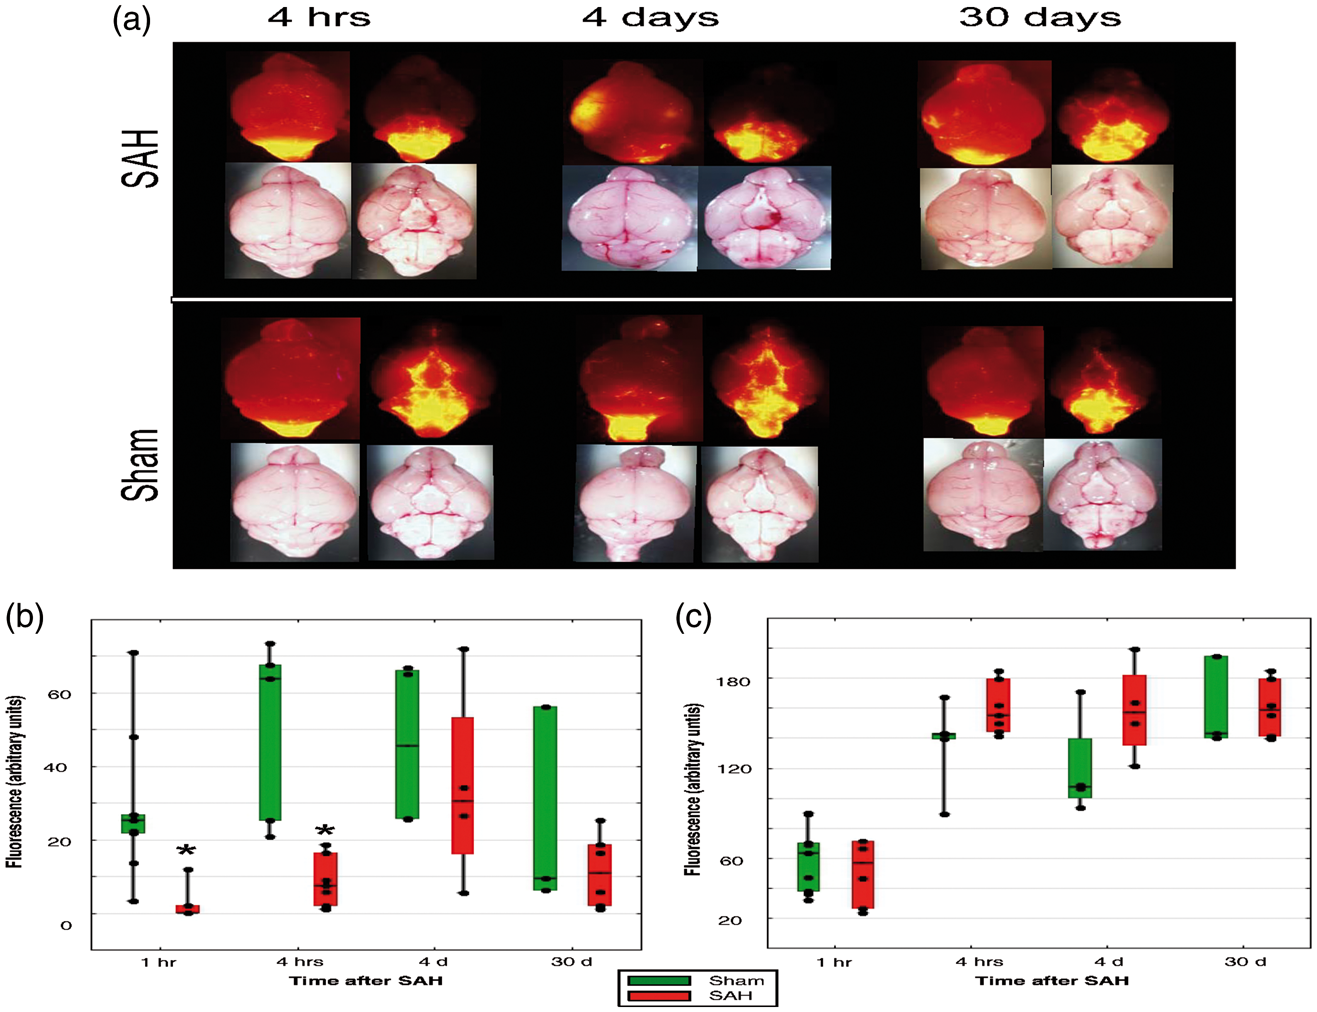
Correlation between fluorescent area of the ventral brain surface segments and hemorrhagic scores in the respective segments.
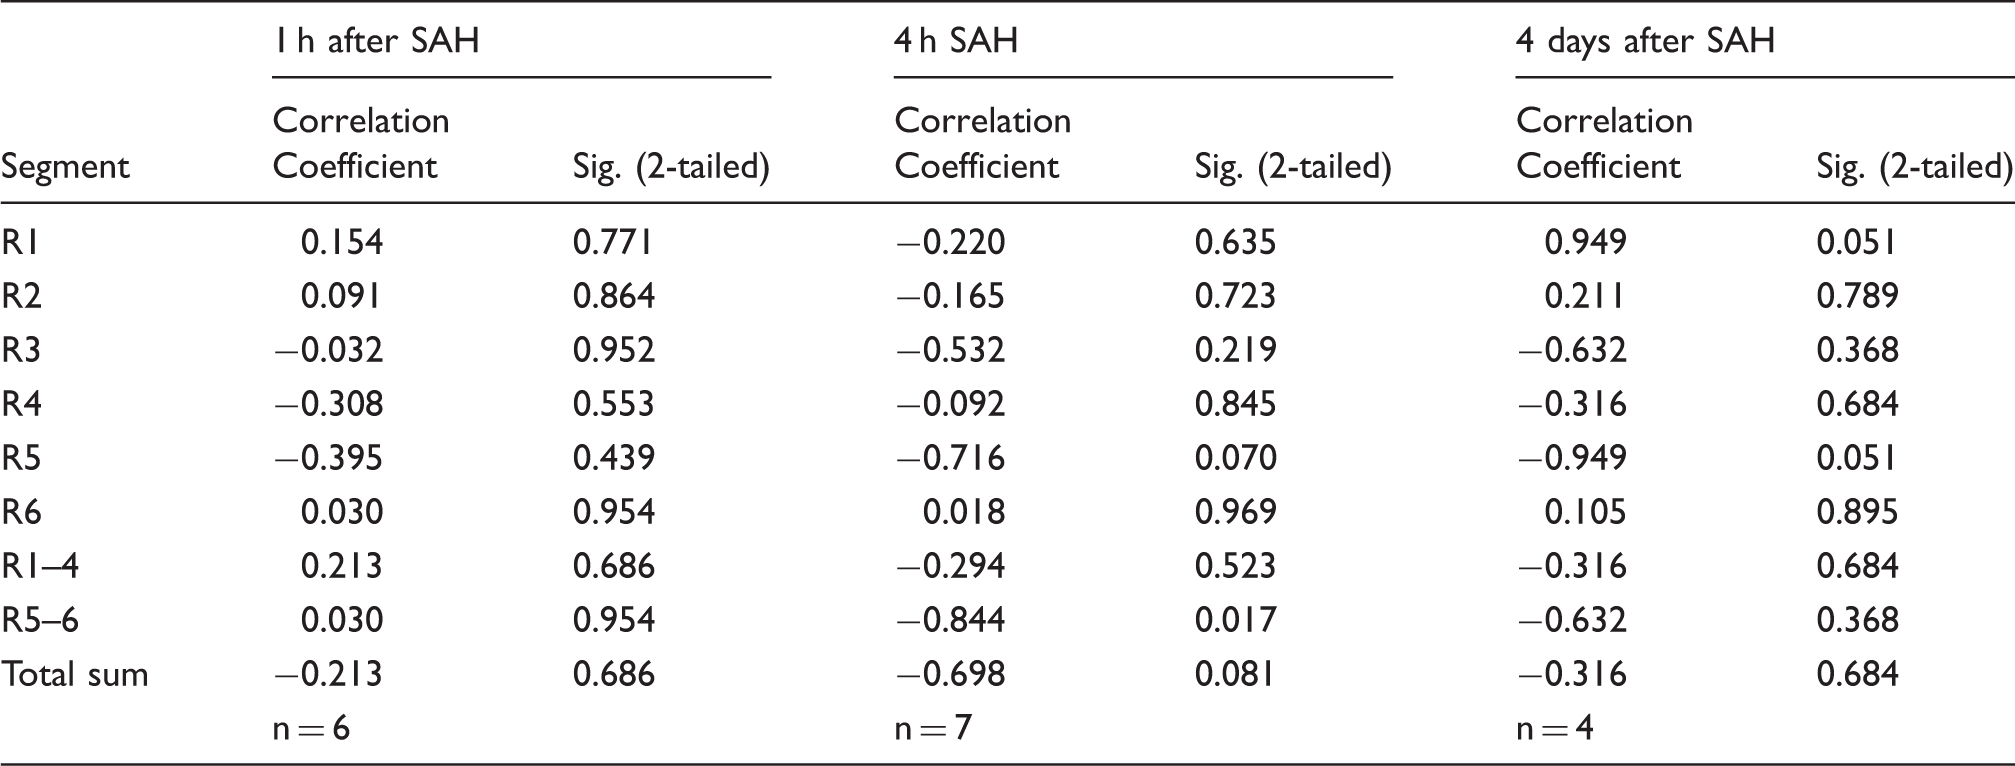
Non-parametric Spearman correlation coefficient between the area (in % of the segment area) of the spread of fluorescent microspheres 1 h after intracisternal administration in different segments of the ventral surface of the brain and hemorrhagic score in the respective segments at different time following the induction of subarachnoid hemorrhage was calculated at different time following the SAH. Note the practical absence of correlation between the spread of fluorescence and hemorrhagic score.
To investigate the possible role of fibrin(ogen) in the block of CSF flow as it was suggested,46,47 we explored the distribution of fibrin along the ventral surface of the brain. In naive animals (n = 4), very light fibrin-associated fluorescence was observed mostly in the perivascular space and at the confluence of the arachnoid membrane and hemispheric convexities (Figure 4(I)). Interestingly, distribution of fibrin formed the contour of the perivascular space and ventricular cisterns at the fusion of arachnoid membrane and the hemispheric convexities, which coincided with described above limitation of the spread of EB and microspheres, suggesting that basal perivascular space may be separated from the SAS over the hemispheric convexities. Following the hemorrhage, fibrin deposition was observed not only at the sites where visible blood was present but also at the remote sites, such as the contralateral hemisphere, where no blood was visible (Figure 4(II)).
I. Distribution of fibrin deposits (a) fluorescent microspheres (b) and soluble low molecular weight fluorophore Alexa 594 (c) on the ventral surface of the brain 1 h after injection of fluorophores into cisterna magna after in naïve mouse. (d) Superimposed images of fibrin, microspheres and Alexa 594 distribution. II. Fibrin deposition on the ventral surface of the brain in mice. (a) Naïve mouse; (b) in the mouse one hour following SAH; (c) in the mouse which received microinjection of tissue factor antibodies one hour before the SAH; (d) in the mouse which received intracerebroventricular injection of IgG 1 h before the SAH. Note excessive deposition of fibrin even at the sites remote from the hemorrhage where no visible blood is present.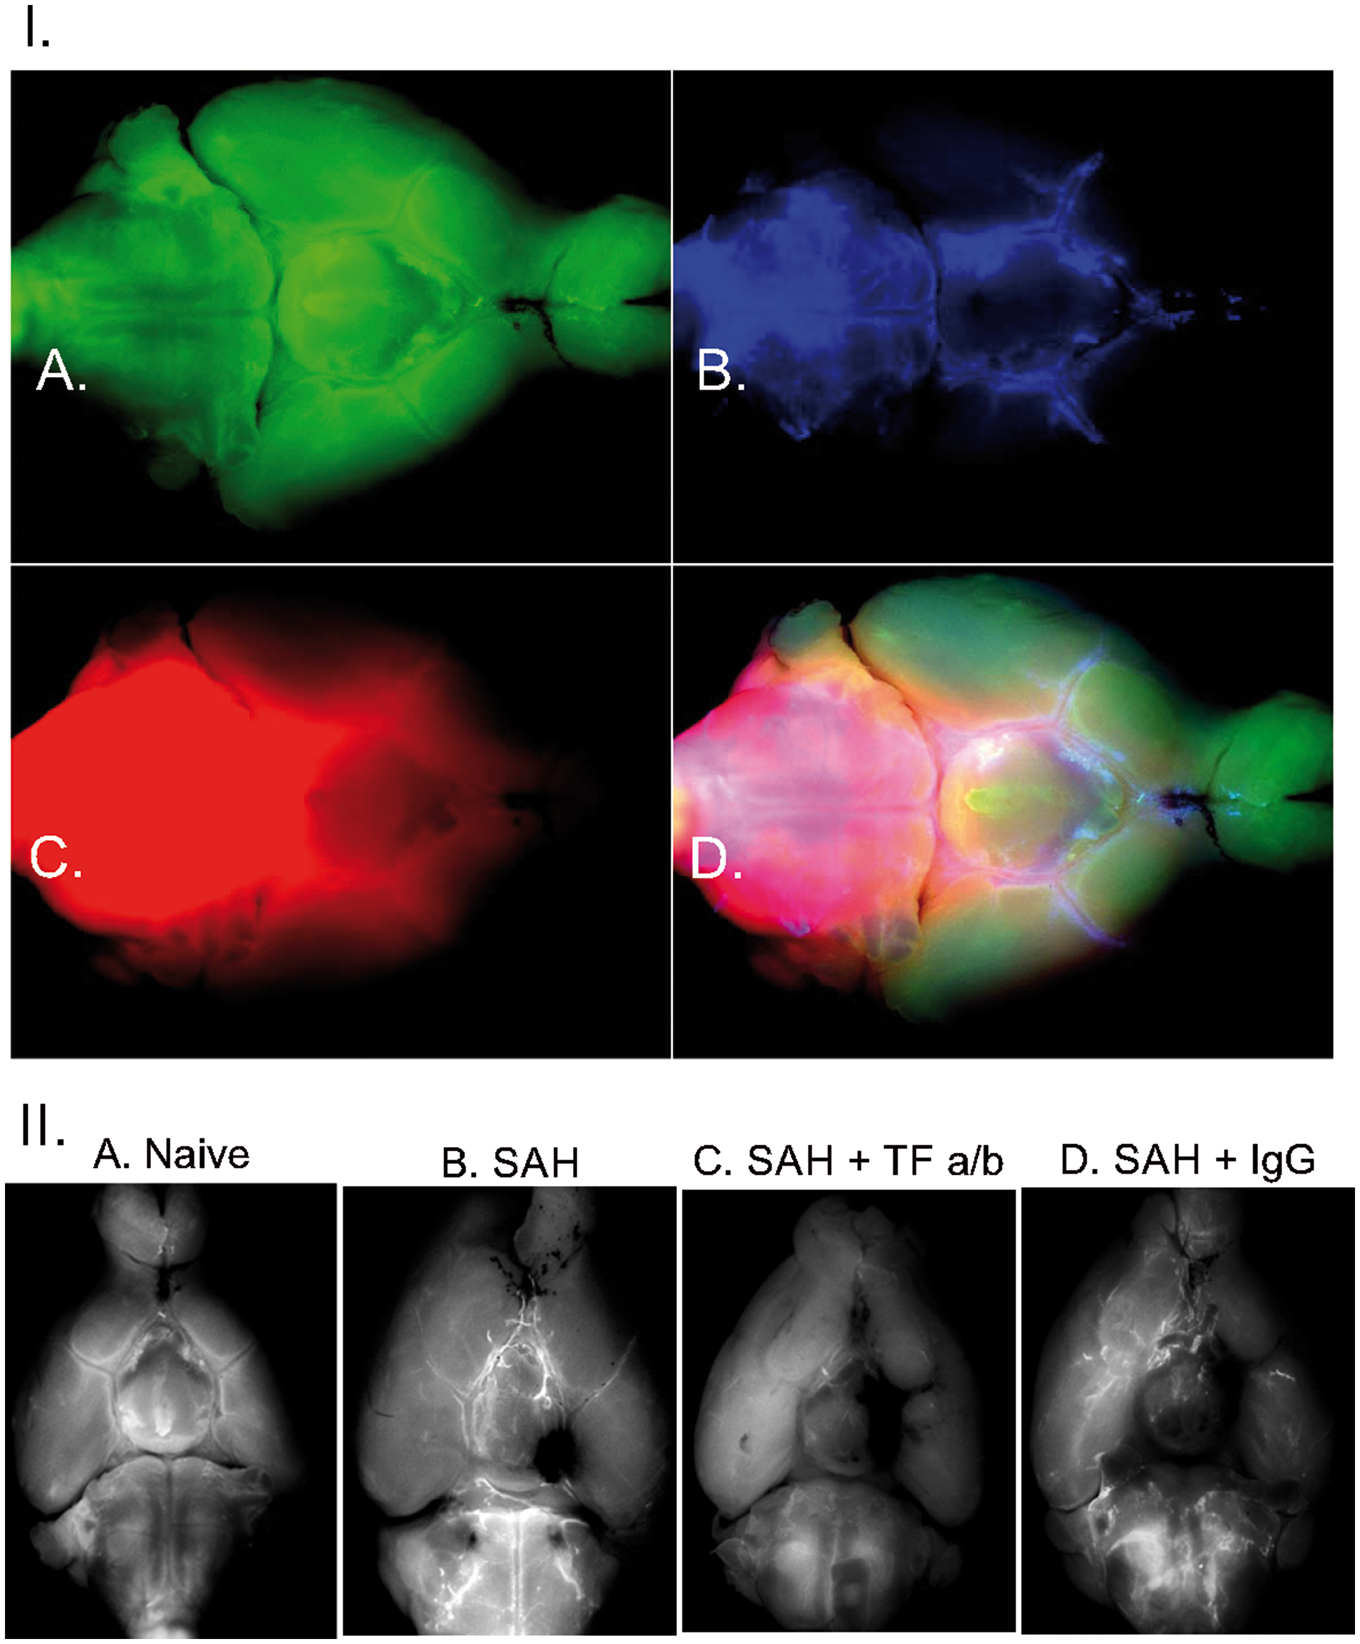
TF is a key element of the extrinsic coagulation pathway. We explored the distribution of the TF on the brain surface. TF expressed on the brain surface was associated with the glia limitans suggesting the possible involvement of it in control of blood distribution entering the subarachnoid space following the hemorrhage (Figure 5). To test this hypothesis, we blocked the TF by injecting TF antibodies (monoclonal rabbit anti-mouse TF, 1.1 µg, Abcam) into the lateral cerebral ventricle 1 h before triggering the hemorrhage in five animals. The hemorrhage score was significantly (H(2) = 12.28928, p = .0021) higher by 50% in animals after intracerebroventricular injection of TF antibodies, reaching 12.9(3.25), compared to 6.6(0.6), in animals that received IgG (donkey secondary anti-rat antibodies, 1 µg, Life Technologies) injection or compared to 5.8(3.1) in naïve animals. Inhibition of TF activity diminished the area of distribution of the microspheres or LMWS injected into CM, probably due to the obliteration of fluorescence by increased amount of blood in the SAS (Figure 6(I), Supplemental Table 6).
Fluorescent micrographs of the slice at the ventral surface of the brain stem of the mouse 1 h after intracisternal injection of microspheres. (a) Immunohistochemical distribution of tissue factor; (b) Distribution of microspheres; (c) Immunohistochemical distribution of GFAP; (d) Superimposition of tissue factor staining, GFAP and microspheres. Note overlapping distribution of tissue factor and GFAP in astrocytic processes and glia limitans zone. Arrow – basilar artery. Scale bar – 100 µm. Effects of intracerebroventricular administration of tissue factor specific antibodies on distribution of microspheres and hemorrhage spread following SAH. (I) Differences in hemorrhage spread in representative animals (a) and averaged hemorrhage scores (b), and differences in distribution of fluorescent microspheres (c) and their distribution (d) 1 h after their administration into cisterna magna in representative animals without (n = 7) and with intracerebroventricular injection of IgG (n = 5) or tissue factor antibodies (TF a/b, n = 7) *p = .0021. (II) Effects of intracerebroventricular administration of tissue factor specific antibodies on distribution of microspheres in SHAM operated animals (a) and averaged area of fluorescence distribution on the ventral brain surface (b) 1 h after intracisternal injection in naïve animals (control, n = 7) or in which microspheres injection was preceded (1 h) by intracerebroventricular injection of IgG (n = 4) or tissue factor antibodies (TF a/b, n = 7) *p = 0.001.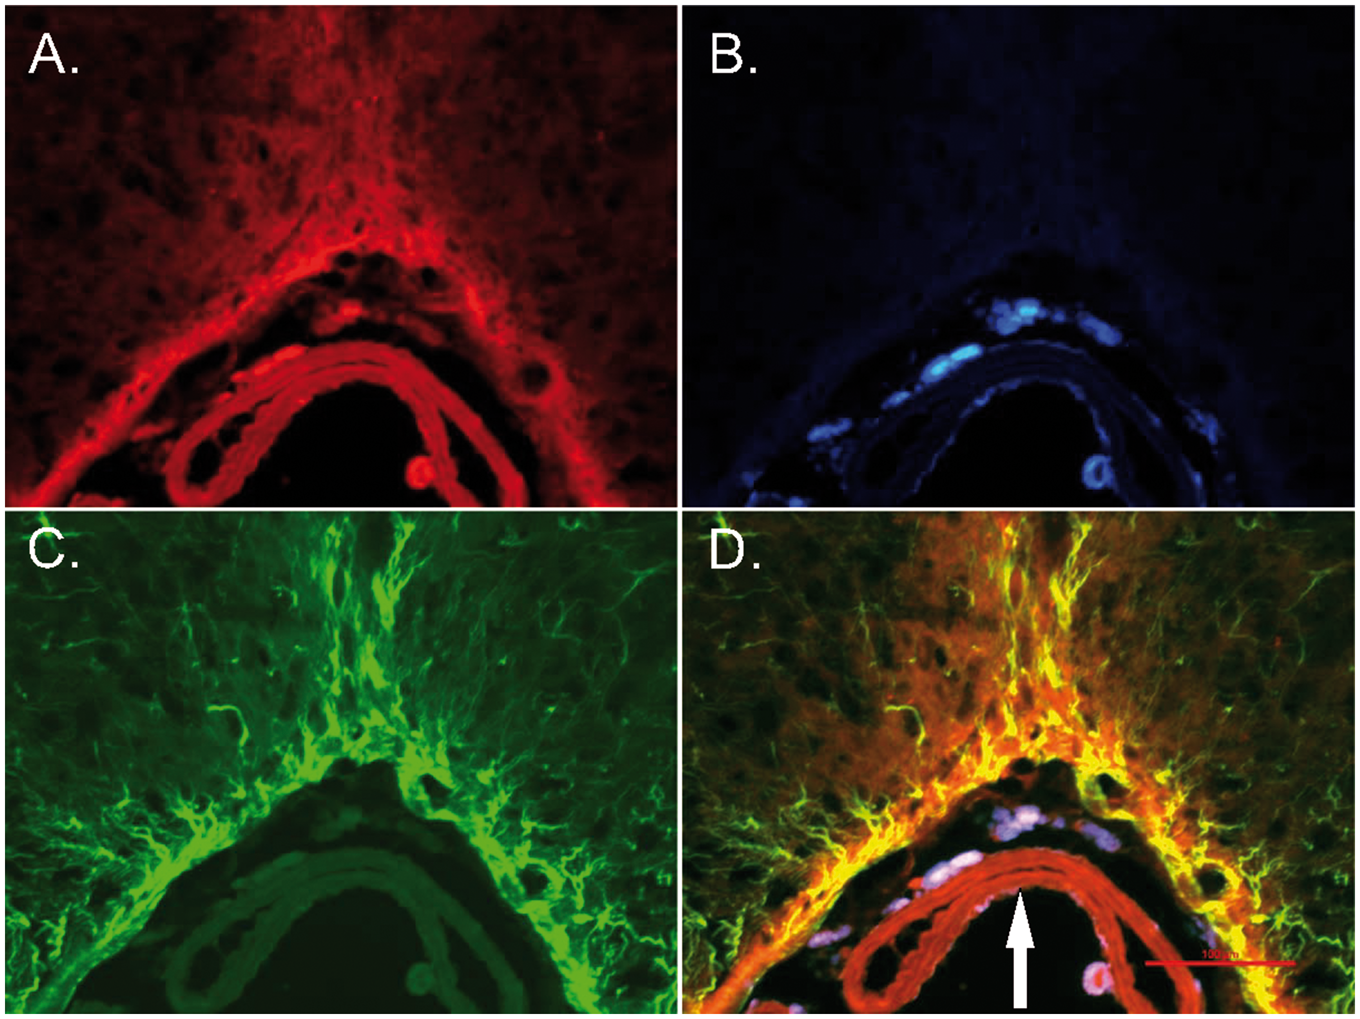
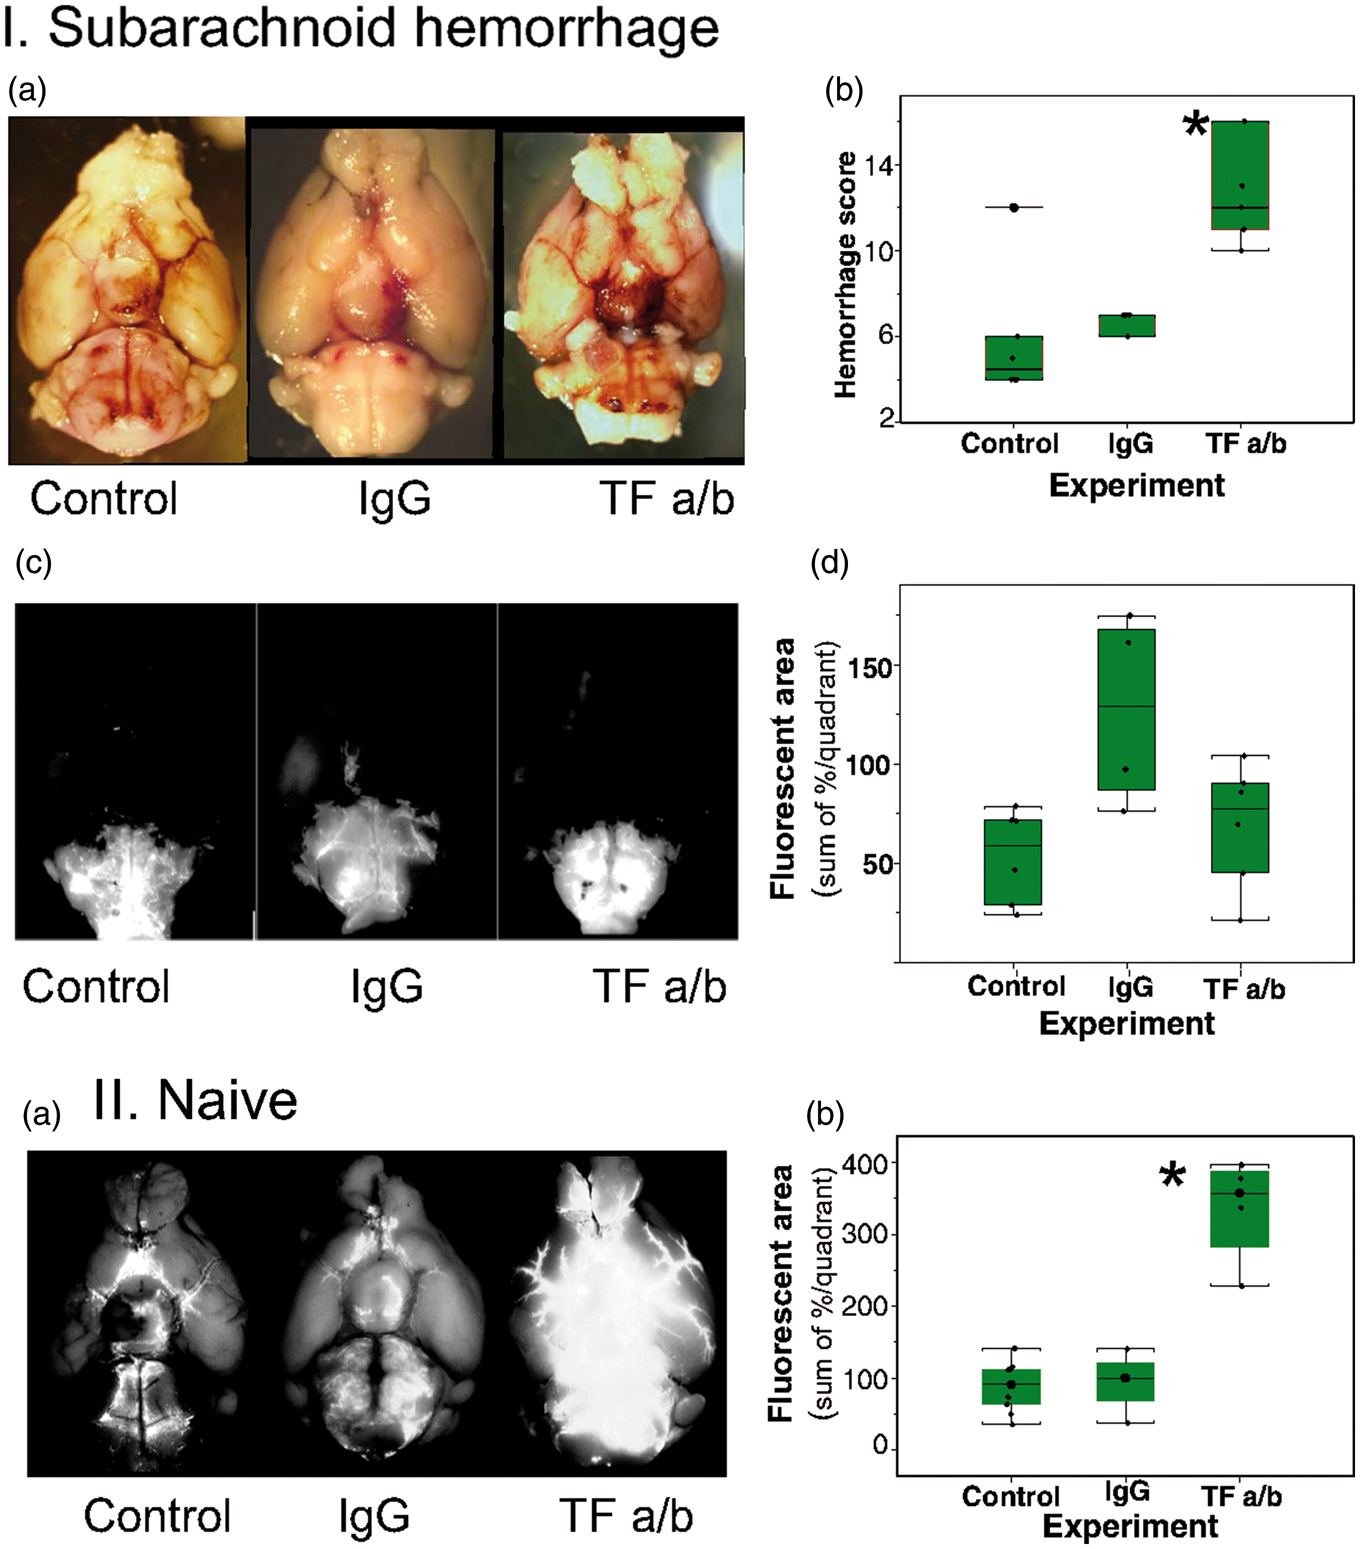
To explore whether TF activity affects normal CSF flow, we injected microspheres 1 h after the intraventricular injection of TF antibodies or IgG without circle of Willis perforation (sham SAH animals, n = 3–4 per group). One hour later, we evaluated the distribution of microspheres and compared them to the control group. The area of microspheres distribution was enlarged by 243% (from 94.8(42.5) units after IgG administration to 334.7(75.3) after TF a/b administration, (F(2,7) = 24.08, p = 0.001) (Figure 6(II), Supplemental Table 6).
Discussion
In our study, we established that SAH induces long-lasting, up to 30 days, impairment of CSF flow, which did not correlate with the visible presence of blood or blood clot. We also discovered that block of brain TF with specific antibodies not only aggravated spread of blood after the hemorrhage but also facilitated the spread of microspheres in SAS in non-hemorrhagic animals.
There are several limitations that potentially could affect the outcomes of the study. First, while polystyrene microspheres are of small diameter and the suspension was sonicated before injection, there is possibility that at least some of the microspheres were clumped, which effectively increased the diameter of particles, which, in turn would limit the distribution and spread of microspheres along the paravascular pathways. There is also chance that the microspheres distribution also could be limited by their interaction with particular proteins. These factors may limit the distribution of fluorescent microspheres. Another limitation is the capability of Alexa 594 to be internalized by cells and spread over the gap junctions. This property of the fluorophore may lead to the overestimation of its spread.
LMWS in naive or sham animals quickly spread from CM to fill ventral cisterns and reached olfactory bulbs within 15 min filling ventral brain cisterns following paravascular pathways. LMWS tracers entered the brain parenchyma probably along the recently described glymphatic paravascular pathways.35,46,47,62 Dynamic MRI data demonstrated that Gd contrast introduced into CM in less than 30 min started to drain along the major arterial pathways to the neck lymphatic nodes as well as paratracheal nodes while following similar to LMWS CSF distribution routes. These data are in a full agreement with earlier observations showing the fast distribution of tracers reflecting the movement of CSF from CM along the ventral brain cisterns with subsequent draining into the neck and paratracheal lymph nodes.63,64
Twenty nanometers in diameter polystyrene carboxylated microspheres injected into CM followed the distribution of LMWS. However, they failed to penetrate the brain parenchyma within 1 h of observation time. This suggests that solutes and particulates could be moved differently by the CSF flow. Possible differences in the movement of microspheres by the interstitial flow were suggested earlier. 39 The failure of microspheres to enter the parenchyma from SAS is in line with localization limited to SAS but not subpial space of blood cells after SAH in humans. 65 To our knowledge, our observations are first to report fluorescent microsphere distribution following CM injection. The closest possible comparison with our data could be experiments with the use of india ink, particles of which are close in diameter to the microspheres used in our experiments. Data on the distribution of india ink along the penetrating vessels are somewhat contradictory and probably depend on the methods and timing used in particular experiments. India ink injected repeatedly in rabbits CM in 24 to 72 h appeared along the intraparenchymal vessels. 66 When india ink was injected directly into SAS of the dorsal brain surface in rats, india ink was observed slowly penetrating along the vessels. 67 No india ink penetrated perivascular space when injected in the CM in humans postmortem studies. 65 While inconclusive, these data suggest that particulates in CSF behave differently from LMWS and are slower to enter the parenchyma.
As our data demonstrated, overall movements of particulates in the major CSF pathways reflect the bulk flow of CSF along the major pathways in the SAS. 68 We used this property of particulates to evaluate movement of cellular elements 39 which can be extrapolated on blood cellular components to explore effects of SAH on the flow of CSF along the major pathways. The complete block of distribution of LMWS and microspheres injected into CM following the SAH as soon as 15 min observed in our experiments suggests the arrest of CSF. CSF flow hindrance caused by SAH confirms previous findings with LMWS tracers.46,47 Our findings extend these observations showing that CSF flow as estimated by movements of particulates is severely slowed following SAH for up to 30 days. The observed slowing of CSF is in a good agreement with the clinical observations of deep disturbances in CSF flow after SAH in patients.42–45
It has been established that SAH-induced changes in intracranial pressure do not cause a block of CSF.46,47 Our data demonstrating that CSF flow does not recover for weeks after the ictus are also in support of the view that acute changes in ICP are not the main cause of CSF flow interruption. Based on the partial reversal of CSF flow stalling by administration of tPA, it was suggested that blood clotting in the main CSF flow pathways is the main cause of CSF flow abnormalities following SAH.46,47 This hypothesis finds support in the demonstration of fibrin deposition in the perivascular space in the area of the blood clot. 47 However, our experiments demonstrated that there was no correlation between the presence of blood in the particular segments of the ventral surface and CSF block suggesting that block is not due to formed blood clot as was suggested. 47 Even the limited blood clot induced complete interruption of CSF flow from CM beyond the rostral border of the pons. Moreover, even 30 days after the SAH, when no visible blood was observed at the ventral brain surface, CSF flow was not fully restored. In our experiments, fibrin deposits were observed in the paravascular space remote from the hemorrhage, where no visible blood was present. These observations are in agreement with the earlier finding of the fibrin deposition in SAS in the areas remote from the blood clot following SAH. 69 These findings suggest that excessive fibrin deposition in the CSF flow pathways, SAS cisterns, and paravascular space, may be not only limited to the immediate area of the hemorrhage. Slowing of CSF flow after blood instillation into the suprachiasmatic cistern or ischemic stroke 46 allows to speculate that fibrin deposition in response to brain disturbance may be more generalized.
Brain possesses complex hemostatic system, the function of which is not yet completely understood. 49 One of the key elements of this system is TF (coagulation Factor III). Brain and meninges have high expression of TF.52–54 TF, leading element of extrinsic coagulation pathway, is a transmembrane receptor of Factor VII. Activation of TF-bound factor VIIa (TF: VIIa) initiates extrinsic coagulation 70 which activates Factor X converting prothrombin into thrombin and subsequent formation of fibrin deposits. The primary source of TF in the brain is astrocytes.55,71 Astrocytic endfeet ensheath intracerebral vessels 72 and form glia limitans placing astrocytes in a perfect position to control possible hemorrhagic accidents, which are deleterious to brain tissue and, conceivably, to regulate CSF flow.
Our experiments confirm close association of TF with glia limitans. Even in the normal brain, we observed light fibrin deposition along the vessels, which increased and spread after the SAH in areas remote from the visible blood. This widespread increase of fibrin deposition may explain global slowing of CSF flow at least in ventral routes, where we observed fibrin. In our experiments, inhibition of TF with specific antibodies significantly increased blood spread following circle of Willis perforation. This observation is in a good agreement with the key role of glia limitans TF in blood clot formation following SAH. Moreover, block of TF in non-hemorrhagic animals significantly increased distribution of microparticles in the ventral cisterns and in perivascular pathways suggesting that TF may be involved in the modulation of CSF flow in normal conditions.
Clinical data support the suggestion of the importance of TF in the pathogenesis of SAH consequences. Elevated concentrations of TF in CSF within four days after SAH predict the occurrence of cerebral infarction and outcome after SAH 73 and considered to be a class B biomarker of DCI. 74 Microparticles containing membrane TF appear early after SAH and correlate with long-term consequences of SAH. 41 It was suggested that DCI may be associated with the formation of microthrombi and increased level of microparticles containing TF. The latter may have causative relation with the microthrombi formation and subsequent DCI development,75,76 which allowed to propose use of thrombolytics for the treatment of DCI. 23
It is thus plausible that increased activity of TF may affect CSF flow in the areas not immediately affected by hemorrhage. One of the possible mechanisms is increased levels of pro-inflammatory cytokines in CSF in patients following SAH,77,78 which activate TF. 79 Moreover, it is possible that in the brain “idling” complex of TF and Factor VII also exist like in derma 80 and can be easily activated leading to fibrin deposition and attenuation of CSF flow.
In conclusion, our experiments demonstrated that SAH leads to long-lasting widespread obstruction of CSF flow, which probably developed due to deposition of fibrin as a consequence of TF activation. Besides TF astrocytes express tissue factor pathways inhibitor (TFPI). 81 TFPI counters fibrin formation by inhibiting activation of Factor X by the TF-Factor VIIa complex.82,83 Infusion of recombinant TFPI decreases fibrin deposition following ischemic stroke, 84 which also attenuates CSF flow. 46 It is thus conceivable that astrocytes and glia limitans form fine-tuned mechanism which may regulate CSF flow in normal and pathological conditions.
Footnotes
Funding
The author(s) disclosed receipt of the following financial support for the research, authorship, and/or publication of this article: Part of the research was supported by Oden Foundation and Steve Wyatt to GW, and TT & WF Chao Center for BRAIN and John S Dunn Research Foundation to STCW.
Acknowledgments
The authors would like to express their gratitude to Dr. R.G. Grossman for his insightful dicussion and valuable advices in course of work and manuscript preparation.
Declaration of conflicting interests
The author(s) declared no potential conflicts of interest with respect to the research, authorship, and/or publication of this article.
Authors' contributions
EVG conceived and planned the study, executed the experiments, processed data, and wrote the manuscript; EIB, RGF and JM participated in the experiments; KKW and RGP performed MRI experiments and analyzed data; CHF processed data; GWB conceived and planned the study and edited the manuscript; YJZ and STW planned the study and edited the manuscript.
References
Supplementary Material
Please find the following supplemental material available below.
For Open Access articles published under a Creative Commons License, all supplemental material carries the same license as the article it is associated with.
For non-Open Access articles published, all supplemental material carries a non-exclusive license, and permission requests for re-use of supplemental material or any part of supplemental material shall be sent directly to the copyright owner as specified in the copyright notice associated with the article.