
Abstract
The 18 kDa translocator protein (TSPO) is a marker of microglia activation and the main target of positron emission tomography (PET) ligands for neuroinflammation. Previous works showed that accounting for TSPO endothelial binding improves PET quantification for [11C]PBR28, [18F]DPA714 and [11C]-R-PK11195. It is still unclear, however, whether the vascular signal is tracer-dependent. This work aims to explore the relationship between the TSPO vascular and tissue components for PET tracers with varying affinity, also assessing the impact of affinity towards the differentiability amongst kinetics and the ensuing ligand amenability to cluster analysis for the extraction of a reference region. First, we applied the compartmental model accounting for vascular binding to [11C]-R-PK11195 data from six healthy subjects. Then, we compared the [11C]-R-PK11195 vascular binding estimates with previously published values for [18F]DPA714 and [11C]PBR28. Finally, we determined the suitability for reference region extraction by calculating the angle between grey and white matter kinetics. Our results showed that endothelial binding is common to all TSPO tracers and proportional to their affinity. By consequence, grey and white matter kinetics were most similar for the radioligand with the highest affinity (i.e. [11C]PBR28), hence poorly suited for the extraction of a reference region using supervised clustering.
Keywords
Introduction
The translocator protein 18 kDa (TSPO) is a five-transmembrane domain protein located in the outer mitochondrial membrane. 1 During the inflammatory response in the brain, TSPO is upregulated in microglial cells and macrophages and, to a lesser extent, in reactive astrocytes.2–4 Therefore, TSPO is a target of interest for positron emission tomography (PET) studies aimed at imaging neuroinflammation in vivo.5,6
The quantification of TSPO density with PET is a challenging task with any radioligand.7,8 Firstly, a single nucleotide polymorphism (rs6971) in the TSPO gene affects the binding affinity of second-generation TSPO tracers. 9 Secondly, all TSPO radiotracers can bind to a number of sites in blood (e.g. platelets and monocytes, but also plasma proteins), and this binding can be altered in pathological conditions affecting the peripheral immune system.10–15 Given that the free fraction in plasma of TSPO radioligands is generally very low (between 1% and 5%) and difficult to measure,8,16 quantification with plasmatic input function is challenging. By consequence, reference tissue input models are generally preferable over plasma input models. However, the widespread distribution of TSPO in the normal brain and the unknown pattern of TSPO density in pathological conditions prevent the use of anatomically defined regions of reference. The cerebellum, often used as a reference or pseudo-reference for many PET tracers, including [11C]PBR28, 17 might not be an ideal reference region for TSPO PET due to its complex tissue composition 18 and its unpredictable susceptibility to inflammation. 19
One approach for non-invasive quantification of [11C]-R-PK11195 scans consists of modelling the kinetics in each voxel as a linear combination of kinetics of predefined classes, and in defining the reference as the average contribution of the normal grey matter in each voxel. This approach, which is a form of supervised clustering, is known as super-PK19,20 and was recently developed and validated also for [18F]DPA714 data. 21
The last challenge to quantification is related to the heterogeneous TSPO distribution in the healthy brain and its impact on kinetic modelling.18,19 Although the background signal of TSPO radiotracers seems homogeneous on PET images, at the microscopic level, TSPO is overexpressed in the endothelium and the tunica media of brain vessels. 19 Saturation binding studies and immunohistochemical studies have repetitively confirmed it in different conditions.22–25 This TSPO fraction, which henceforth will be referred to as vascular or endothelial fraction, is reduced in aged brains and during neurodegenerative conditions due to vascular fibrosis. 26 A first study with [11C]-R-PK11195 showed that incorporating the vascular TSPO component into a reference-based model (simplified reference tissue model with vascular component, SRTM-Vb) improved the differentiation of Alzheimer’s disease patients from controls. 26 Compared to reference-based models without endothelial correction, SRTM-Vb proved to be superior for the quantification of brain TSPO density with [11C]-R-PK11195 in showing differences in binding between subject groups. 20 We recently proposed a two-tissue compartmental model with vascular binding (2TCM-1K) for the quantification with a plasma input function of the high-affinity [11C]PBR28 that explicitly accounts for the endothelial TSPO binding. 27 This model improved the quantification of brain [11C]PBR28 data, both in healthy populations and in subjects affected by schizophrenia;27,28 similar improvements were gained by its recent application to [18F]DPA714 data. 29
For the present work, we postulated that the contribution of vascular TSPO to the total TSPO binding would be proportional to the affinity of the tracer, i.e. high-affinity second-generation compounds would be more affected by vascular TSPO binding than tracers with lower affinity, such as [11C]-R-PK11195. In particular, when using high-affinity compounds, higher vascular and parenchymal signal would actually lower tissue contrast making the extraction of a reference region by clustering arduous.
Hence this study sought to (a) validate the vascular-trapping model for [11C]-R-PK11195; (b) determine the consistency of the results with those obtained by reference model SRTM-Vb; (c) calculate the relationship between the estimated endothelial binding rate values of [11C]-R-PK11195, [18F]DPA714 29 and [11C]PBR28 28 and their affinity and (d) calculate the ratio between parenchymal grey and white matter signals as an index to determine what tracers are amenable to quantification with a pseudo-reference region obtained by cluster analysis.
Materials and methods
Vascular binding model for [11C]-R-PK11195
Dataset
The dataset consisted of six healthy subjects from previously reported studies.19,26 The studies were approved by the Hammersmith Hospitals Trust Ethics Committee and were conducted in accordance with the Declaration of Helsinki. Permission to administer radioisotopes was granted by the Administration of Radioactive Substances Advisory Committee of the Department of Health, U.K. Informed written consent was obtained from all subjects.
PET imaging
All [11C]-R-PK11195 studies were performed on an ECAT EXACT 3D (CTI/Siemens) PET camera, with a 23.4-cm axial field of view, 95 transaxial planes and a spatial resolution of 4.8-mm (transaxial) and 5.6-mm (axial) full width at half maximum (for details, see Spinks et al. 30 ). A transmission scan was acquired before every emission using a single rotating photon point source of 150 MBq of 137Cs for subsequent attenuation correction and scatter correction. Thirty seconds after the start of the emission scan, the subjects received a bolus injection of [11C]-R-PK11195 (296 MBq) followed by a 60-minute PET emission scan. PET data were in list mode and rebinned as 18 time frames (durations: 30-s background frame, 1 × 15 s, 1 × 5 s, 1 × 10 s, 1 × 30 s, 4 × 60 s, 7 × 300 s, 2 × 600 s). Data were reconstructed using the filtered backprojection algorithm. 31 Reconstructed voxel sizes were 2.096 mm × 2.096 mm × 2.43 mm. Radiopharmaceutical preparation of [11C]-R-PK11195 was done as described in Tomasi et al. 26
In addition, volumetric T1-weighted MR images were obtained on a 1.0-T Picker HPQ scanner (Picker International) at the Robert Steiner MR Unit, Hammersmith Hospital, London. These structural MRI images were used along with PET imaging for region segmentation.
Arterial blood sampling and analysis of [11C]-R-PK11195 plasma metabolism
Analysis of blood data is described in detail in the original reference. 19 Briefly, arterial blood was sampled during PET acquisition via the radial artery using a combined automatic–manual approach. Arterial whole-blood activity was monitored continuously for the first 15 min of the scan at a flow rate of 5 mL/min. 32 Eight discrete arterial blood samples were manually withdrawn at 5, 10, 15, 20, 30, 40, 50 and 60 min into heparinized syringes. The activity concentrations of the whole blood and plasma were used to determine the plasma-over-blood activity ratio, which was fitted with a straight line. 19 Samples at 5, 10 and 15 min were used to calibrate the two sampling modalities. Five plasma samples per scan (at 5, 10, 20, 40 and 60 min) were analysed to calculate the parent fraction in plasma (PPf).
Processing of blood samples was performed consistently with previous studies. 19 PPf were fitted with an exponential model, while whole blood time activity curves (TACs) were fitted using a variation of Feng’s model that consists in a straight line until the arterial input function peak, followed by a tri-exponential decay. 33 For each scan, the time difference between tracer arrival to the brain and to the arterial sampling site was compensated for by shifting the blood curves by 0–20 s (both parent and whole blood TACs), fitting the whole brain TAC (using linear spectral analysis to avoid dependency on a particular compartmental model 34 ), and selecting the delay that produced the smallest weighted residual sum of squares.
Image analysis
Structural MRI images were used for grey and white matter segmentation and region of interest (ROI) definition. The Hammersmith maximum probability atlas 35 of 73 ROIs was co-registered on each subject’s MRI scan and PET image using FSL (http://www.fsl.fmrib.ox.ac.uk/fsl) functions. ROIs included whole brain, occipital lobe, temporal lobe, frontal lobe, parietal lobe, insula, cingulate cortex, amygdala, hippocampus, thalamus, caudate, putamen and cerebellum.
All PET images were corrected for head movement by denoising the non-attenuation-corrected dynamic images with a Battle-Lemarie wavelet filter (level 2, order 64). Non-attenuation-corrected images were used, because the scalp signal is stronger and that improves re-alignment compared to attenuation-corrected images. All frames were realigned to a single “reference” space corresponding to the PET frame with the highest activity. The transformation parameters were then applied to the corresponding attenuation-corrected PET frames to create a movement-corrected dynamic image for analysis. Regional TACs were obtained by sampling the image with the co-registered atlas.
[11C]-R-PK11195 kinetic analysis
Quantification of [11C]-R-PK11195 tissue distribution was performed at the region level by comparing different compartmental models: two models accounting for tissue binding only (two-tissue and one-tissue compartmental models in their standard definition – 2TCM and 1TCM, respectively) and two models that include the vascular TSPO binding (2TCM-1K and 1TCM-1K, respectively). A summary of the model configurations and kinetic parameters is reported in online supplementary Figure 1. Also note that the models share most of the micro-parameters with the only exception of Kb [1/min], which is explicitly used in 2TCM-1K and 1TCM-1K to account for the vascular component.
27
[11C]PK11195 brain PET data fit and model compartmentalization. Example of model fits to whole brain activity with standard 1- and 2-tissue modelling (a, b) and including vascular modelling with 1TCM-1K (c) and 2TCM-1K (d) in a representative healthy subject. In each panel, black circles represent the measured activity while the solid black lines represent the data model description. Single compartmental kinetics is described by blue, green and red lines, which represent non-displaceable, specific and endothelial binding, respectively. Purple solid lines represent total tissue binding (i.e. non-displaceable plus specific binding).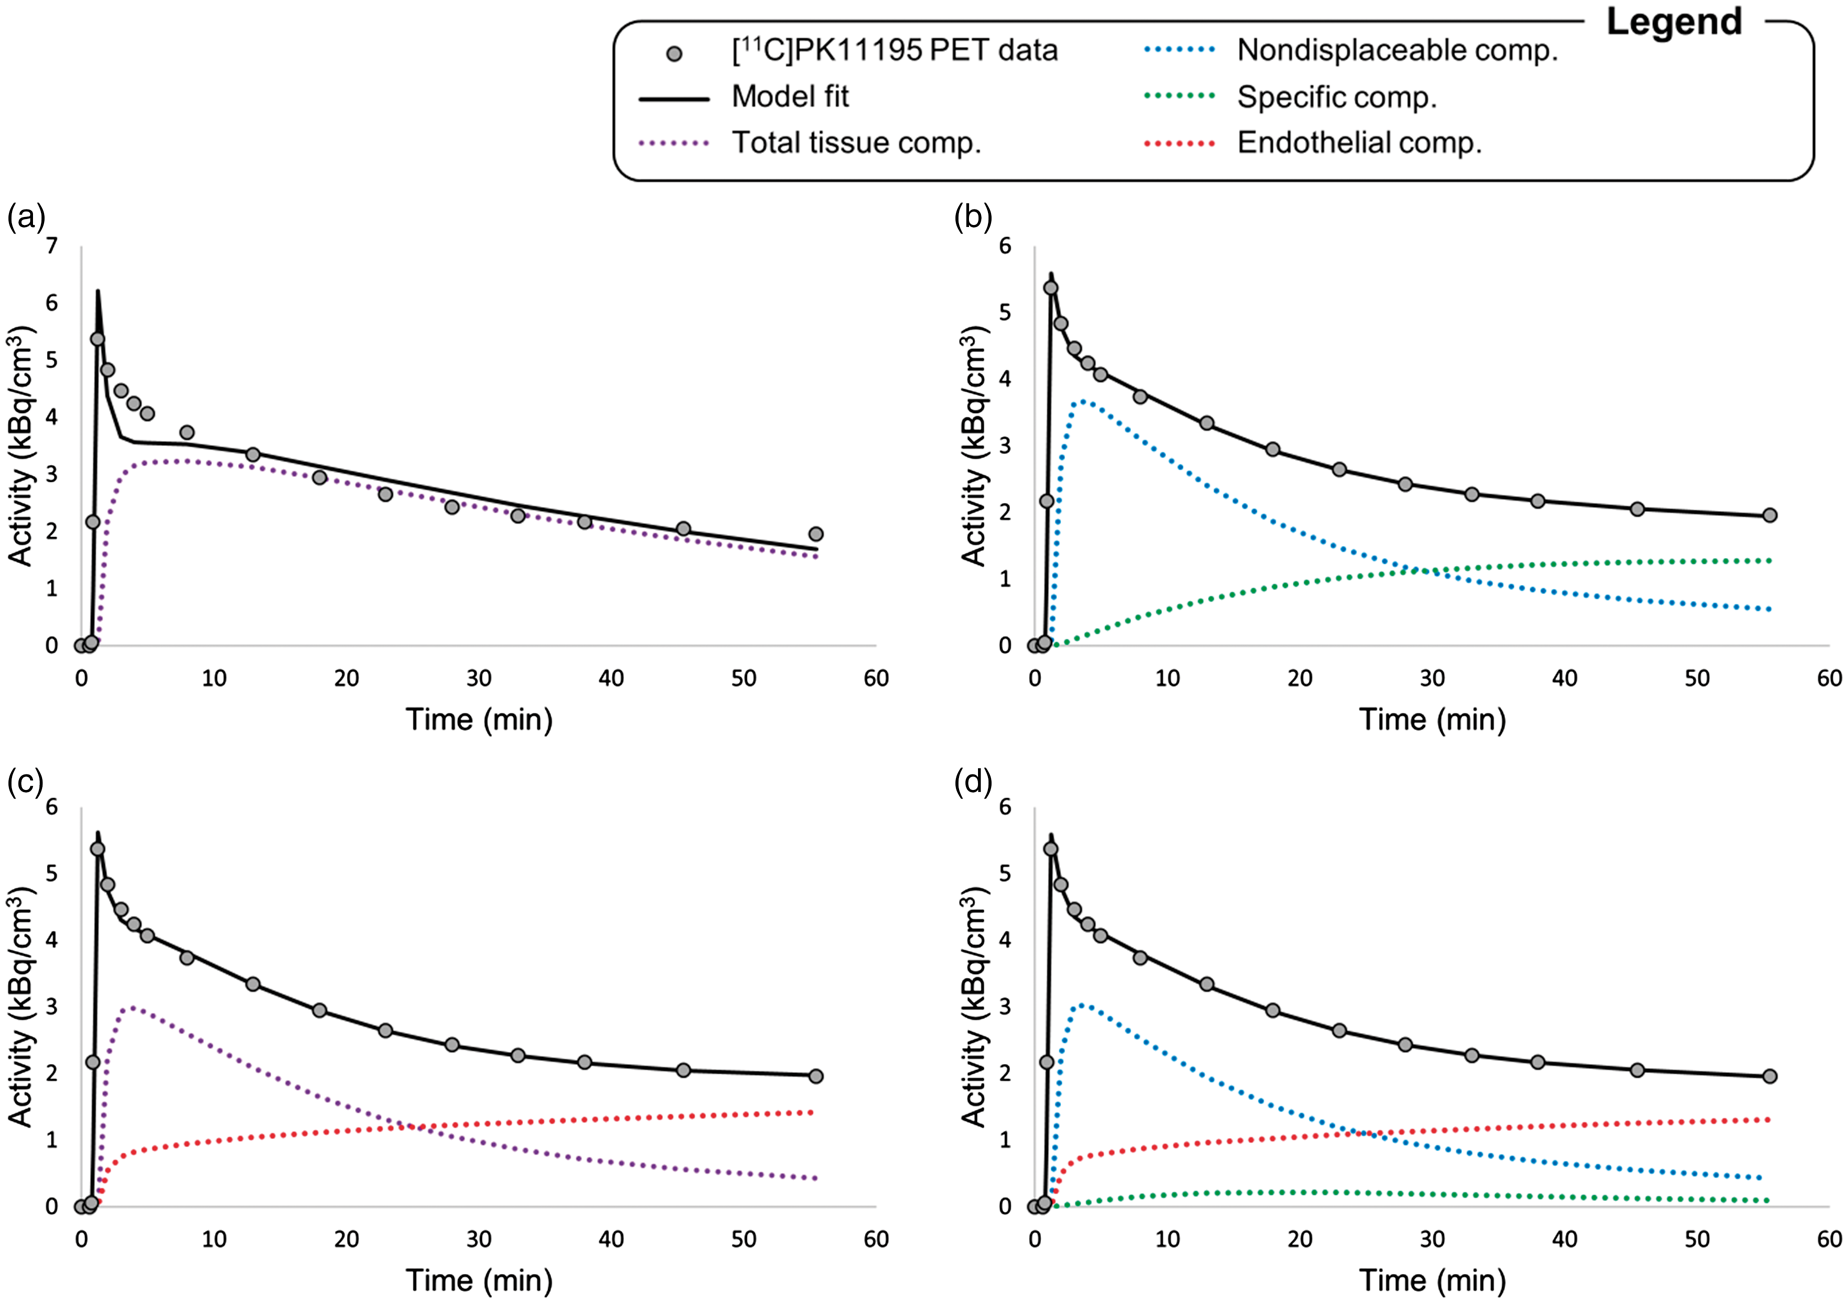
We also analysed the data using the modified version of the simplified reference tissue model (SRTM-Vb) proposed in Tomasi et al. 26 This modified version accounts for tracer vascular activity both in reference and target tissues, using the whole vasculature TAC extracted from the image to correct for the endothelial TSPO binding. The reference region was derived with the super-PK algorithm. 19
All compartmental models were analysed using the weighted nonlinear least square estimator (WNLLS), as implemented in Matlab (The Mathworks Inc., Natick, MA). Initial microparameter values were set based on the literature.19,27 The weights for the individual data points were defined as the inverse of the variance of the PET measurement error. This was assumed to be additive, uncorrelated, normally distributed with a zero mean and variance equal to the decay-corrected activity divided by the length of the relative scan interval, multiplied by a scale factor estimated a posteriori. 36 We calculated the total distribution volume (VT, mL/cm3) for 1TCM, 1TCM-1K, 2TCM and 2TCM-1K. The volume of distribution is the ratio of the concentration of radioligand in a region of tissue to that in plasma. 37 Regional values of VT estimated with low precision (CV > 50%) were considered outliers and excluded from further analysis. 27 For all models, the blood volume fraction (Vb) was estimated together with the other model microparameters.
Model selection was performed using the Akaike information criterion (AIC), which balances model accuracy versus model complexity, 38 and by calculating the percentage of outliers. The model descriptions of the tissue data were also analysed in terms of weighted residuals, which had to be randomly distributed and uncorrelated, following the assumptions on the model error. We applied the Wald–Wolfowitz runs test for the randomness of the residuals and a one-sample Kolmogorov–Smirnov test to assess if residuals came from a standard normal distribution.
All plasma input models were compared with the simplified reference tissue model SRTM-Vb on the basis of the estimates of the distribution volume ratio (
Relationship between [11C]-R-PK11195, [18F]DPA714 and [11C]PBR28 vascular component and tracer affinity
We speculated that the magnitude of the vascular component would be proportional to tracer affinity, i.e. the higher the affinity, the higher the values of Kb. In order to assess the relationship between the vascular component and tracer affinity, we compared the estimates of Kb (i.e. the endothelial tracer binding) in three different tracers with increasing affinity for the TSPO: [11C]-R-PK11195, [18F]DPA714 and [11C]PBR28. 39 The affinity of [18F]DPA714 and [11C]PBR28 is ∼1.5 fold and ∼5 to 6 fold that of [11C]-R-PK11195, 39 respectively, with the following reported values: Ki = 4.5–22.3 nM for [11C]-R-PK11195, Ki = 7.0 ± 0.4 nM for [18F]DPA714 40 and Ki = 2.5–4.0 nM for [11C]PBR28. 41
The [11C]-R-PK11195 Kb estimates of the six healthy subjects of the present study were compared to the [11C]PBR28 estimates reported by Bloomfield et al. in 18 healthy subjects 28 and to the [18F]DPA714 estimates obtained with the 2TCM-1K in five healthy subjects, part of an ongoing study for the investigation of neuroinflammation in multiple sclerosis. The [11C]PBR28 results were reproduced from the original publication for the sake of this analysis, whereas [18F]DPA714 data were reanalysed using the Hammersmith maximum probability atlas to derive a set of regions consistent with [11C]PBR28 and [11C]PK11195 datasets.
The experimental protocol for the latter study is described in Lavisse et al. 42 We limited the analysis to high-affinity binder (HAB) subjects to avoid the inclusion of additional variables in the affinity comparison. The Kb values were compared in the regions that were common to the three datasets, i.e. whole brain, hippocampus, thalamus, caudate, putamen, frontal, parietal, occipital and temporal lobes. The cerebellum was excluded from the comparison, because of its complex cellular heterogeneity and its high content of white matter, which has a higher vessel density per volume unit. 18 Differences in Kb values among tracers were statistically analysed with a repeated-measure ANOVA using SPSS version 21 (http://www.spss.com).
The role of TSPO tracer affinity in using supervised-clustered reference region approaches
The super-PK method relies on three main steps: (1) an input normalization procedure to scale each volume of the dynamic PET sequence, (2) the derivation of a set of predefined kinetic classes and (3) a regression analysis to calculate the contribution of each class to the single voxel kinetic. The fundamental step is the definition of the vectors of the kinetic classes that, albeit non-orthogonal, need to be as independent as possible. 19 These classes are defined anatomically from the segmented MR and PET images and include grey and white matter, blood, skull, muscle and a high binding region. To the authors’ knowledge, there have not been successful implementations of supervised clustering approaches to second-generation TSPO tracers, other than a recent application to [18F]DPA714. 21
In order to assess the relationship between the affinity and a successful implementation of supervised clustering, we measured the angle between the kinetic vectors of the grey matter and white matter classes derived for [11C]-R-PK11195 data according to Turkheimer et al.
19
We also included the same trigonometry measurements for [11C]PBR28 and for [18F]DPA714 data (18 and 5 healthy HAB subjects, respectively, see literature21,28). The angle between classes was calculated as
We speculated that there would be a negative association between the suitability to reference tissue extraction by clustering and the affinity for TSPO of these ligands. An increase in contrast between parenchymal tissues (grey and white matter) would be expected with increased affinity, but it would be counteracted by the parallel increase of vascular binding. This would ultimately reduce tissue contrast, thus preventing the implementation of a supervised clustering approach and the extraction of a pseudo-reference region.
Results
[11C]-R-PK11195 PET kinetic analysis
Comparison of model performance
The vascular models (either 2TCM-1K or 1TCM-1K) provided a more parsimonious data description in the majority (77%) of the ROIs (Figure 1). Note that 2TCM consistently described the last part of the tissue curve by fitting the specific compartment as an almost irreversible kinetic. The very slow specific component was due to small values of k4, close to zero (median k4 = 0.004 min−1). Weighted residuals obtained with all models (except with 1TCM) were consistent with the assumptions that the measurement error was random and uncorrelated. These findings are consistent with the performance of vascular models when applied to other TSPO PET tracers including [11C]PBR28 in healthy and pathological populations27,28 and [18F]DPA714 data. 29
Mean and variability of DVR regional estimates between subjects.
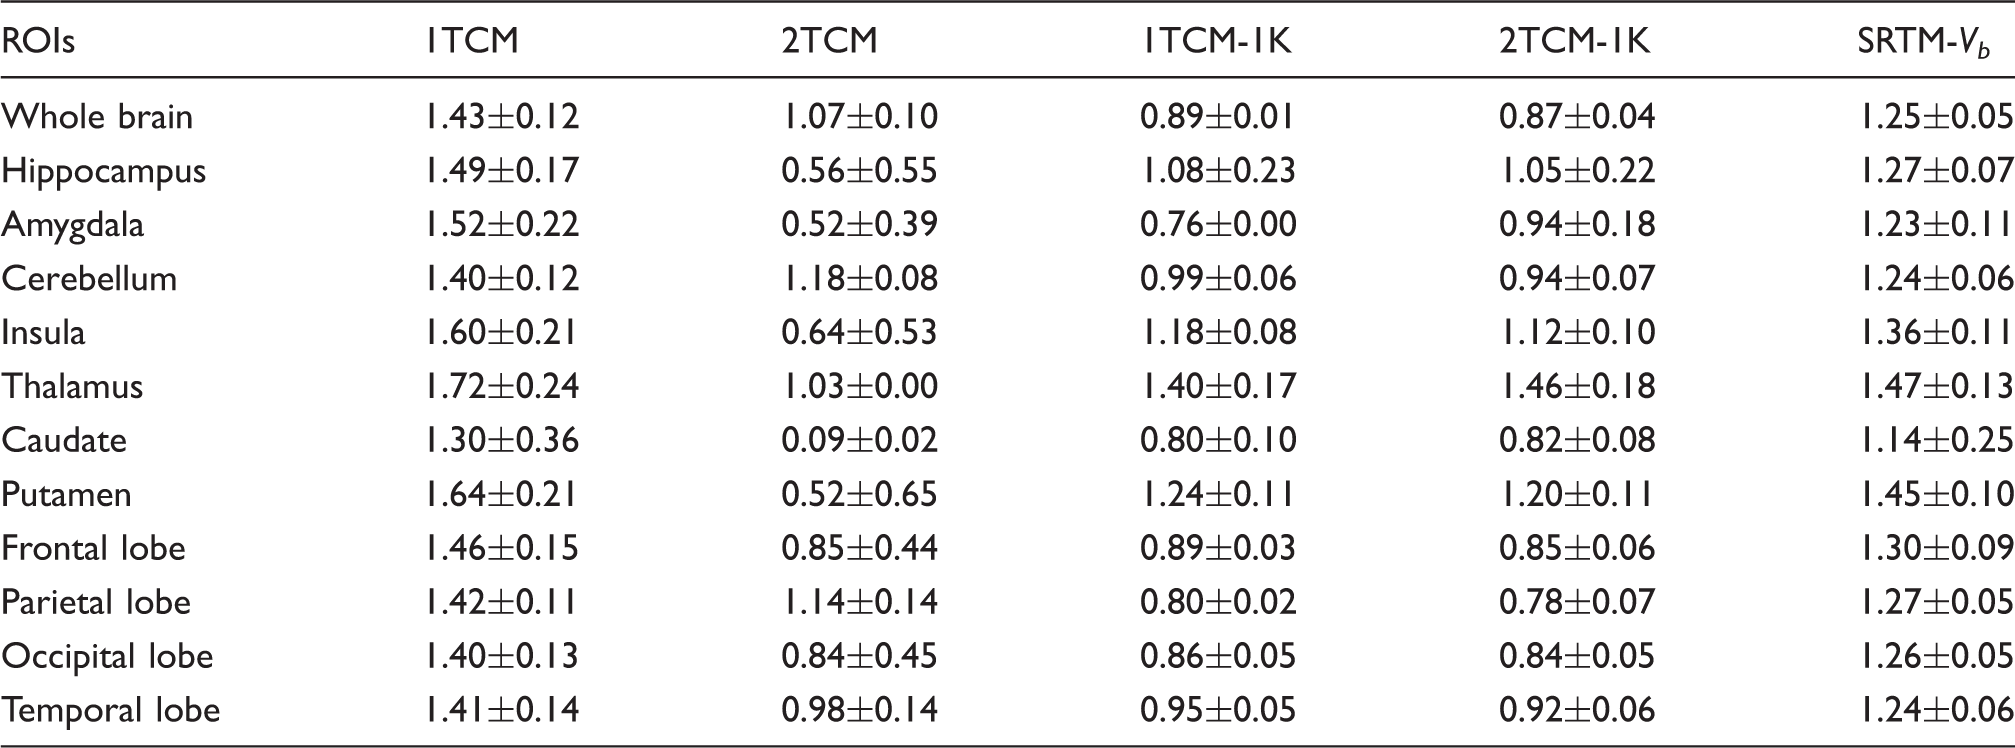
Distribution volume ratio (
As expected, the more complex the model, the higher the fraction of outliers (58% for 2TCM-1K, 48% for 2TCM and no outliers for 1TCM-1K and 1TCM). Notably, for 2TCM, the outliers were always due to very small (close to zero) estimates of k4 (median k4 = 0.004 min−1), which suggested almost irreversible kinetics. In the regions where 2TCM was estimated reliably, the median value of k4 was 0.027 min−1.
Once corrected for outliers, the precision of individual VT estimates were higher for more complex models, as expected, but in general were consistent among models: for 2TCM1-1K
Kinetic estimates
The inclusion of a vascular binding compartment resulted in a reduction of the parenchymal VT by 68% ± 9% (comparing 1TCM-1K and 2TCM estimates). The regional variability of VT (SD of regional values between subjects normalized by the mean) was comparable with the two models (22% for 1TCM-1K and 19% for 2TCM, respectively). Similarly to the results obtained with [11C]PBR28,
27
the VT values obtained with 2TCM and 1TCM-1K were not only significantly different (paired t-test, p-value<0.001), but also poorly correlated, with an
When we compared 2TCM and 1TCM-1K Mean and variability of regional Kb estimates. TPSO vascular binding estimates (Kb) obtained from tracers with different TSPO affinity. Kb estimates (mean±SD) are shown for [11C]-R-PK11195 (blue bars, n = 6), [18F]DPA714 (orange bars, n = 5) and [11C]PBR28 data (grey bars, n = 18).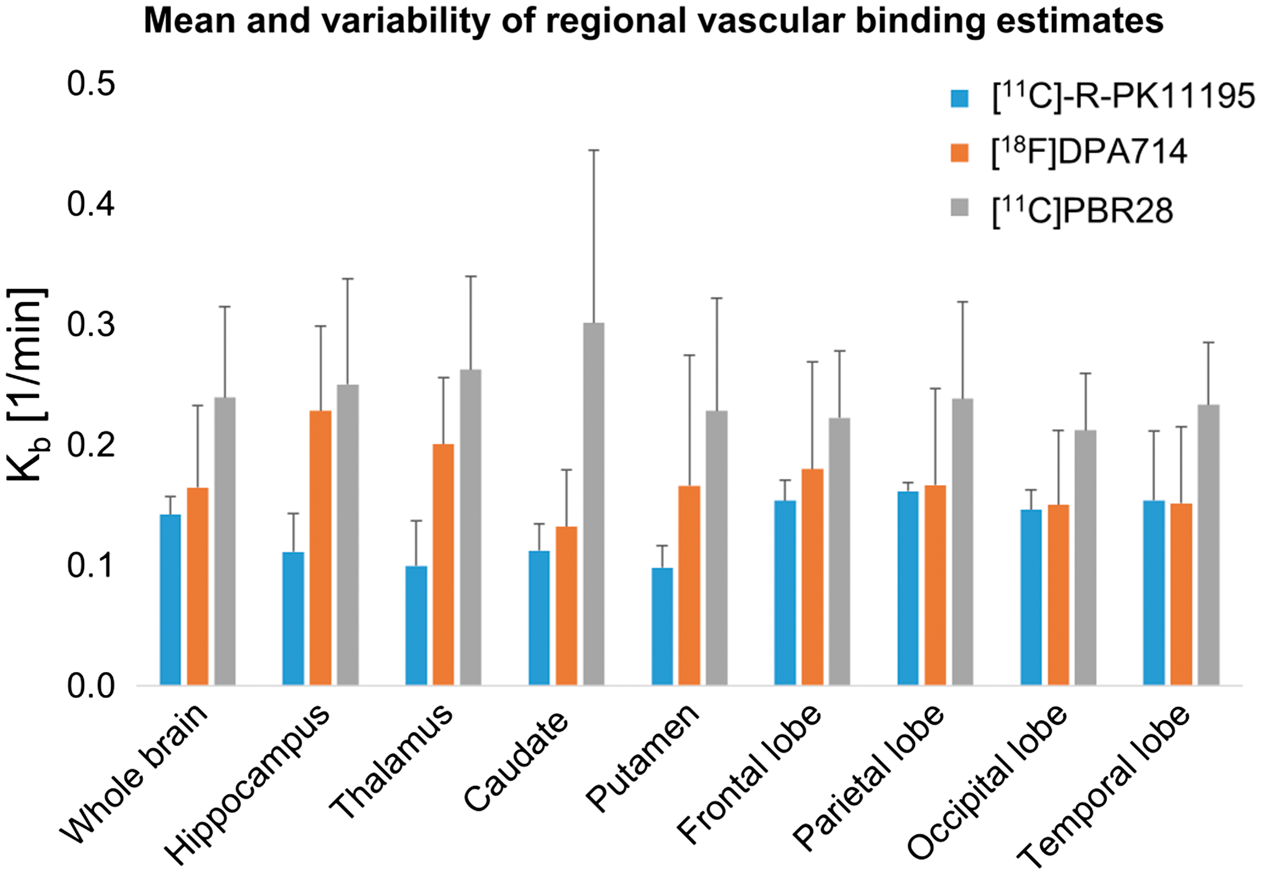
SRTM-Vb
The endothelial fraction was consistent across the brain and precisely estimated (average precision: 16% ± 9%). The between-subject mean value of Kb in the whole brain was 0.14 ± 0.02 L/min (Figure 2 and online supplementary Table 2).
Comparison of the vascular component for tracers with different affinity
The endothelial binding rate estimates for [11C]-R-PK11195, [18F]DPA714 and [11C]PBR28 are reported in Figure 2 and online supplementary Table 2. The vascular binding Kbestimates were statistically different among groups (repeated measure ANOVA, p-value = 0.02), and the differences held for any region considered (p-value<0.05, Bonferroni corrected), but for the putamen, frontal and parietal lobes. The vascular component was proportional to tracer affinity: the higher the tracer affinity (in our case, [11C]PBR28> [18F]DPA714>[11C]-R-PK11195), the higher the Kb estimates. The between-subject mean value of Kb in the whole brain was 0.16 ± 0.07 L/min for [18F]DPA714 and 0.24 ± 0.08 L/min for [11C]PBR28.
Therefore, the affinity of the tracers was positively related to the magnitude of the vascular component.
Similarity of tissue classes kinetics
The normalized grey and white matter kinetics are reported in Figure 3. [11C]PBR28 displayed the most similar curves (angle between grey and white matter kinetics equal only to 5°), whereas the similarity of grey and white matter kinetics was the lowest for [11C]-R-PK11195 (angle of 21°). [18F]DPA714 data presented an intermediate value (angle of 13°). In summary, as hypothesized, the angles amongst kinetic classes were negatively associated to the tracer affinities.
Comparison of grey and white matter tissue kinetics. Analysis of the orthogonality of grey and white matter tissue kinetics for [11C]-R-PK11195 (a), [18F]DPA714 (b) and [11C]PBR28 data (c). The kinetics are reported in z-score with respect to the whole brain activity and normalized by the maximum as in supervised reference tissue clustering.
19
z-Score normalization was calculated by subtracting from each frame its mean and dividing it by its standard deviation. White matter kinetics are displayed in the figure as the inversed curve (i.e. multiplied by −1), in order to highlight the similarity between the grey and white matter time courses.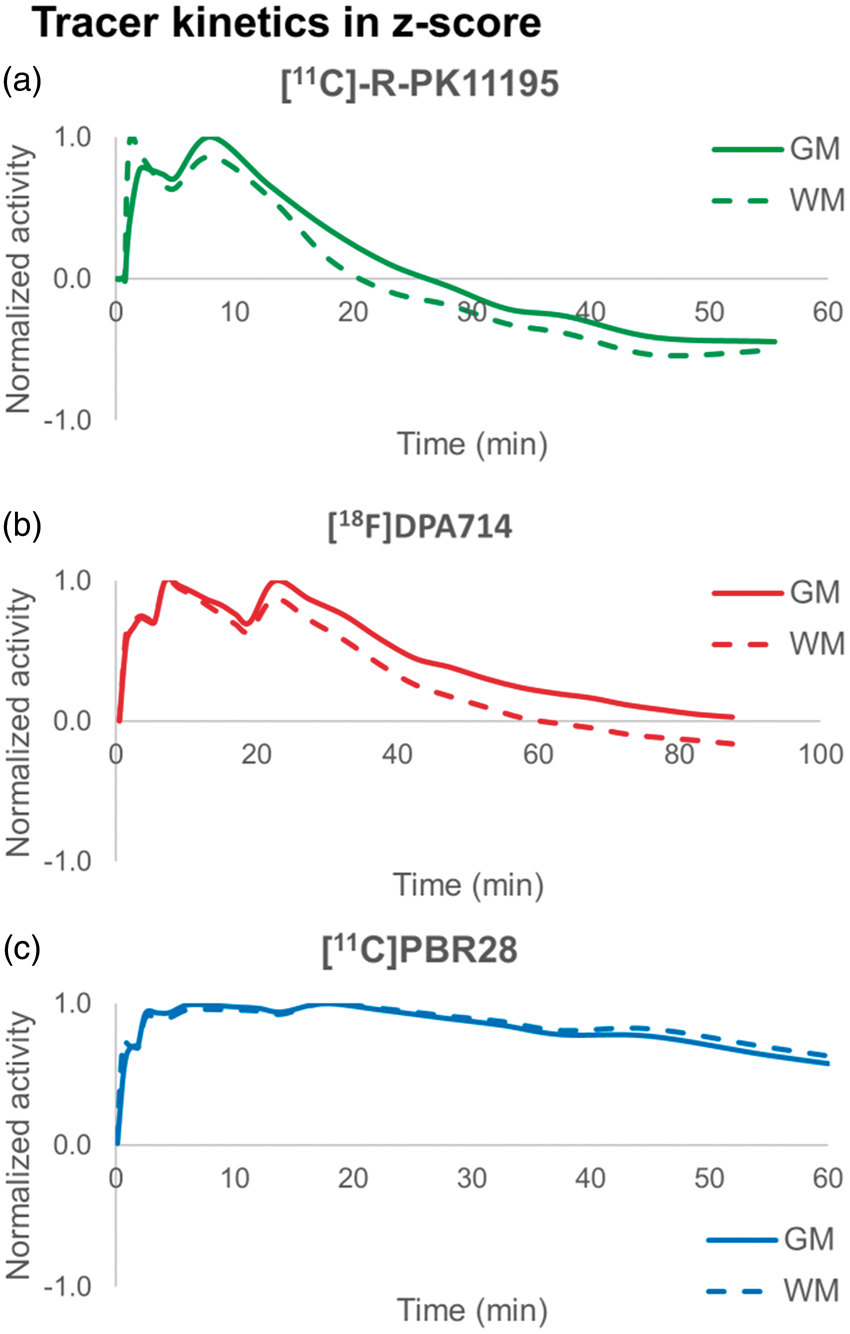
Discussion
TSPO vascular binding correction: Reference region or blood input function?
In this study, we extended the plasma input kinetic model including vascular binding to [11C]-R-PK11195 data and we showed that accounting for the endothelial TSPO component provides a statistically superior description of the tracer uptake, compared to the standard tissue kinetic modelling without correction. This suggests that the endothelial binding model is applicable to TSPO tracers in general, regardless of their affinity for TSPO.
In particular, the 1TCM-1K model provided a more parsimonious data description and better agreement with the reference SRTM-Vb estimates than the compartmental models not including vascular binding. Notably, a similar data description has already been reported in the literature for [11C]-R-PK11195 using spectral analysis (see Figure 5 in Turkheimer et al. 19 ). This finding is also consistent with previous studies showing that [11C]-R-PK11195 binding to endothelial TSPO must be corrected for when considering reference region-based modelling.20,26
Importantly, in the input function-based model, there is an explicit compartmentalization of the vascular component (Figure 4(a)), which is corrected for at the region level. By contrast, the modified SRTM-Vb performs a global correction of the overall tracer activity in the vasculature (which includes the radiotracer both in blood and bound to the blood-brain barrier), obtained by deriving the whole vasculature TAC from the image ( Correcting for vascular TSPO using either blood input functions or reference-based models. The 1TCM-1K and SRTM-Vb approaches for vascular binding correction are illustrated in (a) and (b), respectively. In the input function model 1TCM-1K approach, the tracer activity in the vasculature (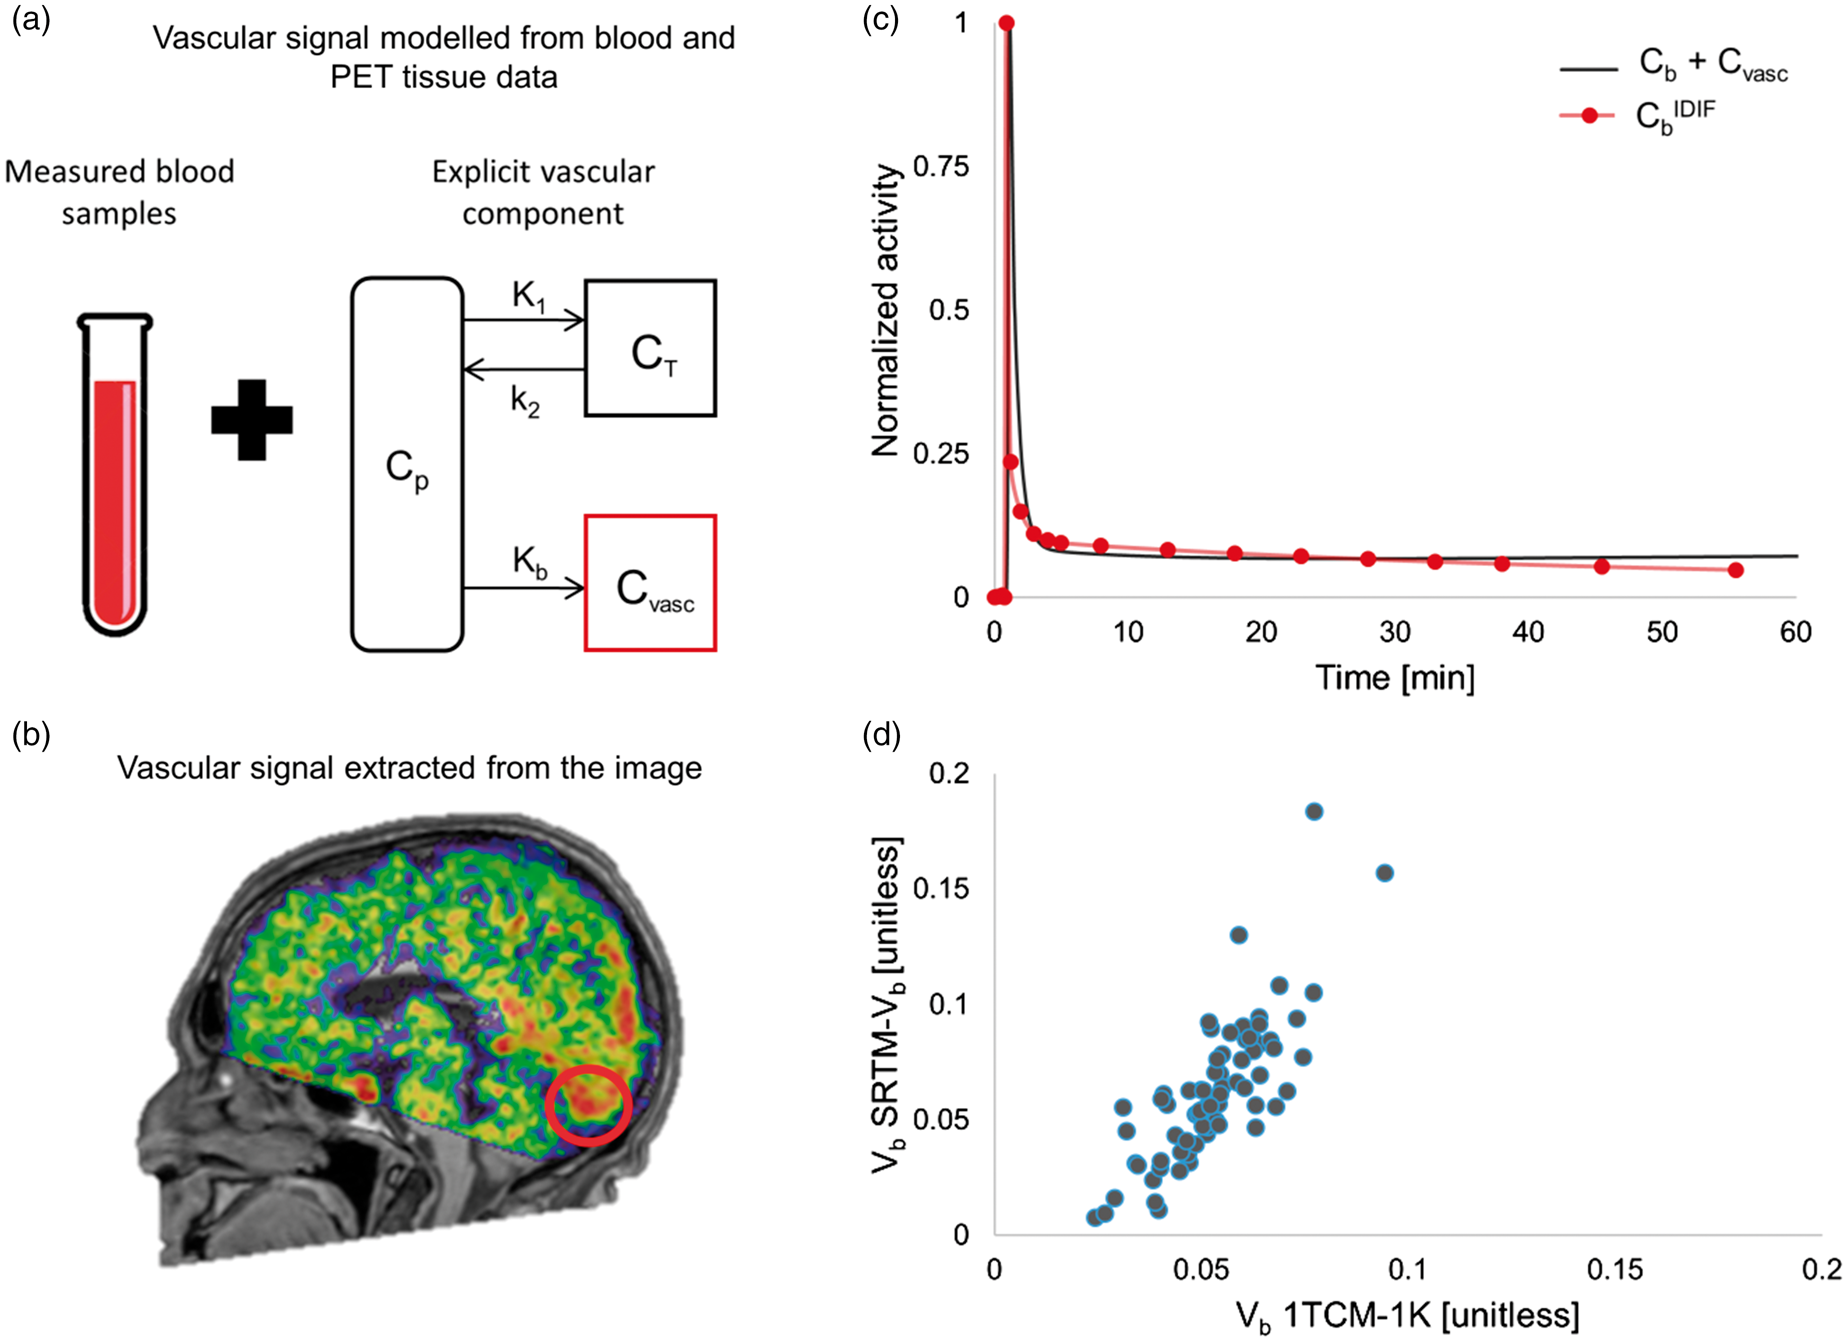
Vascular binding in TSPO tracers
In this study, we extended to [11C]-R-PK11195 our previous results obtained by modelling the vascular component for [11C]PBR28 and [18F]DPA714. We have previously demonstrated that the inclusion in the kinetic model of a vascular compartment to account for the tracer binding to TSPO in vessels (i.e. 2TCM-1K) improves the quantification of brain [11C]PBR28 data, both in healthy populations and in subjects affected by schizophrenia.27,28 The improvement was as well observed in [18F]DPA714 data on healthy volunteers. 29 Moreover, the use of 2TCM-1K for brain [11C]PBR28 PET images has been recently validated with a displacement study with TSPO ligand XBD173. 18 This study showed that only by including the vascular compartment it was possible to apportion the signal change due to the competing agonist to the correct specific compartments. 18
It should be underscored that the [11C]PK11195 dataset presented in the current study includes only healthy subjects, who in general have no high levels of activated microglia and therefore high TSPO binding. However, as previously shown with [18F]DPA714 and [11C]PBR28 data, the inclusion of a vascular component in the kinetic model improves the description of brain [11C]PK11195 data also in healthy volunteers. Notably, the 2TCM-1K model, which is preferable for [18F]DPA714 and [11C]PBR28 data, returned a high percentage of outliers when applied to [11C]PK11195 kinetics. As a consequence, the model that was eventually chosen was the simpler 1TCM-1K. It is possible that the low specific binding in the healthy subjects prevented the identification of a more complex model such as 2TCM-1K. The model 2TCM-1K might be applicable to [11C]PK11195 PET data from subjects with high levels of neuroinflammation.
A key aspect related to the inclusion of a vascular binding in the kinetic model for TSPO tracer is the apparent inconsistency between the reversible binding of the tracer to the parenchyma and the irreversible binding to the vasculature. As we explained previously, this is due to the different reactive volumes, i.e. while the free plasma concentration of the tracer exchanges with endothelial TSPO, only the free fraction in tissue that reaches the mitochondria exchanges with TSPO in microglia and astrocytes. 27 This difference is not properly modelled by the common compartment of the 2TCM model, where the free tracer concentration is the average of a rapidly decreasing concentration from the blood-brain barrier to the intracellular space and mitochondria. 43 Moreover, modelling the endothelial TSPO as a reversible binding in the framework of a 2TCM does not guarantee the identifiability of the parameter (see supplementary materials in Veronese et al. 18 ). The inclusion of a vascular component in parallel to the standard 2TCM was originally supported by the known presence of TSPO in brain vessels confirmed by several studies,22,25 but other scenarios could locate some apparently irreversible component in tissue where slow transport processes and gradients may prevent effective removal. These alternatives should be appropriately tested, since it is unlikely to be determined simply by kinetic modelling of the brain tissue data.
By comparing the vascular binding estimates for TSPO tracers with different affinities, we confirmed our hypothesis that high-affinity second-generation compounds are more affected by vascular TSPO binding than the tracers with lower affinity such as [11C]-R-PK11195. The heterogeneous cellular distribution of TSPO in brain not only makes the tissue quantification particularly challenging but also complicates the definition of a proper reference region, given the ubiquity of TSPO in normal brain and the fact that the pattern of TSPO up-regulation is generally unknown.
Supervised clustering 19 has been the method of choice for a number of studies to automatically define the reference region for [11C]-R-PK11195 data. However, this approach has never been replicated for any second-generation TSPO tracers, other than for [18F]DPA714. 21 In this work, we hypothesized that the tracer affinity, by increasing both parenchymal and vascular binding, would modulate the contrast between tissue kinetics, and thus affect the use of cluster analysis to determine a pseudo-reference region. By comparing the contrast between grey matter and white matter kinetics, we found that [11C]PBR28 displayed the lowest tissue contrast (which suggests that high-affinity tracers are poorly suited to supervised reference tissue analysis), whereas middle-affinity tracers such as [18F]DPA714 would be amenable to supervised definition of a reference region (as confirmed by the successful implementation of super-DPA 21 ).
Another limitation of the study is that the three tracers were acquired in different groups of subjects and with different experimental designs. As a consequence, our contrast analysis was performed at population level only. We tested the sensitivity of the tissue kinetics similarity measures by running some tests in an independent brain PET dataset, consisting of eight healthy subjects who were imaged twice on a high-resolution research tomograph (HRRT) scanner after bolus injection of [11C]PIB tracer, and reconstructed with eight different settings 44 (data not shown). The results showed that (1) the variability of the metric is between 1% to 5%, depending on the reconstruction settings, (2) the mean relative difference between GMvsWM angles (i.e. angle between the kinetic vectors of the grey matter and white matter classes) computed with different reconstruction is 6% ± 6% (mean±SD) and (3) reproducibility of the angle measures (as intraclass correlation coefficient, ICC) was 0.79. This was measured in test-retest data using SPSS21 to compute the ICC using a two-factor mixed effects model and type consistency. Overall, the variability is too low to explain any of the differences between GMvsWM kinetic angles obtained in this study from different TSPO tracers.
Conclusion
Vascular binding is common to all TSPO tracers, regardless of their affinity, and it should be taken into account for tracer kinetic modelling to optimally account for the data. The magnitude of the vascular binding fraction is proportional to tracer affinity and also modulates the tracer contrast between grey and white matter. In particular, high-affinity tracers, such as [11C]PBR28, which have relatively low tissue contrast, are poorly suited for supervised reference tissue analysis.
Footnotes
Funding
The author(s) disclosed receipt of the following financial support for the research, authorship, and/or publication of this article: MV and FET were supported by the Wellcome Trust Strategic Award “Neuroinflammation in Alzheimer’s Disease and Depression”. MV is also supported by the National Institute for Health Research (NIHR) Biomedical Research Centre at South London and Maudsley NHS Foundation Trust and King’s College London. OH is supported by the Medical Research Council-UK (no. MC-A656-5QD30), Maudsley Charity (no. 666), Wellcome Trust (no. 094849/Z/10/Z), the National Institute for Health Research (NIHR) Biomedical Research Centre at South London and Maudsley NHS Foundation Trust and King’s College London. [18F]DPA714 acquisitions were supported by ARSEP and ANR MNP2008-007125 and sponsored by APHP.
Declaration of conflicting interests
The author(s) declared no potential conflicts of interest with respect to the research, authorship, and/or publication of this article.
Authors’ contributions
GR, MV, PZF, FET and AB made substantial contribution to the study design. GR, MV, MT, BB, BS, PSB, OH and FET made substantial contribution to the data collection and analysis. GR, MV, MT, BB, BS, CW, SL, MB, PSB, OH, PZF, FET and AB made substantial contribution to the data interpretation. GR, MV, MT, PZF, FET and AB drafted the manuscript. All the authors critically revised the article. All authors approved the last version.
References
Supplementary Material
Please find the following supplemental material available below.
For Open Access articles published under a Creative Commons License, all supplemental material carries the same license as the article it is associated with.
For non-Open Access articles published, all supplemental material carries a non-exclusive license, and permission requests for re-use of supplemental material or any part of supplemental material shall be sent directly to the copyright owner as specified in the copyright notice associated with the article.