
Abstract
The positron emission tomography radioligand [11C]PBR28 targets translocator protein (18 kDa) (TSPO) and is a potential marker of neuroinflammation. [11C]PBR28 binding is commonly quantified using a two-tissue compartment model and an arterial input function. Previous studies with [11C]HRJ-PK11195 demonstrated a slow irreversible binding component to the TSPO proteins localized in the endothelium of brain vessels, such as venous sinuses and arteries. However, the impact of this component on the quantification of [11C]PBR28 data has never been investigated. In this work we propose a novel kinetic model for [11C]PBR28. This model hypothesizes the existence of an additional irreversible component from the blood to the endothelium. The model was tested on a data set of 19 healthy subjects. A simulation was also performed to quantify the error generated by the standard two-tissue compartmental model when the presence of the irreversible component is not taken into account. Our results show that when the vascular component is included in the model the estimates that include the vascular component (2TCM-1K) are more than three-fold smaller, have a higher time stability and are better correlated to brain mRNA TSPO expression than those that do not include the model (2TCM).
INTRODUCTION
The 18 kDa translocator protein (TSPO)—formerly known as the peripheral benzodiazepine receptor or PBR—is a protein located on the outer mitochondrial membrane and is part of the mitochondrial permeability transition pore. It is involved in a number of mitochondrial functions, including steroidogenesis, Ca2+ signaling, generation of reactive oxidative species and apoptosis.
1
TSPO is highly expressed in macrophages, activated microglia and reactive astrocytes and is therefore a putative biomarker of inflammation.
2
TSPO binds cholesterol with great affinity but also synthetic ligands such as the isoquinoline carboxamide PK11195. PK11195 labelled with [
11
C] has been extensively used with positron emission tomography (PET) to assay TSPO concentration
Although these new tracers generally displayed very favorable characteristics in animal models, human studies have been plagued by a high intersubject variability in binding affinity. 7 Genetic differences may partly explain this variability. In fact, a polymorphism of the TSPO protein, due to an Ala-Thr amino-acid substitution in the peptidic chain, 8 identifies three different classes of binding affinity: high-affinity binders (HAB), mixed-affinity binders (MAB) and low-affinity binders (LAB). Genotype analysis allows the stratification of subjects into more homogeneous human cohorts, thus increasing statistical power. 9
However, genetic differences do not seem to account entirely for the substantial variability found in humans with these new inflammation ligands. A recent study failed to demonstrate increased neuroinflammation with aging 10 despite the fact that microglial activation is an aging hallmark. 11 Another study demonstrated lack of microglial activity in patients with mild depression. 12 Although this particular depression phenotype might not have a neuroinflammatory component, TSPO binding was unexpectedly reduced in the depressed cohorts. 13
The only positive study that has included genotyping in the design is the one by Kreisl
In the present study, we sought to investigate the reasons for the high binding variability of novel TSPO PET ligands. In particular, we focused on the quantitative approach used for these tracers. Kinetic modeling of TSPO binding is generally performed with a two-tissue compartmental model (2TCM). This model includes a tissue compartment representing the free tracer in tissue and the ligand unspecifically bound and a compartment for the ligand specifically bound to the target. 15 One of the basic assumptions of compartmental models is that the ligand concentration in each compartment, in either bound or free form, is homogeneous. However, immunohistochemical studies show a heterogeneous TSPO distribution at the microscopic level in the healthy brain. 16 A much higher microglia density is found on the vessel walls (i.e. the endothelium and smooth wall muscles) than in the brain parenchyma. Also, a concentration gradient is likely to occur through the brain parenchyma, where the ligand binds non-specifically to lipids on its way to the binding sites. This phenomenon should be more important for tracers with high lipophilicity, such as second-generation TSPO ligands. 17
As elegantly demonstrated by Delforge
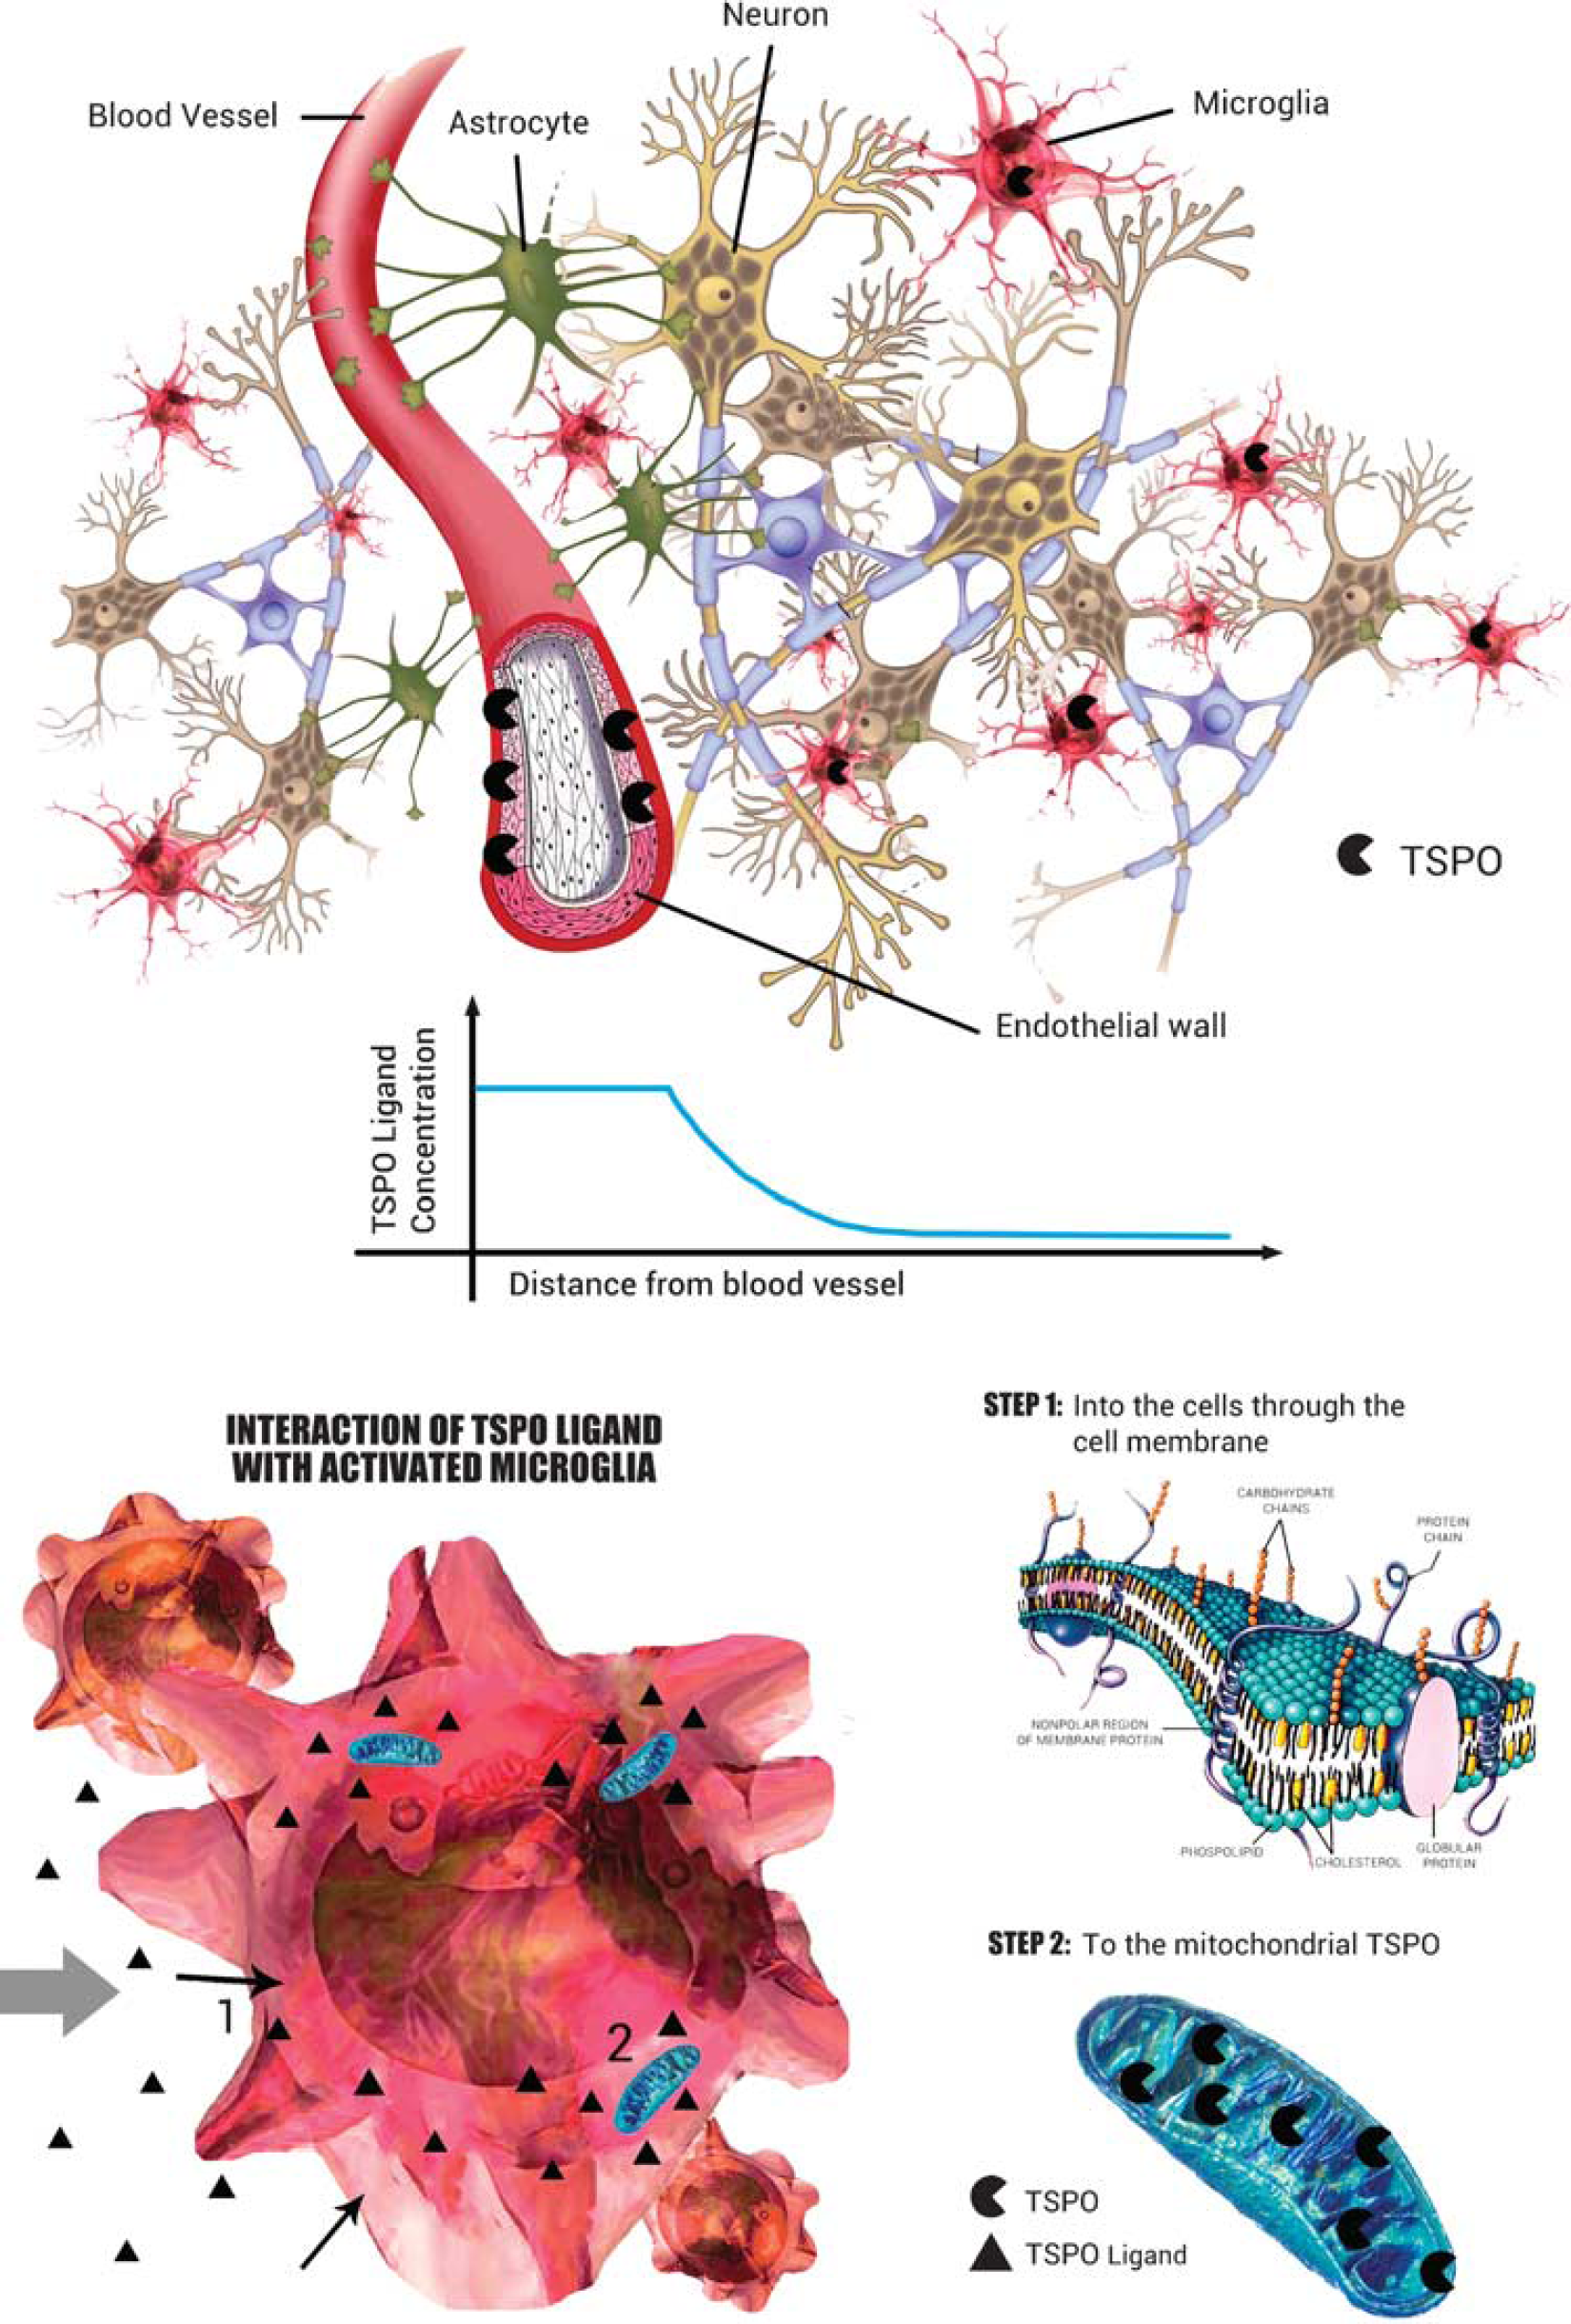
Interaction of TSPO ligand with brain parenchyma. The TSPO has a heterogeneous distribution in the normal brain parenchyma. The endothelium expresses high concentrations of TSPO, which has implications for PET kinetics. The free [ 11 C]PBR28 concentration in tissue is not expected to be generally uniform but distributed along a gradient from the capillary space to the microglia, passing through the endothelium into the extracellular space. In the brain parenchyma the ligand exchanges with lipids (molecular bilayer) and possibly other proteins. It then enters the microglial inner cellular space to reach the mitochondria. All these interactions lower the concentration of the [ 11 C]PBR28 amenable to bind the TSPO. This creates a change in the apparent affinity of the tracer of the target. Thus, the apparent affinity would be higher closer to the vascular space, with resulting slower kinetics for the bound fraction (e.g. irreversible trapping).
In a previous work with [ 11 C]HRJ-PKI1195, we have demonstrated a consistent slow TSPO binding component clearly localized in the brain main vasculature, venous sinuses and arteries, associated with a faster equilibrating component that we attributed to microglia. 20 We then incorporated this vascular TSPO component into the model and demonstrated that, when vascular sclerosis causes a substantial reduction of vascular TSPO concentration, the neuroinflammatory component of the tracer shows a downward bias. 21
In this work, we observed that the most commonly used model to describe [ 11 C]PBR28 kinetics does not adequately fit the initial part of the brain time-activity curves. Considering the findings that showed the presence of TSPO receptors in the brain vasculature, we therefore hypothesized the existence of a tissue binding component together with a greater slow binding component of vascular origin.
In this study we used clinical [ 11 C]PBR28 data from healthy volunteers and computer simulations to (1) propose a new kinetic model for [ 11 C]PBR28 that would take into account the slow uptake of the radioligand into the vessels, which we considered as irreversible for modeling purposes, (2) quantify the bias and variability of a model that does not include such irreversible component.
MATERIALS AND METHODS
Compartmental Models
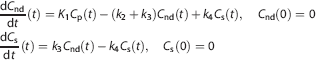
where the microparameters

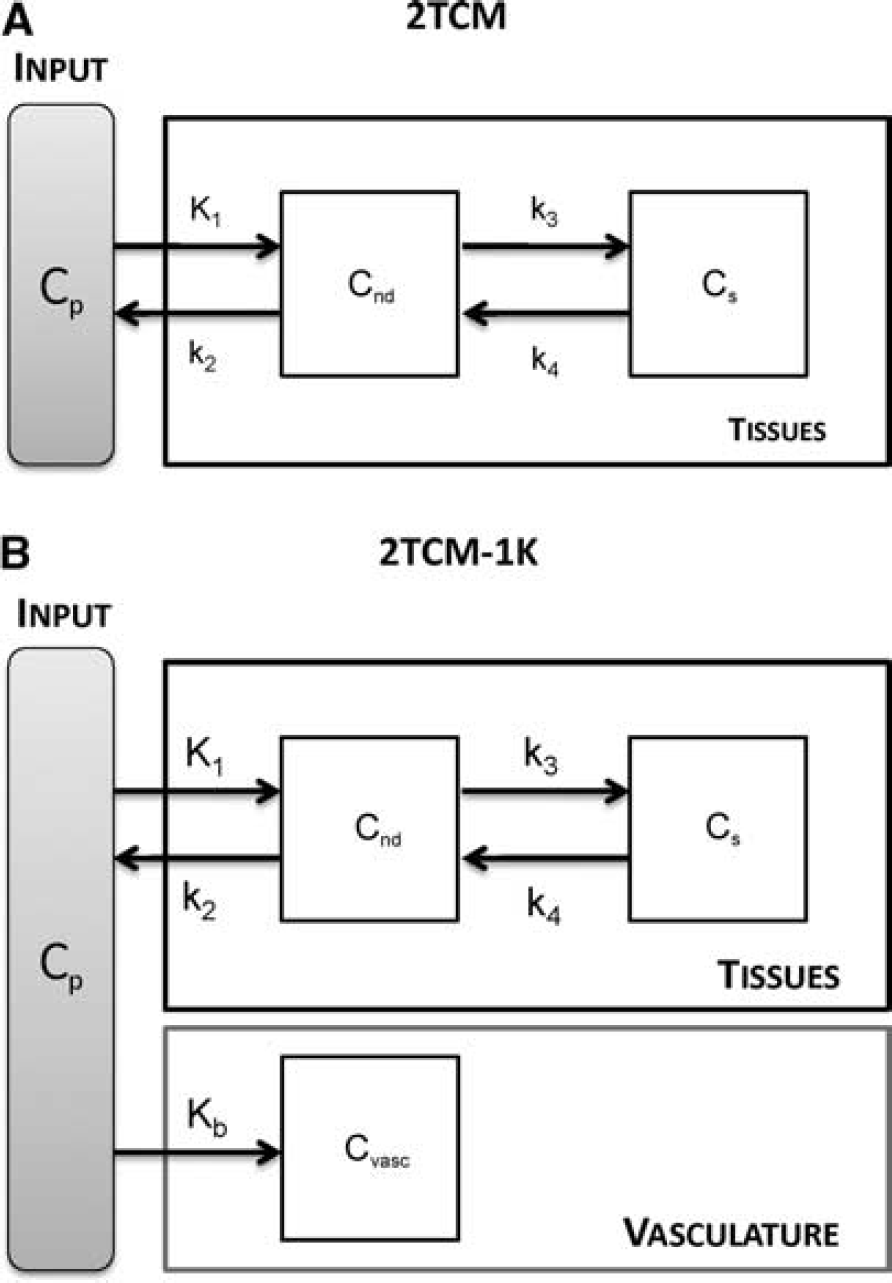
2TCM and 2TCM-1K model structure.
The total amount of radioactivity measured by PET,
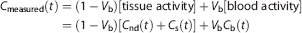
where
We propose a new model, 2TCM-1K, in which an irreversible compartment to account for the binding of the tracer to the TSPO in the blood vessels (
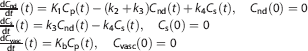
According to this model, the measurement equation becomes:
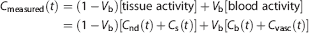
where the microparameter
The total volume of distribution
Application to Measured PET Data
Among the 19 subjects, 10 were heterozygous for the Ala147Thr polymorphism of TSPO, conferring MAB; 8 were homozygous HAB, and for 1 subject no information was available.
All PET images were acquired on an Advance Nxi tomograph (GE Medical Systems, Waukesha, WI, USA), after a bolus injection of 690 ± 13 MBq of [
11
C]PBR28. An 8-minute 68Ge transmission scan of the brain was acquired for subsequent attenuation correction. Two different experimental protocols were employed. For the first data set dynamic scans comprised 33 frames (6 frames of 30 seconds each, then 3 × 60 seconds, 2 × 120 seconds, and 22 × 300 seconds) for a 120-minute experiment duration, while for the second data set dynamic scans lasted 90 minutes (27 frames: 6 frames of 30 seconds each, then 3 × 60 seconds, 2 × 120 seconds, and 16 × 300 seconds). PET data were reconstructed on a 128 × 128 matrix with a pixel size of 2.0 × 2.0 × 4.25 mm. Details regarding image reconstruction and correction are reported in Hines
During the acquisition, blood samples (1.0 mL each) were drawn from the radial artery at 15-second intervals until 150 seconds, followed by 3 to 4.5-mL samples at 3, 4, 6, 8, 10, 15, 20, 30, 40, 50, 60, 75, 90, and 120 minutes. The plasma time-activity curve was corrected with the fraction of unchanged radioligand, as previously described. 27
Each subject underwent 1.5- or 3-T clinical brain T1-weighted magnetic resonance imaging (MRI). MRI images were used to derive the anatomical information necessary to define the ROIs.
The Anatomic Automatic Labeling template was coregistered on each subject's MRI scan and PET image using Statistical Parametric Mapping 8 (Wellcome Department of Cognitive Neurology). Whole-brain and 10 brain regions were selected: frontal cortex, parietal cortex, occipital cortex, striatum, thalamus, cingulum, hippocampus-amygdala, insula, thalamus, and cerebellum. Data from bilateral regions were the mean of both the left and the right regions.
Model Identification
Both 2TCM and 2TCM-1K model parameters have been identified at the region of interest (ROI) level using the weighted nonlinear least square estimator (WNLLS), as implemented in Matlab (The Mathworks Inc., Natick, MA, USA). Initial microparameter values for 2TCM and 2TCM-1K were set based on the literature.
23
The initial value of
The relative weights for the individual data points were defined as the inverse of the variance of the PET measurement error. This was assumed to be additive, uncorrelated, having a Gaussian distribution with zero mean and variance equal to the decay-corrected activity divided by the length of the relative scan interval, multiplied for a scale factor γ. The proportionality constant γ was estimated
Statistical Analysis
Regions with
The comparison was carried out separately for HAB and MAB subjects.
Simulation Studies
Simulation studies were performed to:
(1) assess whether the error of applying 2TCM when the system presents a vascular slow component can be considered negligible and to evaluate how the 2TCM reflects the simulated binding variation;
(2) assess whether the use of 2TCM-1K in a system without vascular trapping leads to erroneous results, in particular whether the model identifies an inexistent irreversible compartment.
(1) The parameter estimates obtained with 2TCM-1K on the whole-brain 120-minute time-activity curves (TAC) of one HAB and one MAB subject became the baseline values. The baseline
(2) For each
(3) Noisy TAC data were then obtained by summing noise-free data and simulated white noise (zero-mean and Gaussian distribution). The simulated noise variance was defined as for the measured data, i.e. frame length over tissue activity, with the proportionality constant
In summary, 300 HAB and 300 MAB kinetics TACs (50 curves × 6
where
RESULTS
Model Comparison on Clinical Data at 90 minutes
Both 2TCM and 2TCM-1K models described well the descending part of the tissue curves, but 2TCM poorly fitted the initial part of the TAC (Figure 3). In particular, the first 5 minutes of the TAC were constantly underestimated. For this reason, the 2TCM weighted residuals were not randomly distributed, but demonstrated a polarized behavior especially during the first minutes.
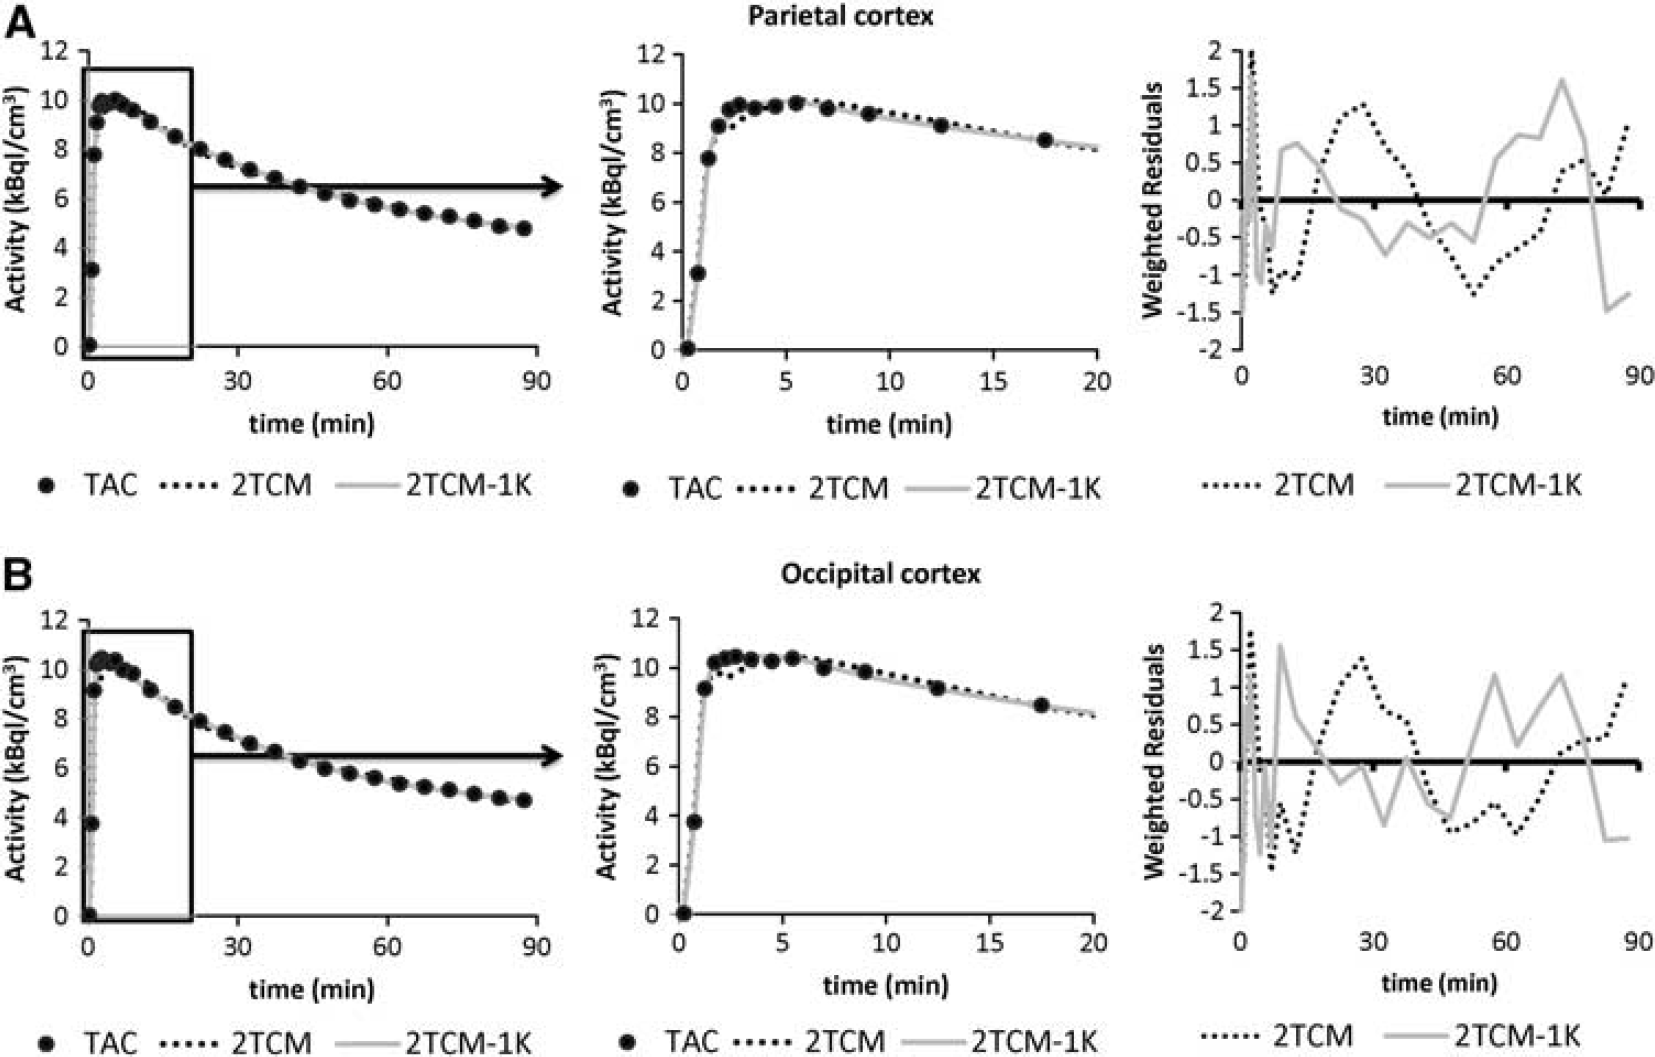
Model fit comparisons. Example of model fits to the parietal
Nevertheless, 2TCM-1K improved the curves fit to the tissue data points in all the regions and increased the randomness of the weighted residuals (Figure 3). To quantify this improvement, we calculated with both models the mean relative difference of the weighted residual sum of squares (WRSS) and the mean relative difference of the residual sum of squares (RSS). 2TCM-1K gave lower values (i.e. a better fit) than 2TCM using both criteria (−64% ± 15% and –74% ± 13%, expressed as mean ± s.d., respectively). Supplementary Figures 1 and 2 report the single-compartments time courses for both 2TCM and 2TCM-1K for the same regions of Figure 3. Supplementary Figures 3 and 4 report the 2TCM and 2TCM-1K fit comparison in other regions of interest for a representative HAB subject (thalamus and insula).
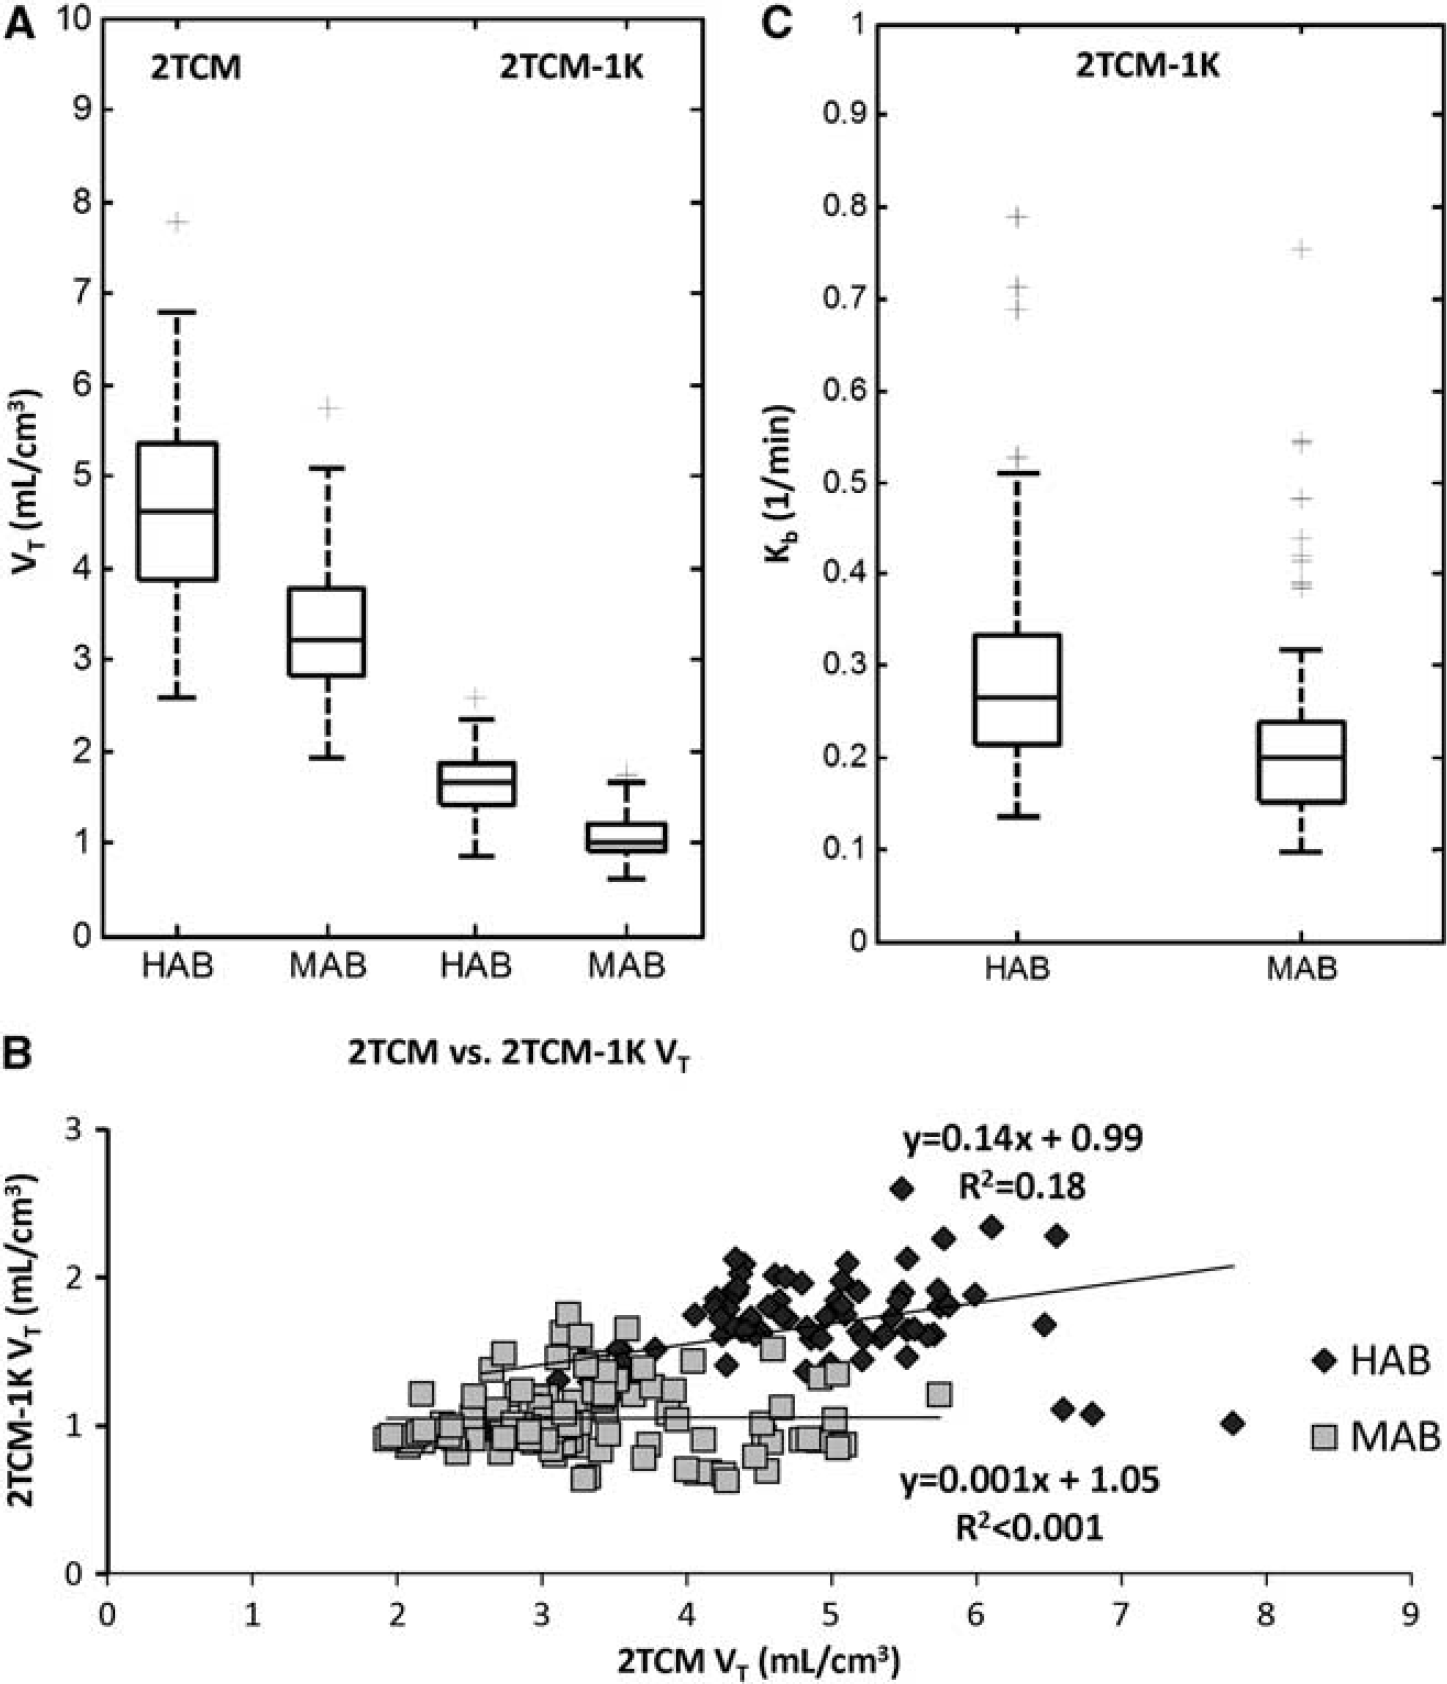
Distributions and correlation of regional
In terms of outliers the two models performed similarly: considering all the subjects and all the brain regions, 2TCM-1K properly identified all the TACs, while 2TCM showed a poor fit in only one brain region of one subject (frontal cortex of a HAB subject). The outlier region was excluded from further statistical analyses, which were performed on the intersection of the regions where both models returned physiological and precise estimates.
The precision of the remaining individual
In terms of parsimony criteria, 2TCM-1K outperformed 2TCM (AIC for 2TCM-1K was smaller in 94% of the regions), thus confirming the identification of 2TCM-1K as the optimal model among the tested ones to describe [ 11 C]PBR28 brain data. Notably, the remaining 6% of the regions in which the 2TCM model had a smaller AIC were concentrated in the striatum, the hippocampus/amygdala, insula and the thalamus.
The regional mean
Between-subject mean and variability of
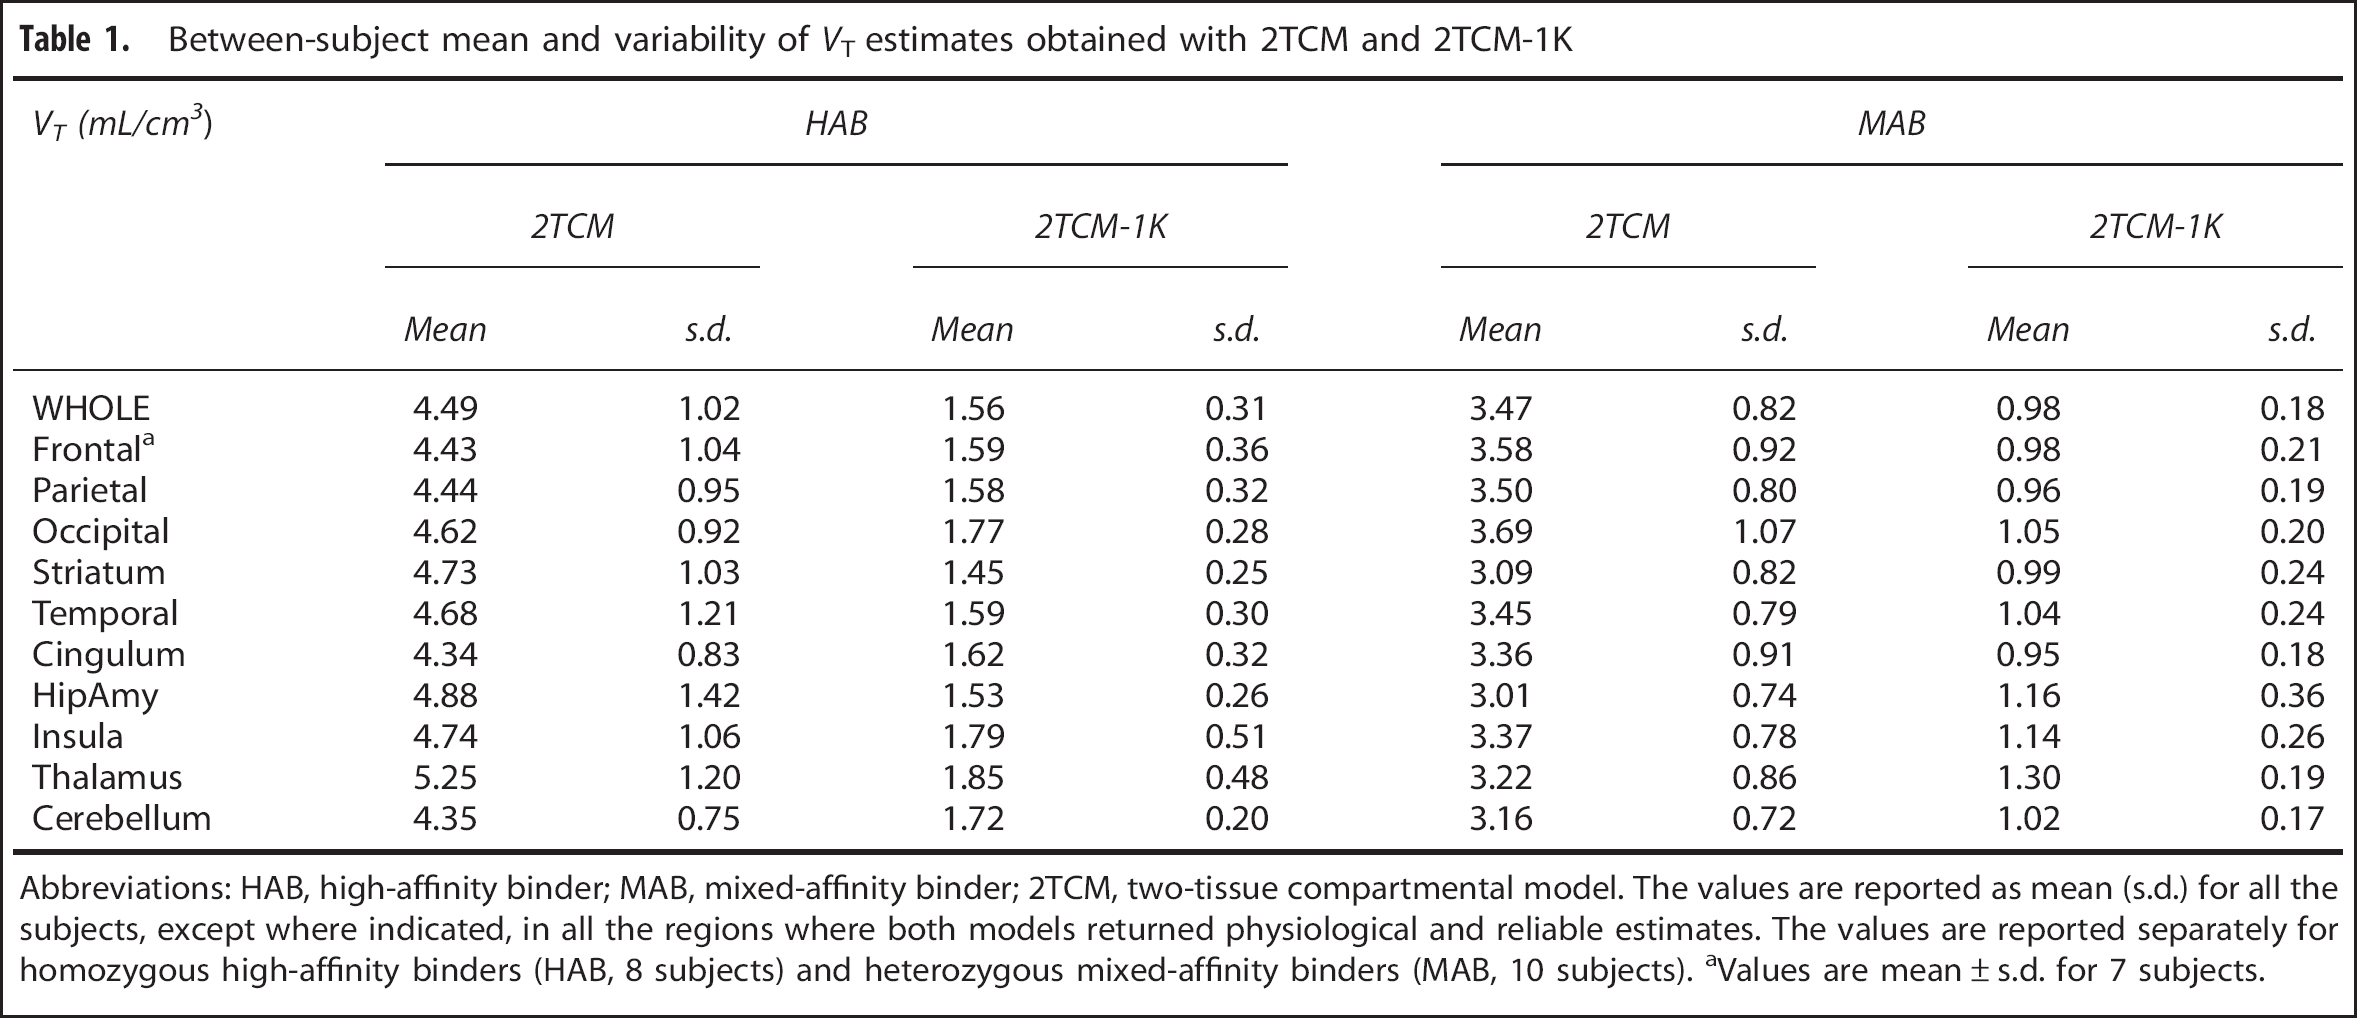
Abbreviations: HAB, high-affinity binder; MAB, mixed-affinity binder; 2TCM, two-tissue compartmental model. The values are reported as mean (s.d.) for all the subjects, except where indicated, in all the regions where both models returned physiological and reliable estimates. The values are reported separately for homozygous high-affinity binders (HAB, 8 subjects) and heterozygous mixed-affinity binders (MAB, 10 subjects). aValues are mean ± s.d. for 7 subjects.
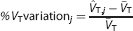
The regional variability of
Statistical description of the distribution of
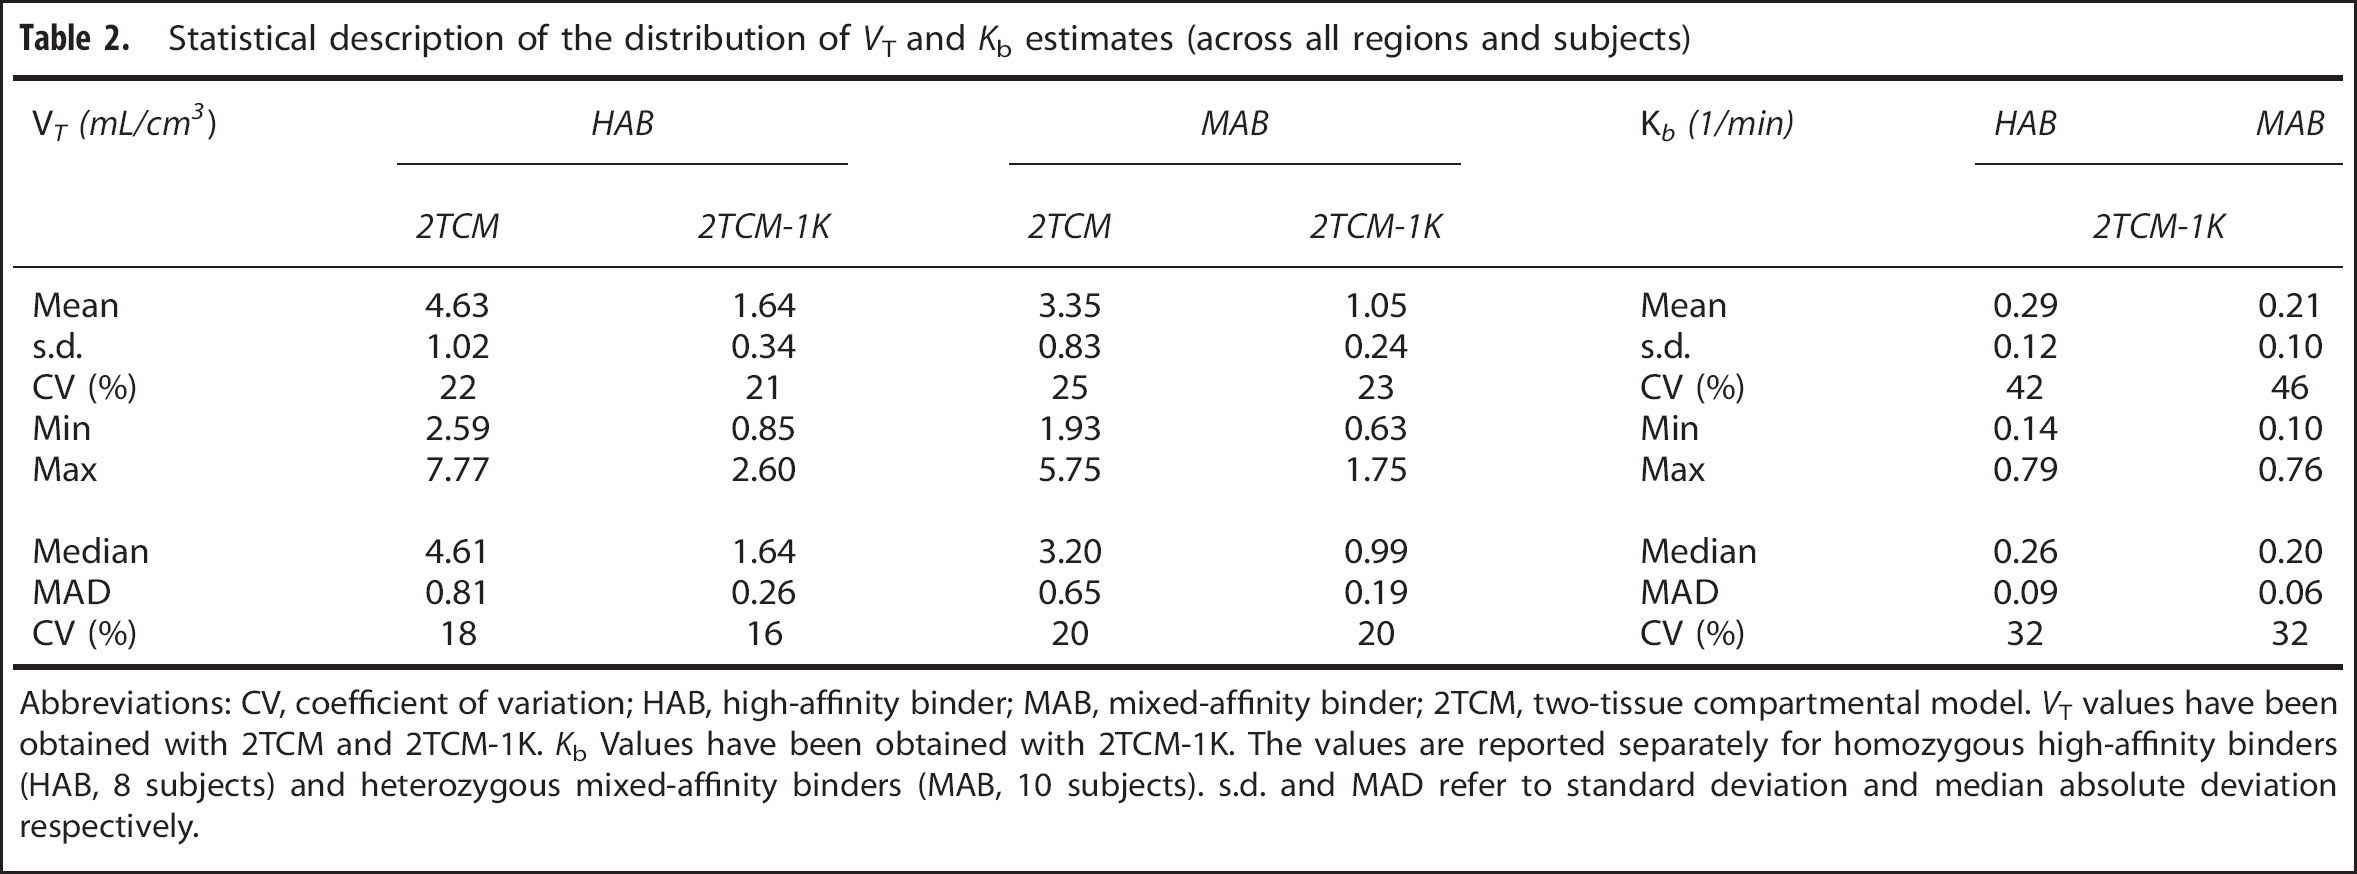
Abbreviations: CV, coefficient of variation; HAB, high-affinity binder; MAB, mixed-affinity binder; 2TCM, two-tissue compartmental model.
The between-subject variability of
The vascular component estimated with 2TCM-1K was consistent across the brain and precisely estimated (average precision between regions: 11% ± 8%). The between-subject mean value of
We also considered separately the model performance in the two different data sets (i.e. young versus elderly subjects). Two main findings resulted from the comparison: (1) 2TCM-1K better described brain [
11
C]PBR28 data compared with 2TCM in elderly subjects (smaller AIC in 100% of ROIs; higher mean relative difference of WRSS and RSS, equal to –67% ± 17% and –79% ± 1%, respectively); (2) it was not possible to determine a unique trend of
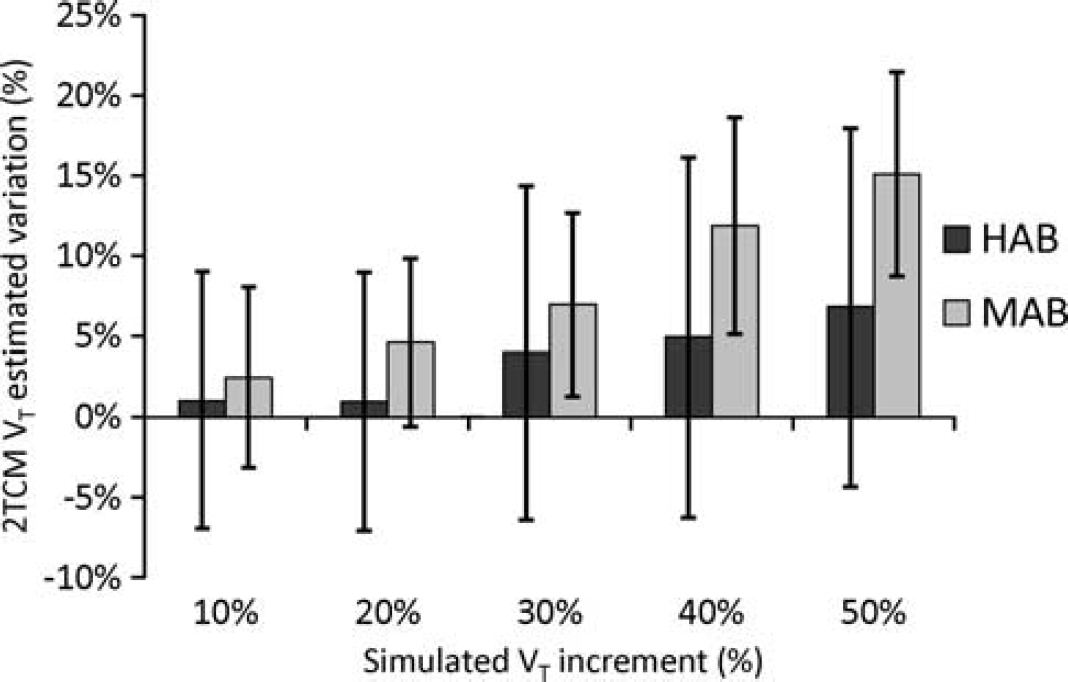
Application of 2TCM in simulated tissues with vascular trapping. We simulated different scenarios of
The remaining subject of the data set (not tested for genetic polymorphism) showed very high values of
Finally,
Impact of Experimental Protocol
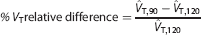
Reducing the experimental scanning time caused an important reduction in
Genomic versus PET Analysis
When we considered the comparison mRNA-PET binding for all the subjects (HABs and MABs), 2TCM-1K
We also assessed separately HABs and MABs, even though no genotype effect was expected in the mRNA profiles. Nevertheless, we found that the
In general, the mRNA-PET cross-correlation values for 2TCM-1K were comparable with the mRNA auto-correlation of TSPO gene expression: from R2 = 0.37 to
Notably,
Simulation Studies
2TCM converged in all MAB curves, yielding reliable and precise but not accurate estimates. In HAB curves there were however varying percentages of outliers. In particular, when considering a 30% increase of
Importantly, 2TCM greatly underestimated the increase of simulated
DISCUSSION
In this work we proposed a new modeling approach for [ 11 C]PBR28 brain PET studies, 2TCM-1K, by adding an irreversible compartment to the standard 2TCM. In particular, we demonstrated that the inclusion of the vascular binding component in the kinetic modeling of this tracer always provided a more parsimonious description of the data. Compared with 2TCM, 2TCM-1K was always selected as the optimal model to describe the data, according to all the indexes evaluated (residuals, parsimony criteria, estimates' values and precisions).
In addition, the new model showed to be insensitive to reduce scan duration (from 120 to 90 minutes), with an average relative difference smaller than 2%. On the contrary, 2TCM applied to 90-minute tissue curves showed a reduction in
The
Among the anatomical regions considered, none could be used as the reference region, as specific binding was found all over the brain.
Importantly, microglial
Using the novel model, the known relationship between
Notably, the
In this work, the plasma free fraction of the radioligand (
The use of the new kinetic model consistently reduced the variability of the tissular
The novel 2TCM-1K includes a vascular irreversible component, which is associated to the parent plasma
Further evidence of the need to model the tracer binding to the vasculature was obtained by applying the 2TCM-1K to a gray matter region and to a vascular tissue curve. While in the gray matter the 2TCM-1K was reliably identified, in the vascular tissue the model collapsed to a single-tissue compartment and the vascular trapping remained unaltered (Supplementary Figure 10.
The brain vascular trapping
Given that the standard model to quantify [
11
C]PBR28 binding is a 2TCM, including when different populations of subjects (healthy versus pathological) are compared, we investigated the impact of not including the endothelial component in the quantification and the correlation between the estimates of the two competing models. The analysis of the clinical data demonstrated that 2TCM and 2TCM-1K
Further investigations of the 2TCM-1K performance in clinical models with neuroinflammation are required. Notably, for the validation of this new model in pathological conditions, correlation with biological evidence (such as immunohistochemical staining) becomes even more essential than in the healthy-subject conditions.
CONCLUSION
The use of a model that explicitly accounts for the endothelial TSPO binding is fundamental for a precise and accurate quantification of [ 11 C]PBR28 brain PET data.
When this component is neglected, the receptor binding in tissue is severely underestimated and binding changes due to neuroinflammation may be lost.
Footnotes
The authors declare no conflict of interest.
ACKNOWLEDGMENTS
We thank Dr Robert Innis and Dr Masahiro Fujita at the Molecular Imaging Branch of the National Institute of Mental Health for providing the [ 11 C]PBR28 images and for the interesting scientific discussions regarding the results.
APPENDIX 1
To derive the measurement equation for 2TCM-1K in terms of concentrations, we start by formulating it in terms of mass.
35
The total amount measured by PET,
where qnd(
Denoting with
Expressing
From A1.3 it is easy to derive the blood volume fraction as
APPENDIX 2
The proposed 2TCM-1K model, as defined in ![]() , can be represented by the following system of first-order differential equations:
, can be represented by the following system of first-order differential equations:
The total amount of radioactivity measured by PET,
where
Solving for
Thus, the Laplace transform of
which leads to
The exhaustive summary of the model is given by
where φ1, …, φ6 are the known observational parameters. It is easy to show that all the six parameters
References
Supplementary Material
Please find the following supplemental material available below.
For Open Access articles published under a Creative Commons License, all supplemental material carries the same license as the article it is associated with.
For non-Open Access articles published, all supplemental material carries a non-exclusive license, and permission requests for re-use of supplemental material or any part of supplemental material shall be sent directly to the copyright owner as specified in the copyright notice associated with the article.