
Abstract
Computations are described which estimate flows in all branches of the cortical surface arteriole network from two-photon excited fluorescence (2PEF) microscopy images which provide the network topology and, in selected branches red blood cell (RBC) speeds and lumen diameters. Validation is done by comparing the flow predicted by the model with experimentally measured flows and by comparing the predicted flow redistribution in the network due to single-vessel strokes with experimental observations. The model predicts that tissue is protected from RBC flow decreases caused by multiple occlusions of surface arterioles but not penetrating arterioles. The model can also be used to study flow rerouting due to vessel dilations and constrictions.
Keywords
Introduction
The three-dimensional vascular network of the cortex plays an important role in redistribution of blood flow in response to microvascular strokes and to neural activation. Since the vascular structures vary across individuals, it is important to be able to determine how the variations in the vasculature govern hemodynamic responses.
The microvasculature has been studied in two-dimensional tissues such as rat mesentery 1 and such investigations provide estimates of network-level behavior such as mean segment hematocrit and the distribution of blood flow velocities. For the cortical microvasculature, mathematical models of hemodynamics have successfully described changes in CMRO2 and characteristics of BOLD response curves.2–10 While these models can be used with experimentally determined network topologies, the parameters are not easy to tailor to a specific network under study and the models provide limited accuracy in estimates of RBC flow in individual vessels.28–30
Two-photon excited fluorescence (2PEF) microscopy can measure RBC flows in individual cortical microvessels including the arterioles on the cortical surface.11–13,31 However, accurate modeling is often limited by experimental constraints such as variability over time and limited regions of measurement. We have developed a computational method that addresses these limitations and estimates values for flows in all vessels of a specific arteriole network on the cortex surface based on physiological parameters determined for that network. We validated the method by comparing the flow predicted by the method with measured flows and by comparing flow redistribution in the network due to single-vessel microvascular strokes with experimental observations.14,15 With additional simple assumptions about the effect of one or more microvascular strokes or neural activation, the model predicts how flows throughout the network will change in the presence of strokes or due to vessel diameter changes induced by neural activity.
Material and methods
With regard to computational methods, we model the microvascular system as a network of linear resistances that obeys Kirchhoff’s Current and Voltage Laws (KCL and KVL, respectively) in which voltage is analogous to pressure and electrical resistance is analogous to fluid resistance. The approach is sketched in Figure 1 and described in detail in Supplement Section B. In summary, (1) the topology of the network, the values of the resistance for each branch in the network, and the RBC speeds are constrained by the 2PEF experiments, (2) RBC flows are approximated by using experimental measurements of RBC centerline speeds in individual vessels and a previously estimated parabolic flow profile in arterioles,
27
(3) the vessels that exit the imaged volume are either connected to a common ground via pressure sources (“boundary pressures”) for surface arterioles or via a resistor modeling the penetrating arteriole and the capillary bed for penetrating arterioles, and (4) the values of the boundary pressures and their shared affine variation with time are estimated by a weighted least squares problem which compares flows predicted by the mathematical model with flows estimated from the 2PEF data.
Modeling of flows in cortical arterial networks. (a)–(e) Describe the process of measuring flows and determining topology. We implanted cranial windows in anesthetized rodents, injected fluorescent dye into the blood stream to label the blood plasma, and imaged the cortical vasculature using 2PEF microscopy. (a) 2PEF image of fluorescently labeled blood vessels on the cortical surface overlaid with the hand-traced arterial network. Red segments of the network indicate segments where a line scan was performed to determine RBC speed. Penetrating arterioles branched off from this network and plunged into the brain to feed the capillary beds. (b) Projection of an image stack of a cortical arteriole. The diameter was determined by analysis of the vessel edge profile. (c) Line scan data from vessel in (b) used to quantify RBC speeds. The image is a sequence of line scans performed at the center of the vessel, the non-fluorescent RBCs show up as dark streaks on this space time image, and the slope of the streak is the inverse of the RBC speed. (d) Experimental measurements of vessel diameter and RBC speed as determined in (b) and (c) for the section of the arterial network highlighted in the white box in (a). (e) Flows calculated from the diameter and the RBC speeds in (d) assuming a parabolic flow profile, along with the measurement time for specific vessel segments relative to the first measurement in the experiment. Note that the RBC speed measurements were made serially and there was as much as several hours between measurements from different vessels. (f)–(j) Describe the circuit model, the process for estimating the unknown parameters in the circuit, and some basic validation for the process. (f) Schematic of a section of the arterial network as modeled by a resistive network. Red resistors indicate vessel resistance determined from the diameter and length of the vessel segment. Blue resistors represent the resistance of the capillary bed downstream from penetrating arterioles and are of uniform resistance and connected to the same ground. The boundary pressure sources (none appear in the white box of (a)) are placed at the edges of the surface vessels that exit the imaged area and are modeled to have an affine time dependence (equation in figure) to account for time-varying physiology. (g) Effectiveness of using an affine time dependence to account for the time varying physiology during the experiment. The data points represent the flows from repeated experimental speed measurements of the vessel “A” in the network (inset). The blue line is the linear regression of the experimental observation, and the green line is the flow estimated in vessel “A” by the model using measurements in other vessels in the network and boundary pressure sources with affine time dependence. (h) Flows estimated using the model in all the vessels at the time of the first measurement, i.e. t = 0. (i) Flows calculated using the model in the vessels for which speed measurements were taken at the time of the experimental measurement, taking the time-dependent change in boundary pressures into account. (J) Histogram of fractional errors between flows estimated by the model and the experimentally determined flows.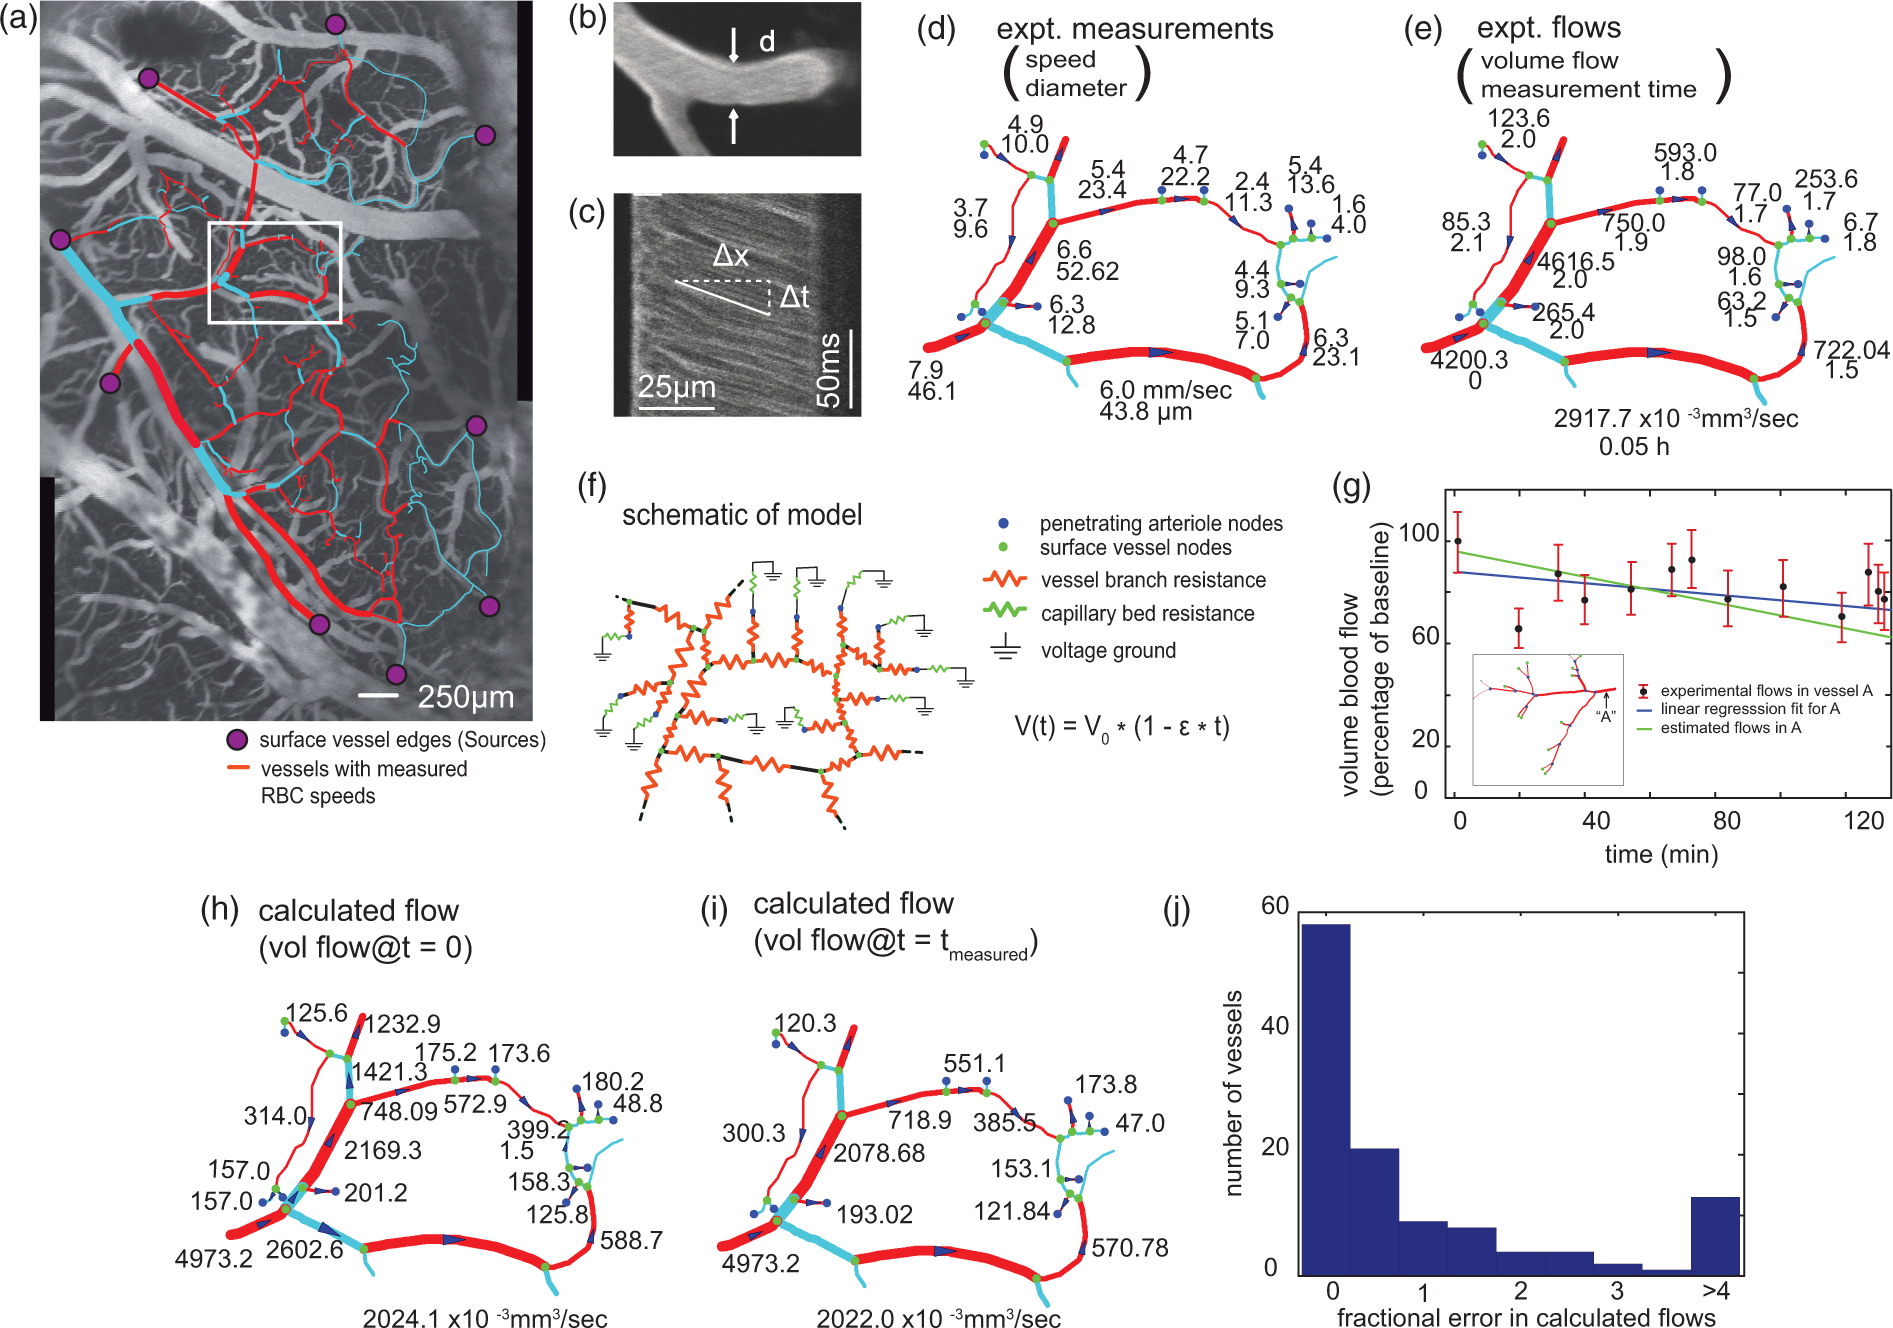
Computational details behind validation of the model, experimental design, prediction of flows in the presence of strokes, and prediction of tissue perfusion are in Supplement Section D.
With regard to experimental methods, data from two rats came from a previous study. 16 In addition, one new experiment was performed using the same surgery and imaging protocols as in Nishimura et al. 16 and is detailed in Supplement Section E. The “Institutional Animal Care and Use Committee” at Cornell University (https://www.iacuc.cornell.edu/) approved the procedures used in this study. The University has accreditation from the Association for Assessment and Accreditation of Laboratory Animal Care International, and all experiments were performed within its guidelines. All data were analyzed and reported according to ARRIVE guidelines. In summary, images were acquired from anesthetized rats with acutely implanted craniotomies. Vessels were labeled with intravenous injections of dextran-conjugated dye and cortical vessels were imaged with 2PEF microscopy.
Results
Correcting for time-varying physiological effects and boundary conditions
In vivo 2PEF imaging was used to quantify volumetric RBC flow in individual vessels of cortical arteriole networks in anesthetized rats. Both the process and the experimental results are described in Figure 1(a) to (e). In anesthetized experiments, there is some drift in the physiology of the subject that can affect the RBC flow. We developed and validated a method to correct for these effects. Flow in cortical arterioles was modeled using a resistive network with affine time-dependent border pressures that account for changes in physiology. An example of this is shown in Figure 1(f). For the network shown in Figure 1(a), 125 flow values in a network of 177 vascular segments were used to determine the boundary pressures at time t = 0 and the slope of the systemic change of the pressures with time (ɛ).
In order to demonstrate that we can accurately estimate ɛ in the affine model for time-varying physiology, we performed an experiment in which we repeatedly measured flow in one vessel (labeled “A” in Figure 1(g)) over a 2.5 h experiment, while also making measurements of flow in other vessels in the network. The predicted flow decrease in vessel “A” over time based on the affine time-dependent fit to the flow measured in the rest of the network (including the first measurement of flow in vessel “A”) agreed well with the experimentally measured gradual flow decrease in vessel “A” (Figure 1(g)).
Using the boundary pressure values that result from the solution of the least squares problem, we can compute the flows at time t = 0 (the time of the first speed measurement) for the entire network (Figure 1(h)). For those branches in which speed measurements were made, we can also use the boundary pressures (pressure values at t = 0 and slope of the systemic change in pressure values over time) that result from the least squares problem to predict the measured flows (Figure 1(i)). The fractional error when computed flows at this experimental measurement time were compared to the measured flows was less than 0.5 in more than 50% of vessel segments (Figure 1(j)). In all the following numerical experiments, we used the flows calculated at time t = 0.
One challenge in experiments is that it is often not possible to get measurements in every vessel of a network. We used Monte-Carlo (Supplement Section D.2) to explore the robustness of our flow estimates to the fraction of vessels with experimental flow measurements and the accuracy of the flow and vessel diameter measurements. We found that most vessels in the network were minimally affected by noise in the diameter or measured RBC speed (Supplementary Figure 1(a)), and that the slope of the systematic change in the boundary pressures (i.e. ɛ) was similarly robust to noise (Supplementary Figure 1(b)). We found that up to about 80% of the branches could be unmeasured and still the fractional errors in the flows were no greater than the approximately 10% fractional errors in the actual measurements (Supplementary Figure 1(c)). Furthermore, we found that measurements with smaller than about 30% fractional error led to linear scaling of the fractional errors in the flows. In all cases (0% to 30% fractional errors in the measurements), increasing the fraction of missing measurements past about 80% leads to an abrupt increase in the fractional errors in the flows (Supplementary Figure 1(c)). One intuitive reason that errors in flow measurements and errors in vessel diameter measurements have little effect on the estimates is that the errors are both increases and decreases so that the results of the computation, which uses all measurements to compute each estimate, are not much changed.
The model recapitulates RBC flow changes after occlusions of single arterioles
We then used this model to simulate how RBC flow is rearranged in response to an occlusion in penetrating or surface arterioles compared to experimental results. We computationally eliminated flow in a vessel to model occlusions of single vessels and measure how flows change (Supplement Section D.1). After occlusions in penetrating arterioles, flows in the neighborhood of the occlusion were largely unaffected (Figure 2(a)). Very small flow increases (maximum less than 5%) were observed in neighboring penetrating arterioles (Figure 2(b)). This result is consistent with previous experimental studies14,17 that did not observe large flow increases in neighboring penetrating arterioles. The modest changes in RBC flow in neighboring penetrating arterioles calculated here are lower than the experimental error of the previous measurements.14,17
Changes in RBC flow in the network and tissue perfusion due to multiple occlusions in the network. (a)–(b) Penetrating arteriole occlusion. (a) Fractional RBC flow changes in the network in response to occlusion of the penetrating arteriole indicated by the red X. (b) Post occlusion flow described by a box plot as a fraction of baseline in surface arterioles upstream of the occluded penetrating arteriole. Note the small range of the vertical axis. (c)–(e) Surface arteriole occlusion. (c) Fractional RBC flow changes in the network in response to occlusion of the surface arteriole indicated by the red X. (d)–(e) Post occlusion flow described by a box plot as a fraction of baseline in surface arterioles upstream (d) and downstream (e) of the occluded surface arteriole. (f) Median fraction of tissue area receiving less than 30% of original baseline RBC flow as a function of number of occlusions in penetrating arterioles (blue) and surface arterioles (red). A penetrating arteriole contributes a tissue RBC flow to a pixel that decreases with an exponential dependence on the distance between the pixel and the arteriole and the contributions from different arterioles are summed. (g) Peak normalized total hemoglobin for neural activation centered on points (shown by white X) in the network. Vascular dilation profiles were based on observations in Devor et al.
18
Tissue distribution modeled as in 2F. (h) Mean normalized total hemoglobin as a function of time determined from concentric circles of size 0.32 mm centered on the point of activation.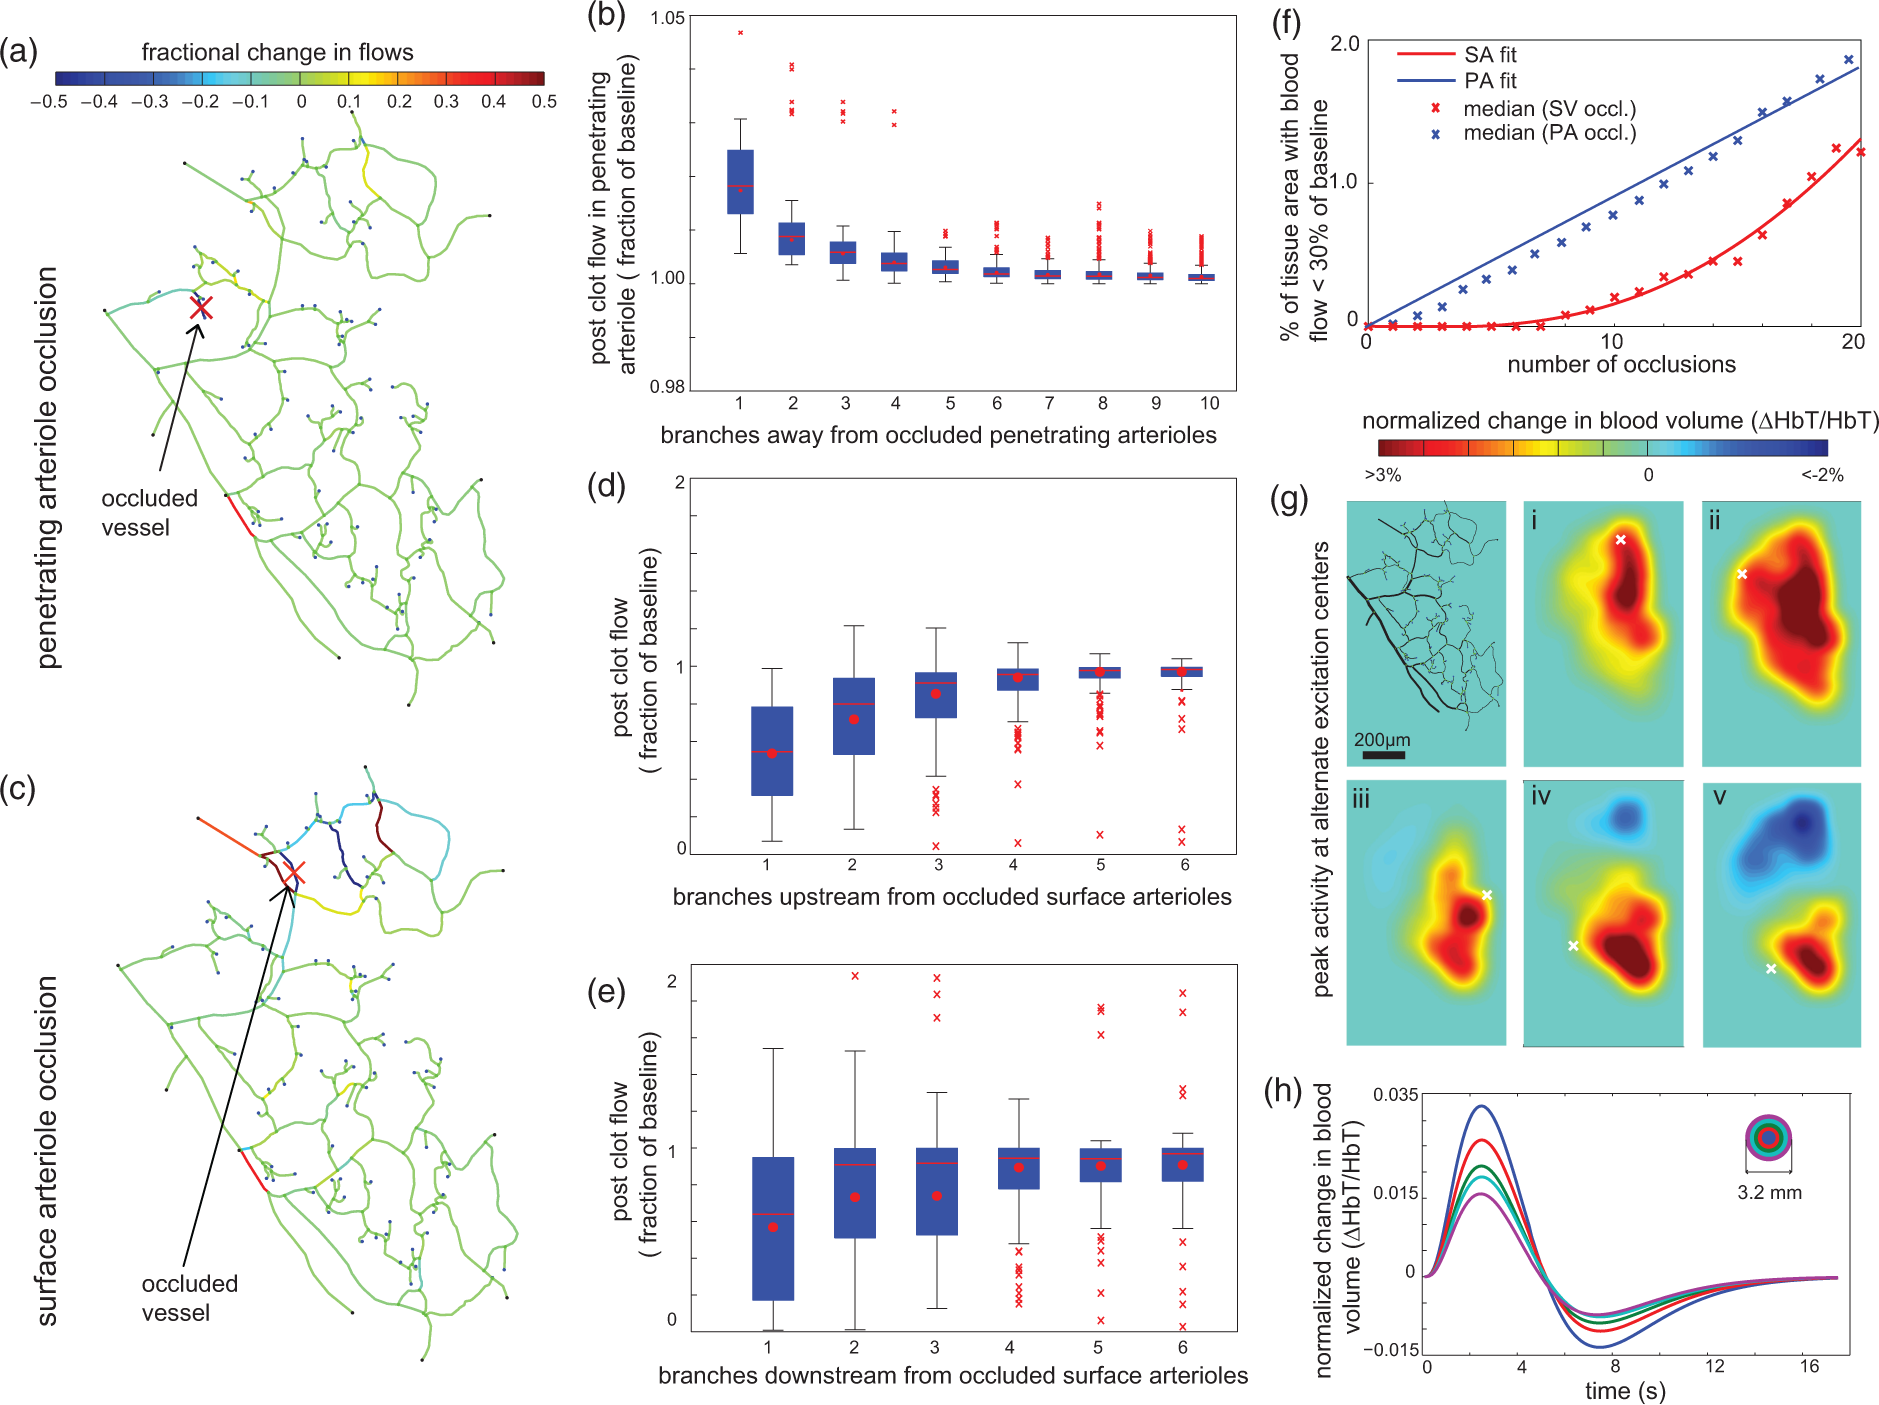
Occlusion of a surface arteriole led to significant changes in flow in nearby surface arterioles (Figure 2(c)). Larger flow decreases (∼50%) were observed in vessels that were within a few branches upstream (Figure 2(d)) or downstream (Figure 2(e)) from the occluded vessel. These results qualitatively and quantitatively agree with the flow changes in arterioles upstream and downstream from surface arteriole occlusions measured by Schaffer et al. 14 and Blinder et al. 17
The model predicts that RBC flow into tissue is protected from occlusions of surface arterioles but not penetrating arterioles
RBC flow in the local tissue is better reflected by the flow in penetrating arterioles which link to the local capillary beds than the flow in surface arterioles. 15 To estimate the changes in tissue perfusion due to occlusion of one or more surface or penetrating arterioles, we combined our flow model with the perfusion model described in Nishimura et al., 15 which estimates that each penetrating arteriole contributes RBC flow to the surrounding tissue with an exponential dependence on distance (Supplement Section D.3).
Using this model, we predict that occlusions of penetrating arterioles lead to linear increases in the number of pixels of isolated tissue regions with severe decreases in tissue perfusion (<30% of baseline flow to the region), while occlusions in surface arterioles lead to little changes in blood flow to the tissue (Figure 2(f)) and Supplementary Figure 2.
RBC flow to the tissue due to neural activation
Finally, we used our approach to model tissue perfusion changes due to the vessel diameter changes that occur due to neural activity. We fit measurements by Devor et al. 18 to obtain a smooth time and distance-dependent profile for diameter changes in arterioles after neural activation at one location (Supplementary Figure 3(a)). We then applied the tissue perfusion model described above, again assuming no changes in the boundary pressures, to determine the time-dependent tissue perfusion (Supplementary Figure 3(b) and (c)). To compare this to intrinsic optical imaging data, we applied a Gaussian blur with 150 µm width as a means to approximate the effects of optical scattering in the measurement (Supplementary Figure 3(c)). Depending on the location of the point of activation, different patterns of flow increase and decrease were seen (Figure 2(g)). Combining the data from 24 such simulations allowed us to estimate the time-dependent perfusion changes in annular rings around the point of activation (Figure 2(h)).
Discussion
We have described a mathematical model of the cortical arteriole network in which all parameters (network connectivity, vessel segment length and diameter, and flow in a subset of vessels) can be estimated from 2PEF imaging. The model predicts flows in individual vessels throughout the network. Based on anatomical measurements, and a limited set of RBC flow measurements, we are able to produce a model of cortical arteriole RBC flow that predicts experimentally measured flow rearrangements with occlusions.
Using Monte Carlo calculations, we have validated the estimation procedure, in the sense that moderate errors in vessel diameter measurements and flow speed measurements do not lead to significant changes in the estimates of flows in vessels for which no flows were measured. Also, using Monte Carlo calculations, we have investigated one aspect of experimental design, specifically, how many flows must be measured in order to provide accurate estimates of the remaining flows. To validate the model, we compared the model’s estimates of changes in flow due to occlusions of single vessels to those observed in experimental measurements.
Our model predicts that multiple surface arteriole occlusions can be tolerated with minor changes in RBC flow delivered to the tissue. This is consistent with the highly redundant, mesh-like arteriole network on the cortical surface. This morphology, often referred to as an arcade structure is also observed in skeletal muscles of different species such as rats, cats and pigs. These structures are thought to protect the tissue from ischemia, and to maintain uniform pressure in healthy tissue.21–23
A more biophysically accurate model would take into account non-ideal flow phenomena such as plasma skimming, non-uniform hematocrit and vessel morphology.24–26 However, in large cortical arteriole networks, we are experimentally constrained to only measure RBC speeds. Therefore, including these effects in the model would require further parametrization unconstrained by the experimental observations, such as the drift parameter M in the work of Gould and Linninger. 32 A biphasic blood flow model that accurately predicts flow including plasma-skimming effects in large complicated vessel topologies (trifurcations, loops, etc.) has been described32,33 which requires iterative linear computation of bulk blood flow and hematocrit fields. However, study of network level phenomena through Monte Carlo calculations for occlusion and redistribution requires many such single network calculations which are prohibitively expensive even though the linear nature of the required calculations makes the problem much closer to practical solution.
Understanding the spatial behavior of neurovascular coupling is important for estimating the underlying neural activity from, for example, the data provided by functional magnetic resonance imaging. An understanding of the flows that is specific to each individual network, rather than an average over a population of networks, is most useful. The fixed topology of the network in each individual likely has an important influence on that individual’s neurovascular coupling. 19 While the topology of an individual’s network is fixed, the diameter of the vessels is variable and while the diameter changes in the arterioles are dominant, there are also some changes in the capillaries. 20 In the examples of this paper, the diameter changes are dramatic, i.e. stroke or no stroke, but the methods of this paper could be generalized to gradated dilation and constriction. Models of individual networks, as are described in this paper, will make it clearer how neural activity affects the vascular system, e.g., by experiments with simultaneous measurement in individual networks of neural activity and flow.
Footnotes
Funding
The author(s) received no financial support for the research, authorship, and/or publication of this article.
Declaration of conflicting interests
The author(s) declared no potential conflicts of interest with respect to the research, authorship, and/or publication of this article.
Authors’ contributions
TB, NRC, and JS performed the computational work. TB and NN performed the experiment. TB made the figures and TB, NN, CBS, and PCD wrote the paper. NN and CBS proposed the neuroscience problem. PCD proposed the circuit model and least squares computations.
References
Supplementary Material
Please find the following supplemental material available below.
For Open Access articles published under a Creative Commons License, all supplemental material carries the same license as the article it is associated with.
For non-Open Access articles published, all supplemental material carries a non-exclusive license, and permission requests for re-use of supplemental material or any part of supplemental material shall be sent directly to the copyright owner as specified in the copyright notice associated with the article.