
Abstract
The availability of transgenic strains has made the laboratory mouse a popular model for the study of healthy and diseased state spinal cord (SC). Essential to identifying physiologic and pathologic events is an understanding of the microvascular network and flow patterns of the SC. Using 2-photon excited fluorescence (2PEF) microscopy we performed
Keywords
Introduction
Spinal cord injury (SCI) remains one of the most debilitating neurologic diseases known, affecting an estimated 265,000 persons in the USA alone. 1 In addition to the immediate tissue disruption caused by trauma, considerable secondary injury results from vascular disruptions, including hemorrhage, ischemia, and edema.2, 3, 4 Besides traumatic SCI, spontaneous spinal cord (SC) infarction5, 6, 7, 8, 9, 10 is a clinically observed ischemic condition leading to paralysis. While the majority of these thromboses occur in arteries, venous obstructions have also been observed.11, 12 A complete understanding of the ischemic susceptibility of the SC to SCI and thrombosis requires a detailed understanding of the SC microvascular anatomy and physiology.
To this end, previous studies have used the corrosion cast techniques to study the anatomy of the SC vasculature in humans,13, 14 rabbits, 15 cats, 16 pigs,17, 18 and rats.19, 20, 21 The increasing availability of transgenic mouse strains makes the mouse spinal vasculature of particular interest for preclinical SC studies, yet the vascular architecture of the mouse SC remains much less explored.
In addition to vascular architecture, spinal cord blood flow (SCBF) has been measured directly22, 23, 24, 25, 26, 27 in healthy and diseased states. In all but one case,
25
these studies determined blood flow as an average over some region and did not consider flow at the level of individual vessels. Exceptionally, Miyazaki
The dorsal spinal vein (dSV) is the largest and most superficial vein in the mouse dorsal SC. Unlike the deeper-lying arterial counterparts that are obscured by intensely scattering myelin, the dSV is particularly well suited to
In this paper, we quantitatively analyzed the mouse dorsal spinal venous geometry and topology using intraluminal vessel fills. The focus of our study was the dSV and its primary upstream vessels that we have termed dorsal ascending venules (dAVs). Using 2-photon excited fluorescence (2PEF) microscopy, we performed
Materials and methods
Ex Vivo Intraluminal Blood Vessel Fills
The care and experimental manipulation of all mice in this paper followed the ‘Guide for the Care and Use of Laboratory Animals’ provided by the National Research Council of the National Academies and was approved by the Cornell University Institutional Animal Care and Use Committee. Mice were deeply anesthetized using sodium pentobarbital. After the absence of reflex in response to foot or tail pinch stimulus, animals were perfused transcardially with phosphate-buffered saline solution (PBS; pH=7.4; Sigma-Aldrich, St Louis, MO, USA) before perfusion with 4% W/V paraformaldehyde (Thermo-Fischer Scientific, Waltham, MA, USA) in PBS. In mice where
Tissue Clearing
We followed the clearing procedure described by Dodt
Surgical Procedure for In Vivo Imaging
Mice of a C57B6/J background were anesthetized using a 5% isofluorane in 100% oxygen mixture, which was reduced to 1% to 2% after induction of anesthesia. Mice received 50 μg glycopyrrolate per 100-g mouse intramuscularly at the start of surgery and 0.1 mL of 5% W/V glucose hourly throughout both surgery and imaging. Surgery was performed on a custom table, and core temperature was maintained at 37.5°C using a feedback-controlled heating pad. Skin and muscles were retracted and a double dorsal laminectomy was performed between T10 and T13 using spring scissors. In clotting experiments, a small section of the dura was removed to facilitate chemically-induced clot formation. Warm 1% agarose (Sigma-Aldrich) solution was applied to the spinal cord and a #0 coverslip (Electron Microscopy Sciences, Hatfield, PA, USA) was laid on top. For animals in which clots were induced, the coverslip was removed and a wedge of the flat-profile agarose over the target clot site was removed using a scalpel blade to facilitate access to the dSV. Gel foam (Pharmacia & Upjohn, Kalamazoo, MA, USA) and 0.9% W/V saline were applied over the exposed spinal cord to maintain irrigation, and the coverslip was replaced before imaging.
Two-Photon Excited Fluorescence Microscopy
After surgery, mice were transported to the microscopy laboratory where we performed 2PEF imaging on a custom microscope. The microscope was sourced by a 1,043-nm wavelength, 300-fs pulse duration, 1-MHz repetition rate fiber laser source (FCPA μJewel D-400; IMRA America, Ann Arbor, MI, USA). Mice were injected retroorbitally with 50 μL of 2.5% W/V Texas Red dextran in saline (MW=70,000 kDa; Invitrogen) to label the blood plasma. A 645/65 nm (center wavelength/bandwidth) emission filter (Chroma Technology, Bellows Falls, VT, USA) was used to isolate fluorescence from the plasma. A low numerical aperture (NA) objective (NA=0.28; Olympus America, Center Valley, PA, USA) was used to take a large (∼3 mm) field of view image of the vasculature. To measure blood vessel diameters and flow speeds, we used a large NA objective (NA=1.0; Carl Zeiss Microscopy, Thornwood, NY, USA). After focusing on the vessel of interest in the xy plane, the animal was translated axially in the z direction in increments of 1 to 2 μm while simultaneously recording images. Average vessel diameter was determined using custom Matlab (Mathworks, Inc., Natick, MA, USA) software, in which vessel boundaries were manually traced from the maximum intensity projection of the image sequences. To measure flow speeds, we used the 2PEF line-scan method described previously.
32
The center of the vessel was estimated visually, and after centering the vessel in the xy plane, along the z axis, and rotating the scan pattern such that the vessel was oriented along the x axis, a single line was repeatedly raster-scanned over time. Since red blood cells (RBCs) exclude the fluorescently labeled plasma, they appear as dark regions against a bright background on the scan. Scans are repeated at constant intervals, generating a 2-D image with time as the y axis. The slope of these lines was then calculated using a radon-transform algorithm,
33
giving the average speed in the vessel center. The volumetric flow,

where
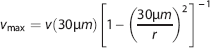
The RBC speed at the center of the dSV was too fast to be accurately measured at the center of the vessel. We therefore measured blood flow 30 μm from the edge of the dSV lumen, and calculated
Clot Formation
Due to the large diameter of the dSV, complete occlusion of the dSV was not possible using the technique of nonlinear laser ablation of the vascular endothelium that we have previously employed for vessel occlusion studies. 34 As such, we adapted a ferric chloride (FeCl3)-mediated thrombosis technique 35 to produce a complete point occlusion of the dSV. In experiments where a clot was induced, animals were transferred from the imaging facility to the operating room after initial imaging of vascular structure and blood flow speed measurements. Briefly, the coverslip was removed and dry gel foam and cotton swabs were used to reduce fluid over the dSV locally. A glass micropipette filled with 5% W/V FeCl3 (Sigma-Aldrich) was touched to the exposed dSV, depositing a small droplet by capillary action. A clot was seen to form within 10 to 20 minutes of exposure by cessation of blood flow at the point of application (i.e., a ‘white clot’). The area was subsequently flooded with saline to remove and dilute the FeCl3 to avoid undesired clotting of other vessels. Control animals received saline treatment in place of FeCl3 and 20 minutes was allowed to elapse before proceeding. Excess fluid was removed before reimaging.
After clot formation, animals were returned to the imaging facility. Once repositioned under the 2PEF microscope, the clot site was imaged. If the clot was observed to be incomplete, especially by the observation of flow at the edges of the dSV, then the animal was discarded from further analysis. If the clot was complete, then we remeasured blood flow speeds in the same vessels measured before clot formation.
Mathematical Modeling
All mathematical analysis was performed in Matlab. Briefly, our model consisted of 100 dAVs of uniform resistance,

where resistance,

for viscosity, η, and length,
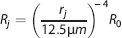
For calculations in which dAV resistance was allowed to vary (see Supplementary Materials), dAVs were assigned radii,
Results
Intraluminal Blood Vessel Fills Revealed Key Aspects of Venous Microvasculature in the Mouse Spinal Cord
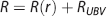
Mice were deeply anesthetized with pentobarbital before intracardiac perfusion with paraformaldehyde. Mice were subsequently perfused with India ink (Figure 1A) or a fluorescently-labeled agarose gel (Figure 1B). White light images were taken along the whole length of the SC, from the medulla oblongata to the beginning of the cauda equina (Figure 1A). We observed at least four large vessels branching off the dSV and exiting the SC at nearly orthogonal angles to the axis of the SC (Figure 1A,
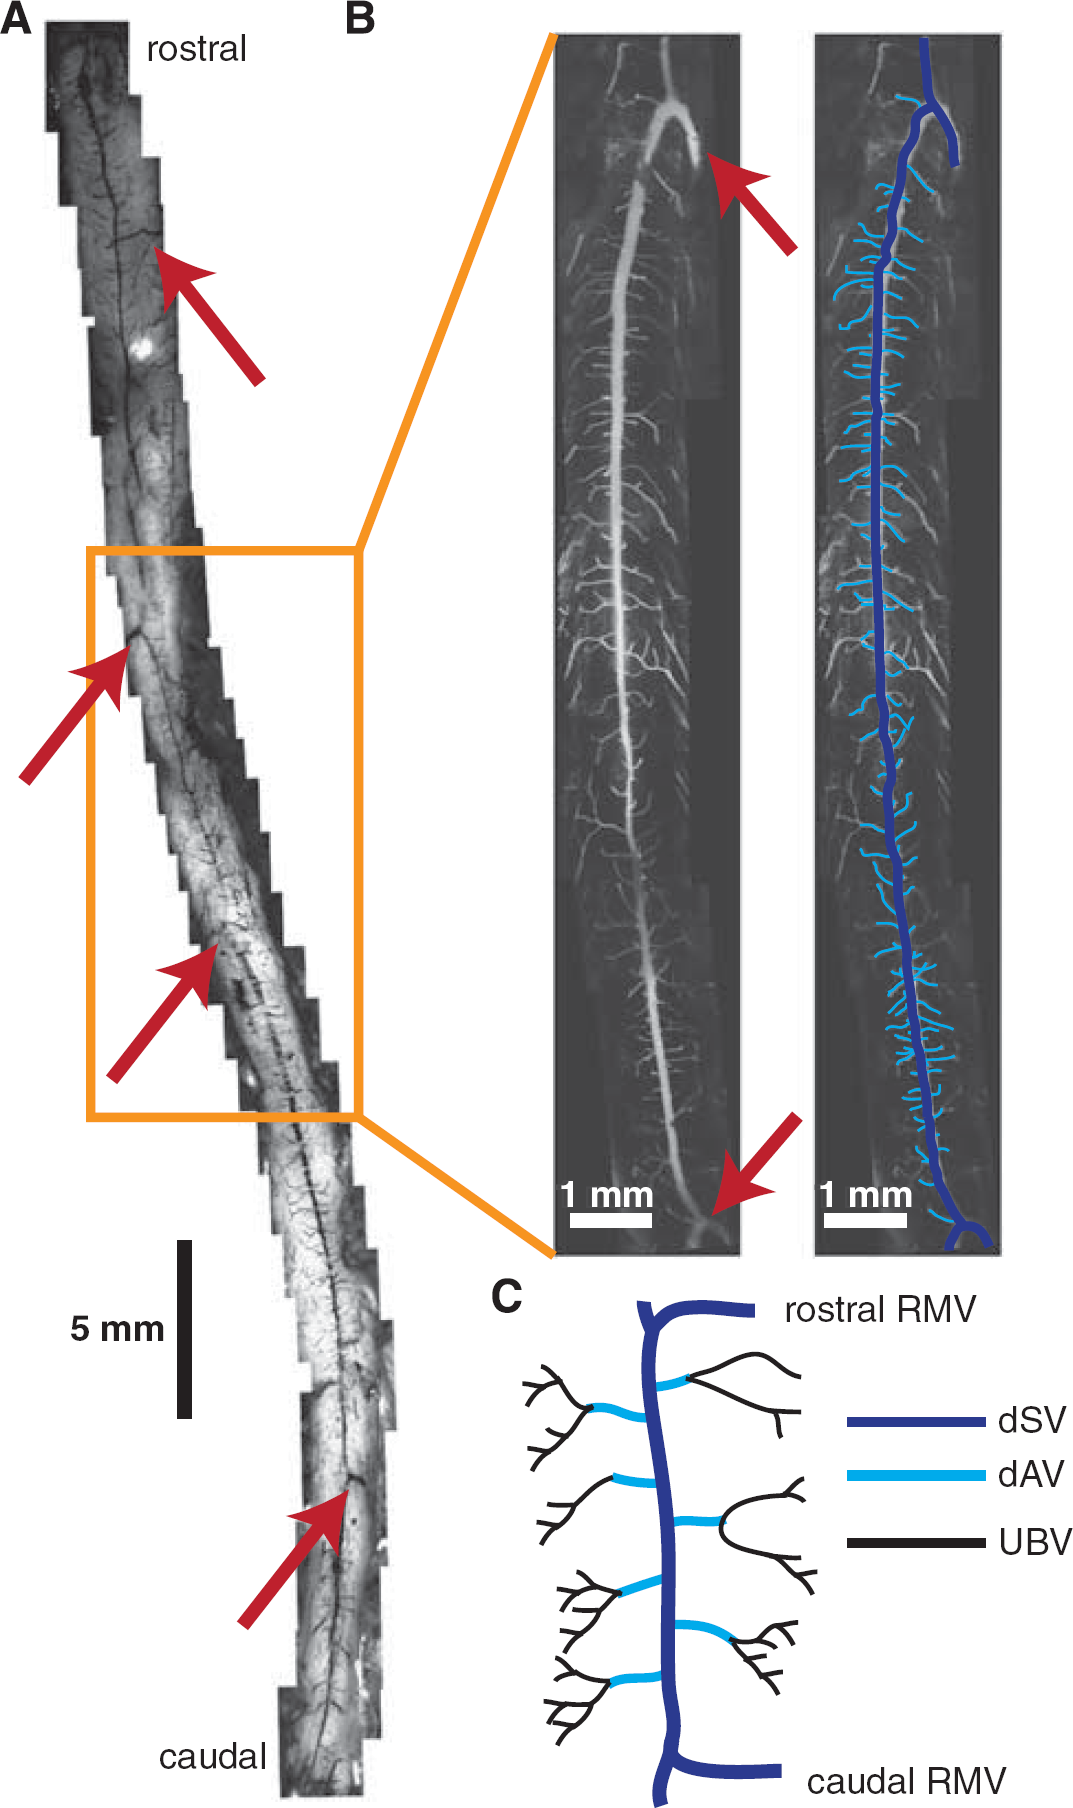
The dorsal spinal vein (dSV) is fed by dorsal ascending venules (dAVs) and drained by radiculomedullary vessels (RMVs) along its length. The spinal cord (SC) of a mouse perfused with an India ink/agarose gel (
The most prominent of these RMVs occurred in the thoracic and thoracolumbar regions of the SC (Figure 1A,
In Vivo Blood Flow Measurements Showed Bidirectional Flow in the Dorsal Spinal Vein and Characteristic Size-Flow Relationship in the Dorsal Ascending Venules
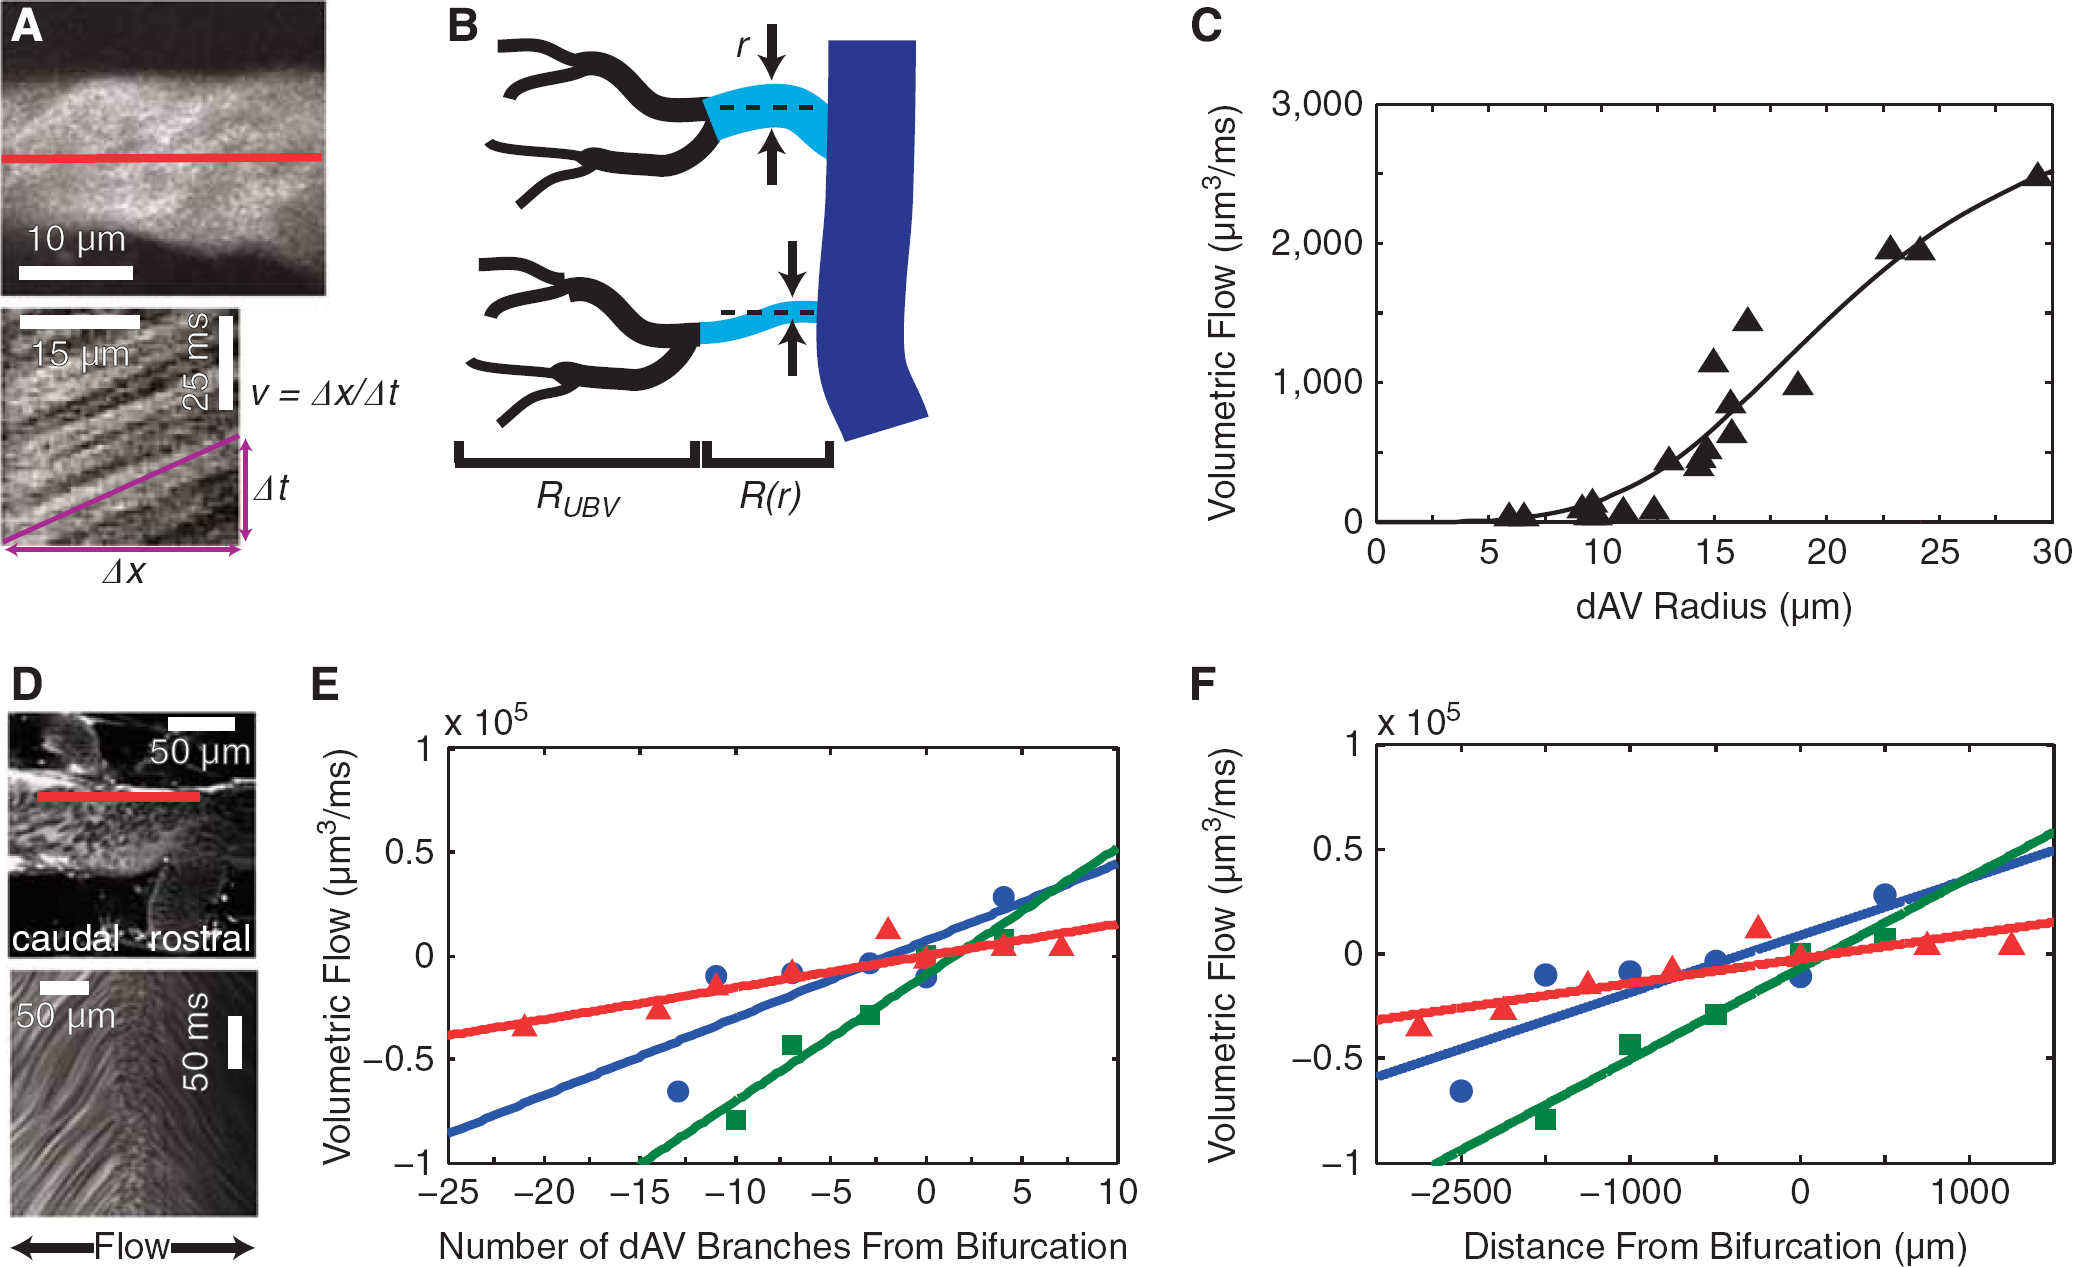
After a dorsal laminectomy in anesthetized mice, we injected a high-molecular weight fluorescent dextran retro-orbitally and imaged the mice using 2PEF microscopy. We calculated volumetric flow in each dAV using Equation 1. Vessel radius was measured directly from maximum-intensity projections of small stacks (Figure 2A,
Since the dAVs were uniformly distributed along the dSV, and since Equation (4) depends much more critically on radius than length, we approximated the dAVs to have equal length. We further hypothesized that the UBVs bridged a constant distal pressure source to the dAVs and constituted a constant upstream resistance,
For closely spaced dAVs, we expected the pressure in the dSV to vary little. Under these assumptions, we measured 20 adjacent dAVs corresponding to ∼20% of the length of the dSV. With these assumptions in place, we developed a model (see Supplementary Materials for details) that showed a quartic dependence of blood flow on radius for small dAV radii and was bounded above by an asymptote corresponding to
Since the blood flow speed at the center of the dSV was too fast to measure reliably at the center of the vessel using the linescan technique, we measured the RBC speed at a constant distance of 30 μm from the lumen wall (Figure 2D,
Three-Dimensional Vascular Reconstructions Show Effective Isolation of Adjacent Dorsal Ascending Venules
Due to the short scattering length of myelin, detailed vascular mapping
Dorsal ascending venules have no conjoining low-resistance collateral branches. Two-photon excited fluorescence (2PEF) images of index-matched, fluorescent dextran/agarose perfused spinal cords allowed for vascular mapping from either coronal (
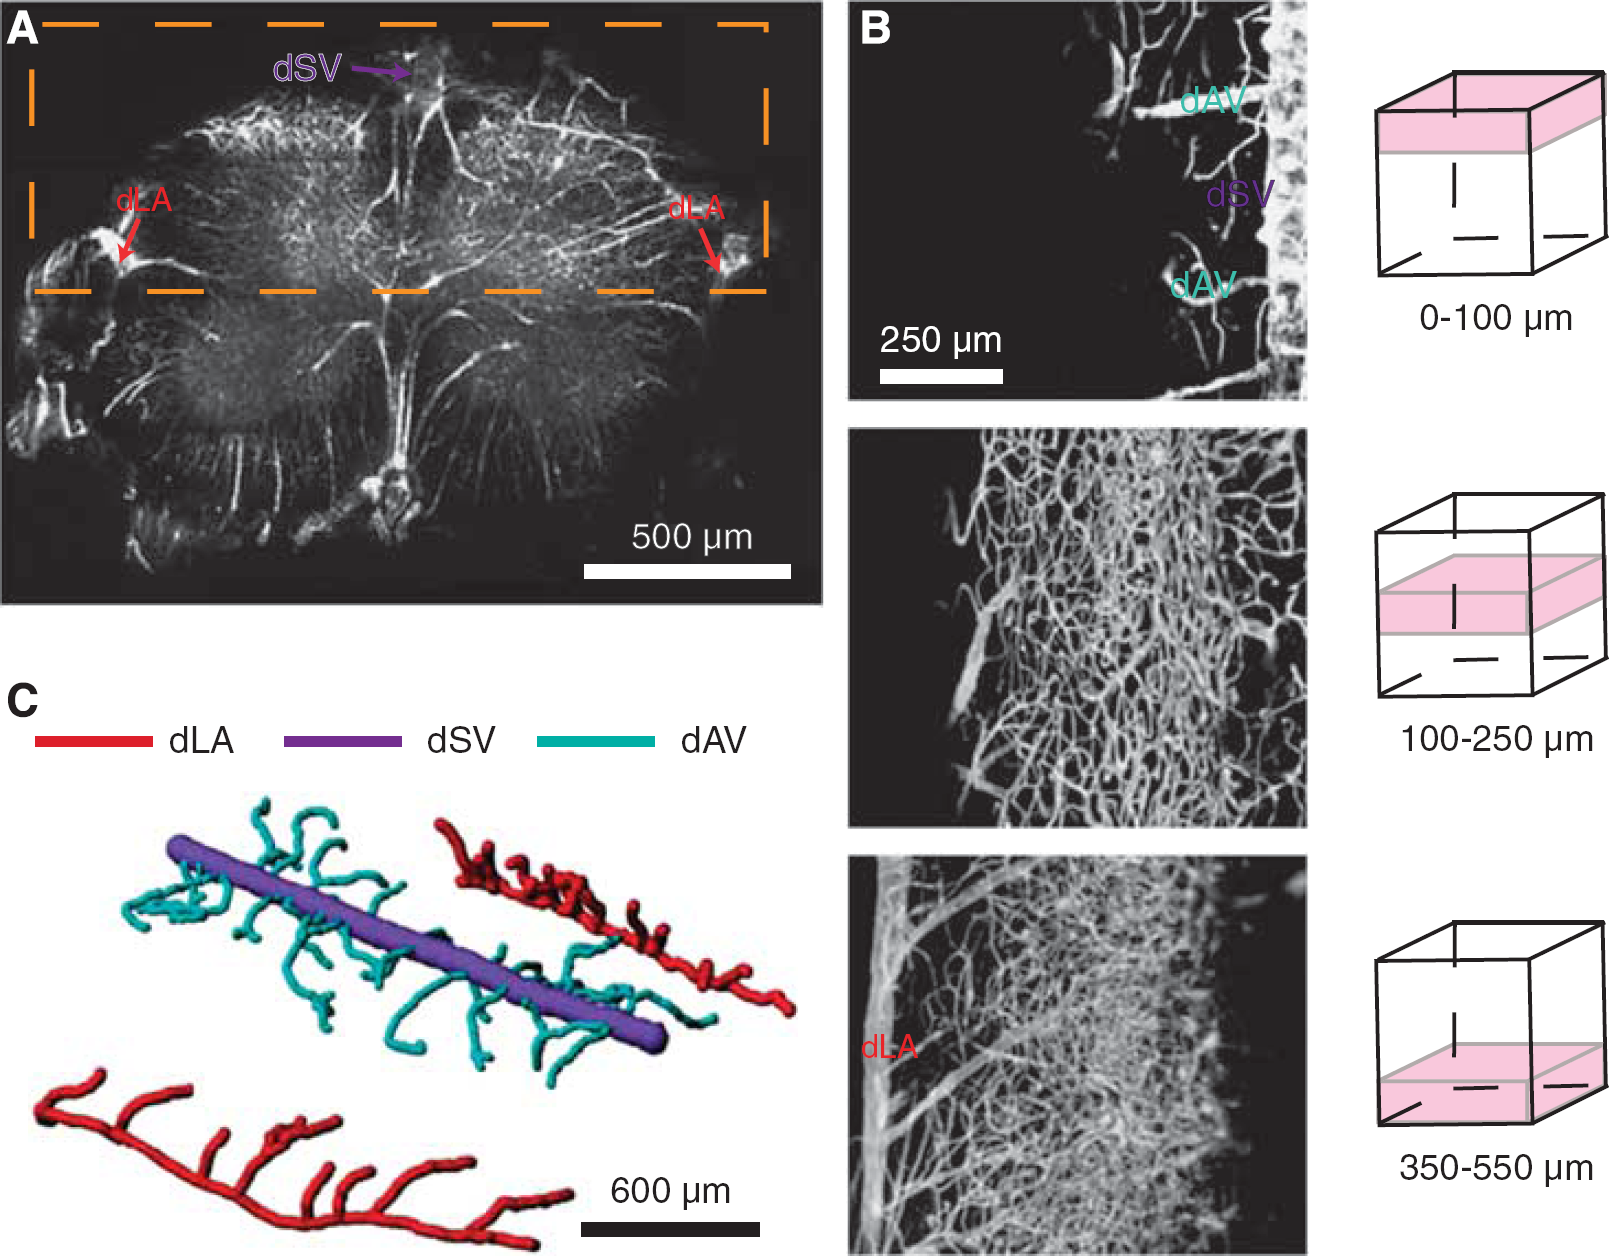
A Simple Model Accounts for Bidirectional Flow and Predicts Flow Changes After Point Occlusion
Using these observations, we constructed a mathematical model of blood flow in the dorsal SC vasculature. We modeled the segment of the dSV of interest to be sourced by 100 dAVs uniformly distributed along its length. The caudal exiting branch of the dSV was taken to be at zero distance and the rostral branch to be at unit distance. Each dAV was taken to have the same resistance,
A simple flow-resistance model accounts for the bifurcation in the dorsal spinal vein (dSV) and predicts changes in flow after dSV occlusion. A simple model (
We then simulated a ‘clot’ by interrupting the blood flow in the dSV at different locations (Figure 4A, ‘X
Finally, we investigated computationally whether the increases in downstream dAV flow were able to compensate for the decreases in upstream dAV flow. We summed the outflow at both the rostral and caudal ends of the dSV and compared the overall postclot dSV drainage with baseline (Figure 4D). We observed a strong decrease in dSV drainage as the clot location moved away from the bifurcation point, indicating that no such passive compensation could restore drainage. Overall drainage was reduced to nearly 50% of baseline for clots located near the rostral or caudal connection between the dSV and the RMVs.
To assess the impact of nonuniform resistances, we performed analogous simulations using resistances that were based on the experimentally observed diameter distribution of dAVs (see Supplementary Materials for details). We found that the average result was qualitatively similar to the uniform resistance model (Supplementary Figure 3). The location of the bifurcation was strongly dependent on the resistance distribution (data not shown), resulting in more severe features in the median flow response as compared with the mean response (Supplementary Figure 3).
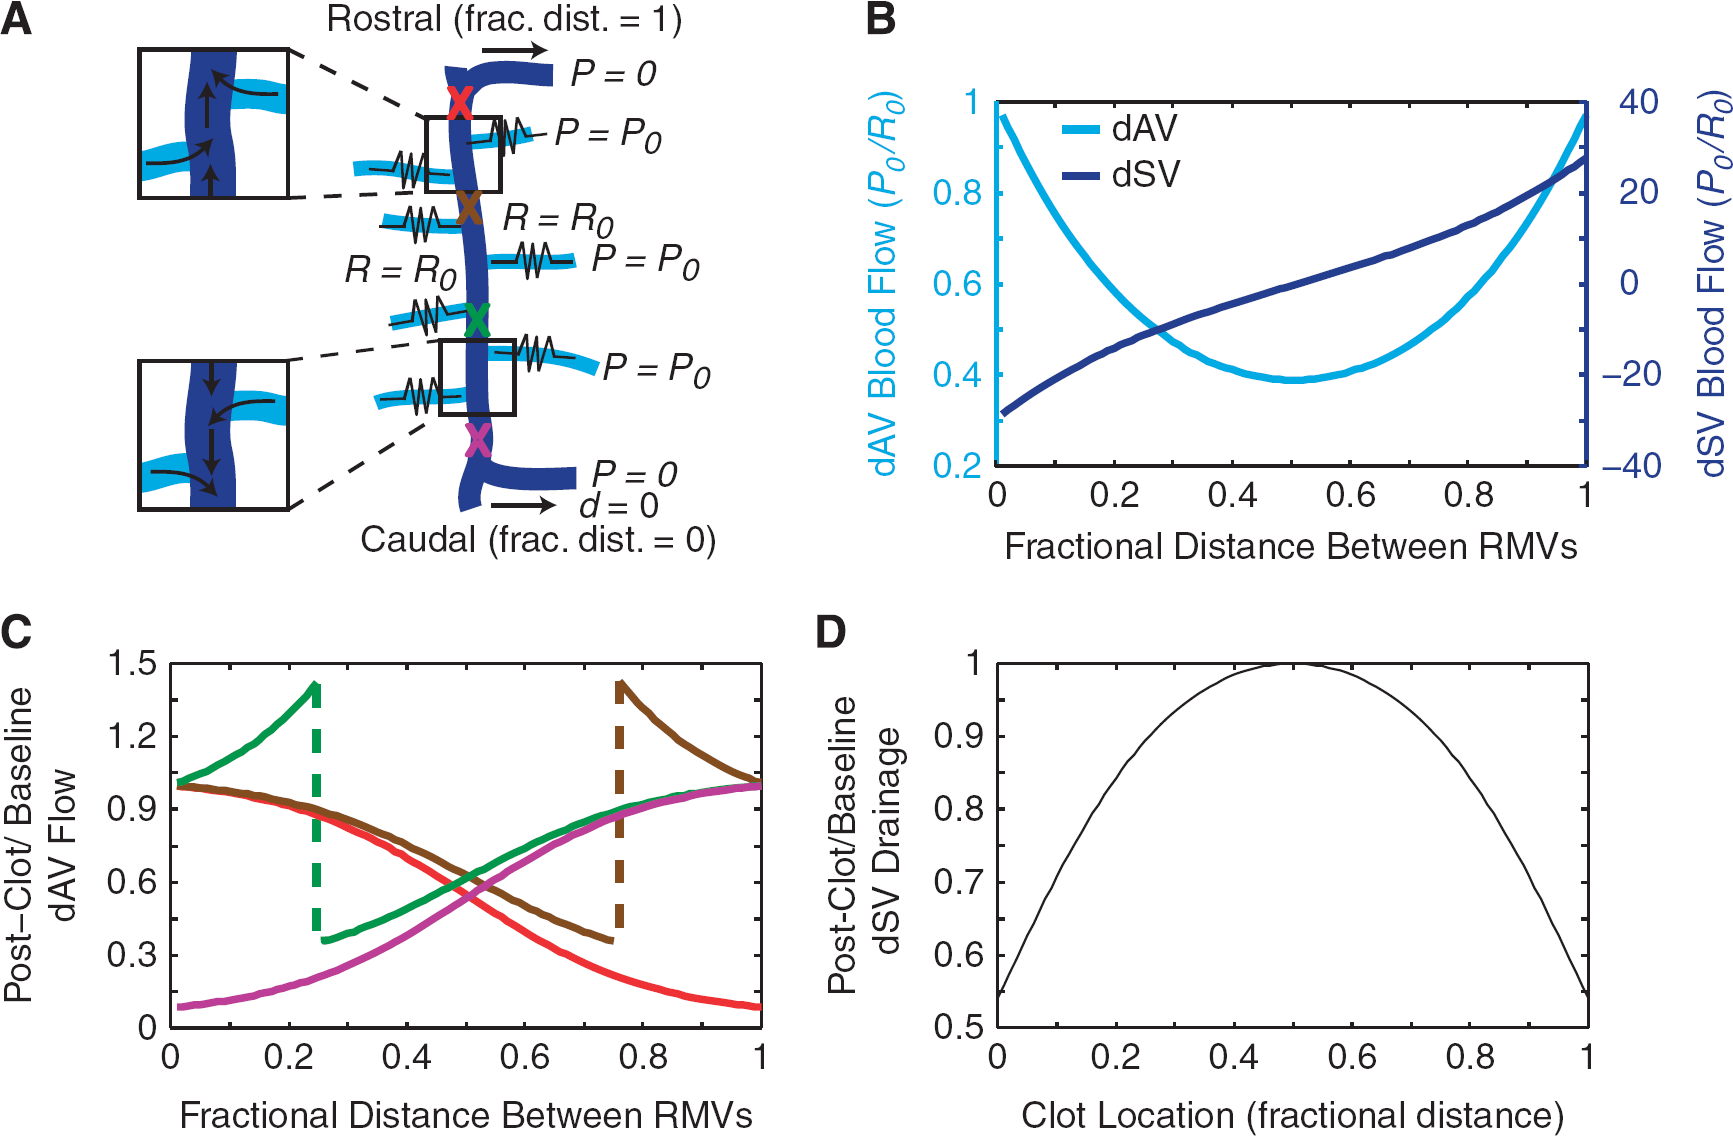
A Point-Occlusion Technique Results in Flow Changes Congruent with the Model Predictions
To test the predictions of our model concerning changes in upstream and downstream flow in the dAVs after point occlusion of the dSV, we adopted a FeCl3-based clotting technique to occlude the dSV. By carefully confining the FeCl3 solution to a small area of exposed tissue, we were able to produce a full-thickness clot in the dSV, without clotting other vessels (Figure 5A). For the rare cases where dAVs were occluded (four dAVs in three mice) by this technique, these dAVs were excluded from subsequent analysis. We measured RBC velocity and dAV diameter in approximately 20 vessels caudal to the clot site both before and after occlusion. These measurements were used to calculate preclot and postclot volumetric flows in each of the 20 dAVs (Figure 5B). We performed clots at various locations between the rostral and caudal RMVs. It is important to note that since we always measured caudal to the site of occlusion, our measurements of dAV blood flow for clots proximal to the rostral and caudal exiting branches corresponded to measurements of dAV flow upstream and downstream from the clot, respectively. We compared the postclot blood flow with the preclot blood flow (Figure 5C) for each condition, grouping animals by clot location. Flow reversals (two vessels in two mice) and vessels exceeding 3,000 μm3/ms (four vessels in two mice) were not shown for graphical clarity. As the bifurcation was not usually visible during the course of imaging, the geometrical distance between RMVs was used to classify the clot location rather than the distance from flow bifurcation. Rostral and caudal clots were identified as being beyond and less than the half-way point, respectively. Using our two-parameter fit, we considered the relationship between blood flow and dAV diameter for the caudal-most (Figure 5D) and rostral-most (Figure 5E) clots both before (
Measurements of dorsal ascending venule (dAV) blood flow after point occlusion of the dorsal spinal vein (dSV) confirmed the flow model. FeCl3 was applied (
Discussion
The Mouse Dorsal Spinal Cord Vasculature is Topologically Stereotyped but Geometrically Variable
We observed the mouse dorsal SC to be supplied by two dLAs and drained by the dSV. This architecture is analogous to the human SC, 14 further supporting mice as a valuable model for studies of SC pathology. However, while we consistently observed large ‘shunting’ branches (i.e., the RMVs) along the length of the dSV, the location of these shunts varied considerably, occurring even in different segments across animals. This observation is consistent with the high degree of variability in spinal vasculature more generally. In humans, the number of anterior and posterior radicular arteries was reported as varying between 2 to 17 and 11 to 25, respectively 37 and the variability of the venous system is reportedly higher than the arterial side. 28
The Dorsal Spinal Vein Serves as a Bidirectional Drain for the Mouse Spinal Cord and May Have a Role In Neurovascular Coupling
Unlike veins in the periphery, the CNS (central nervous system) venous system does not contain one-way valves. This absence raises the possibility of bidirectional SCBF, which has been described for the arterial supply by a partial flow theory. 2 However, to the best of our knowledge, simultaneous blood flow in opposite directions within the same vessel has not been observed in the venous system of the CNS previously. This observation raises the question as to what purpose might be served by such a feature.
In the brain, basal and stimulus-induced fluctuations in blood flow of individual vessels have been observed, 32 owing to neurovascular coupling. Like the brain, the SC is auto-regulatory in blood pressure, 38 and functional MRI studies of the SC 39 have revealed similar changes in activity-dependent perfusion. With respect to network topology, recent modeling 40 has revealed that the optimal structure of a transport network depends not only on steady-state flow, but also on fluctuating sources. In particular, conservation of flow in a closed system requires that activity-driven fluctuations in blood flow in the arterial supply be compensated for in venous drainage. Our model predicts that the bifurcation point is metastable and will shift in location with varying upstream pressures, a feature that would be prevented by the directional valves found in peripheral vasculature. It is therefore possible that the allowance for bidirectional blood flow in the dSV is part of an evolutionary adaptation that results in passive redistribution of venous drainage during activity-dependent arteriole blood pressure changes without either the occupation of precious neurologic space by additional blood vessels or the introduction of active venous compensation mechanisms. However, it should be noted that our model considered only flow in the downstream dAVs and dSV, and is therefore not suited to considering the effects of upstream dilating arterioles or to fully capture the dynamics of flow through a complex capillary network.
The Mouse Spinal Cord is Susceptible to Ischemic Injury of Venous Origin
Our
In line with our predictions of ischemic injury, longitudinal studies42, 43 of dSV occlusion in rats have shown atrophy of the posterior columns, reactive gliosis, macrophage infiltration, and onset of paraplegia. Interestingly, in a study examining the results of dSV ligation, 43 variability in the extent of pathologic SC ‘softening’ was attributed to unobserved venous anastomoses connecting to the dSV. This attribution fits well with both our model and measurements, which predict that the extent of ischemic injury will depend critically on occlusion location with respect to those draining anastomoses.
In contrast, a study in rhesus monkeys 44 showed that large-scale occlusion (as many as nine vertebral segments) of the dSV did not result in behavioral pathology, although demyelination was observed in posterior columns. Dilation of the anterior spinal vein was seen to compensate for dSV occlusion. Care must therefore be taken when applying murine models of venous SC ischemic injury to humans or other animal models, despite anatomic similarities.
Conclusion
Using topological observations and
Footnotes
ACKNOWLEDGMENTS
The authors would like to thank the National Institutes of Health (R01 EB002019), the Natural Sciences and Engineering Research Council (NSERC) of Canada (to MJF), and the Cornell Biology Scholars program (JDR and DMD) for financial support.
The authors declare no conflict of interest.
References
Supplementary Material
Please find the following supplemental material available below.
For Open Access articles published under a Creative Commons License, all supplemental material carries the same license as the article it is associated with.
For non-Open Access articles published, all supplemental material carries a non-exclusive license, and permission requests for re-use of supplemental material or any part of supplemental material shall be sent directly to the copyright owner as specified in the copyright notice associated with the article.