
Abstract
The blood–brain barrier (BBB) is involved in brain water and salt homeostasis. Blood osmolarity increases during dehydration and water is osmotically extracted from the brain. The loss of water is less than expected from pure osmotic forces, due to brain electrolyte accumulation. Although the underlying molecular mechanisms are unresolved, the current model suggests the luminally expressed Na+-K+-2Cl− co-transporter 1 (NKCC1) as a key component, while the role of the Na+/K+-ATPase remains uninvestigated. To test the involvement of these proteins in brain electrolyte flux under mimicked dehydration, we employed a tight in vitro co-culture BBB model with primary cultures of brain endothelial cells and astrocytes. The Na+/K+-ATPase and the NKCC1 were both functionally dominant in the abluminal membrane. Exposure of the in vitro BBB model to conditions mimicking systemic dehydration, i.e. hyperosmotic conditions, vasopressin, or increased [K+]o illustrated that NKCC1 activity was unaffected by exposure to vasopressin and to hyperosmotic conditions. Hyperosmotic conditions and increased K+ concentrations enhanced the Na+/K+-ATPase activity, here determined to consist of the α1β1 and α1β3 isozymes. Abluminally expressed endothelial Na+/K+-ATPase, and not NKCC1, may therefore counteract osmotic brain water loss during systemic dehydration by promoting brain Na+ accumulation.
Introduction
Maintenance of the water balance is a fundamental requirement for the organism to function properly. In case of systemic dehydration, the blood volume drops and the plasma becomes hyperosmotic, thus causing osmotic extraction of water from various tissues including the brain. Although aquaporins are absent from cerebral endothelium 1 and its osmotic water permeability low, 2 significant amounts of brain water are extracted during systemic hyperosmolarity due to the large surface area of the cerebral vascular bed. 3 However, this water loss is counteracted by cerebral accumulation of the osmolytes Na+ and Cl−, which enter the brain via unresolved volume regulatory mechanisms.4,5 A proposed model suggests the endothelial Na+/K+/2Cl− cotransporter 1 (NKCC1), expressed predominantly at the luminal endothelial membrane, as a key component in brain electrolyte regulation.6,7 NKCC1 could, in this capacity, and via its ability to cotransport water independently of osmotic forces, 8 serve as a molecular transport mechanism underlying dehydration-induced brain accumulation of Na+ and Cl− with associated water influx. However, as NKCC1 is notoriously upregulated in cultured cells9,10 and its endothelial expression debated,11,12 its precise role in brain microvasculature-dependent electrolyte flux is unresolved. An alternative endothelial ion transport mechanism involved in brain ion homeostasis is the Na+/K+-ATPase, which appears to be predominantly located on the abluminal side of the brain endothelium.13,14 With this polarized localization, the Na+/K+-ATPase could partake in dehydration-induced Na+ influx into the brain parenchyma. The Na+/K+-ATPase consists of one α and one β subunit, each represented by three different isoforms in the mammalian brain. 15 The Na+/K+-ATPase ion affinities and other kinetic and regulatory parameters depend on the catalytic α isoform and its associated β subunit.9,16,17 The isoform-specific endothelial expression of the Na+/K+-ATPase, nevertheless, remains unresolved as does its response to factors changed upon systemic dehydration.
In addition to the cell shrinkage expected to occur with the increased plasma osmolarity during systemic dehydration, the antidiuretic hormone, vasopressin (AVP), is released both systemically and centrally.18,19 Although the kidney is a key target, 20 vasopressin also leads to increased brain water accumulation through activation of the vasopressin V1a receptor (V1aR).21–23 V1aR may be expressed in the brain microvasculature 24 although its expression in the cerebral endothelium remains disputed.12,25,26 The current model includes V1aR activation of the luminal NKCC1, 27 thus promoting dehydration-induced brain electrolyte accumulation.
Here we set out to determine the response of brain capillary endothelial NKCC1 and Na+/K+-ATPase to factors present during systemic dehydration and resolve their proposed contribution to dehydration-induced brain electrolyte accumulation.
Materials and methods
Cultivation of bovine brain endothelial cells, the bEnd3 cell-line, and rat astrocytes
Primary culture of brain microvasculature and astrocytes was used to approximate in vivo conditions in the in vitro co-culture BBB model, while an immortalized cell line was used for comparison. Astrocytes obtained from newborn rats potently induce barrier tightness in bovine endothelium.28,29 The procedures for isolation of bovine capillaries and rat astrocytes and the culturing procedures were performed as previously described. 30 The protocol, by which the primary cells were obtained, complies with the European Community guidelines for the use of experimental animals and the results are reported in compliance with the ARRIVE guidelines. The bovine cerebral endothelial cells (BCECs) were passaged with a brief trypsinization and seeded (30,000 cells/cm2) either in collagen/fibronectin-coated 96-well plates (Ca2+ signaling) or 24-well plates (radiotracer experiments), or (90,000 cells/cm2) on collagen/fibronectin-coated transwell polycarbonate filter inserts (area = 1.12 cm2, pore radius = 0.4 µm, Corning Life Sciences, NY) in a non-contact co-culture with astrocytes. 30 The murine endothelial cell line (bEnd3, ATCC® CRL-2299™) was cultured to confluency in DMEM (30-2002, ATCC) supplemented with 10% FBS (37℃, 5 % CO2) and passages 30–37 were used for experiments.
Light and electron microscopy
To verify proper cell origin and culture purity in the in vitro BBB model, immunocytochemistry was performed on endothelial cells grown in the co-cultured BBB model, according to standard protocols. Employed primary antibodies were: rabbit α-vWF, 1:400 (ab6994), rabbit α-GFAP, 1:1000 (ab7260), and rabbit α-PDGFRβ, 1:100 (ab32570), all from Abcam, Cambridge, UK and with Alexa 488-conjugated goat-anti-rabbit IgG, 1:200 (Life Technologies, Carlsbad, CA) as the secondary antibody. Staining for filamentous actin employed Alexa 488-conjugated phalloidin, 1:200 (Molecular Probes, Leiden, The Netherlands). Preparations were counterstained with propidium iodide (Molecular Probes, Leiden, The Netherlands) and examined by confocal laser scanning microscopy (Zeiss LSM 510 laser confocal microscope, Carl Zeiss, Jena, Germany). To illustrate the Na+/K+-ATPase isoform distribution in bovine microvasculature and resolve putative contamination by astrocytic fragments in the isolated capillaries, we performed morphological analysis of bovine brain samples and isolated capillaries. Both were fixed in 4% paraformaldehyde in phosphate buffer, pH 7.4, and cryopreserved. Semi-thin or ultra-thin sections were produced with a Reichert Ultracut cryoultramicrotome (Leica, Glostrup, Denmark) and processed for either immunofluorescence following standard procedures, or for cryo-immunogold staining as described 31 using polyclonal anti-Na+/K+-ATPase α2 antibodies, 1:1000 (16836-1-AP, Protein Tech, Chicago, IL) or mouse anti-pan-Na+/K+-ATPase α subunit, 1:200 (M7-PB-E9, Thermo Fisher Scientific) followed by 7 or 13 nm gold-conjugated goat anti-rabbit or goat anti-mouse antibodies. Immunofluorescence slides were examined in a Zeiss LSM 510 confocal laser scanning microscope using a C-Apochromat 63× 1.2 water immersion objective (Carl Zeiss, Thornwood, NY) and the 488-nm line of the argon laser or 543-nm line of the helium–neon laser for the excitation of Alexa488- or 568-conjugated secondary antibodies and phalloidin (Molecular Probes); 1024 × 1024-pixel images at 8-bit resolution were imported into Adobe Photoshop (Adobe Systems, Mountain View, CA) for compilation. Ultra-thin sections were examined in a Philips CM100 electron microscope (Eindhoven, The Netherlands) and images acquired with a side-mounted Olympus Veleta camera with a resolution of 2048 × 2048 pixels. For both light and electron microscopy, controls included omission of primary antibodies or the use of irrelevant, isotype-matched antibodies and produced no or only low levels of staining.
Oocyte preparation and in vitro transcription
To obtain a scenario in which we could determine the activity of a given protein in isolation, we employed Xenopus laevis oocytes. Oocytes were obtained from frogs (Nasco, Fort Atkinson, WI) and prepared as previously described. 32 The protocol complies with the European Community guidelines for the use of experimental animals and the experiments were approved by The Danish National Committee for Animal Studies. The results are reported in compliance with the ARRIVE guidelines. cDNA encoding rat NKCC1 (from P. Blaesse and K. Kaila, Helsinki University), rat Na+/K+-ATPase α1 and β1 subunit (from G. Blanco, University of Kansas), rat AQP4.M23 (from S. Nielsen, Aalborg University) in the oocyte expression vector pXOOM, and the human V1aR (from M. J. Brownstein, NIMH, Bethesda) in the oocyte expression vector pNB1 were linearized downstream from the poly-A segment and in vitro transcribed using T7 mMessage Machine (Ambion, Austin, TX). The cRNA was extracted with MEGAclear (Ambion, Austin, TX) and micro-injected into defolliculated Xenopus oocytes (in ng RNA/oocyte: 25 rNKCC1 ± 16 hV1aR; 10 Na+/K+-ATPase α1-2 and 3 β1-2 ± 8 rAQP4). The oocytes were kept in Kulori medium (in mM: 90 NaCl, 1 KCl, 1 CaCl2, 1 MgCl2, 5 Hepes, pH 7.4) for four to six days at 19℃ prior to experiments. Oocyte membrane preparations were obtained as previously described. 17
Radioactive flux experiments
K+ transport is used as the functional read-out of NKCC1 and Na+/K+-ATPase activity. Their activity was measured at 37℃ (oocytes at room temperature, RT) as bumetanide-sensitive (10 µM 33 ) and ouabain-sensitive (1 mM 34 ) K+ uptake using (2–6 µCi/ml) 86Rb+ (NEZ072, PerkinElmer) as a tracer for K+. 86Rb+ quantification was determined with Ultima Gold XR scintillation liquid (PerkinElmer, Skovlunde, Denmark) using a Tri-Carb Liquid Scintillation Analyzer (PerkinElmer). The K+ uptake rates were calculated from the 86Rb+ flux data and the tracer dilution, where indicated. Primary endothelial monocultures or bEnd3 cells cultured in 24-well plates were pretreated in ((in mM): 145 or 139 NaCl (primary culture or bEnd3), 3 KCl, 1.2 CaCl2, 1 MgCl2, 5 D-glucose, 20 Hepes; pH 7.4; 317 or 307 mOsm) for 5–30 min prior to 5 min exposure to identical media containing 86Rb+ (± ouabain, ± bumetanide, or ± [Arg 8 ]-vasopressin (AVP), (Sigma-Aldrich), or vehicle). Osmolarities of the test media were determined with an osmometer, Type 15 (Löser; Berlin, Germany). For studies of Na+/K+-ATPase K+ affinity, cells were washed in K+-free medium (containing in mM: 127 NaCl, 20 choline chloride, 1.2 CaCl2, 1 MgCl2, 5 D-glucose, 20 Hepes; pH 7.4, 317 mOsm) prior to exposure to isosmotic medium with different concentrations of KCl (equimolar substitution with choline chloride). The assays were terminated by rapid wash with cold assay buffer containing 10 µM bumetanide, 1 mM ouabain and 1 mM BaCl2. The cells were lysed with 1 mM NaOH and protein concentration determined. 35 For the co-cultured endothelial cells, the transendothelial electrical resistance (TEER) was measured at RT prior to all experiments, using an Endohm-12 cup electrode chamber (World Precision Instruments, Sarasota, FL) connected to a Millicell-ERS device (Millipore, MA). The uptake experiments were carried out in TES-buffered DMEM-comp without FBS 30 and the 86Rb+ was added to the luminal and/or abluminal side by media change. In hyperosmotic experiments, the endothelial cells were pretreated for 30 min, in absence of astrocytes, with glucose-containing Hepes and bicarbonate-buffered Hank’s balanced salt solution (HBSS, Thermo-Fisher) supplemented with mannitol (70 mM) in both chambers for an isosmotic treatment, or with 170 mM mannitol in both chambers for hyperosmotic (Δ100 mOsm) treatment, prior to introduction of the tracer. The assays were terminated by rapid wash of the filter support with cold isosmotic HBSS containing 10 µM bumetanide, 1 mM ouabain and 1 mM BaCl2, and the radioactive content of the filter determined. The uptake assays in Xenopus oocytes were carried out for 5–10 oocytes in ((in mM): 5 KCl, 95 NaCl, 1 MgCl2, 1 CaCl2, 10 Hepes, pH 7.4, 207 mOsm). The oocytes were either preincubated (30 min) in control solution, in a K+-free solution (equimolar substitution with choline chloride), or in a 100 mOsm hyperosmotic solution (addition of 100 mOsm mannitol). The oocytes were exposed to the tracer for 5–10 min (± bumetanide, ± ouabain, or ± vasopressin). The assays were terminated by rapid wash in cold 86Rb+-free assay solution and the oocytes individually dissolved in 200 µl 10 % SDS prior to quantification of the radioactive content.
Ca2+ signaling
To determine the activity of the G protein-coupled vasopressin receptor, intracellular calcium measurements were performed on primary monoculture of bovine endothelial cells grown in 96-well plates with Fura2-AM (5 µM, Life Technologies, Carlsbad, CA). 36 Excitation was conducted alternatingly at 340 nm and 380 nm and emission was measured at 510 nm with a NOVOstar microplate reader (BMG Labtech, Germany). Vasopressin (Sigma-Aldrich) and ATP (Tocris Bioscience, Bristol, UK) was added automatically from stock solutions to final concentrations of 1 µM and 100 µM. Autofluorescence values were subtracted from the experimentally achieved emission values and changes in [Ca2+]i were calculated as 340:380 nm ratios.
Oocyte volume measurements
The experimental setup for measuring and calculating water permeability of oocytes has been described in detail previously. 37 Briefly, the oocytes were placed in a small chamber with a glass bottom and perfused with a control solution (in mM: 100 NaCl, 2 KCl, 1 CaCl2, 1 MgCl2, 10 Hepes, pH 7.4, RT). Oocyte images were captured from below at a rate of 25 images/s. The oocytes were challenged with a hyperosmotic solution (addition of 100 mOsm mannitol) for determination of water permeability and cell volume changes.
Quantitative PCR
Total RNA from primary endothelial cells cultured as monolayers or as co-cultures on filter inserts was purified using the RNeasy mini and micro kit (Qiagen, Copenhagen, Denmark), treated with DNase, reverse transcribed (0.2 µg RNA) and amplified by qPCR as previously described. 38 Primers were from Baddela et al. 39 or designed using NCBI’s pick primer software: ATP1A1 (NM_001076798.1); F: GGAATGGGTGTTGCCCTGAG; R: TGAGCTTCCGGACTTCGTCA (106 bp), ATP1A2 (NM_001081524.1); ATCCCCGAGATCACCCCTTT; R: TTCACCAGCTTGTCCGTCTG (188 bp), ATP1A3 (XM_002695074.5); F: ATTGTCCTCTGGCTCCGTGA; R: GGTACCGGTTGTCATTGGGG (128 bp), ATP1B1 (NM_001035334.1); F: GGAGTTTTTGGGCAGGACCG; R: CCGCCAGGCAGCCATAAAAA (77 bp), ATP1B2 (NM_174677.2); F: TGGACAGCCCTGTGTCTTCA; R: TTGCCGTTTGCAGGGAACAT (147), ATP1B3 (NM_001035393.2); F: TACAACCGGACAACCGGAGA; R: GAGTCTGAAGCATGGCCCAC (133 bp), GFAP (NM_174065.2); F: CACAGGAAAGGAAGAGGCTG; R: AGTGTTTCCTGGGTCAGGTG (138 bp). For reference genes, we employed GAPDH (NM_001034034.2); F: GTGAAGGTCGGAGTGAACGG; R: TTGATGGCGACGATGTCCAC (92 bp) and RPS18 (NM_001033614.2); F: GAGGTGGAACGTGTGATCACCATT; R: TGTATTTCCCGTCCTTCACGTCCT (100 bp). The primer annealing temperature was 60℃. The optimum concentration for each primer set was 200 nM, except for GAPDH (300 nM) and the amplification efficiencies were 90–99% for all primer sets. GenEx (MultiD Analyses AB, Sweden) was used for data analysis, including testing for best reference gene combinations.
SDS-PAGE and Western blot
Bovine grey matter tissue, purified capillaries, and co-cultured endothelial cells were lysed in RIPA buffer (150 mM NaCl, 1% Triton X-100, 0.5% Na deoxycholate, 0.1% SDS, 5 mM EDTA, 50 mM Tris, pH 8, supplemented with 0.4 mM Pefabloc and 8 µM Leupeptin (Sigma-Aldrich)) and sonicated with Sonoplus mini20 (Bandelin electronic, Berlin, Germany). Protein concentration was determined using DC Protein Assay (Bio-Rad, Hercules, CA). The expression of Na+/K+-ATPase isoforms was analyzed by SDS-PAGE and immunoblotting on Immobilon-FL PVDF membranes (Millipore, MA) using: mouse anti-α1 a6F, 1:60 (DSHB, Iowa City, IA); rabbit anti-α2 07-674, 1:500 (Millipore, MA); mouse anti-α3 XVIF9-G10, 1:1000 (Thermo-Fisher); chicken anti-GAPDH AB2302, 1:2000 (Millipore, MA) diluted in Odyssey blocking buffer:PBS-T 1:1 (LI-COR, Lincoln, NE). Detection was performed using fluorophore-conjugated secondary antibodies (LI-COR) and scanned on an Odyssey CLx imaging system.
Data analysis
All functional assays were performed on batches of cells obtained from at least three different animals (primary cell culture and Xenopus oocyte batches). The n refers to the number of individual experiments, each carried out with 3–4 wells/condition for mammalian cells, 5–10 oocytes, or batches of purified capillaries. Data are shown as mean ± SEM, unless otherwise stated. K+-dependent Na+/K+-ATPase activity was approximated to Michaelis–Menten kinetics, and KM for K+ and the maximal uptake rate Vmax were calculated using non-linear regression: V = Vmax·[K+]o/(KM+[K+]o), where V is the ouabain-sensitive K+ uptake rate. Statistical analysis was performed with GraphPad Prism 6.0 (La Jolla, CA) as indicated in the figure legends and p < 0.05 was considered statistically significant.
Results
Brain endothelial cells, co-cultured with astrocytes, generate electrically tight monolayers and express endothelial cell marker proteins
To approximate the in vivo blood–brain barrier with proper endothelial polarization and monolayer tightness, we employed a co-culture in vitro BBB model. A non-contact co-culture configuration (Figure 1(a)) was chosen to facilitate determination of endothelial ion transport from both the luminal and the abluminal compartment.
30
The primary endothelial cultures were immunolabelled with antibodies towards an endothelial marker (vWF), an astrocyte marker (GFAP), and a pericyte marker (PDGFRβ) in order to verify cell origin and culture purity, Figure 1(b). The average TEER measured in all in vitro BBB co-culture models included in the present study was 1609 ± 476 (SD) Ω·cm2, n = 248 individual wells from 18 experiments (Figure 1(c)), which falls within the range of the estimated in vivo BBB TEER of 1500–1870 Ω·cm2.40,41
(a) Illustration of the primary cultured bovine capillary endothelial cells (rectangles) and astrocyte (stars) in vitro non-contact co-culture model of the BBB. (b) Immunocytochemistry with antibodies targeting filamentous actin, von Willbrand’s factor (vWF), glial fibrillary acidic protein (GFAP) and platelet-derived growth factor recetor β (PDGFRβ) in the co-cultured endothelial cells (green). Visualization of cell nuclei with propidium iodide (red). Scale bars: 20 µm. (c) TEER values for the co-cultured endothelial cells (n = 248 individual wells from 18 experiments, error bars indicate SD).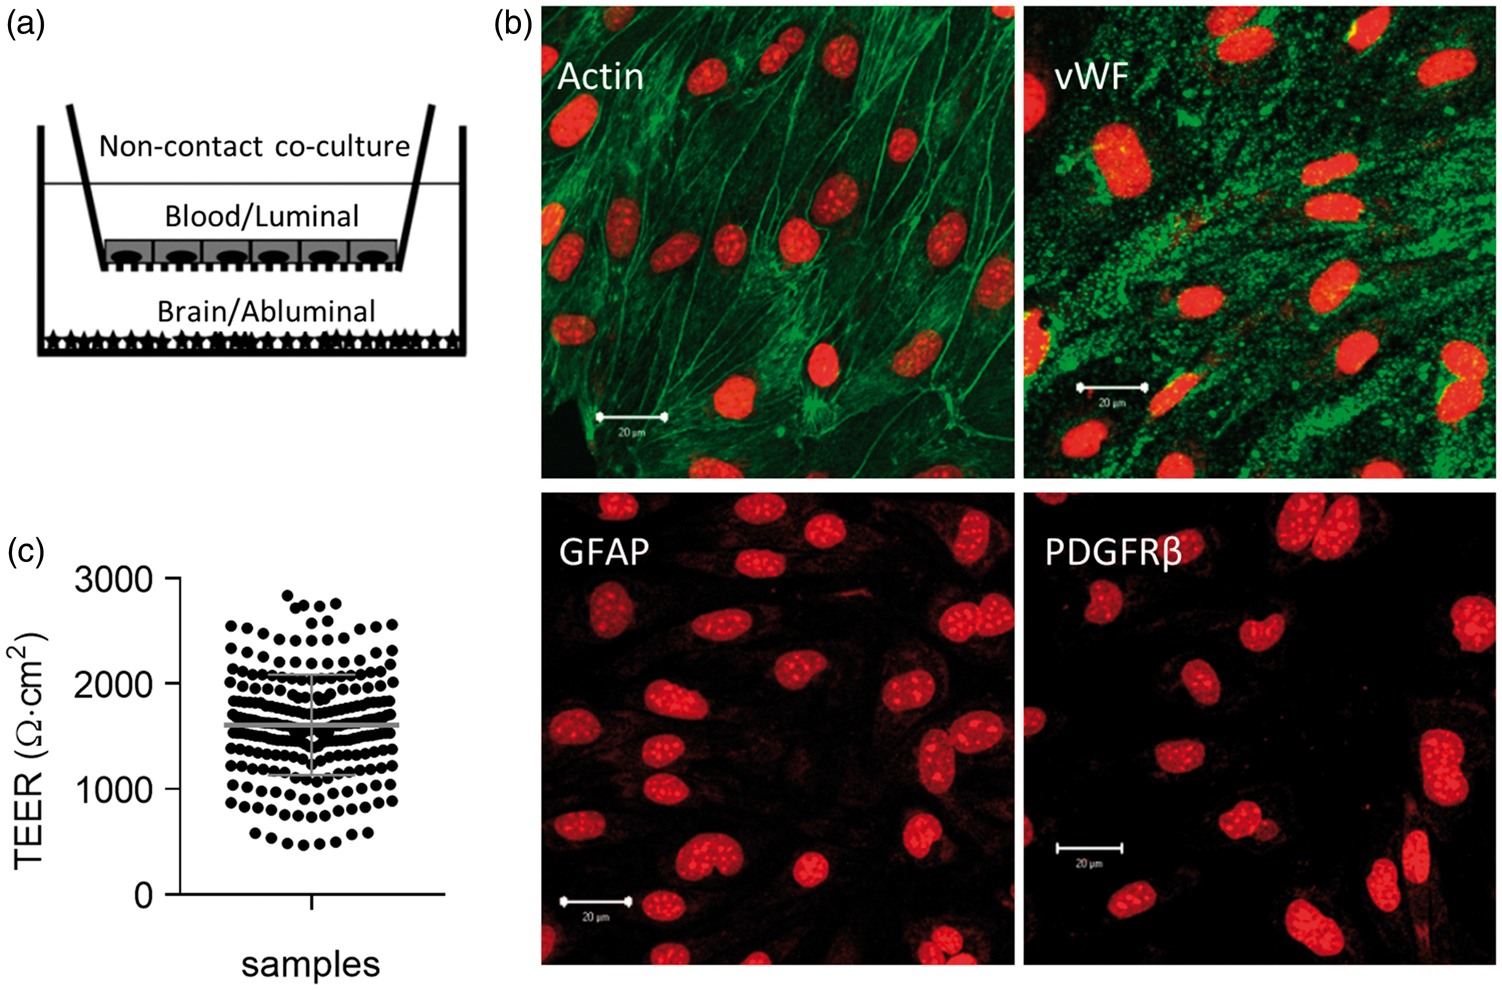
We initially determined the transendothelial flux of K+ (in the form of its radioactive congener 86Rb+) in the luminal-to-abluminal and abluminal-to-luminal direction. The bidirectional fluxes were of equal magnitude and dependent on the TEER (Figure 2(a)), a phenomenon commonly observed for small paracellular tracers like mannitol.42,43 The transendothelial K+ flux was not affected by addition of inhibitors of NKCC1 (bumetanide) and the Na+/K+-ATPase (ouabain) to the luminal or abluminal side (Figure 2(a)). These results indicate that transendothelial K+ flux occurs predominantly via the paracellular pathway in the co-cultured endothelial monolayers.
K+ flux studies in the in vitro co-culture BBB model using 86Rb+ as a tracer for K+. (a) Transendothelial K+ flux as a function of TEER. A–L: Abluminal to luminal flux; L–A: Luminal to abluminal flux. Flux was measured for 2–6 min in the presence (n = 3) or absence (n = 7–8) of ouabain (1 mM) and bumetanide (10 µM). (b) Endothelial K+ accumulation from luminal or abluminal uptake as a function of time. Data are shown as mean ± SD from a representative experiment carried out with three wells per time point. (c) Endothelial K+ uptake from the luminal side as a function of TEER value. Uptake was measured in the presence or absence of ouabain (1 mM) and bumetanide (10 µM). Combined data from n = 14 experiments. (d) as in (c) but conducted from the abluminal side, combined data from n = 14 experiments. Oua: ouabain, bum: bumetanide.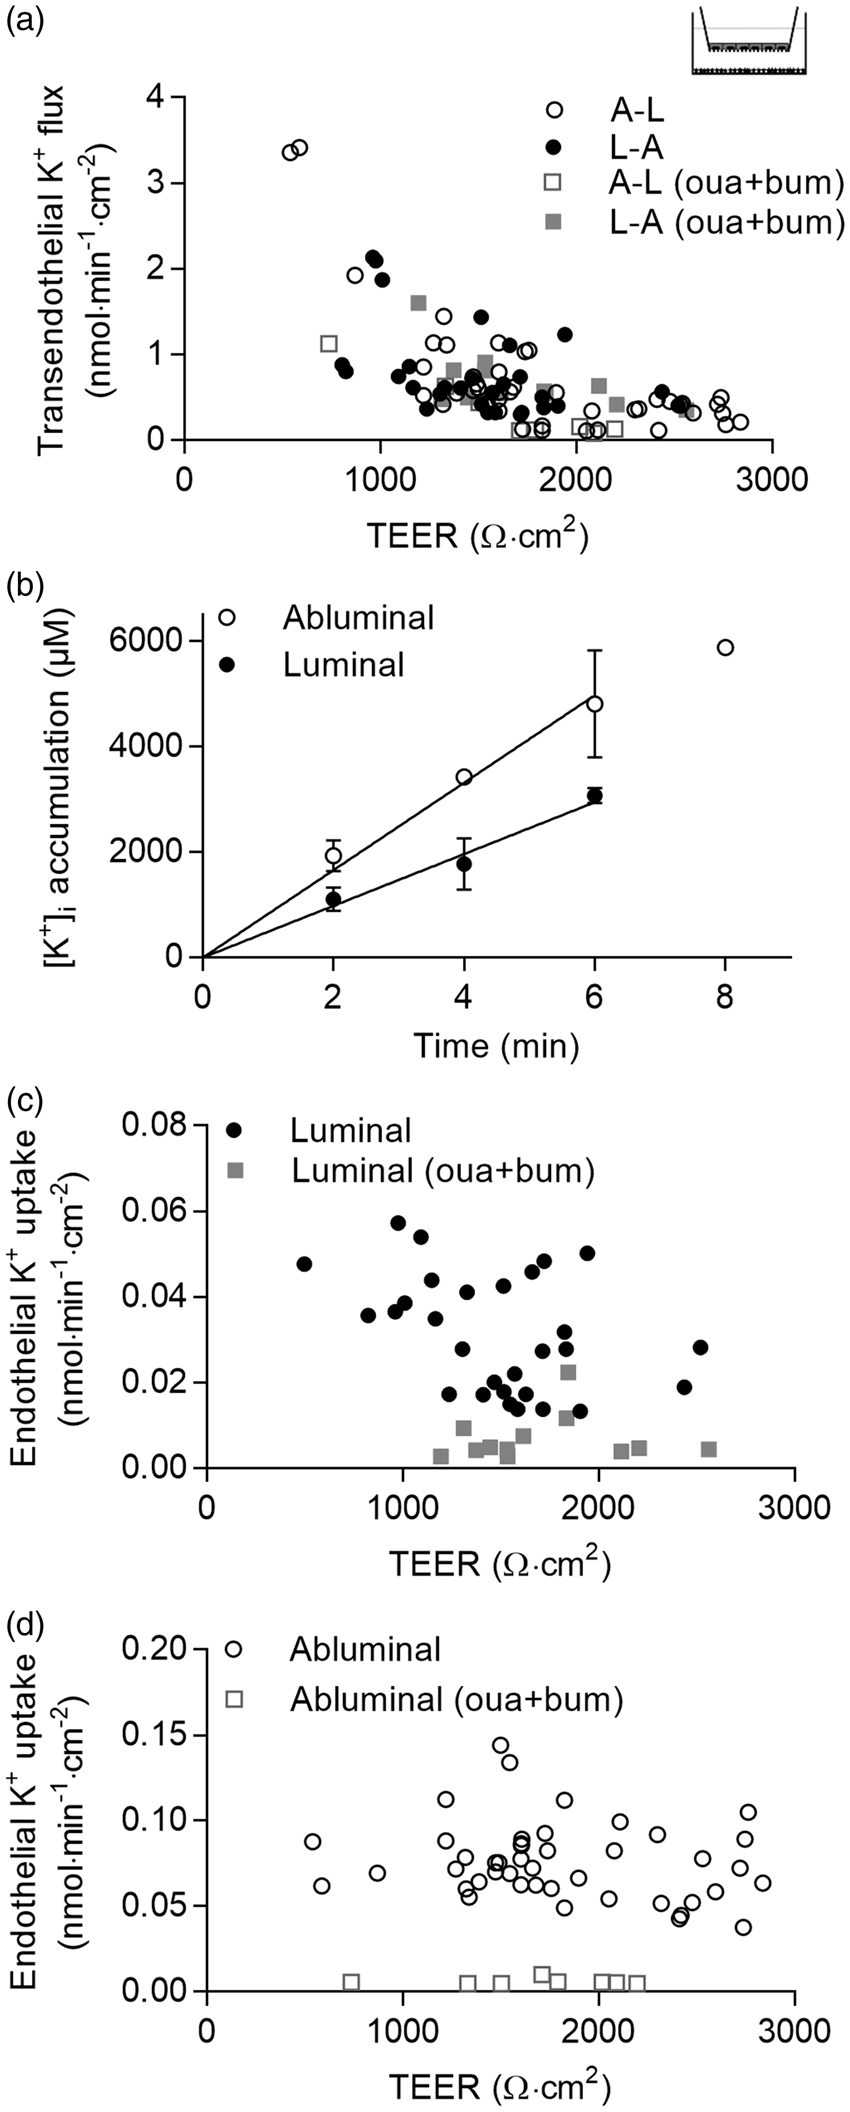
We therefore, instead, determined the uptake rates across each endothelial membrane by adding 86Rb+ to either the luminal or the abluminal compartment, followed by determination of the intracellular 86Rb+ accumulation. The intracellular accumulation of the radioisotope occurred as a linear function of time, at least until 6 min, regardless of whether the isotope was added to the luminal or abluminal side (Figure 2(b)). All subsequent uptake assays were therefore performed in a 5-min experimental window. In this time window, the amount of total transendothelial isotope crossing was negligible (< 0.1% of total isotope) in endothelial cells with TEER above 500 Ω·cm2 and this TEER value was therefore employed as the cut-off value for measuring luminal and abluminal K+-transporting mechanisms.
The luminal and abluminal endothelial K+ uptake rates showed no TEER dependency and were completely blocked by simultaneous addition of ouabain and bumetanide (Figure 2(c) and (d)), indicating that NKCC1 and the Na+/K+-ATPase act as the major endothelial inwardly directed K+-transporting mechanisms in the in vitro co-culture BBB model.
The differences in luminal and abluminal transport rates indicate dominant abluminal expression of NKCC1 and the Na+/K+-ATPase
The luminal and abluminal K+ uptake rates were determined to estimate the relative contributions of NKCC1 and the Na+/K+-ATPase at the two membranes. The abluminal NKCC1 activity was 7-fold higher than the luminal NKCC1 activity (p < 0.001, Figure 3(a)), while the abluminal Na+/K+-ATPase activity was 3.7-fold higher than the luminal Na+/K+-ATPase activity (p < 0.01, Figure 3(b)). The luminal NKCC1-mediated K+ uptake was not significantly different from the luminal Na+/K+-ATPase-mediated K+ uptake, p = 0.98, and neither was the abluminal NKCC1-mediated K+ uptake significantly different from the abluminal Na+/K+-ATPase-mediated K+ uptake, p = 0.82, two-way ANOVA followed by Šídák’s multiple comparison (Figure 3(a) and (b)). These results indicate a polarization of the brain endothelium in vitro, with a dominant abluminal expression of NKCC1 and the Na+/K+-ATPase, each contributing to ∼50% of the K+ uptake at both membranes.
NKCC1 and Na+/K+-ATPase activity in the in vitro co-culture BBB model. (a) Luminal and abluminal NKCC1 activity assessed as bumetanide-sensitive K+ uptake. The co-cultured endothelial cells were assayed for co-transporter activity for 5 min in medium containing bumetanide (0 or 10 µM) at the same side as tracer. (b) Luminal and abluminal Na+/K+-ATPase activity assessed as ouabain-sensitive K+ uptake in co-culture models exposed to medium containing ouabain (0 or 1 mM) at the same side as the tracer for 5 min. Data are shown as means ± SEM with n = 3. Statistical significances were determined using two-way ANOVA followed by Šídák’s multiple comparisons test. **p < 0.01, ***p < 0.001.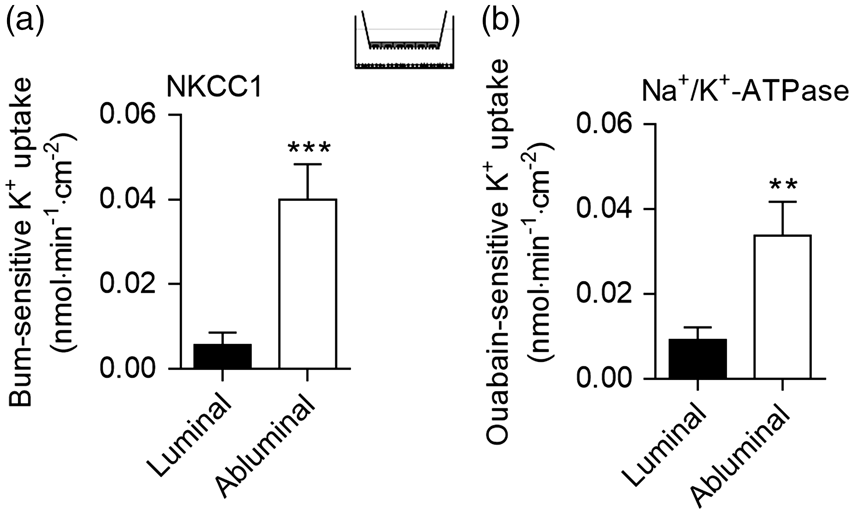
Vasopressin does not affect NKCC1 and Na+/K+-ATPase activity in the endothelial cells
To resolve if a vasopressin-dependent regulatory pathway induces NKCC1-mediated activity, vasopressin was applied to both sides of the in vitro co-culture BBB model prior to measuring the bumetanide-sensitive K+ uptake from both the luminal and the abluminal face of the endothelial cell layer. Vasopressin did not influence neither luminal NKCC1 activity (p = 0.62, Figure 4(a)) nor abluminal NKCC1 activity (p = 0.99, Figure 4(b)). To consolidate this observation, we tested the effect of vasopressin on both NKCC1 and Na+/K+-ATPase activity in monocultures of bovine capillary endothelium (in the absence of astrocytes). Vasopressin did not increase NKCC1 activity (p = 0.051, Figure 4(c)) or Na+/K+-ATPase activity (p = 0.88, Figure 4(d)). Similar lack of vasopressin-dependent transport activity was obtained using an immortalized endothelial cell line from mouse brain, bEnd3 (NKCC1 activity; p = 0.95, Figure 4(e) and the Na+/K+-ATPase activity; p = 0.64, Figure 4(f)).
Effects of vasopressin on NKCC1 and Na+/K+-ATPase activity. (a) Luminal and (b) abluminal NKCC1 activity in bovine endothelial cells of the in vitro co-culture BBB model treated for 5 min with bumetanide (0 or 10 µM) on the same side as 86Rb+ ± vasopressin (AVP) (1 µM) in both chambers (n = 3). Effects of vasopressin on (c) NKCC1 activity and (d) Na+/K+-ATPase activity in bovine capillary endothelial monocultures (BCEC) or (e–f) the bEnd3 cell line. Primary endothelial monocultures and bEnd3 cells were pretreated in isosmotic Hepes buffered media for 5 min before assayed in identical media containing 86Rb+ with or without bumetanide (10 µM) or ouabain (1 mM) ± vasopressin (1 µM) for 5 min (n = 5). One-way ANOVA followed by Dunnett’s multiple comparisons test was applied to test for vasopressin-mediated increase in NKCC1 or Na+/K+-ATPase activity. (g) Ca2+ response as a function of time determined in primary cultured endothelial monocultures loaded with Fura2-AM and treated with vasopressin (1 µM), ATP (100 µM), or control buffer. (h) Dose-dependent stimulation of IP1 response by vasopressin in hV1aR-transfected COS7 cells (figure adapted from Lykke et al.,
44
n = 7). (i) Vasopressin-mediated stimulation of NKCC1 activity in hV1aR/rNKCC1-expressing oocytes. Uninjected or hV1aR/rNKCC1-expressing oocytes were pretreated for 30 min in Hepes-buffered medium containing 0 or 5 mM K+ (to obtain cell shrinkage) before assayed in isosmotic media containing 5 mM K+, 86Rb+ ± vasopressin (1 µM) or bumetanide (10 µM) for 5 min. Data are normalized to control oocytes under basal conditions (n=3) and analyzed by two-way ANOVA followed by Šídák’s multiple comparison test. Ns: not significant.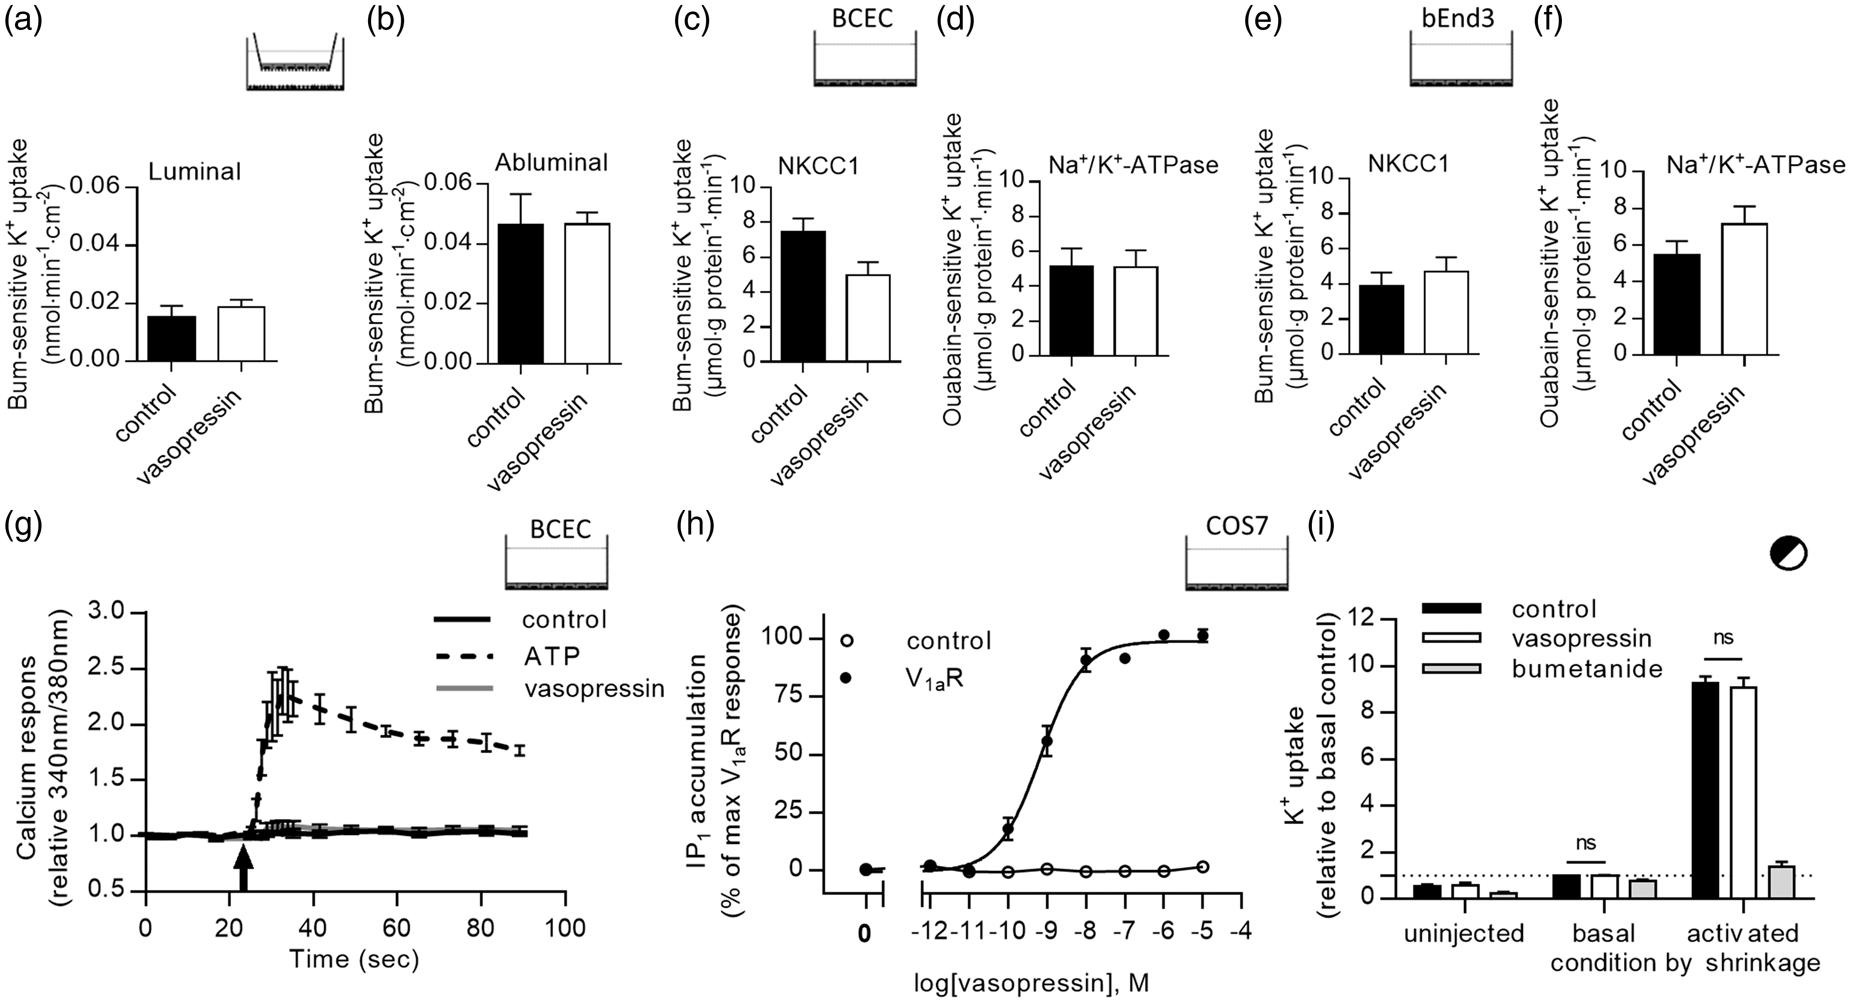
To test if V1aR is functionally present in primary monoculture of bovine endothelium pre-loaded with the Ca2+ indicator Fura2-AM, the intracellular Ca2+ response was monitored upon addition of vasopressin to the test medium. No vasopressin-dependent intracellular Ca2+ response was observed, whereas addition of the positive control, ATP, to the extracellular medium produced a robust Ca2+ response (Figure 4(g)). To ensure biological activity of the employed batch of vasopressin, we (in another project carried out simultaneously 44 ) tested the vasopressin-mediated inositol phosphate (IP) production in hV1aR-expressing COS-7 cells. As illustrated in Figure 4(h), the V1aR responded correctly to addition of vasopressin to the test medium with an EC50 of 0.68 nM (figure adapted from Lykke et al. 44 ). These data indicate that the V1aR is not functionally expressed in the cultured endothelial cells employed in these experiments.
To obtain an experimental scenario in which we could ensure co-expression of V1aR and NKCC1, we co-expressed these in the Xenopus laevis oocyte expression system and determined NKCC1 activity by means of K+ (86Rb+) uptake. The background K+ uptake (uninjected oocytes) was unaffected by the addition of vasopressin as was the K+ uptake in V1aR/NKCC1-expressing oocytes kept in basal solution during the uptake, (97.8 ± 4.8% of control, p = 1.0, Figure 4(i)). As NKCC1 is known to be activated by shrinkage of the oocytes, 45 we additionally tested if the activity of pre-activated NKCC1 could be further enhanced by activation of the vasopressin receptor. Although NKCC1 was robustly activated in a bumetanide-sensitive manner by cell shrinkage (9.3 ± 0.3 fold, p < 0.001), this activation was not further enhanced upon activation of V1aR (9.1 ± 0.4 fold, p > 0.99). Taken together, our data suggest that vasopressin, via activation of V1aR, does not directly activate NKCC1 (or the Na+/K+-ATPase).
Cell shrinkage activates NKCC1 differentially depending on the experimental system
To test if cell shrinkage could directly affect the two transport systems and thus lead to brain ion and water influx, the in vitro co-culture BBB model was exposed to an isosmotic or hyperosmotic (+100 mOsm) solution (luminal and abluminal) prior to determination of NKCC1- and Na+/K+-ATPase-mediated activity in the respective test solutions. The transporter activity determined following the hyperosmotic challenge was not significantly different from the control situation for NKCC1 (p = 0.48, Figure 5(a)) or for the Na+/K+-ATPase (p = 0.07, Figure 5(b)), although the latter displayed a tendency towards increased activity. The hyperosmotic preincubation period reduced the TEER down to 19 Ω·cm2 (n = 2 wells), which, however, should not affect the cellular uptake as the isotope was added to both sides simultaneously. As cell shrinkage-induced NKCC1 activity previously has been demonstrated in cultured cells,6,45 we determined the effect of NKCC1 in the immortalized bEnd3 cell line. We did indeed find a 2.5-fold increase in NKCC1 activity upon a 100 mOsm hyperosmotic treatment (p < 0.05, Figure 5(c)). Hyperosmotic activation of heterologously expressed NKCC1 was confirmed in NKCC1-expressing Xenopus oocytes, in which the K+ uptake increased 60-fold (p < 0.01) with preincubation of the oocytes in an additional 100 mOsm mannitol (or by preincubation in K+ free solution), Figure 5(d). These data show that the NKCC1 is indeed activated by cell shrinkage upon heterologous expression in Xenopus oocytes and in an immortalized endothelial cell line, whereas we detected no hyperosmolar-induced activation of NKCC1 in the tight in vitro co-culture BBB model.
Hyperosmotic regulation of NKCC1 and Na+/K+-ATPase. (a) Bumetanide-sensitive and (b) ouabain-sensitive K+ uptake in the endothelial cells of the in vitro co-culture BBB model pretreated with isosmotic or hyperosmotic test solution (+100 mOsm mannitol) for 30 min before assayed in identical solution containing 86Rb+ ± bumetanide (0 or 10 µM) or ouabain (0 or 1 mM) for 5 min, n = 4. (c) Bumetanide-sensitive activity in the bEnd3 cell line pretreated with isosmotic test solution or 100 mOsm hypertonic test solution for 30 min before assayed in identical solution containing 86Rb+ + bumetanide (0 or 10 µM) for 5 min, n = 5. Statistical significant differences between isosmotic control and hyperosmotic treatment were evaluated by unpaired Student’s t-test. (d) Hyperosmotic regulation of NKCC1 expressed in oocytes. Uninjected or rNKCC1-expressing oocytes were pretreated for 30 min in oocyte buffer containing 0 or 5 mM K+ before assayed in isosmotic medium containing 5 mM K+, 86Rb+ + bumetanide (0 or 10 µM) or ouabain (0 or 1 mM) for 5 min or assayed without pretreatment in an equal uptake solution but with addition of 100 mOsm mannitol. Data are normalized to control oocytes under basal conditions (n = 3) and analyzed by two-way ANOVA followed by Šídák’s multiple comparison test. (e) Volume traces obtained from AQP4-expressing oocytes (grey) or uninjected oocytes (black) challenged with a hyperosmotic gradient of 100 mOsm. Right panel indicates total shrinkage after 10 min. n = 9–11. (f) K+ uptake in Na+/K+-ATPase(NKA)/AQP4- or AQP4-expressing oocytes assayed in isosmotic test solution containing 86Rb+ ± ouabain (1 mM), shown is a representative experiment of n = 8, error bars as SD. (g) Hyperosmotic (+100 mOsm mannitol)-mediated increase in ouabain-sensitive K+ uptake in Na+/K+-ATPase/AQP4-expressing oocytes (n = 6). *p < 0.05, ** p < 0.01, ***p < 0.001, ns: not significant.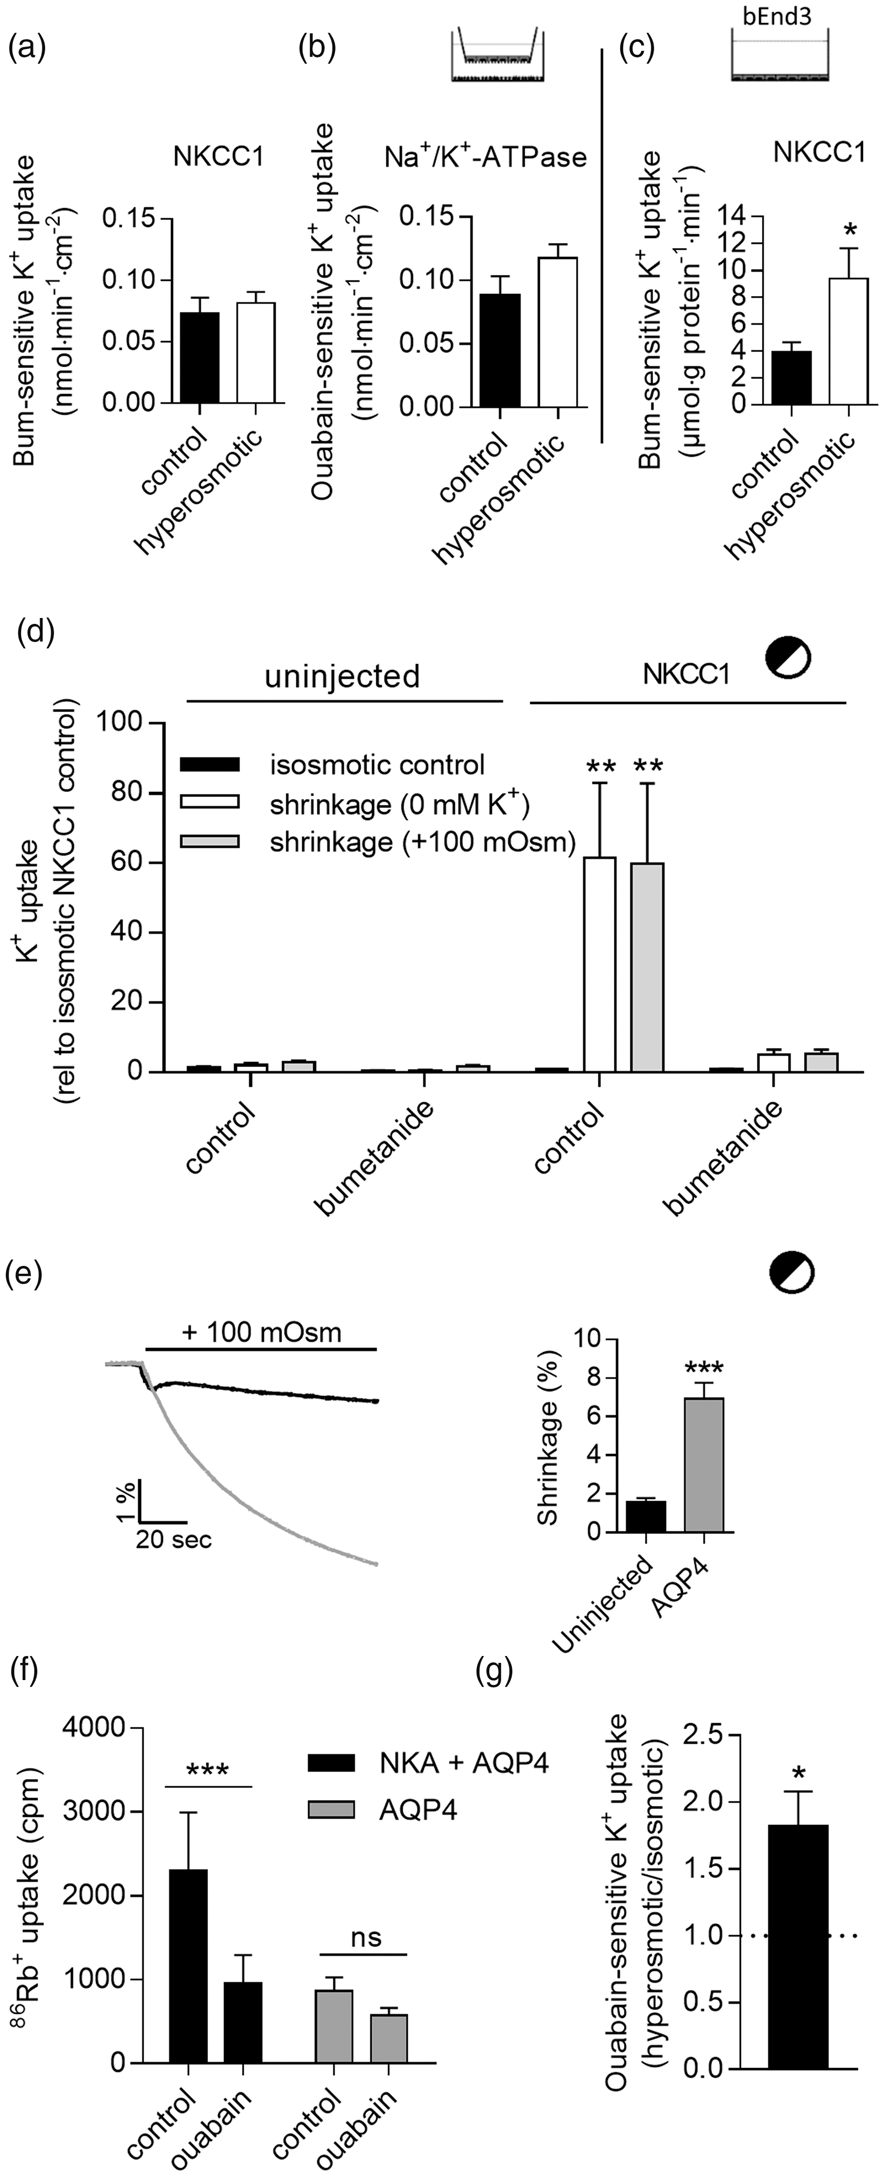
The Na+/K+-ATPase is activated by hyperosmolar-induced cell shrinkage
We expressed the Na+/K+-ATPase in Xenopus oocytes to resolve whether the tendency towards hyperosmolar-induced increase in Na+/K+-ATPase activity observed in the in vitro BBB model (Figure 5(b)) could be solidified in an isolated system. To facilitate cell shrinkage, the α1β1 isoform combination of the Na+/K+-ATPase was co-expressed with aquaporin 4 (AQP4). As illustrated in the representative traces in Figure 5(e), the AQP4-expressing oocytes shrunk at a faster rate than that of the non-aquaporin-expressing oocytes (6.9 ± 0.8% shrinkage after 10 min compared to 1.6 ± 0.2% in the control oocytes, p < 0.001, Figure 5(e), right panel). Expression of the Na+/K+-ATPase together with AQP4 increased the ouabain-sensitive K+ uptake compared to oocytes only expressing AQP4 (p < 0.001, Figure 5(f)). Exposure to a hyperosmotic solution (+100 mOsm mannitol) increased the ouabain-sensitive uptake of Na+/K+-ATPase/AQP4-expressing oocytes by 1.8-fold (p < 0.05, Figure 5(g)). This hyperosmolar-mediated increase in activity of the α1β1 isoform combination of the Na+/K+-ATPase indicates that the tendency of hyperosmolar-mediated ouabain-sensitive K+ uptake found in the in vitro co-culture BBB model (Figure 5(b)) may well arise from increased Na+/K+-ATPase activity.
K+ affinity of the Na+/K+-ATPase suggests physiologically relevant regulation
To investigate if brain endothelial Na+/K+-ATPase activity is regulated by the expected increase in parenchymal K+ during osmotic extraction of brain water and, as a consequence, regulate Na+ flux into the brain, we determined the ouabain-sensitive apparent K+ affinity in the primary-cultured endothelial monolayer (Figure 6). The measured KM of 2.1 ± 0.7 mM, n = 4, is in a range which allows increased Na+/K+-ATPase activity during incidents of raised parenchymal extracellular K+ concentrations.
K+ affinity of the Na+/K+-ATPases in primary cultured endothelial monocultures (BCEC) assessed as ouabain-sensitive K+ uptake (with 86Rb+ as the tracer). Cells were pretreated in Hepes-buffered medium containing 3 mM K+ for 5 min and then rapidly washed in K+-free buffer before assayed in isosmotic buffer containing K+ (0.5 to 20 mM) ± ouabain (1 mM). Data and KM are shown as means ± SEM (n = 4) and curve fits were approximated to Michaelis–Menten kinetics for individual experiments using prior to averaging the KMs.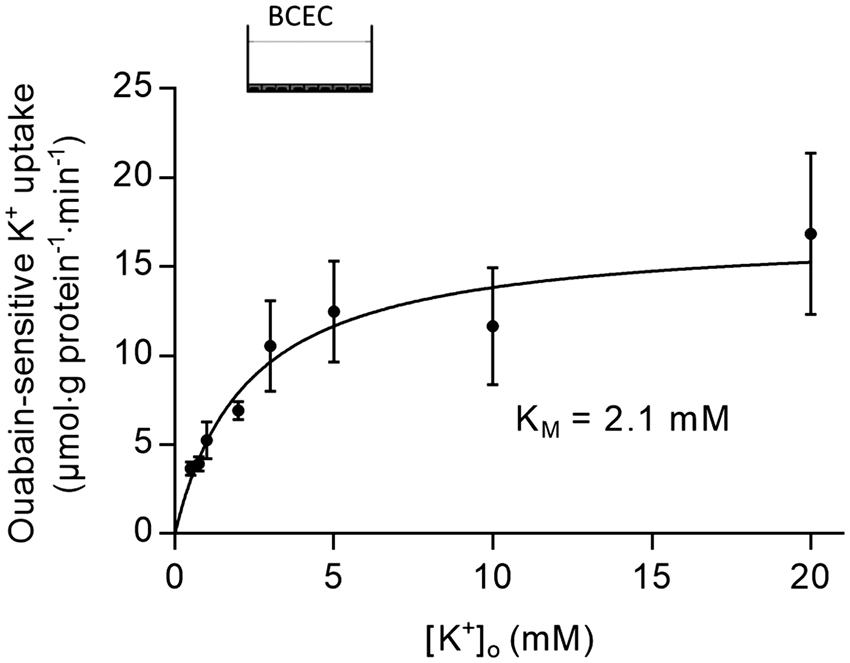
Na+/K+-ATPase of the α1β1 and α1β3 isoform combinations dominate in brain capillaries
To determine the endothelial Na+/K+-ATPase isoform distribution in the endothelial compartment, the mRNA encoding the Na+/K+-ATPase subunit isoforms were quantified by qPCR in freshly isolated bovine cerebral capillaries. mRNA from the two α subunits α1, α2, and the three β subunits β1, β2 and β3 were detected in the samples, whereas the α3 transcript was absent (Figure 7(a)). α2 and β2 constitute the typical astrocytic isoforms
15
and their presence could be due to astrocytic endfeet remnants in the capillary fraction, as also indicated by GFAP transcript in the capillary fraction (data not shown). We further determined the relative abundance of the different Na+/K+-ATPase isoforms in both endothelial monocultures and co-cultures relative to purified capillaries. The transcript levels in the cultured endothelial cells were normalized to the transcript levels in the parent capillary isolation (across three different batches of brain capillaries). α3 remained undetected. However, both α2 and β2 (and GFAP, data not shown) were barely detectable in the cultured endothelial cells (Figure 7(b)), suggesting that the α2 and β2 transcripts in capillaries were due to the presence of astrocyte endfeet remnants. The mRNA levels of α1 and β1/β3 showed an expression profile comparable to the isolated capillaries (although with a small reduction in β1). These transcript data indicate that α1 and β1/β3 are the predominant Na+/K+-ATPase isoforms expressed in brain endothelial cells and that this favored isoform abundance is upheld in cell culture under our experimental conditions.
Na+/K+-ATPase subunit expression in the cerebral endothelium. (a) qPCR quantification of Na+/K+-ATPase subunit mRNA in purified bovine cortical capillaries normalized to reference genes (see materials and methods). (b) mRNA levels in primary cultured cerebral endothelial cells (monoculture (BCEC) or co-culture), normalized to reference genes and quantified relative to the corresponding capillary preparation (n = 3). Differences in mRNA expression relative to the capillary preparation were determined by one-way ANOVA followed by Dunnett’s multiple comparison test. *p < 0.05, ND: not detectable. (c–d) Western blot analysis of Na+/K+-ATPase α subunits in isolated capillaries (c) and co-cultured endothelial cells (d). Membrane preparations from Xenopus oocytes expressing the individual Na+/K+-ATPase α isoforms (as indicated) were used as positive controls with uninjected oocytes serving as the negative control. The endogenous expression of isoforms was validated in isolated bovine grey matter (GM). (e) TEM of isolated bovine brain capillaries, bar 2 µm. (f) Cryosections of isolated bovine brain capillaries were processed for immunofluorescence to visualize F-actin (endothelial cells; red) and Na+/K+-ATPase α2 subunit (green). Inset; bovine brain capillary in situ stained for the same. Note the lack of co-localization between the two antigens in both cases. Bar, 10 µm. (g) Immunofluorescence of isolated capillaries to show endothelial basement membrane (laminin; green) and Na+/K+-ATPase α2 subunit (red) immunoreactivity. Note there is no α2 subunit staining within the circumference delineated by the basement membrane. Bar, 10 µm. (h) Cryoimmunogold staining of Na+/K+-ATPase α2 subunit in bovine brain shows that endothelial cells (EC) are devoid of α2 immunoreactivity, which is almost exclusively localized to astroglial foot processes (h; arrows), which envelope that vessel on the abluminal side of the basement membrane (BM; marked with stippled line). Bar, 200 nm. (i) Separation of α2 staining (i; arrows) from the endothelium is particularly evident in isolated capillaries where the subendothelial matrix has expanded (during the isolation process) to displace the basement membrane some distance from the endothelium. Inset shows the boxed region in (i) at higher magnification to reveal the astroglial foot processes with α2 immunoreactivity (open arrow). Bar, 500 nm. (j) Immunofluorescence on isolated capillaries with anti-pan-Na+/K+-ATPase α subunit (red) and polyclonal rabbit anti-laminin (green) antibodies counterstained with Alexa-conjugated phalloidin (blue) to visualize endothelial F-actin. The pan-Na+/K+-ATPase mAb displays immunoreactivity similar to α2 staining; astroglial processes associated with the exterior of the basement membrane (laminin; green), but in addition, shows immunoreactivity at the basolateral part of the endothelial cells (arrows), likely representing the Na+/K+-ATPase α1 subunit. Bar, 5 µm.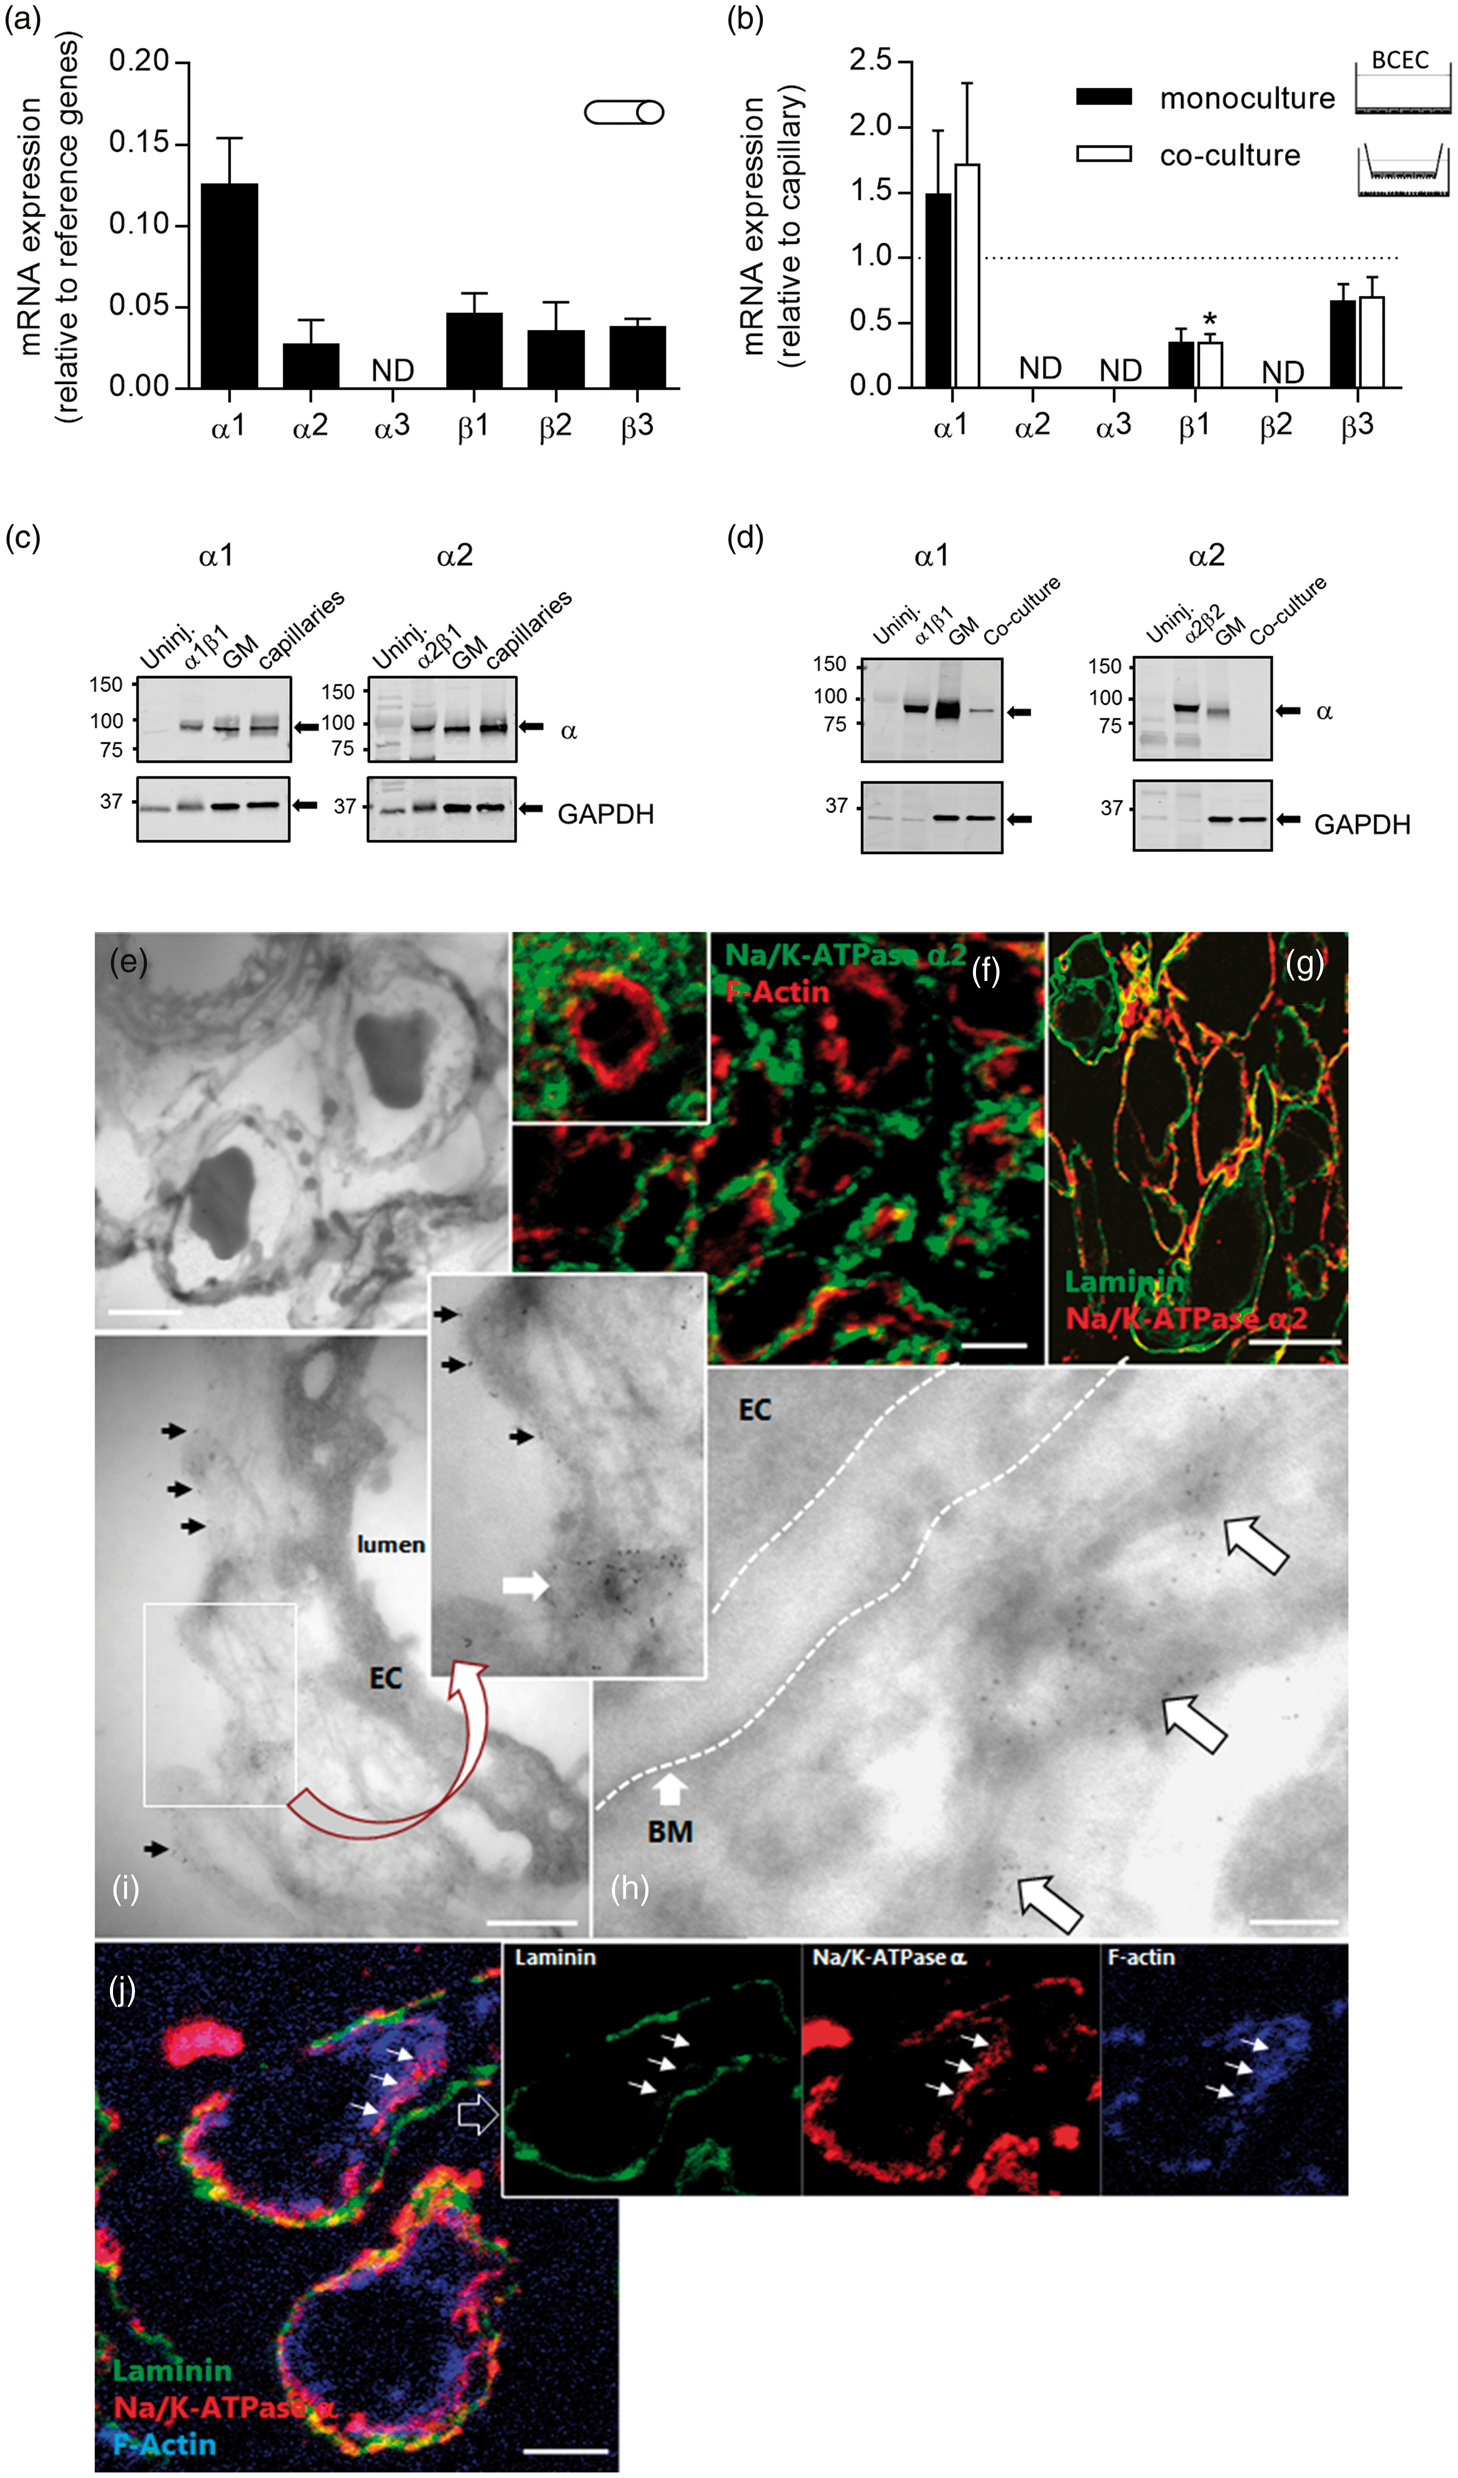
The transcript data were substantiated by Western blotting, which showed expression of Na+/K+-ATPase α1 and α2 in purified capillaries (Figure 7(c)), while only α1 was detected in the endothelial cells grown as co-culture with astrocytes (Figure 7(d)).
The difference in expression of Na+/K+-ATPase isoforms between isolated capillaries and cultured endothelial cells derived from them suggests astrocytic remnants in the isolated capillaries, which would be absent from cultured cells. To answer this question, we applied morphological analysis to resolve the endothelial distribution of Na+/K+-ATPase in vivo by immunofluorescence and cryo-immunogold labeling of in situ or isolated bovine capillaries. Na+/K+-ATPase α2 staining was clearly not endothelial in origin. Rather, α2 immunoreactivity was confined to severed (from the isolation procedure) astroglial foot processes remaining associated with the outer aspect of the endothelial basement membrane (Figure 7(e) to (i)). A pan-Na+/K+-ATPase α subunit mAb, in addition to the astrocytic basement membrane stain observed above, also indicated immunoreactivity at the abluminal portion of endothelial cells (Figure 7(j)), presumably indicating α1 subunit expression in the endothelial cells. Taken together, with α3 transcript absent from the endothelium and α2 localized to the astrocytic endfeet, α1 thus appears as the predominant α-isoform in abluminal membrane of bovine brain capillaries with β1 and β3 as the preferred accessory subunits.
Discussion
In the present study, we have demonstrated that the Na+/K+-ATPase, but not the NKCC1, is subject to functional regulation upon treatments mimicking dehydration in a tight in vitro co-culture model of the BBB. To access both membranes of the endothelial cell layer, we employed a non-contact in vitro endothelial/astrocytic co-culture model of the blood–brain barrier with TEER similar to estimates of the in vivo BBB TEER (1500-1870 Ω·cm2).40,41 This tightness of the endothelial cell layer is crucial for proper induction of the BBB properties and allowed us to determine the transport rate from each side of the endothelium in isolation. Functional expression of NKCC1 and the Na+/K+-ATPase was primarily detected at the astrocytic compartment-facing side of the endothelial cell layer, thus denoted the abluminal side of the in vitro BBB model. This abluminally located NKCC1-mediated activity is in agreement with a previous study, 46 while others have found predominantly luminal NKCC1 expression.7,47 The contrasting localization of NKCC1 may arise from differences in the monolayer tightness of the in vitro BBB model and underscores the importance of employing models with high TEER values to ensure proper BBB characteristics. Immunohistochemical studies of rat brain indicated scarce expression of NKCC1 in the cerebral endothelium in vivo, 11 which aligns well with transcriptome studies detecting limited mRNA encoding NKCC1 in this cell type. 12 With NKCC1 notoriously upregulated upon cell cultivation 10 and the limited specificity of a range of commercially available NKCC1 antibodies, it remains unresolved to what extent NKCC1 is functionally expressed in brain microvascular endothelium in vivo under certain conditions. Nevertheless, the dominant expression of NKCC1 at the abluminal side of the endothelium and a predicted inwardly-directed ion transport is challenging to reconcile with the current model based on NKCC1 serving as the molecular mechanism underlying dehydration-induced ion and water accumulation in the brain.
The antidiuretic hormone vasopressin increases in the plasma of patients experiencing stroke and intracranial injuries48,49 and promotes enhanced endothelial water flux 50 and edema formation 51 in a manner sensitive to V1aR antagonism.21,22 The vasopressin-mediated endothelial water flux could thus occur via the V1aR-dependent NKCC1 activation, proposed in the current model. 27 We were, however, unable to detect vasopressin-mediated activation of NKCC1 activity, whether determined in monocultures or co-cultures of brain endothelial cells (in vitro BBB models) or in Xenopus oocytes co-expressing NKCC1 and the vasopressin receptor. Biological activity of the vasopressin was therefore verified in V1aR-expressing COS-7 cells in a parallel experimental series, which illustrated V1aR-dependent down-regulation of AQP4 in V1aR/AQP4-expressing oocytes. 44 Ca2+ imaging revealed lack of V1aR activity in the primary cultures of bovine cerebral endothelium, which aligns well with low levels of V1aR transcript in cerebral endothelium12,25 and lack of V1aR expression in capillary endothelial membrane as determined by immunohistochemistry and autoradiography.26,52 Although we are unaware of the experimental explanation to the diversion from the report by O’Donnell et al. 27 in which V1aR-mediated NKCC1 activation was demonstrated, 27 a partial reason may be exposure of the co-culture to the glucocorticoid dexamethasone in order to induce BBB properties: 30 Dexamethasone exposure may abolish the vasopressin-dependent stimulation of NKCC1 activity. 53 However, neither endothelial monoculture, the bEnd3 cell line, nor V1aR/NKCC1-expressing oocytes were exposed to this compound.
Ultrastructural determination of distribution of Na+/K+-ATPase reaction products at the microvascular endothelium has revealed predominant accumulation at the abluminal membrane13,14,54 although luminal membrane Na+/K+-ATPase has been proposed as well.55–57 A possible reason for this discrepancy is the variable tissue fixation, which has been shown to alter the levels of the Na+/K+-ATPase reaction products at the two endothelial membranes, 55 while the enzyme distribution may be rearranged upon cultivation in vitro. 54 These biochemical methods, however, does not reveal the isoform-specific distribution of the Na+/K+-ATPase. Western blot analysis of isolated brain microvessels (possibly including remnants of astrocytic endfeet and nerve endings) has previously detected expression of all tested isoforms (α1–3 and β1–2). 58 Our combined results from qPCR, Western Blot, and light/electron microscopy identified endothelial expression of α1 on the abluminal membrane in predicted combination with β1 or β3. α3 transcript was absent in the capillary fractions and electron microscopy illustrated that the detected α2 originated from the astrocytic endfeet tightly wrapped around the purified capillaries. In an earlier study, brain microvessels contained slightly more total α subunit (α1–3) but significantly less total β subunit (β1–2) in comparison to that of whole brain homogenate. 58 Since the subunit stoichiometry for functionally active Na+/K+-ATPases is 1α:1β, this apparent lack of β subunit implies that a substantial fraction of the total capillary β isoform could be assigned to β3, which was not included in the aforementioned analysis. 58 Altogether, we therefore propose that the Na+/K+-ATPase of bovine brain capillaries mainly consists of α1β1 and α1β3. In support of this isoform distribution, the ouabain-sensitivity of Na+/K+-ATPase activity in rat brain endothelial cells (IC50 ≈ 10 µM 59 ) resembles that of the rodent α1 isoform 60 and an RNA-seq transcriptome database lists robust mRNA levels of the α1, β1 and β3 subunit isoforms in mouse brain vascular cells. 12 Cultivation of the bovine brain capillary endothelium (both in the in vitro co-culture BBB model and as primary endothelial monoculture) preserved the expression of α1 and β1/β3. Taken together with the dominant abluminal Na+/K+-ATPase activity in the tight in vitro co-culture BBB model, this finding supports the relevance of this model for determination of cerebral microvasculature endothelial Na+/K+-ATPase transport characteristics.
Different isoform combinations of the Na+/K+-ATPase display distinct kinetic characteristics, such as apparent ion affinities.9,15,16,61 For the endothelial Na+/K+-ATPase to increase its activity in response to dehydration-induced osmotic extraction of water and associated predicted fluctuations in parenchymal [K+]o (and other ions) and thus maintain the cerebral K+ homeostasis, its isoform expression should be of a combination which renders the Na+/K+-ATPase sensitive to [K+]o in the parenchyma. 62 Such K+-mediated increase in Na+/K+-ATPase activity is accompanied by Na+ flux from the endothelium to the brain and this net parenchymal accumulation of electrolytes thus counteracts the osmotic brain water loss, given parallel accumulation of a counter ion. With a KM for K+ of 2.1 mM in the primary endothelial cultures, in agreement with previous reports,59,62,63 the Na+/K+-ATPase displays the ability to react to increased [K+]. In contrast, the neuronal Na+/K+-ATPase activity saturates at the basal [K+]o of around 3 mM. 63 Of the two isoform combinations predicted to dominate the endothelial Na+/K+-ATPase activity, the α1β1 isoform combination has an apparent K+ affinity in the range of 1 mM9,16,61,64 and thus approaches saturation at basal parenchymal [K+]o. The α1β3 isoform combination is less well studied and apparent K+ affinities in the range 1–3 mM have been reported.61,65 The α1β3 isoform combination could then, in part, underlie the apparent K+ affinity observed in cultured or freshly isolated cerebral microvascular endothelial cells. With such relatively low K+ affinity of an endothelial abluminal Na+/K+-ATPase, excess K+ could be efficiently cleared from the brain tissue during intraparenchymal K+ fluctuations and thus serve to protect the neurons from global prolonged K+-mediated depolarization during dehydration. The endothelial Na+/K+-ATPase is, in addition, likely to be prone to regulation by a range of systemic volume-regulating hormones such as angiotensin and noradrenalin66,67 and in that manner further counteract brain water loss during systemic dehydration.
Endothelial cell shrinkage is predicted to occur during systemic dehydration and the Na+/K+-ATPase activity in the in vitro co-culture BBB model displayed a tendency towards hyperosmolar activation. Such shrinkage-induced activation reached statistical significance in heterologously expressed Na+/K+-ATPase α1β1 isozyme in oocytes. This Na+/K+-ATPase isoform may therefore be subject to direct activation by hyperosmotic stress and could in that manner increase the brain Na+ content during dehydration. NKCC1, on the other hand, is recognized to be activated by cell shrinkage in cell lines and heterologous expression systems via activation of the WNK and SPAK/OSR1 kinases.68,69 We observed this shrinkage-evoked activation in NKCC1-expressing oocytes and in the immortalized endothelial cell line, bEnd3, but not in the tight in vitro co-culture BBB model from acutely isolated endothelial cells. This discrepancy may suggest that NKCC1 is fully activated at basal conditions in the brain endothelium and/or that the regulatory kinases involved in cell shrinkage-activation of NKCC1 may be reduced in the brain endothelium. Although heterologous expression systems and immortalized cell lines are useful for a wide range of experimental approaches and biophysical characterization of transport proteins, they may not fully recapitulate what is observed in vivo or in in vitro systems approximating in vivo conditions. It must, however, be emphasized that despite the proper induction of important BBB characteristics in the co-culture in vitro BBB model, this experimental setup remains a model of a complex cellular system and may not fully recapitulate in vivo conditions. Although it would be desirable to test the hypothesis arising from the present study in an in vivo setting, the difficulty regarding determination of transport activity at the abluminal endothelial membrane and the severe complications arising from in vivo inhibition of the Na+/K+-ATPase will certainly make it a challenging endeavor.
In conclusion, in an in vitro co-culture BBB model with TEER values resembling that of the in vivo BBB, we detected abluminal localization of NKCC1 and lack of hyperosmolar- and vasopressin receptor-mediated NKCC1 activation. This finding, taken together with low expression of NKCC1 and V1aR in cerebral endothelium, suggests a limited role of NKCC1 in dehydration-induced brain electrolyte accumulation and thus contrasts with the current model of dehydration-induced brain electrolyte accumulation. The abluminal localization of the Na+/K+-ATPase (of the α1β1 and α1β3 isozymes) and its activation by dehydration-induced K+ fluctuations and cell shrinkage, instead, predicts this ion transporter to enhance cerebral Na+ accumulation during systemic dehydration and thereby reduce osmotic brain water loss in vivo.
Footnotes
Funding
The author(s) disclosed receipt of the following financial support for the research, authorship, and/or publication of this article: This study was supported by the Sapere Aude program under the Danish Medical Research Council (grant number 0602-02344B FSS) to NM, Læge Sofus Carl Emil Friis og hustru Olga Doris Friis’ legat (to NM), the Carlsberg Foundation (CF15-0070) to NM and the Faculty of Health and Medical Sciences, University of Copenhagen (to NM).
Acknowledgements
We thank Carina Lynnerup Pedersen, Charlotte Goos Iversen for technical assistance and Professor Kjeld Møllgård for expert histological guidance.
Declaration of conflicting interests
The author(s) declared no potential conflicts of interest with respect to the research, authorship, and/or publication of this article.
Authors’ contributions
KL, MA, SH, HCCH, AS, TLTB, KT, FV, BB, NM Made a substantial contribution to the concept and design, acquisition of data or analysis and interpretation of data. KL, MA, SH, HCCH, AS, KT, FV, BB, NM Drafted the article or revised it critically for important intellectual content. KL, MA, SH, HCCH, AS, TLTB, KT, FV, BB, NM Approved the version to be published.