Free accessResearch articleFirst published online 2008-8
Dynamic Changes in Vascular Permeability,Cerebral Blood Volume,Vascular Density,and Size after Transient Focal Cerebral Ischemia in Rats: Evaluation with Contrast-Enhanced Magnetic Resonance Imaging
Postischemic cerebral blood flow and blood volume changes have been associated with angiogenesis; nevertheless, the spatiotemporal changes in vascular permeability, vascular density, and vessel size have not been investigated. Here we report a prolonged increase in vascular permeability from day 3 to day 21 after ischemia, in particular in the reperfused outer cortical layers and leptomeninges. Increased cerebral blood volume (CBV) was observed from day 3 to day 14, whereas increased blood volume in small vessels, primarily capillaries, was noticed from day 7 to day 14 in the reperfused cortex. An initial decrease in vascular density and a reciprocal increase in vessel size were observed within the reperfused cortex at days 1 and 3 after ischemia. Immunohistological analysis confirmed a similar decrease in microvessel density and an increase in vessel size in vessels with a diameter greater than 30 μm. These large-sized vessels exhibited intense basic fibroblast growth factor and endothelial nitric oxide synthase immunoreactivity, suggesting the growth of collateral vessels. By contrast, a late increase in vascular density was noticed in the reperfused outer cortex at days 14 and 21 after ischemia. Together, these findings suggest that the early phase of CBV increase is likely because of the improvement in collateral circulation, whereas the late phase of CBV increase is attributed to the surge of angiogenesis.
Ischemic stroke occurs when blood flow to a region of the brain is interrupted. The extent of postischemic injury depends not only on the degree and duration of arterial occlusion, but also on the adequacy of collateral circulation. The resultant low tissue oxygen tension after ischemia often leads to compensatory growth of blood vessels to meet the metabolic demand (Plate, 1999). The extent of angiogenesis has been correlated with survival in stroke patients (Krupinski et al, 1994). Previously, we have reported that postischemic induction of both angiogenic and angiostatic genes is tightly coupled to the process of angiogenesis in a rat middle cerebral artery (MCA) occlusion model (Lin et al, 2000). With diffusion- and perfusion-weighted imaging techniques (Hoehn-Berlage et al, 1995; Li et al, 1999, 2000; Zaharchuk et al, 2000; Kim et al, 2005), we further reported that postischemic angiogenesis is associated with an increase in cerebral blood flow and cerebral blood volume (CBV) (Lin et al, 2002). Nevertheless, the exact mechanism and the physiologic significance of cerebral blood flow and CBV increase in relation to evolution of the angiogenic process remain to be studied.
Imaging methods have been proven to be indispensable for studying angiogenesis in both laboratory and clinic (McDonald and Choyke, 2003; Weber et al, 2006). Dynamic contrast-enhanced magnetic resonance imaging (DCE-MRI), the acquisition of serial MR images before, during, and after intravenous administration of contrast agent (e.g., Gd-DTPA), has been widely employed to provide functional information on blood—brain barrier (BBB) integrity and vascular permeability in experimental stroke (Kastrup et al, 1999). Moreover, in contrast to CBV obtained from dynamic susceptibility-contrast MRI—which reflects the combined effect of the average size and density of microvessels—steady-state, contrast-enhanced MRI (SSCE-MRI) with transverse relaxation rate shift has been proposed to study the microvasculature of pathologic tissue. The gradient echo-based ΔR2* map reflects the blood volume changes in a broad range of vessel sizes, whereas the spin echo-based ΔR2 map reflects blood volume changes primarily in small vessels (e.g., capillaries and venules). These two parameters can be further derived to provide information on vessel size (ΔR2*/ΔR2) and density (ΔR2/(ΔR2*)2/3) (Boxerman et al, 1995; Dennie et al, 1998; Jensen and Chandra, 2000; Tropres et al, 2004).
Changes in vascular permeability, capillary blood volume, vascular density, and size during the evolution of postischemic angiogenesis have not been studied extensively and results to date are not conclusive. The purpose of this study was to apply the DCE- and SSCE-MRI techniques to investigate the postischemic CBV changes in relation to evolving angiogenesis over the course of 3 weeks, in a well-defined three-vessel occlusion model in the rat.
Materials and methods
Stroke Model
The rat focal cerebral ischemia—reperfusion model has been described previously (Chen et al, 1986; Lin et al, 1993). Long—Evans rats were chosen for this study based on our earlier experience with the development of this three-vessel MCA occlusion model (Chen et al, 1986). We found that Long—Evans rats showed lesser cerebrovascular variation from animal to animal and the infarct that developed after three-vessel occlusion in this strain of rats was more consistent than that in Sprague—Dawley rats. In brief, the right MCA of male Long-Evans rats was reversibly ligated under a stereomicroscope. Both common carotid arteries were then occluded using nontraumatic aneurysm clips. After 60 mins of ischemia, all arterial occlusions were released. In this model, ischemia for 60 mins produced a large infarct confined to the right MCA cortex region with an ~90% reduction in regional blood flow (Chen et al, 1986; Lin et al, 2002). While under anesthesia, the rectal temperature was maintained at 37.0°C ± 0.5°C by using a homeothermic blanket (Harvard, Holliston, MA, USA). After the ischemic insult, rats were kept in an air-ventilated incubator at 24.0°C ± 0.5°C and reperfused for up to 21 days. Arterial blood gases, mean arterial pressure, and heart rate were also monitored in selected animals before and during ischemia and for 30 mins after the initiation of reperfusion. The values were within normal ranges. The integrity of the BBB was investigated by Evans Blue extravasation at day 7 after ischemia (Belayev et al, 1996). Evans Blue (2% in saline, 4 ml/kg) was injected intravenously 2 h before perfusion. Rats were perfused with saline until a colorless perfusion fluid was noted. All the procedures were in accordance with the Public Health Service Guide Approved Procedures for the Care and Use of Laboratory Animals and approved by the Academia Sinica Institutional Animal Care and Utilization Committee.
Magnetic Resonance Imaging Experiments
Thirty-two rats were divided equally into two groups for DCE-MRI and SSCE-MRI measurements, respectively. Images (n = 4 for each time point) were acquired at 1, 3, 7, 14, and 21 days after 60 mins of transient MCA occlusion or sham operation. Owing to technical limitations, we could give up to two intravenous injections of contrast agent per rat in the present study and therefore groups day 1 and day 3 shared four rats, groups day 7 and day 14 also shared four rats, whereas group day 21 and sham group each had four rats. These made a total of 16 rats for each study.
The DCE-MRI experiment was performed in a 4.7T Biospec 47/40 spectrometer with an active shielding gradient (20 G/cm in 80 μs). The SSCE-MRI experiment was performed in a 7T Pharmascan 70/16 MR scanner with an active shielding gradient (30 G/cm in 80 μs). The rats were initially anesthetized with 5% isoflurane at 1 L/min air flow. When fully anesthetized, the animal was placed in a prone position and fitted with a custom-designed head holder inside the magnet. Isoflurane was then maintained at 1 to 1.2% at 1 L/min air flow throughout the experiments, which causes minimal cerebral hemodynamic changes. Images were acquired using a 7.2-cm bird-cage transmitter coil and a separate 2-cm quadrature surface coil for signal detection at 4.7T. Magnetic resonance imaging at 7.0 T used a 38-cm volume coil as both the transmitter and receiver coil.
Dynamic Contrast-Enhanced MRI: Measurement of Vascular Permeability (Ktrans)
Vascular permeability, Ktrans, was studied with DCE-MRI. The DCE-MRI experiment was performed using a dynamic series of 25 T1-weighted spin-echo images with a repetition time (TR) of 400 ms, an echo time (TE) of 14 ms, a field of view (FOV) of 4 cm × 4 cm, a data matrix size of 256 × 64 (zero filled to 256 × 256), a slice thickness of 1 mm, and 1 signal average (NEX). An intravenous bolus injection of 0.2 mmol/kg Gd-DTPA (Magnevist, Schering AG, Germany) was given during acquisition of the seventh image.
Steady-State, Contrast-Enhanced MRI: Assessment of ΔR2, ΔR2*, Vascular Density, and Size
ΔR2, ΔR2*, vascular density, and size were evaluated by SSCE-MRI. To determine ΔR2 and ΔR2*, T2-weighted spin-echo and T2*-weighted gradient echo pulse sequences, respectively, were performed before and after an injection of iron oxide (Feridex IV, Berlex Laboratories, Wayne, NJ, USA) at a dose of 30 mg Fe/kg. Feridex was selected because it is a true intravascular contrast agent with a long plasma half-life (T1/2 > 2.4 h) (Dubowitz et al, 2001; Moreno et al, 2006). To rule out the confounding effect of bleeding, once an animal showed a rare sign of bleeding (darkened area in the precontrast imaging), it was excluded from the study. The postcontrast image acquisition was delayed by 5 mins to ensure a steady-state distribution of contrast agent in the vascular network. T2- and T2*-weighted MR images were obtained in the same location with an FOV of 2.56 cm × 2.56 cm, matrix size of 256 × 128 (zero filled to 256 × 256), and 1-mm-thick slice. T2-weighted MRI was acquired using the RARE sequence with a TR = 4000 ms, a pseudo-echo time of 70 ms, echo-train length of 8, and NEX = 12. T2*-weighted MRI was performed using the FLASH sequence with a TR = 300 ms, TE = 13 ms, flip angle of 15°, and NEX = 16.
Data Analyses
Quantitative analysis of DCE-MRI data pixel by pixel was based on the compartmental model (Tofts and Kermode, 1991). Changes in DCE-MRI intensity in brain tissue was because of the contrast agent leaking into the brain tissue from the vasculature. The rate of contrast agent uptake can be given as dCt(t)/dt = Ktrans(Cp-Ct/ve), where Ktrans is the vascular permeability, Cp is the concentration of contrast agent in the plasma space, Ct is the concentration of contrast agent in the extravascular and extracellular space of brain tissue, and ve is the leakage space per unit volume of brain tissue. Optimal values of pharmacokinetic parameters, Ktrans and ve, for each pixel were calculated by fitting the enhancement versus time curve of the tissue signal intensity using nonlinear regression analysis. The processing software was written by Matlab (Math Works, Natick, MA, USA). Color parametric maps for showing fitting data were produced using Amira (TGS, San Diego, CA, USA).
Transverse relaxation rate changes were given by ΔR2 = ln(Spre/Spost)/TE and ΔR2* = ln[Spre*/Spost*)/TE, where Spre, Spost and Spre*, Spost* are the precontrast and postcontrast signal intensities for the spin echo and gradient echo, respectively. ΔR2 is sensitive primarily to small vessels (e.g., capillaries and venules), whereas ΔR2* is more sensitive to large vessels (Boxerman et al, 1995; Tropres et al, 2004). Vessel density and size imaging were derived, pixel by pixel, using Matlab (MathWorks), according to the ratio of relaxation rate shift ΔR2/(R2*)2/3 (or Q) and ΔR2*/ΔR2, respectively (Dennie et al, 1998; Jensen and Chandra, 2000). Region of interest is equivalent to the region of infarct as indicated in Figure 1, which applies to all the figures.
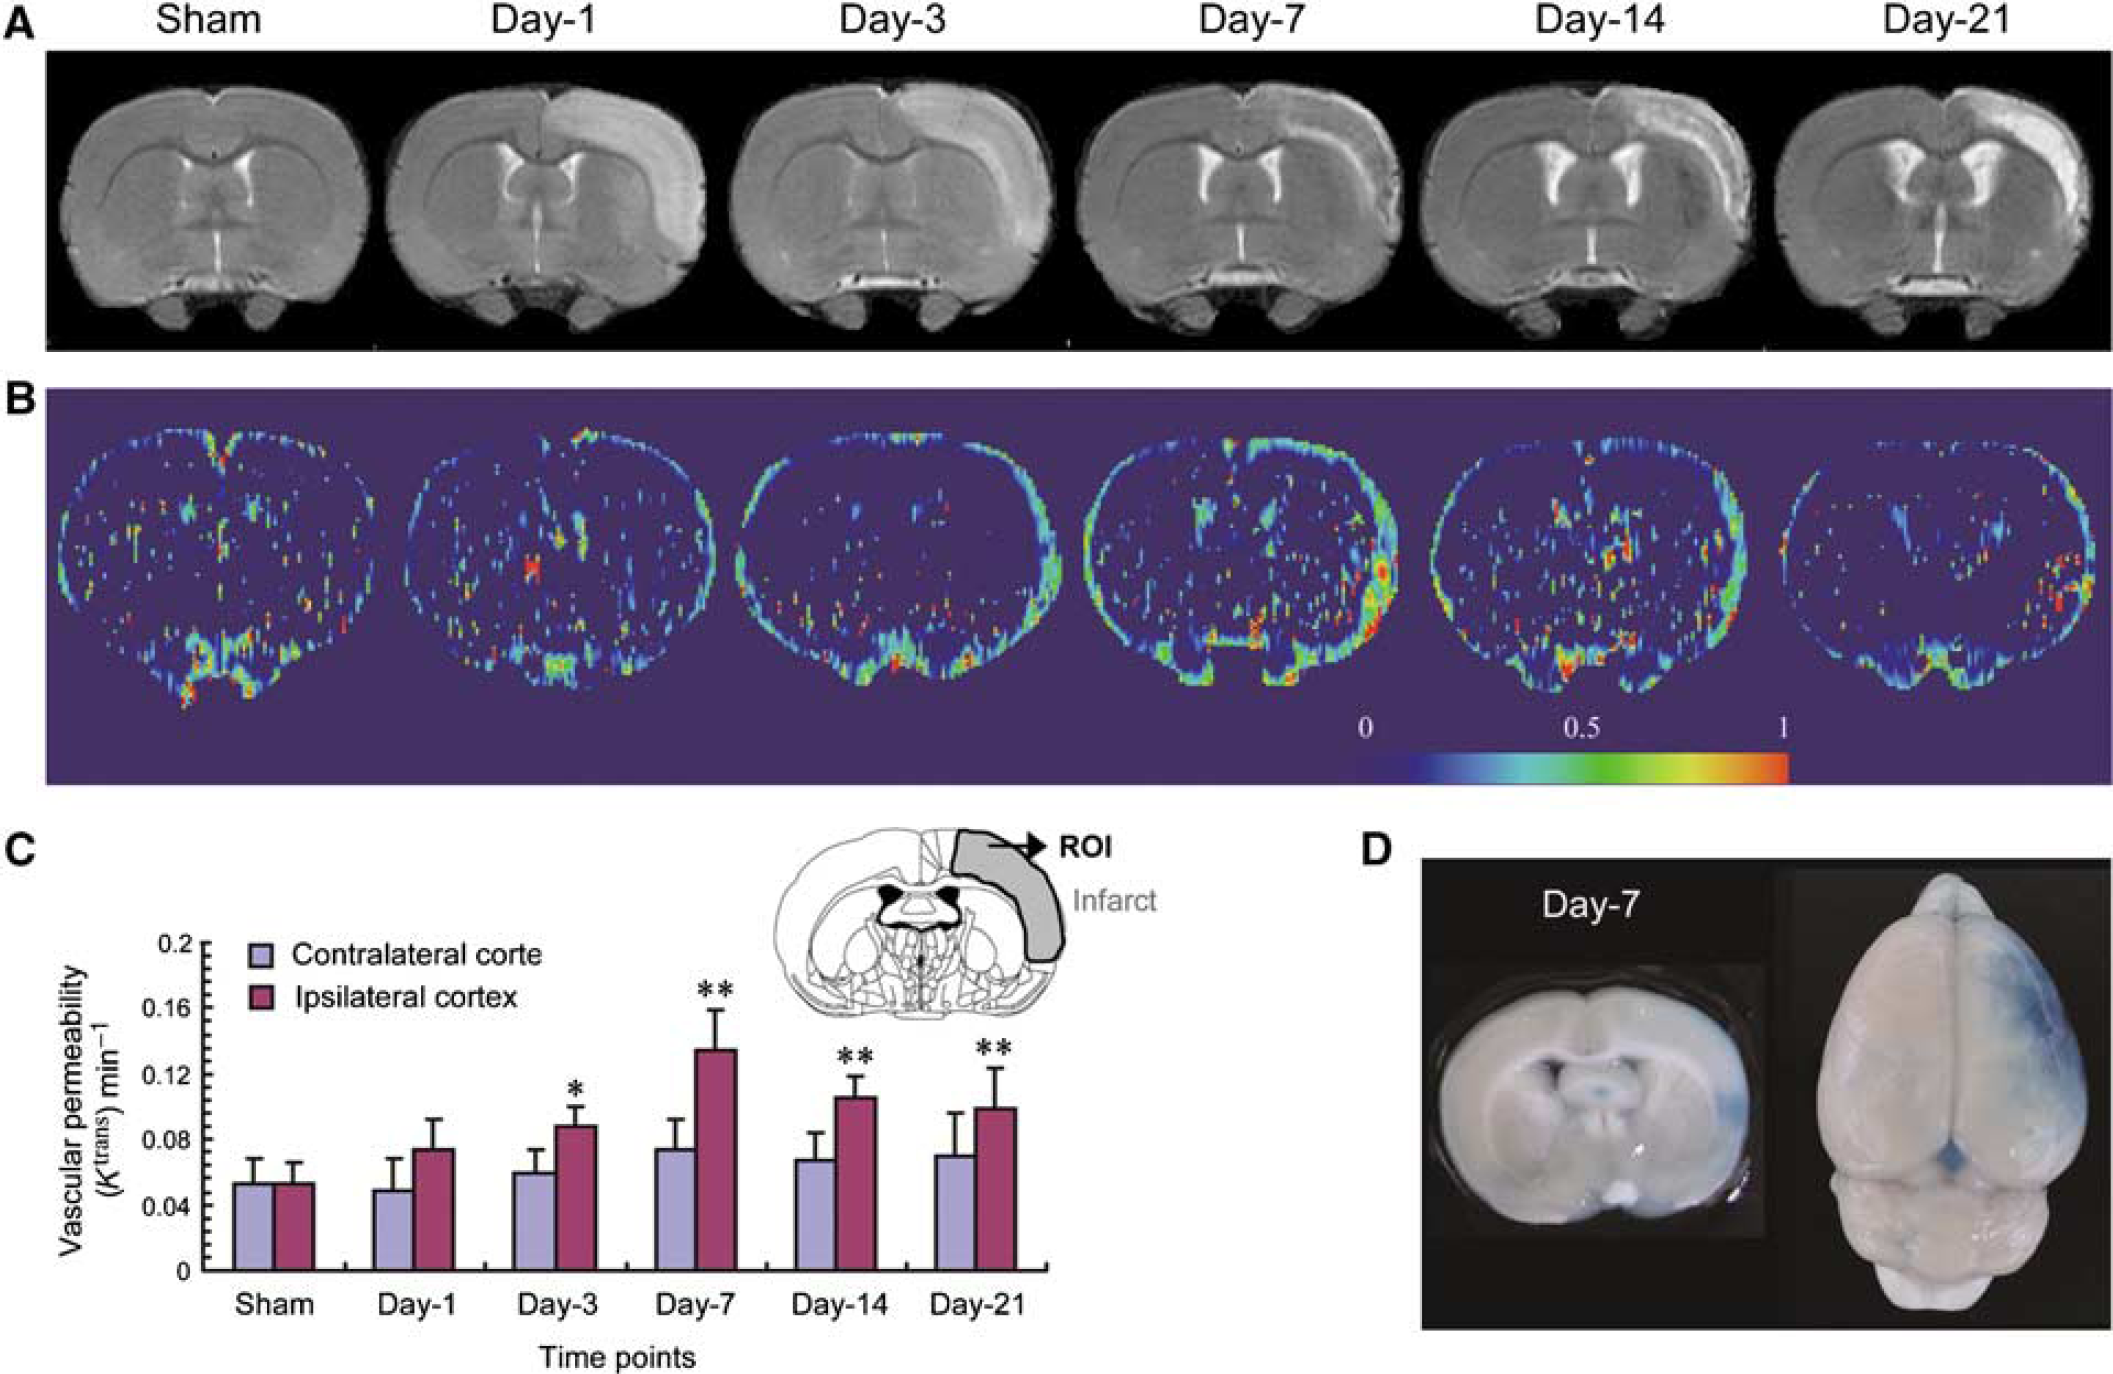
Effect of transient ischemia on vascular permeability. Rats were subjected to 60 mins transient ischemia and reperfusion for different periods of time or sham operation. (A) Representative T2-weighted imaging over time. (B) Representative parametric color maps of vascular permeability (Ktrans) over time. The color ranged from blue (0 min−1) to red (1 min−1). (C) Quantitative analysis of Ktrans over time in both contralateral (left) and ipsilateral cortex (mean ± s.d.; n = 4). (D) Representative images showing extravasation of Evans Blue at day 7 after ischemia. Differences between operated and sham-operated controls were significant at the *P < 0.05 and **P < 0.01 levels. Day-1, day-3, day-7, day-14, and day-21 represent reperfusion for 1, 3, 7, 14, and 21 days, respectively. ROI: region of interest. Magnetic resonance image of sham was from one animal, images of days 1 and 3 were from the second animal, images of days 7 and 14 were from the third animal, and the image of day 21 was from the fourth animal.
Immunohistological Analysis of Vascular Density and Size
At the end of the experiments, rats (n = 3 or 4 for density or size, respectively) were killed by transcardial perfusion with normal saline (200 mL) under chloral hydrate (360 mg/kg body weight) anesthesia followed by cold 4% paraformaldehyde. The whole brains were removed and cryoprotected in 30% sucrose at 4°C overnight. Brain slices of 25 μm thickness were permeabilized with 0.3% Triton X-100 and incubated overnight at 4°C with a rabbit anti-laminin antibody (1:50; Abcam, Cambridge, MA, USA), mouse anti-basic fibroblast growth factor (bFGF) (1:2,000; Upstate, Lake Placid, NY, USA), mouse antiendothelial nitric oxide synthase (eNOS) (1:500; Transduction, Lexington, KY, USA), or rabbit anti-vascular endothelial growth factor (VEGF) (1:100; Santa Cruz, Santa Cruz, CA, USA) followed by a biotin-labeled goat anti-rabbit (or mouse) IgG and visualized with 3–3' diaminobenzidine. Slides were washed, dehydrated, cleared in xylene, and mounted for microscopic examination (DX51; Olympus, Tokyo, Japan). Digital images were used to analyze vasculature density and size with the Metamorph imaging processing package (Universal Imaging Corporation, West Chester, PA, USA). The detailed procedures of a computerized vessel counting method have been described previously (Rieder et al, 1995).
Statistic Analysis
Data are presented as mean ± s.d. One-way analysis of variance was used to compare all the parameters at different time points followed by post hoc Fisher's protected t-tests. A P-value less than 0.05 was considered significant.
Results
Changes of Permeability (Ktrans) Over Time After Transient Ischemia
After MCA occlusion for 60 mins, postischemic lesions developed in the reperfused ipsilateral cortex as reported previously (Lin et al, 2002), which are shown by T2-weighted imaging (Figure 1A). The basal level of Ktrans was localized primarily to the leptomeninges in the sham control. Focal cerebral ischemia for 60 mins led to a gradual increase in Ktrans value in the reperfused ipsilateral cortex, in particular the leptomeninges and outer cortical layers (Figure 1B). A significant increase was observed starting from day 3 after ischemia. Quantitative analysis indicates a significant three-fold increase in Ktrans at day 7 after ischemia as compared with sham controls. Although slightly reduced, Ktrans values remained elevated up to 21 days after ischemia (Figure 1C). No significant change in Ktrans was noted in the contralateral side. This BBB leakage was further confirmed by Evans Blue extravasation at day 7 after ischemia (Figure 1D).
Relative Blood Volume Changes in Large Vessels (ΔR2*) and Small Vessels (ΔR2) Over Time
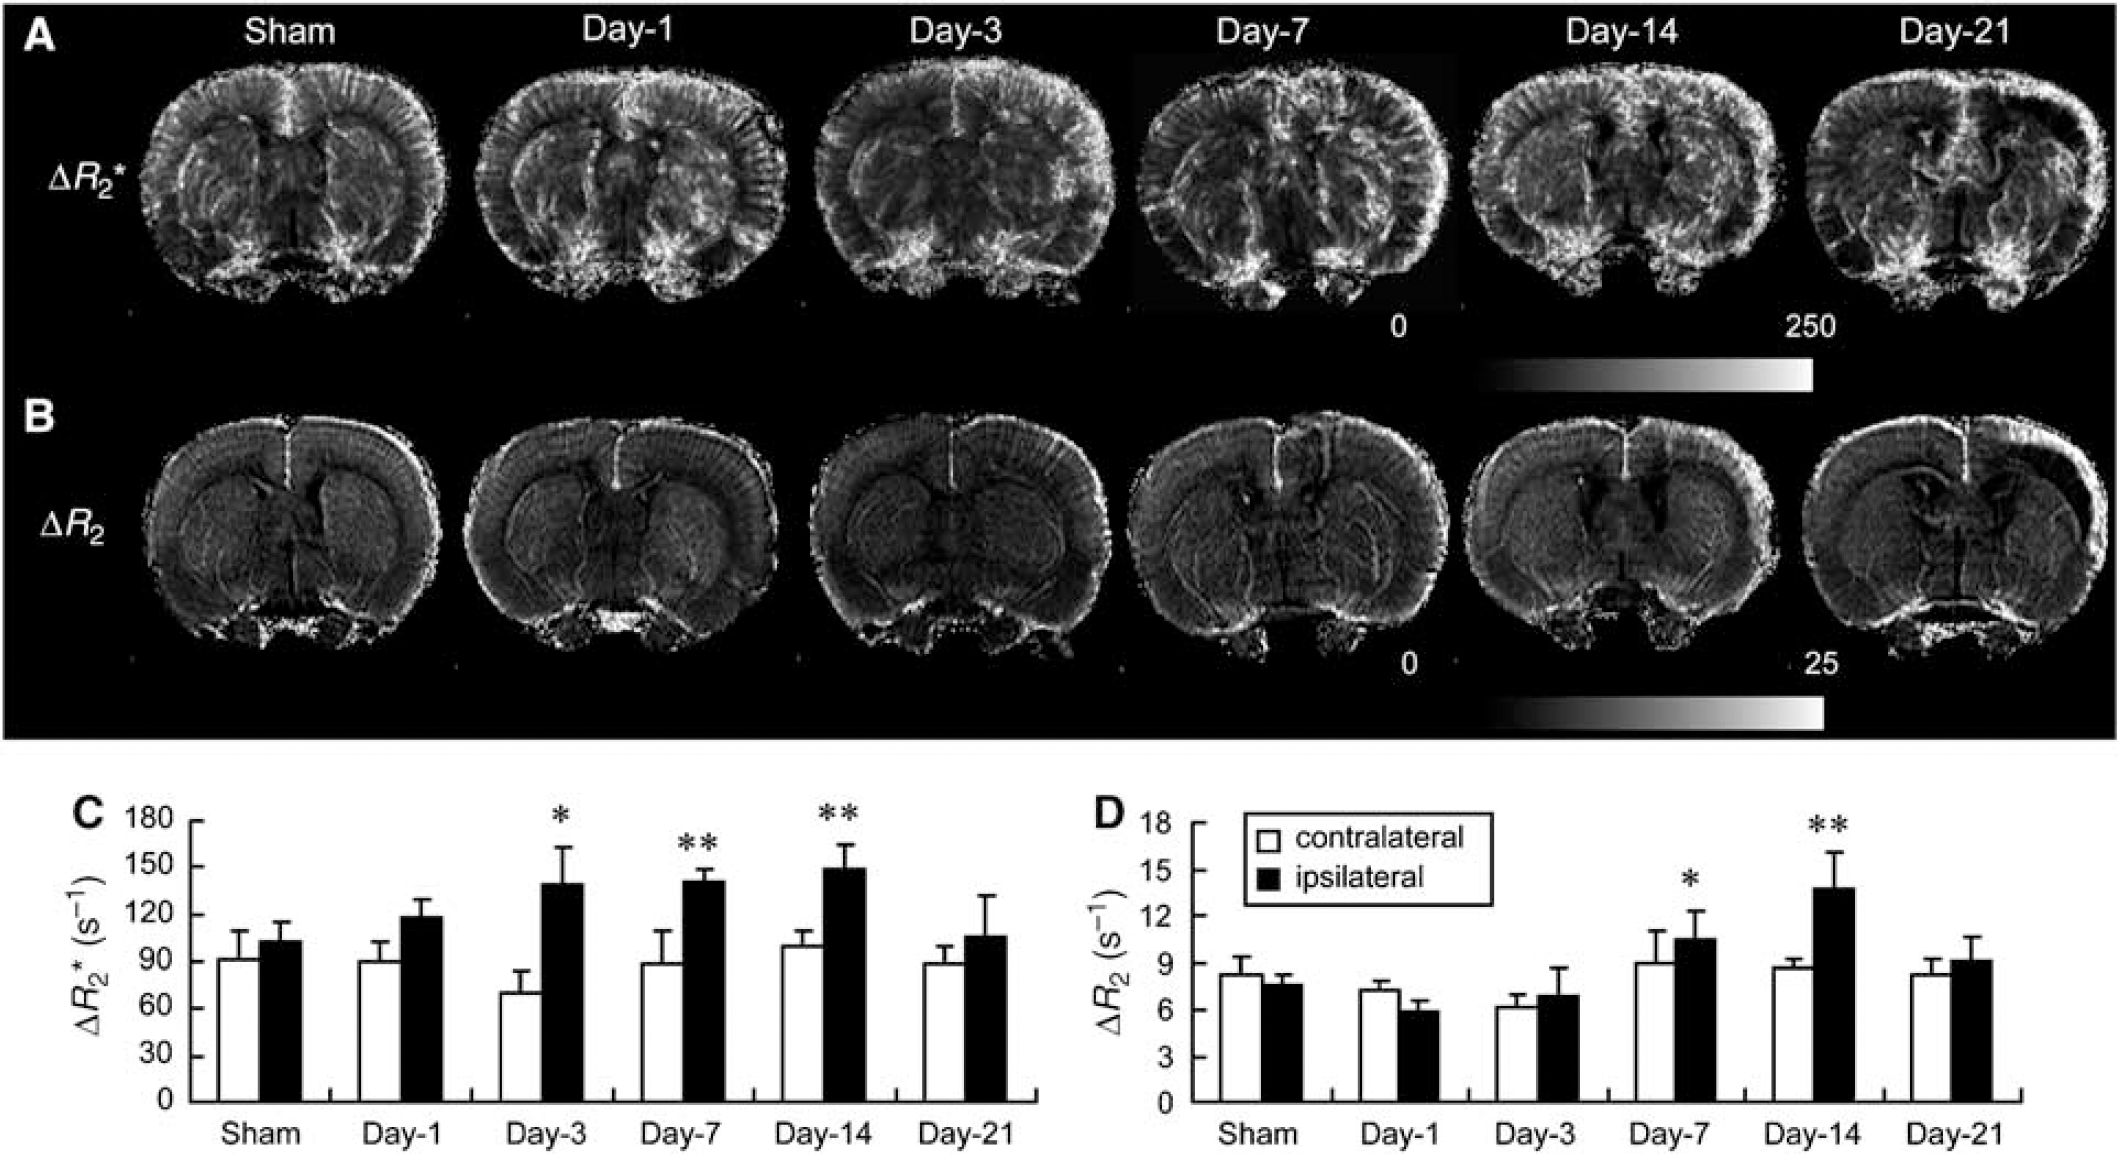
High basal levels of ΔR2* were detected throughout the cortex in the sham controls (Figure 2A). A substantial amount of signal extending from leptomeninges into the cortex was evident, suggesting arteriolar irrigation of this region. ΔR2* values in the reperfused ipsilateral cortex increased gradually over time after ischemia, in particular in the outer cortical layers and leptomeninges (Figure 2A). A significant increase was noted starting from day 3 and remained elevated up to day 14 and then declined gradually as compared with the sham controls (Figure 2C). Quantitative analysis indicates a 1.4-fold increase at the plateau. A substantial increase in ΔR2* value was also noted outside the reperfused cortex postischemia such as the frontal cortex and subcortical areas, presumably originating from the anterior cerebral and lateral/anterior striate arteries, respectively. Relatively low ΔR2 levels were noted in the cortex of the sham controls, with the highest ΔR2 level localized in the leptomeningeal region (Figure 2B). After ischemia, the ΔR2 values in the reperfused ipsilateral cortex, although not significantly reduced at day 1, gradually increased, in particular in the outer cortical layers, starting from day 7 after ischemia. Quantitative analysis indicates a significant 1.4- and 1.8-fold increase in ΔR2 values at days 7 and 14, respectively, as compared with the sham controls (Figure 2D). The very dark area in the reperfused ipsilateral cortex 21 days after ischemia was caused by tissue liquefaction (Figure 2B). No significant change in either ΔR2* or ΔR2 value was noted in the contralateral side.
Effect of transient ischemia on CBV. Rats were subjected to 60 mins transient ischemia and reperfusion for different periods of time or sham control. (A, B) Representative high-resolution transverse relaxation rate shift maps of blood volume from a broad range of vessel sizes (ΔR2*; A) and blood volume in small vessels (ΔR2; B) over time. (C, D) Quantitative analysis of ΔR2* (C) and ΔR2 (D) over time in both contralateral (left) and ipsilateral (right) cortex (mean ± s.d.; n = 4). Differences between operated and sham-operated controls were significant at the *P < 0.05 and **P < 0.01 levels. Day-1, day-3, day-7, day-14, and day-21 represent reperfusion for 1, 3, 7, 14, and 21 days, respectively. Magnetic resonance image of sham was from one animal, images of days 1 and 3 were from the second animal, images of days 7 and 14 were from the third animal, and the image of day 21 was from the fourth animal.
Relative Cerebral Vascular Density (Q) and Size (ΔR2*/ΔR2) Changes Over Time
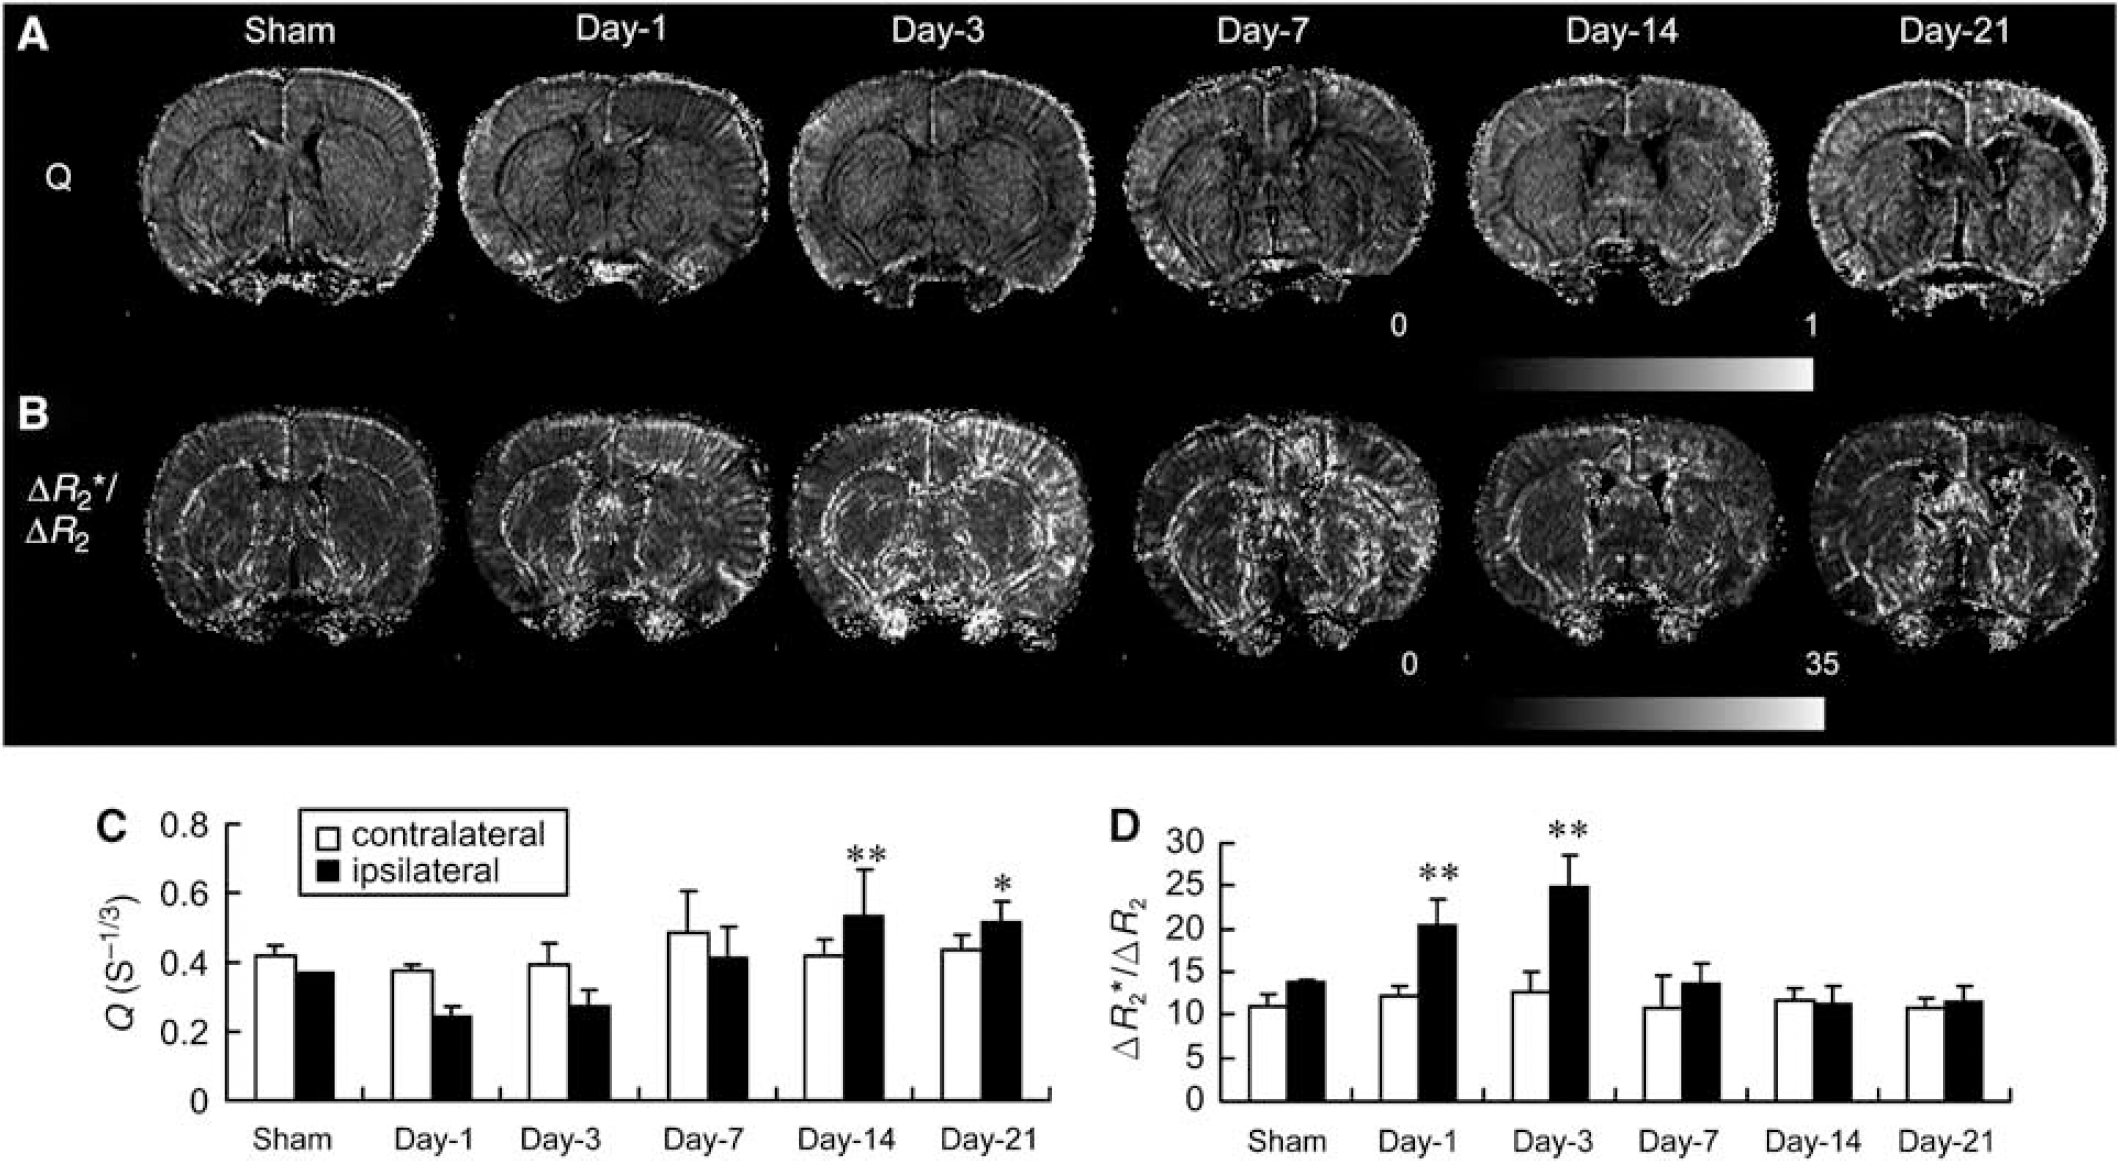
Q (or ΔR2/(ΔR2*)2/3) and ΔR2*/ΔR2 were used to further derive relative vascular density and size, respectively. Substantial values of Q were observed in the cortex of the sham controls with the highest values localized in the leptomeninges (Figure 3A). After ischemia, the Q value within the reperfused ipsilateral cortex initially decreased at days 1 and 3 and then gradually increased from day 7 to 21, mostly in the outer cortical layer and leptomeninges (Figure 3A). Quantitative analysis indicates a significant 40% decrease in Q value at day 1, but a significant 1.5-fold increase at days 14 and 21 as compared with the sham controls (Figure 3C). A substantial increase in Q values was also noted in areas surrounding the necrotic tissue (e.g., frontal cortex) at day 21 in comparison with stable low basal levels in the sham cortex (Figure 3B). After ischemia, the ΔR2*/ΔR2 values increased sharply throughout the reperfused ipsilateral cortex at day 1, reaching the peak at day 3. A large number of penetrating arteriole-like signals were readily observed in the reperfused ipsilateral cortex. ΔR2*/ΔR2 values quickly declined to basal levels at day 7, especially within the reperfused cortex/necrotic region postischemia (Figure 3B). Quantitative analysis indicated a 1.5- and 1.8-fold increase at days 1 and 3, respectively, as compared with the sham controls (Figure 3D). No significant changes in Q and ΔR2*/ΔR2 values were noted in the contralateral side.
Effect of transient ischemia on vascular density and size. Rats were subjected to 60 mins transient ischemia and reperfusion for different periods of time or sham control. Representative high-resolution relaxation rate shift maps of vascular density index (Q; A) and vessel size index (ΔR2*/ΔR2; B) over time. Quantitative analysis of Q (C) and ΔR2*/ΔR2 (D) over time in both contralateral (left) and ipsilateral (right) cortex (mean ± s.d.; n = 4). Differences between operated and sham-operated controls were significant at the *P < 0.05 and **P < 0.01 levels. Day-1, day-3, day-7, day-14, and day-21 represent reperfusion for 1, 3, 7, 14, and 21 days, respectively. Magnetic resonance image of sham was from one animal, images of days 1 and 3 were from the second animal, images of days 7 and 14 were from the third animal, and the image of day 21 was from the fourth animal.
Immunohistological Analysis of Vascular Density and Size
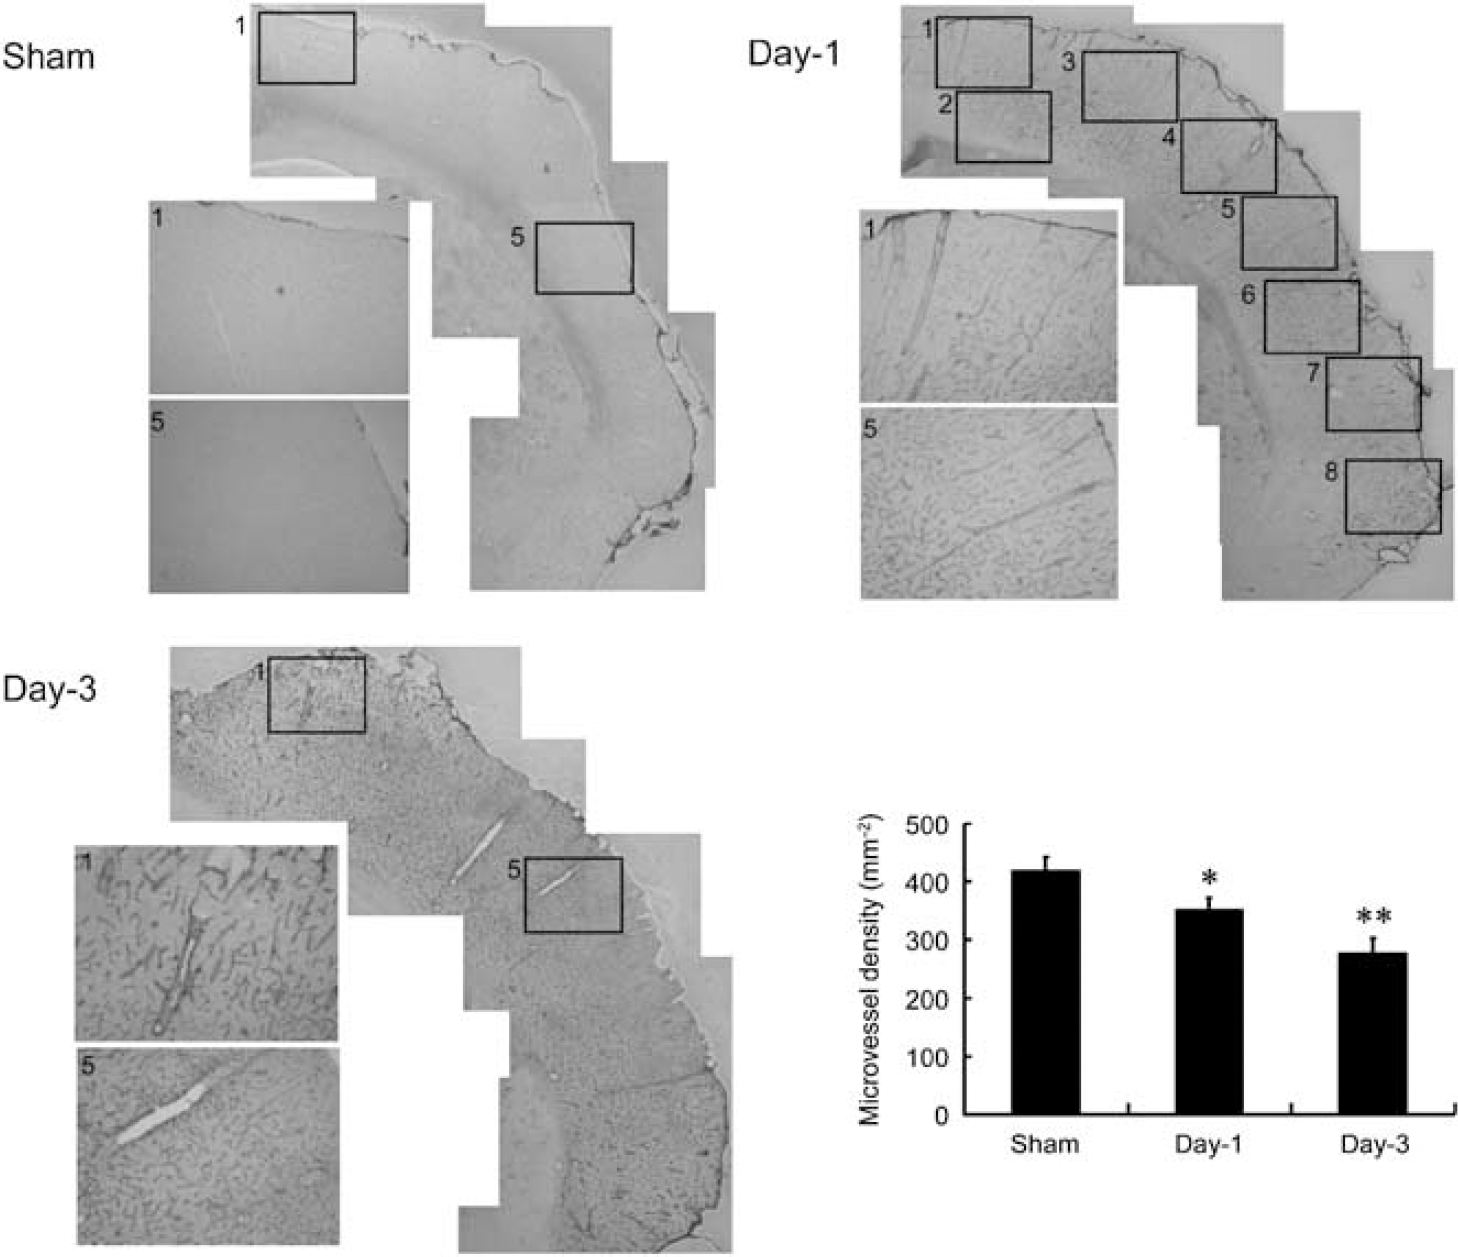
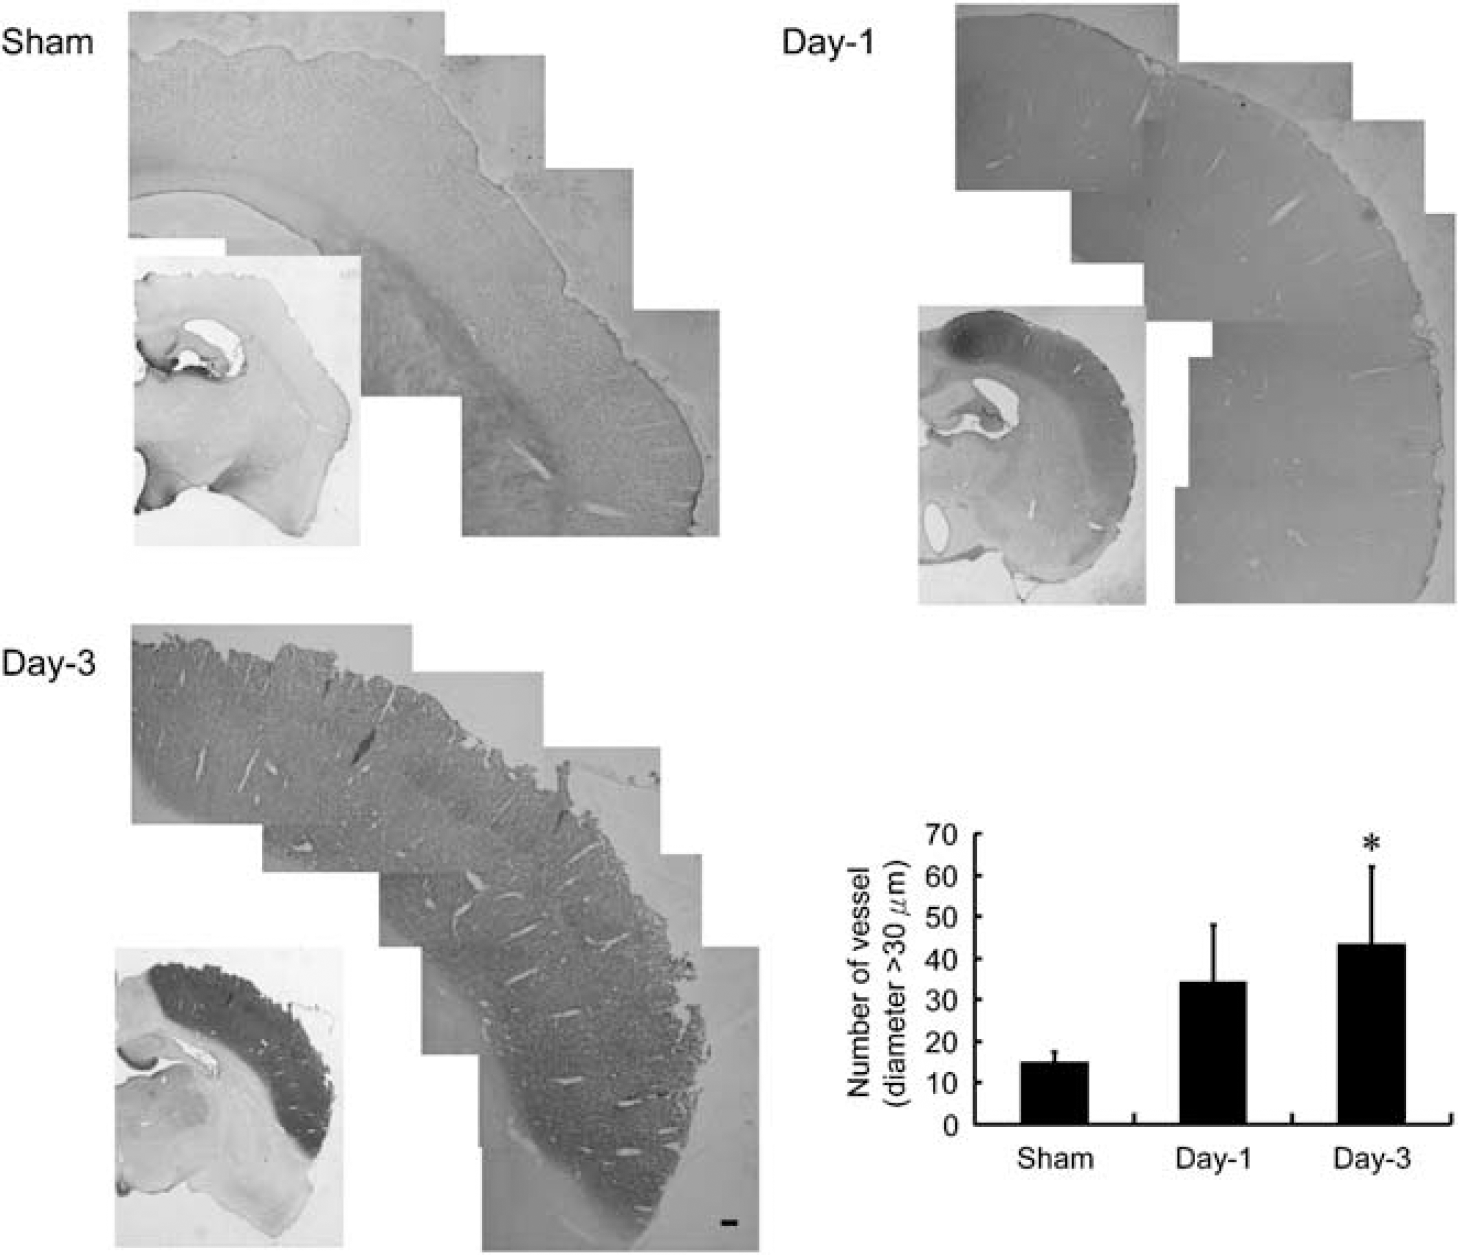
Changes in MRI-derived vascular density and size were confirmed by immunohistochemical analysis of laminin-stained microvessels in the reperfused ipsilateral cortex at days 1 and 3 in comparison with the sham-operated counterparts. Areas 1 to 8 were selected for vessel counting, and areas 1 and 5 were sampled and magnified for better visualization (Figure 4). The number of microvessels per mm2 in the ipsilateral cortex in the sham control was 420 ± 30 (equivalent to the value reported by Manoonkitiwongsa et al, 2001) and 350 ± 20 and 280 ± 30 in the reperfused cortex at days 1 and 3 after ischemia, respectively. Quantitative analysis indicates a significant 17% and 32% reduction at days 1 and 3, respectively, as compared with the sham controls (Figure 4). Conversely, only a small number of vessels with diameter greater than 30 μm were observed in the ipsilateral cortex of the sham controls (15 ± 3), but a marked increase in the number of vessels with diameter greater than 30 μm was noticed in the reperfused cortex at days 1 (30 ± 10) and 3 (40 ± 20) after ischemia. Quantitative analysis indicates a significant three-fold increase at day 3 as compared with the sham controls (Figure 5). In this study, the whole reperfused cortex area postischemia was selected for analysis.
Histologic comparison of cerebral microvessel density in ischemic and sham-operated rats. Representative microphotographs showing laminin-stained microvessels in the ipsilateral MCA cortex of rats subjected to 60 mins ischemia and reperfusion for 1 day (day-1) or 3 days (day-3) or sham control (sham). Areas 1 to 8 were selected for vessel counting. Areas 1 and 5 were sampled and magnified for better visualization. Quantitative analysis showed that microvessel density was decreased in the ischemic cortex of day-1 and day-3 rats (mean ± s.d.; n = 3). Differences between operated and sham-operated controls were significant at the *P < 0.05 and **P < 0.01 levels.
Histologic comparison of large-sized vessels (diameter > 30 μm) in ischemic and sham-operated rats. Representative microphotographs showing bFGF-stained microvessels in the MCA irrigated cortex of rats subjected to 60 mins ischemia and reperfusion for 1 day (day-1) or 3 days (day-3) or sham control (sham). The whole areas were selected for analysis. Quantitative analysis showed that the number of vessels with diameter greater than 30 μm was increased in the ischemic cortex of day-1 and day-3 rats (mean ± s.d.; n = 4). Differences between operated and sham-operated controls were significant at the *P < 0.05 and **P < 0.01 levels.
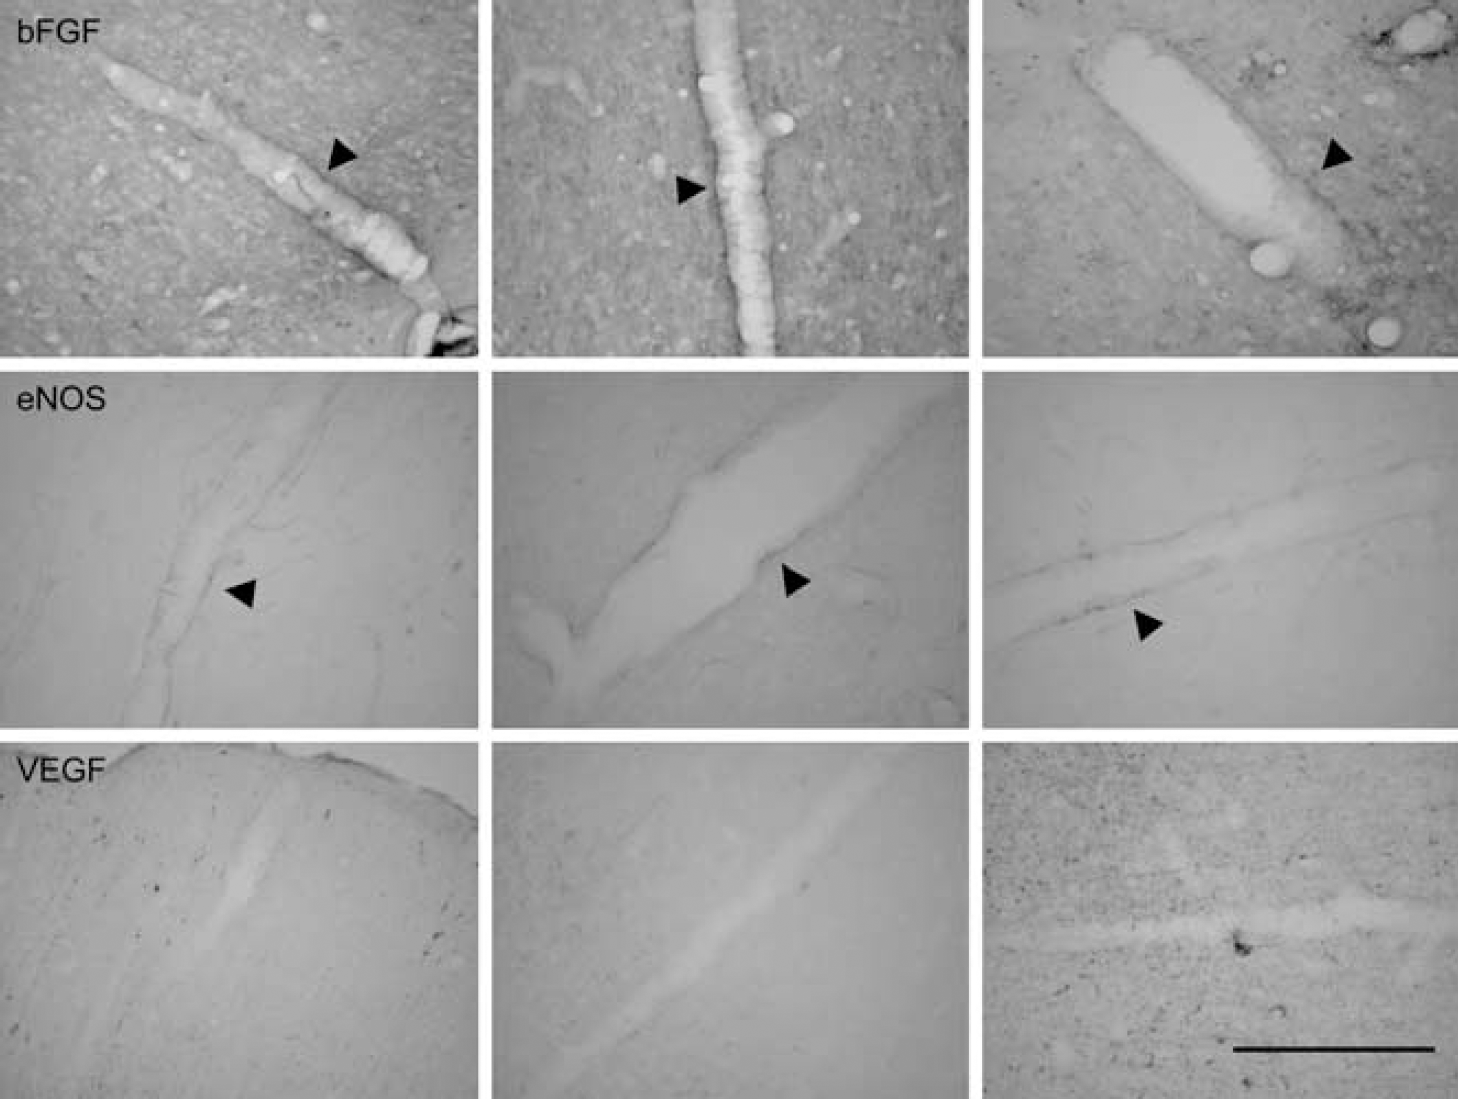
Immunohistochemical staining further revealed factors that were responsible for vessel dilatation after ischemia. In this study, coronal brain sections (25 μm) were obtained from rats subjected to 60 mins ischemia followed by 1 day of reperfusion. All the changes depicted were within the reperfused MCA cortex postischemia. The dilated large vessels exhibited bFGF and eNOS, but not VEGF, immunoreactivity in the vessel wall (Figure 6).
Immunohistochemical studies of bFGF, eNOS, and VEGF protein in the large-sized vessels of ischemic cortex. Representative microphotographs showing the staining pattern of bFGF, eNOS, and VEGF in the large-sized vessels of rats subjected to 60 mins ischemia and reperfusion for 1 day. Basic fibroblast growth factor and eNOS were stained heavily on the large-sized vessel (arrowhead), but not VEGF. Similar results were obtained in two other sets of animals. Bar = 200 μm.
Discussion
It has been reported that BBB breakdown was noted at 3 and 48 h after ischemic insult by Evans Blue extravasation (Belayev et al, 1996). In this study, we use contrast-enhanced MRI for extended monitoring of BBB integrity after transient focal cerebral ischemia. Ktrans (vascular permeability) increased gradually after ischemia peaking at day 7 and remained elevated for up to 21 days after reperfusion. The above observation was confirmed by Evans Blue extravasation. To the best of our knowledge, this is the longest in vivo monitoring of BBB integrity after ischemic insult. The mechanism and physiologic significance of the prolonged BBB leakage are not clear. It has been shown that BBB breakdown may contribute to delayed secondary tissue damage (Mun-Bryce and Rosenberg, 1998; Maier et al, 2004). One day after reperfusion, the reperfused MCA cortex postischemia showed coagulation necrosis characteristic of infarction. Histopathological changes in the reperfused MCA cortex postischemia over time have been extensively reported earlier (Chen et al, 1986; Lin et al, 1993, 2000, 2002). Therefore, it is very likely that the breakdown of extracellular matrix and tissue liquefaction could be a consequence of prolonged increase in vascular permeability. Conversely, it is also possible that this prolonged increase in vascular permeability is because of the breakdown of extracellular matrix, which led to the leakage of the existing vessels and immaturation of the newly formed capillaries. Nevertheless, BBB leakage may also provide a therapeutic opportunity for drugs that normally cannot cross the BBB. This could, at least in part, explain why pharmacological manipulation at day 7 after ischemia is still effective in modulating the infarct volume and functional recovery (Zhao et al, 2006). Although increasing vascular permeability is considered to be the most important factor for cerebral edema, we have previously shown that edema peaked at day 2 and resolved by day 5 in this model (Lin et al, 2002). This mismatch suggests the involvement of other factors in brain edema (Murakami et al, 1999; Rubin and Staddon, 1999). It is interesting to note that enhanced Ktrans values were localized in the ipsilateral leptomeninges and outer cortical layers, including reperfused cortex core and penumbra areas postischemia, where increased angiogenesis and blood volume were also observed (Lin et al, 2000, 2002; Figure 2A). Whether increasing permeability is because of leakage of the newly formed capillaries or the existing vessels deserves further investigation.
Postischemic angiogenesis and CBV increase have been well documented. However, the mechanism linking these two processes is not clear. With the newly developed SSCE-MRI protocol, we sought to distinguish CBV changes in small vessels [ΔR2), primarily capillaries, from those in vessels of a broad size range (ΔR2*) (Boxerman et al, 1995; Tropres et al, 2004). A steady increase in ΔR2* was observed in the reperfused ipsilateral cortex after transient ischemia and reached a plateau between days 3 and 14. Unexpectedly, no significant increase in ΔR2 was noted at day 3. In fact, there was a decreasing trend, although not significant, at days 1 and 3 after ischemia. The spatial profile showed that ΔR2* was observed all over the cortex in the sham control. Signals extending from leptomeninges into the cortex were noted, presumably suggesting arteriolar irrigation of the cortex (Menzies et al, 1992, Figure 4; Dorr et al, 2007, Figure 5). Transient ischemia led to a significant increase in ΔR2* throughout the reperfused ipsilateral cortex, in particular the outer cortical layers. Furthermore, an increase in ΔR2* was also noted in the subcortical areas, presumably because of an increase in collateral vascular remodeling in regions supplied by the lateral/anterior striate arteries originating from the MCA. Conversely, ΔR2 maps revealed that the majority of the enhanced ΔR2 signals were observed in the leptomeninges, and there was a trend of initial decrease in intensity within the reperfused cortex at day 1 after ischemia, which was probably caused by ischemia-induced damage/regression of the existing capillaries. At later time points, enhanced ΔR2 was localized to the outer cortical layers of the infarct, suggesting an increase in newly formed capillaries from the leptomeninges. Although subtle changes in ΔR2 values were observed in the reperfused MCA cortex at day 21 after ischemia, quantitative analysis did not show a significant increase. This may be because of the existence of a large region of liquefied tissue (the very dark area) within the region of interest, which greatly reduced the values of ΔR2. Increased ΔR2 was also noticed in the reperfused cortex margin adjacent to the necrosis core postischemia, where increased microvessel density was also reported (Manoonkitiwongsa et al, 2001). The above results suggest other factors, besides angiogenesis, may also contribute to the hemodynamic changes in CBV.
To examine whether this initial decrease in ΔR2 is because of a decrease in capillary density, we used the Q index to analyze the vascular density within the reperfused ipsilateral cortex over time (Jensen and Chandra, 2000). The Q map revealed that transient ischemia indeed led to a significant initial decrease in vascular density within the reperfused cortex at day 1 after ischemia, which was further verified by immunohistochemical vessel count. The number of microvessels per mm2 within the ipsilateral cortex of sham control was 420 ± 30, similar to the values reported by Manoonkitiwongsa et al (2001). A significant decrease in vessel number was noted at days 1 (350 ± 20) and 3 (280 ± 30). We have previously shown a 1% and 3% increase in brain volume at days 1 and 3, respectively, by MRI in this rat MCAO model (Lin et al, 2002). These vessel numbers were corrected to reduce the distortion caused by brain edema. The number after correction became 354 ± 20 at day 1 and 288 ± 30 at day 3. It was surprising to observe that the vascular density within the reperfused cortex at day 7 after ischemia was approximately the same as that in the sham control, whereas a substantial increase in vascular density was noted on the surface of the cortex (leptomeninges) from a bird's-eye view, as previously reported (Lin et al, 2000). It is very likely that angiogenesis in leptomeninges extended into the cortex. However, the increase in vascular density was diminished by an initial decrease in density at day 1. Conversely, it has been shown that penetrating arterioles are a bottleneck in perfusing the neocortex after photothrombosis (Nishimura et al, 2007). This may explain, at least in part, why vascular density is increased earlier on the cortical surface rather than within the cortex. The Q map further revealed a late increase in vascular density, which was confined predominantly to the outer cortical layers of the reperfused cortex postischemia, the same area where increased ΔR2 was noticed. The mechanism and pathophysiological significance of increasing capillaries in the liquefied area are not presently clear. Nevertheless, it has been shown by stereological measurement that an increase in microvessel density in the inner margin of cystic infarct was associated with an increase in phagocytic macrophages. This finding suggests that post-ischemic angiogenesis, besides replenishing nutrients and oxygen, may also be critical for the removal of toxic chemicals and necrotic brain tissue (Manoonkitiwongsa et al, 2001; Yu et al, 2007). It is worth noting that without this MRI system, it would be very difficult to investigate changes in vascular density in the necrotic and liquefied tissue.
Interestingly, although the vascular density (Q) was decreased at days 1 and 3, ΔR2* (or CBV) was still increased in the reperfused ipsilateral cortex. We therefore used ΔR2*/ΔR2 to further analyze the vessel size over time (Dennie et al, 1998). A marked increase in vascular diameter was noted at days 1 and 3. Similarly, brain edema cannot be the sole factor leading to this increase in vessel size. We could not rule out the possibility that brain swelling may have a more pronounced effect on compressing the small capillaries than on the large-sized vessels, leading to a shift (overestimation) in the calculated vessel sizes. The changes in vascular size over time were further confirmed by counting the immuno-histologically labeled microvessels in the same area. Large-sized vessels with a diameter greater than 30 μm were readily noted in the reperfused cortex at days 1 and 3 after ischemia, and were more in number than those derived from the sham controls. This temporal change in vessel size was very similar to that of postischemic angiogenesis observed in the leptomeninges: vascular dilation before sprouting angiogenesis (Lin et al, 2000). It is very likely that blood volume gained from vessel dilation probably overcomes the blood volume lost because of the decrease in vascular density.
It has been shown that both bFGF and eNOS cause cerebral arteriolar dilatation, leading to an increase in cerebral blood flow (Rosenblatt et al, 1994; Tanaka et al, 1995; Endres et al, 2004), and increased expression of bFGF and eNOS was observed after MCA occlusion (Speliotes et al, 1996; Lin et al, 1997; Veitkamp et al, 2002). Moreover, it has been shown that both bFGF and eNOS were highly expressed in growing collateral vessels, suggesting that bFGF and eNOS may play an important role in transforming small preexisting arteriole to a larger collateral artery, that is, arteriogenesis (Cai et al, 2004). Immunohistochemical studies further revealed that these large-sized vessels exhibited bFGF and eNOS but not VEGF immunoreactivity, indicating the activation of collateral circulation. The above results implied that postischemic CBV increase is much more complex than what was thought earlier. During the early ascending phase, it is very likely that the existing capillaries within the reperfused cortex postischemia were damaged after ischemic insult—leading to vascular regression—whereas collateral arterioles were dilated to meet the metabolic demand before tissue necrosis. Conversely, the late phase of CBV increase is likely attributed to the increasing density of small-sized vessels over the outer cortical layers of reperfused cortex postischemia as a result of angiogenesis. The results indicate that advanced perfusion-weighted MRI techniques are capable of detecting changes in vascular permeability, capillary blood volume, vascular density and size during the evolution of postischemic angiogenetic processes in the evolution of the MCA cortical infarction in vivo.
In summary, this study documents a prolonged increase in vascular permeability after transient ischemia. This was associated with postischemic angiogenesis. Although total blood volume (ΔR2*) was steadily increased after transient ischemia, there was an initial decrease in blood volume in small vessels (ΔR2) and vascular density, as well as a reciprocal increase in vascular size. At later time points, increased blood volume in small vessels and increased vascular density, but not size, were noted in the outer cortical layers of the infarcted region. Together, these findings suggest that transient ischemia led to an early damage/regression of existing vessels and a reciprocal increase in collateral circulation, which was accompanied by a late increase in angiogenesis in the reperfused cortex postischemia. This study also validates an MRI protocol for monitoring the in vivo evolution of postischemic vascular remodeling, which may be useful in assessing the efficacy of therapeutic strategies directed at angiogenesis.
Footnotes
Acknowledgements
We thank Dr Christopher H Sotak of Worcester Polytechnic Institute for critically reviewing this manuscript. We acknowledge the technical assistance from the Functional and Micro-Magnetic Resonance Imaging Center supported by the National Research Program for Genomic Medicine, National Science Council, Taiwan, ROC (NSC95-3112-B-001-009). This study was supported by grants from NSC and Academia Sinica.
The authors have no conflict of interest.
References
1.
BelayevLBustoRZhaoWGinsbergMD (1996) Quantitative evaluation of blood—brain barrier permeability following middle cerebral artery occlusion in rats. Brain Res739:88–96.
2.
BoxermanJLHambergLMRosenBRWeisskoffRM (1995) MR contrast due to intravascular magnetic susceptibility perturbations. Magn Reson Med34: 555–566.
3.
CaiWJKocsisELuoXSchaperWSchaperJ (2004) Expression of endothelial nitric oxide synthase in the vascular wall during arteriogenesis. Mol Cell Biochem264:193–200.
4.
ChenSTHsuCYHoganELMaricqHBalentineJD (1986) A model of focal ischemic stroke in the rat: reproducible extensive cortical infarction. Stroke17:738–43.
5.
DennieJMandevilleJBBoxermanJLPackardSDRosenBRWeisskoffRM (1998) NMR imaging of changes in vascular morphology due to tumor angiogenesis. Magn Reson Med40:793–9.
6.
DorrASledJGKabaniN (2007) Three-dimensional cerebral vasculature of the CBA mouse brain: a magnetic resonance imaging and micro computed tomography study. NeuroImage35:1409–23.
7.
DubowitzDJBernheimKAChenDYBradleyWGJrAndersenRA (2001) Enhancing fMRI contrast in awake-behaving primates using intravascular magnetite dextran nanopartieles. NeuroReport12:2335–40.
8.
EndresMLaufsULiaoJKMoskowitzMA (2004) Targeting eNOS for stroke protection. Trends Neurosci27:283–9.
9.
Hoehn-BerlageMNorrisDGKohnoKMiesGLeibfritzDHossmannKA (1995) Evolution of regional changes in apparent diffusion coefficient during focal ischemia of rat brain: the relationship of quantitative diffusion NMR imaging to reduction in cerebral blood flow and metabolic disturbances. J Cereb Blood Flow Metab15:1002–11.
10.
JensenJHChandraR (2000) MR imaging of microvasculature. Magn Reson Med44:224–30.
11.
KastrupAEngelhornTBeaulieuCDe CrespignyAMoseleyME (1999) Dynamics of cerebral injury, perfusion, and blood—brain barrier changes after temporary and permanent middle cerebral artery occlusion in the rat. J Neurol Sci166:91–9.
12.
KimYRHuangIJLeeSRTejimaEMandevilleJBVan MeerMPDaiGChoiYWDijkhuizenRMLoEHRosenBR (2005) Measurements of BOLD/CBV ratio show altered fMRI hemodynamics during stroke recovery in rats. J Cereb Blood Flow Metab25:820–9.
13.
KrupinskiJKaluzaJKumarPKumarSWangJM (1994) Role of angiogenesis in patients with cerebral ischemic stroke. Stroke25:1794–8.
14.
LiFHanSSTatlisumakTLiuK-FGarciaGHSotakCHFisherM (1999) Reversal of apparent diffusion coefficient and histological analysis following temporary focal brain ischemia in the rat. Ann Neurol46:333–42.
15.
LiFLiuK-FSilvaMDOmaeTSotakCHFenstermacherJDFisherM (2000) Transient and permanent resolution of ischemic lesions on diffusion-weighted imaging after brief periods of focal ischemia in rats: correlation with histopathology. Stroke31:946–53.
16.
LinTNHeYYWuGKhanMHsuCY (1993) Effect of brain edema on infarct volume in a focal cerebral ischemia model in rats. Stroke24:117–21.
17.
LinTNSunSWCheungWMLiFChangC (2002) Dynamic changes in cerebral blood flow and angiogenesis after transient focal cerebral ischemia in rats. Evaluation with serial magnetic resonance imaging. Stroke33:2985–91.
18.
LinTNTeJLeeMSunGYHsuCY (1997) Induction of basic fibroblast growth factor (bFGF) expression following focal cerebral ischemia. Mol Brain Res49:255–65.
19.
LinTNWangCKCheungWMHsuCY (2000) Induction of angiopoietin and tie receptor mRNA expression following cerebral ischemia—reperfusion. J Cereb Blood Flow Metab20:387–95.
20.
MaierCMHsiehLYuFBracciPChanPH (2004) Matrix metalloproteinase-9 and myeloperoxidase expression: quantitative analysis by antigen immunohistochemistry in a model of transient focal cerebral ischemia. Stroke35:1169–74.
21.
ManoonkitiwongsaPSJackson-FriedmanCMcMillanPJSchultzRLLydenPD (2001) Angiogenesis after stroke is correlated with increased numbers of macrophages: the clean-up hypothesis. J Cereb Blood Flow Metab21:1223–31.
22.
McDonaldDMChoykePL (2003) Imaging of angiogenesis: from microscope to clinic. Nat Med9:713–25.
23.
MenziesSAHoffJTBetzAL (1992) Middle cerebral artery occlusion in rats: a neurological and pathological evaluation of a reproducible model. Neurosurgery31:100–6.
24.
MorenoHHuaFBrownTSmallS (2006) Longitudinal mapping of mouse cerebral blood volume with MRI. NMR Biomed19:535–43.
MurakamiKKondoTYangGChenSFMorita-FujimuraYChanPH (1999) Cold injury in mice: a model to study mechanisms of brain edema and neuronal apoptosis. Prog Neurobiol57:289–99.
27.
NishimuraNSchafferCBFriedmanBLydenPDKleinfeldD (2007) Penetrating arterioles are a bottleneck in the perfusion of neocortex. Proc Natl Acad Sci USA104:365–70.
28.
PlateKH (1999) Mechanisms of angiogenesis in the brain. J Neuropathol Exp Neurol58:313–20.
29.
RiederMJO'DrobinakDMGreeneAS (1995) A computerized method for determination of microvascular density. Microvasc Res49:180–9.
RubinLLStaddonJM (1999) The cell biology of the blood—brain barrier. Annu Rev Neurosci22:11–28.
32.
SpeliotesEKCadayCGDoTWeiseJKowallNWFinklesteinSP (1996) Increased expression of basic fibroblast growth factor (bFGF) following focal cerebral infarction in the rat. Brain Res Mol Brain Res39:31–42.
33.
TanakaRMiyasakaYYadaKOhwadaTKameyaT (1995) Basic fibroblast growth factor increases regional cerebral blood flow and reduces infarct size after experimental ischemia in a rat model. Stroke26:2154–8.
34.
ToftsPSKermodeAG (1991) Measurement of the blood—brain barrier permeability and leakage space using dynamic MR imaging. 1. Fundamental concepts. Magn Reson Med17:357–67.
35.
TropresILamalleLPeoc'hMFarionRUssonYDecorpsMRemyC (2004) In vivo assessment of tumoral angiogenesis. Magn Reson Med51:533–41.
WeberRRamos-CabrerPHoehnM (2006) Present status of magnetic resonance imaging and spectroscopy in animal stroke models. J Cereb Blood Flow Metab26:591–604.
38.
YuSWFriedmanBChengQLydenPD (2007) Stroke-evoked angiogenesis results in a transient population of microvessels. J Cereb Blood Flow Metab27:755–63.
39.
ZaharchukGYamadaMSasamataMJenkinsBGMoskowitzMARosenBR (2000) Is all perfusion-weighted magnetic resonance imaging for stroke equal? The temporal evolution of multiple hemodynamic parameters after focal ischemia in rats correlated with evidence of infarction. J Cereb Blood Flow Metab20:1341–51.
40.
ZhaoBQWangSKimHYStorrieHRosenBRMooneyDJWangXLoEH (2006) Role of matrix metalloproteinases in delayed cortical responses after stroke. Nat Med12:441–5.