
Abstract
The advance of thrombolytic therapy has been hampered by the lack of optimization of the therapy during the hyperacute phase of focal ischemia. Here, we investigate neurovascular dynamics using a custom-designed hybrid electrocorticography (ECoG)-functional photoacoustic microscopy (fPAM) imaging system during the hyperacute phase (first 6 h) of photothrombotic ischemia (PTI) in male Wistar rats following recombinant tissue plasminogen activator (rtPA)-mediated thrombolysis. We reported, for the first time, the changes in neural activity and cerebral hemodynamic responses following rtPA infusion at different time points post PTI. Interestingly, very early administration of rtPA (< 1 h post PTI) resulted in only partial recovery of neurovascular dynamics (specifically, neural activity recovered to 71 ± 3.5% of baseline and hemodynamics to only 52 ± 2.6% of baseline) and late administration of rtPA (> 4 h post PTI) resulted in the deterioration of neurovascular function. A therapeutic window between 1 and 3 h post PTI was found to improve recovery of neurovascular function (i.e. significant restoration of neural activity to 93 ± 4.2% of baseline and hemodynamics to 81 ± 2.1% of baseline, respectively). The novel combination of fPAM and ECoG enables direct mapping of neurovascular dynamics and serves as a platform to evaluate potential interventions for stroke.
Keywords
Introduction
Thrombolytic therapy using recombinant tissue plasminogen activator (rtPA), the only drug that is approved by the U.S. Food and Drug Administration and available for acute ischemia treatment, is limited by a narrow clinical therapeutic time window of a maximum of 3–4.5 h following ischemia onset. 1 Although extensive research has been performed to develop alternative therapeutic interventions addressing the limitations of rtPA thrombolysis in ischemic stroke,2–5 there has been very limited success in the clinical translation of these alternatives, in a large part due to insufficient knowledge regarding the pathophysiological conditions during the hyperacute phase (i.e. the first 6 h) of stroke. 6 Hence, there is an urgent need to understand the pathophysiological dynamics during the hyperacute phase, of which neurovascular changes form a crucial part. However, it is technically challenging to record neural and vascular functions in real-time before, during, and after rtPA thrombolysis. 6
Modern imaging technologies, such as computed tomography, 7 magnetic resonance imaging8–10 and positron emission tomography,7,8 have been successfully used to investigate cerebral blood flow (CBF) and associated hemodynamic changes after stroke. Optical imaging technologies enable the monitoring of cerebral hemodynamics at much higher spatiotemporal resolution than conventional medical imaging.11,12 However, these are limited to only a modest penetration depth. 13 Importantly, all of the above-mentioned imaging modalities suffer from the inability to measure neuroelectric signals – a critical element to deepen our understanding of how neural and vascular networks or neurovascular coupling, orchestrates brain function after stroke.6,14,15
Photoacoustic (PA) imaging is an emerging optical imaging technology that provides intrinsic optical absorption (i.e. for oxy- and deoxyhemoglobin measurement), high resolution and deep tissue penetration.13,16 In this study, we further employed functional photoacoustic microscopy (fPAM) imaging to explore the changes in hemodynamic function, viz, cerebral blood volume (CBV) and hemoglobin oxygen saturation (SO2), in the ischemic region. To simultaneously probe the dynamic evolution of neural activity and hemodynamics, we integrated electrocorticography (ECoG) recording into the fPAM system (hereafter referred to as the ECoG-fPAM) to comprehensively assess neurovascular function.
The present study was designed to elucidate the dynamic evolution of neurovascular functions before, during, and after rtPA thrombolysis in a rat photothrombotic ischemia (PTI) model. Based on the currently accepted therapeutic window, we anticipated that early rtPA administration improves functional recovery but late administration (>4 h post PTI) results in poor neurovascular outcomes. To this end, focal PTI was used and we simultaneously assessed the changes in neural integrity (i.e. somatosensory evoked potentials (SSEPs), inter-hemispheric coherence, the alpha-delta ratio (ADR), and the brain symmetry index (BSI)) and hemodynamic responses (i.e. CBV and SO2) using our ECoG-fPAM system following rtPA infusion at different times post PTI. Our goal is to determine whether there is an optimal window for rtPA infusion during the hyperacute phase of PTI that would improve anatomical or functional outcomes. Importantly, we proposed to determine the role that neurovascular coupling plays during these critical phases, using simultaneous electrophysiological (ECoG) and perfusion (fPAM) imaging.
Materials and methods
The ECoG-fPAM system
As shown in Figure 1(a), the integrated ECoG-fPAM system is capable of (1) ECoG recording, (2) fPAM imaging, (3) peripheral sensory electrical stimulation and (4) focal, reproducible PTI modeling in individual cortical blood vessels. Neural activity was monitored by acquiring SSEPs and resting state (RS) ECoG signals using a bio-signal processor, while functional hemodynamic changes in selected blood vessels were evaluated using a custom-designed fPAM system. Please refer to the supplementary material for detailed information on the ECoG-fPAM system.
Overview of the experimental setup, including the recanalizable PTI model and the ECoG-fPAM system for multimodal imaging of cortical functional neurovascular changes in rats. (a) Schematic diagram of the ECoG-fPAM system consisting of (1) a focal PTI model in individual cortical blood vessels, (2) peripheral sensory electrical stimulation, (3) ECoG recording and (4) fPAM imaging. The top view of the rat skull shows the bilateral electrode placement for ECoG recordings. Ch1 and Ch2 were located in the bilateral primary motor cortical region, and Ch3–Ch6 were located in the bilateral primary somatosensory (S1FL) cortical region. The reference electrode was placed near Lambda. The time window for PTI induction in the right S1FL is marked by a blue box. For PTI induction, continuous wave laser light was applied in the dark-field optical path of the fPAM system and was focused on the selected cortical blood vessel. The black box indicates a 3 × 8 mm window for PA imaging across the bilateral S1FL centered at Bregma. PA waves were detected by a 50-MHz transducer and were processed through the A/D card to a computer for further data analysis. The interaural line (blue dotted line) served as a reference for PA imaging. Left forepaw electrical stimulation was delivered by a current stimulator driven by a neural signal processor, which also recorded the ECoG signals after amplification by a front-end amplifier. The indicated handheld digital microscope images (in the left corner of Figure 1(a) are representative of the targeted cortical blood vessel before and after PTI. The blue scale bar in the handheld digital microscope images corresponds to 100 µm. (b) Graphical representation of the process of rtPA thrombolysis. PTI produces a thrombus consisting of aggregated platelets held together by a mesh of cross-linked fibrin proteins. Further, thrombolysis is initiated upon the infusion of rtPA, which catalyzes the conversion of plasminogen to the clot-dissolving enzyme plasmin and is responsible for the degradation of fibrin, thereby leading to recanalization.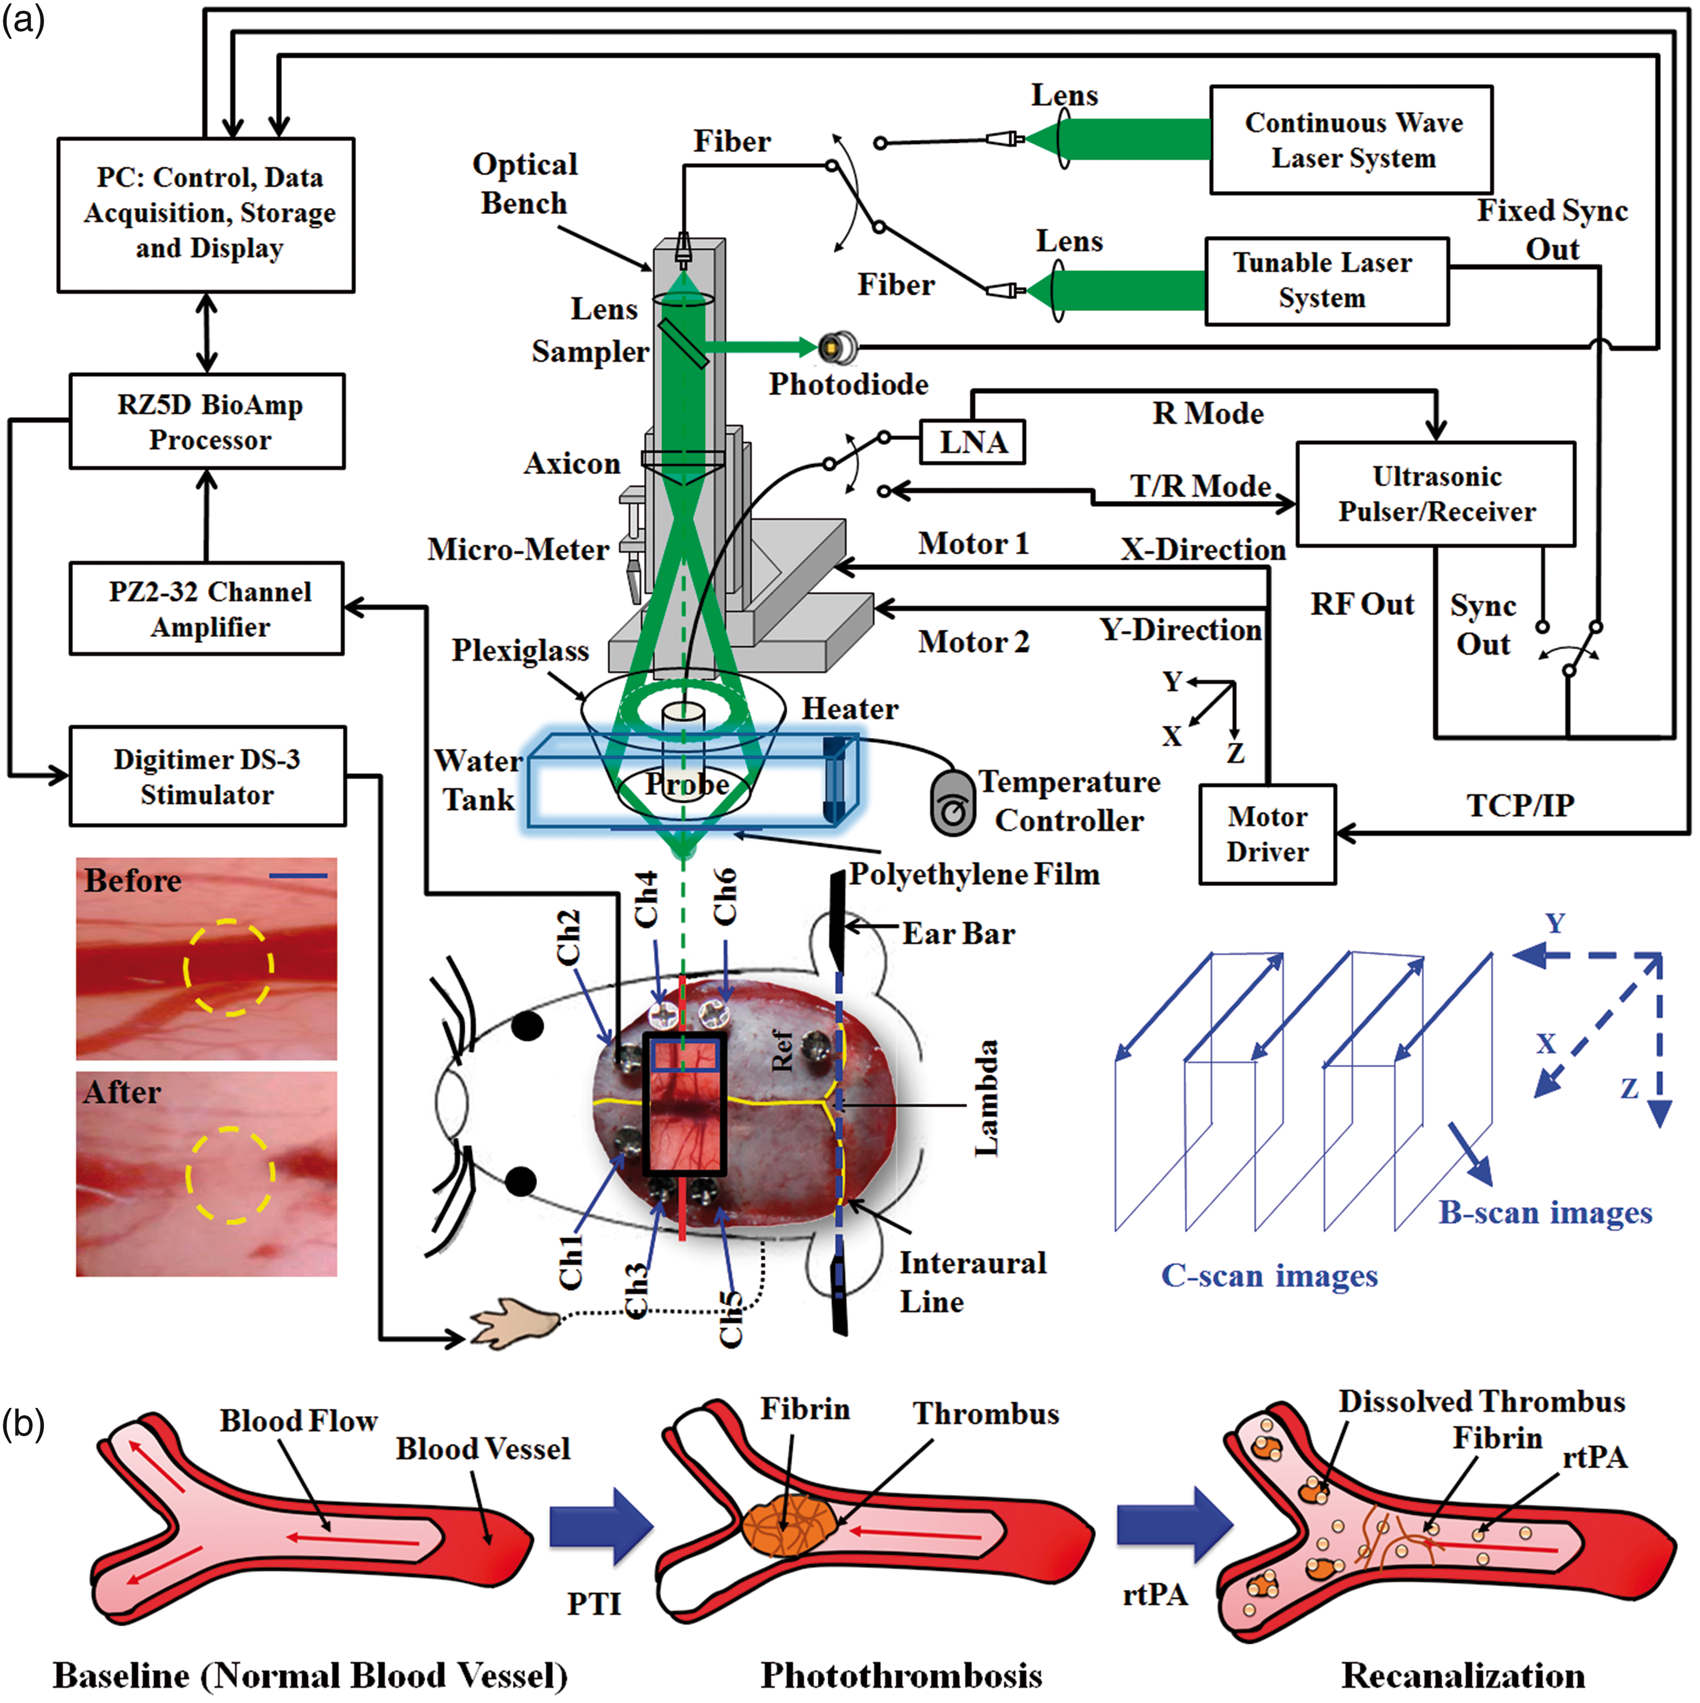
Animal preparation
Male Wistar rats weighing 250–300 g (InVivos Pte Ltd, Singapore) were used in this study. All experimental protocols used in this study were approved by the Institutional Animal Care and Use Committee (IACUC) of the National University of Singapore and the National Health Research Institute (NHRI), Taiwan, and reported in compliance with the ARRIVE guidelines. Animal care and surgical procedures were performed according to the National Advisory Committee for Laboratory Animal Research (NACLAR) guidelines for facilities licensed by the Agri-Food and Veterinary Authority of Singapore (AVA), which is the regulatory body of the Singapore Animals and Birds Act. The animals were housed at an animal care facility at constant temperature and humidity and were provided with free access to food and water. A total of 56 rats were randomly separated into 7 groups, with 8 animals in each group. The animals were separated into the 7 groups using completely randomized design (i.e., each animal was randomly assigned to a group by drawing slips of paper). Sample sizes were calculated using a priori power analysis.17,18 To diminish the occurrence of bias, the investigators were blinded by coding the experimental animals.
The animals were maintained under anesthesia using pentobarbital (50 mg/kg bolus and 15 mg/kg/h maintenance, intraperitoneal) throughout the experiments. The rats were mounted on a custom-made acrylic stereotaxic head frame to reduce motion artifacts. Body temperature was measured using a rectal probe and was maintained at 37 ± 0.5℃ by an auto-regulating thermal plate (TCAT-2 Temperature Controller, Physitemp Instruments, Inc., Clifton, New Jersey, USA). RS ECoG and SSEP recordings were acquired using six stainless steel epidural electrodes that were secured to the skull bilaterally over the primary motor and somatosensory cortical regions and a cranial window was fashioned to facilitate PA imaging and PTI induction (Figure 1(a)). Focal ischemia was induced using the photothrombosis technique on a targeted cortical arteriole that was a distal branch of the middle cerebral artery, as described in the supplementary material.
Peripheral sensory electrical stimulation was applied to evoke neurovascular responses in the ischemic cortical region
19
via subdermal needle electrodes inserted into the rat’s left forepaw (contralateral to the occlusion). A monophasic constant current of 2-mA intensity with a 0.2-ms pulse width at a frequency of 3 Hz and a 5-s stimulation duration was used for each block, as shown in Figure 2(a).
Protocol for ECoG-fPAM imaging and left forepaw electrical stimulation to elicit evoked neural and hemodynamic responses to evaluate cerebral neurovascular changes over the monitoring period. (a) Schematic of the experimental protocol illustrating the 7-min block, including left forepaw stimulation, ECoG recording and PA imaging intervals. The RS ECoG recording was followed by the SSEP recording, which was recorded simultaneously with the first “Stimulation-ON” phase 1 (St1), consisting of a constant pulse width of 0.2 ms, a 3-Hz pulse train and a pulse amplitude of 2 mA. “Stimulation-ON” phase 2 (St2) corresponds to a 5-s stimulation administered to evoke hemodynamic responses for PA imaging. (b) rtPA treatment scheme for the control group and experimental groups A–F, where rtPA was infused at varying onset times post PTI, i.e. 0.5, 1, 2, 3, 4 and 5 h, respectively. The control group received a saline infusion at 0.5 h, the same time point of rtPA administration in group A. The baseline and post-PTI recording blocks (RS, St1, SSEP, St2 and PA) are also indicated. Histological quantification of the infarct volume via TTC staining was performed 24 h post PTI induction.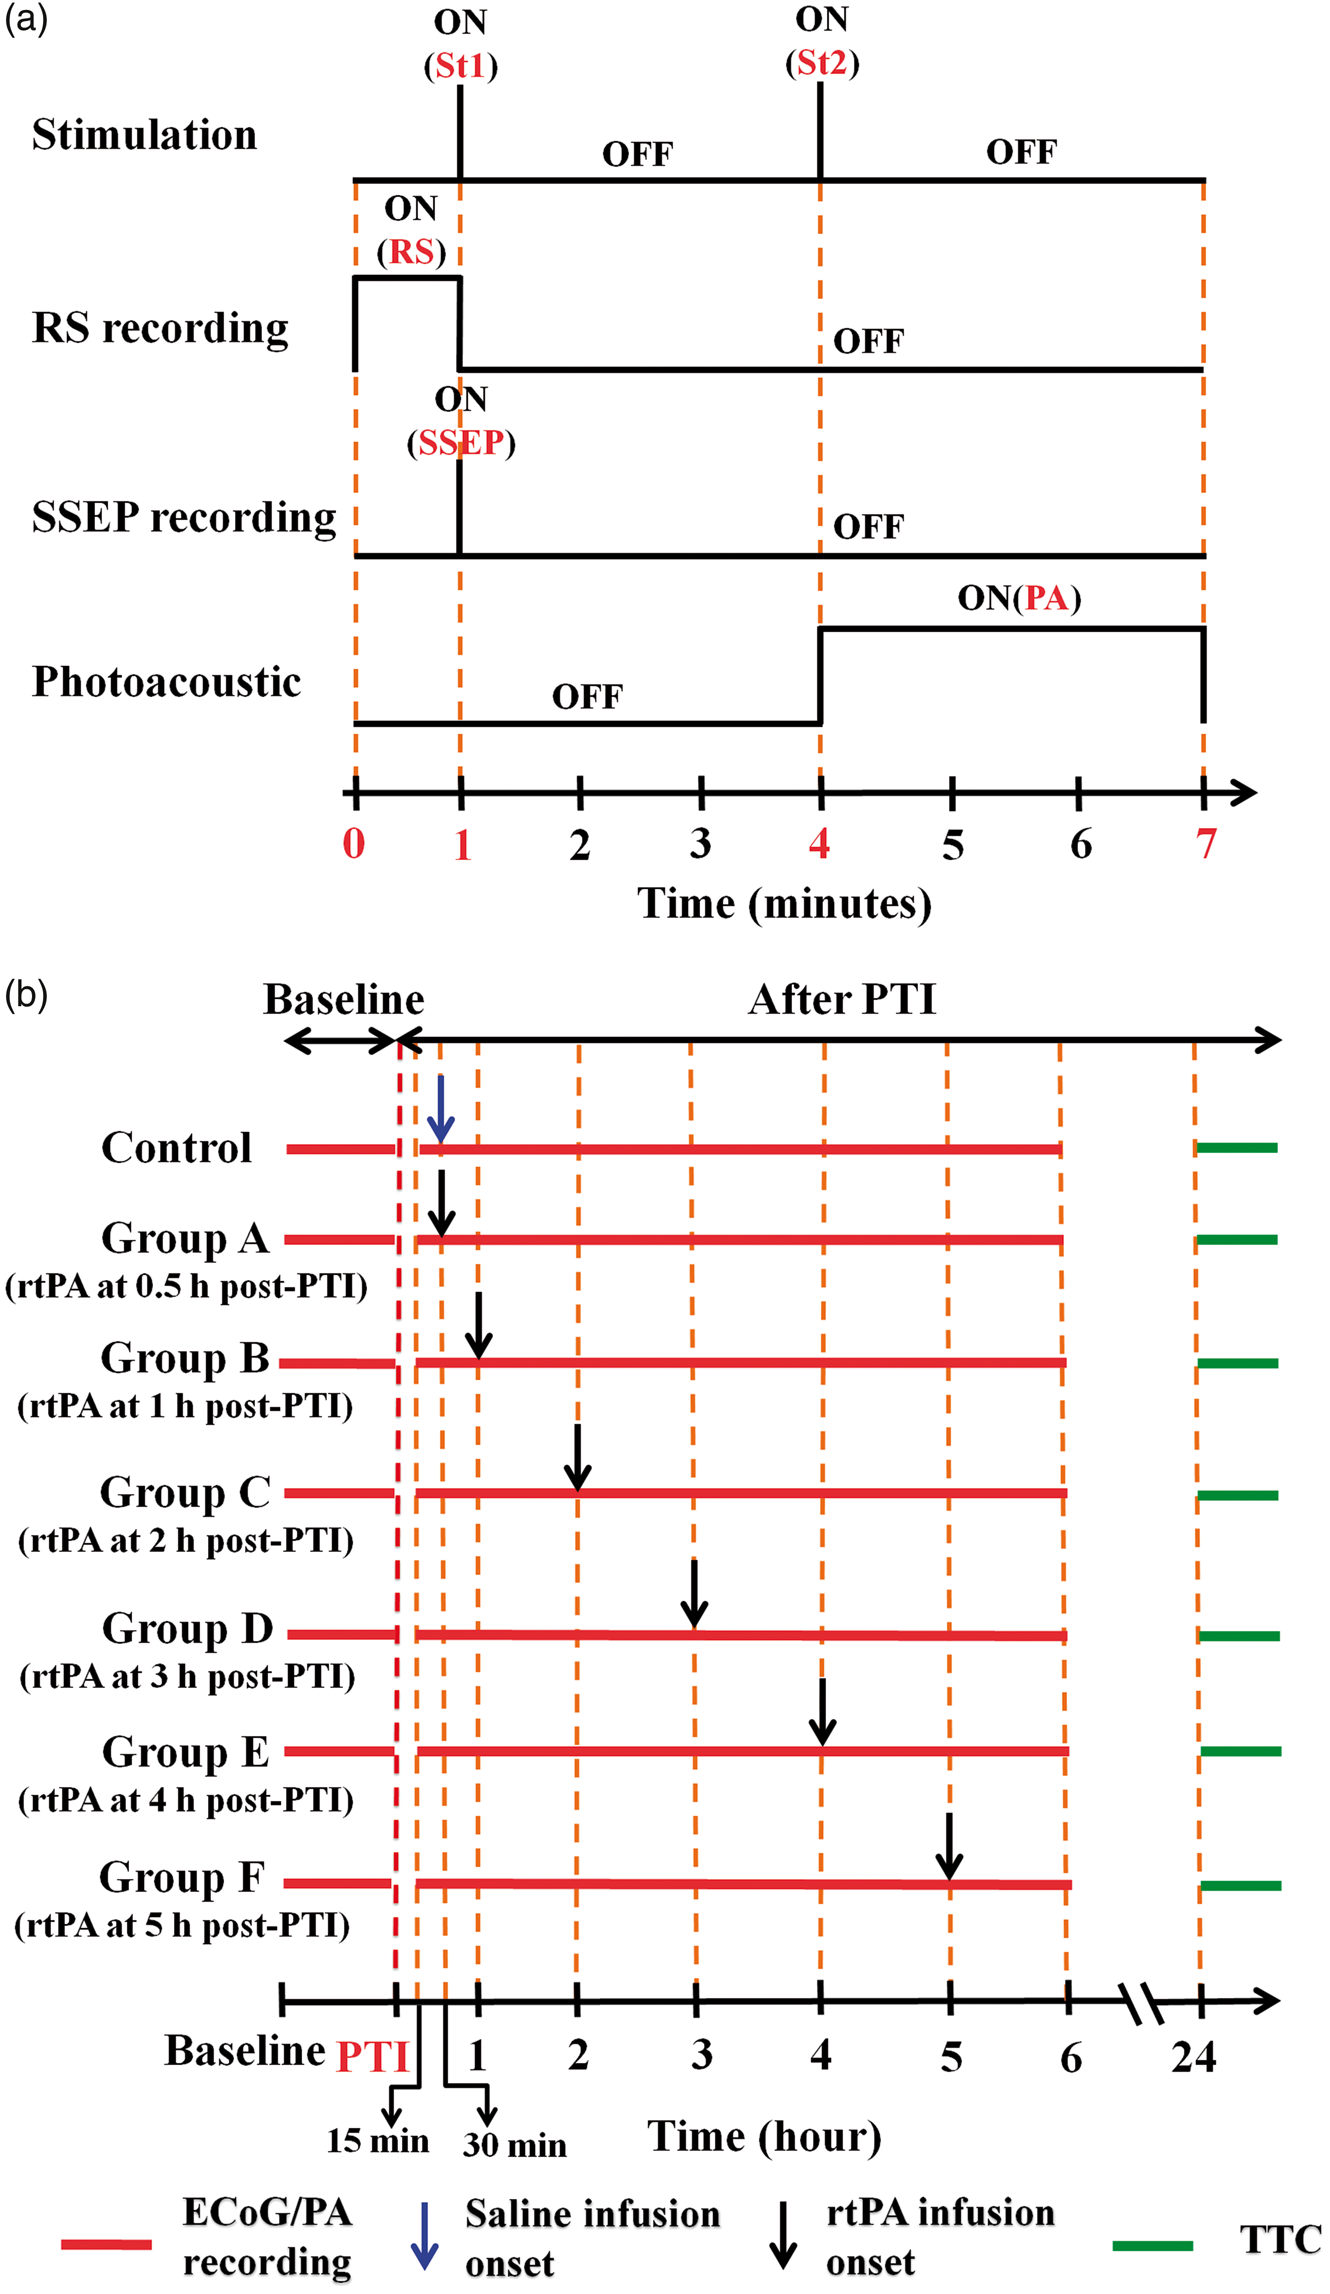
Reperfusion in the PTI model was performed via rtPA thrombolysis (Figure 1(b)). Administration of rtPA (10 mg/kg, Actilyse, Boehringer Ingelheim, Singapore; dissolved in 2 ml of distilled water) was achieved via tail vein infusion (10% bolus, 90% infusion) over a duration of 30 min using an intravenous cannula (Introcan Safety-W PUR 24G, B. Braun, Singapore) to ensure complete administration of the drug. 20 Following PTI induction, the animals were randomly assigned to one of the experimental groups with rtPA administration at varying infusion-onset times as shown in Figure 2(b): 0.5 h following PTI induction (group A), 1 h post PTI induction (group B), 2 h post PTI induction (group C), 3 h post PTI induction (group D), 4 h post PTI induction (group E) and 5 h post PTI induction (group F). The control group underwent PTI induction and received the same dose of saline (i.e., 2 ml infused over 30 min beginning at 0.5 h post PTI). 20 No animals died of natural causes before the completion of the time points, and none required humane euthanization by the researchers.
Data analysis
The changes in neural activity post PTI were evaluated based on electrophysiological recordings including SSEP and RS ECoG as described previously. 19 SSEP components such as the P1 (i.e. the first positive peak after forepaw stimulation), N1 (i.e. the first negative peak directly following P1) and peak (P1)-to-peak (N1) (P-P) amplitudes were extracted to verify the successful induction of PTI, (as indicated by significantly diminished SSEP after PTI onset), and to compare the evoked responses induced by forepaw electrical stimulation before and after PTI. 19 In addition to the evaluation of evoked neural activity, the variations in the RS ECoG signal across the ischemic and non-ischemic cortical regions were assessed based on the analyses of spectral measures (i.e. ADR and BSI) and inter-hemispheric coherence.21–23
Two optimized wavelengths (λ560 and λ570) were used to monitor functional hemodynamic changes. 24 Note that we assumed that CBV is proportional to the specific cortical region imaged at λ570 (i.e., IR(570)). 25 Therefore, PA cross-sectional B-scan images of specific cortical regions captured at λ570 (i.e. IR(570)) were used. Please refer to our previous studies for additional details concerning the data analysis of the functional hemodynamic changes.14,26
Henceforth, throughout this article, neural integrity collectively refers to SSEP, inter-hemispheric coherence, the ADR and the BSI, and hemodynamic response refers to CBV and SO2. Please refer to supplementary material for details on analysis of neural integrity and hemodynamic response, and criteria for determination of rtPA therapeutic time window.
Measurement of the infarct volume
Histological quantification of the extent of infarction was performed using 2, 3, 5-triphenyl-tetrazolium chloride (TTC, T8877, Sigma-Aldrich, Singapore). The extent of ischemic infarction was traced, and the integrated volume was calculated using ImageJ software (NIH Image). The infarct volume was corrected for brain edema and expressed as a % of the contralateral hemisphere. Please refer to supplementary material for details on infarct measurement.
Statistical analysis
Our preliminary data indicated that the infarct size at 30 min post PTI was about 60% of control. Using a within-group S.D. of 20%, the anticipated effect size was estimated to be 2.42 (Cohen’s d). Therefore, using a desired statistical power level of 80% and a probability level p for significance at 0.05, we obtain a minimum sample size of 8 for two-tailed t-test. Therefore, we used n = 8 for all groups in this experiment. Further, the experiments were designed to quantitatively measure PA signals (i.e. IR (570) and IF(560)) and corresponding changes in neural activity. Statistical significance was assessed using a paired t-test, and significance was defined as a probability (p) value of less than 0.05. Case-to-case differences in the averaged PA signals in the examined areas and the changes in the cross-sectional areas (i.e. relative hemodynamic response changes) were examined using paired t-tests (p < 0.05, n = 8). The significance of the observed differences in the averaged PA signals of the examined areas in response to left-forepaw electrical stimulation was analyzed using the Wilcoxon matched-pairs signed-rank test (two-tailed, p < 0.05, n = 8). 24 The changes in neural activity between different brain areas and between cases were assessed using repeated-measures ANOVA followed by Fisher’s least significant difference test for post hoc analysis. 27 Differences in infarct volume across groups were compared using the one-way ANOVA with Tukey correction. A probability value of p < 0.05 was used as the criterion to determine the statistical significance. All statistical analyses were performed using SPSS software (version 10.0, IBM, Armonk, New York, USA). The data are presented as the mean ± S.D.
Results
Changes in SSEPs in response to rtPA thrombolysis post PTI
The percent changes in the SSEP parameters before and after PTI onset in different experimental groups are shown in Figure 3. All SSEP evaluations were based on data from Ch4, which was located in iS1FL (primary somatosensory cortex forelimb region (S1FL) of the right hemisphere), in close proximity to the targeted PTI location. Repeated-measures ANOVA indicated that the SSEP amplitude in the 7 groups at represented time points examined (interaction effect, P1 amplitude: F = 15.741, p < 0.05, and N1 amplitude: F = 9.657, p < 0.05). However, post hoc analysis did not yield any significant change in the P1 or N1 amplitude across groups at the baseline time point (p > 0.05). Following PTI onset, the P1 amplitudes of all groups significantly decreased to 60 ± 3.0% of baseline (p < 0.05, compared to baseline), as shown in Figure 3(b). Following rtPA administration at 1 h (group B), 2 h (group C) or 3 h (group D) post PTI, the P1 amplitude at 6 h was significantly increased to 110 ± 5.2%, 110 ± 5.0% and 90 ± 4.5% of baseline, respectively. In contrast, the P1 amplitudes in groups A, E and F significantly decreased at 6 h (Figure 3(b)). The decreasing trend in the P1 amplitude in groups A, E, and F was similar to the control group, in which the P1 amplitude at 6 h post PTI was reduced to 50 ± 2.5% of baseline. Similar to the P1 amplitude, the N1 amplitude decreased immediately after PTI onset to approximately 51 ± 2.6% of baseline in all of the groups (Figure 3(c)). A significant recovery in the N1 amplitude was observed at 6 h post PTI in groups A–D (p < 0.05, compared to the N1 amplitude at PTI onset). The N1 amplitude in the control group decreased to 43 ± 2.2% of baseline at the end of the monitoring period (p < 0.05), and a further decrease in these values was observed in groups E and F (by 95 ± 1.0% and 78 ± 4.3% relative to baseline, respectively) (p < 0.05, compared to baseline). The changes in P–P amplitude followed the same pattern as the P1 and N1 amplitudes. An initial decrease in the P–P amplitude by 54 ± 3.1% relative to baseline was observed at PTI onset in all experimental groups, as shown in Figure 3(d). At 6 h post PTI, a substantial increase in the P-P amplitude was observed in groups B–D (10 ± 0.5%, 10 ± 0.2% and 10 ± 0.5% greater than baseline (p > 0.05, compared to baseline). Interestingly, only slight decreases in the P–P amplitude were observed in group A (by 47 ± 2.6% relative to baseline), in which the rtPA infusion onset time was 0.5 h post PTI, and in the control group (to 43 ± 2.2% of baseline).
Illustration of the trends in the SSEP waveforms parameters in iS1FL at baseline and over the 6 h monitoring period post PTI following rtPA administration at various infusion onset times. (a) Trends of the changes in the SSEP waveforms from baseline throughout the 6 h monitoring period post PTI. The green boxes indicate effective recovery of SSEPs, whereas the blue and red boxes indicate deteriorating trends in the SSEP waveforms. The normalized changes in the SSEP parameters of the (b) P1 amplitude, (c) N1 amplitude and (d) P–P amplitude in different experimental groups are shown. In groups B–D, the P–P amplitude of SSEPs continually recovered during treatment when rtPA was infused at 1, 2 or 3 h following PTI onset, whereas thrombolysis initiated at or beyond 4 h post PTI was not beneficial for recovery of neural activity (groups E and F).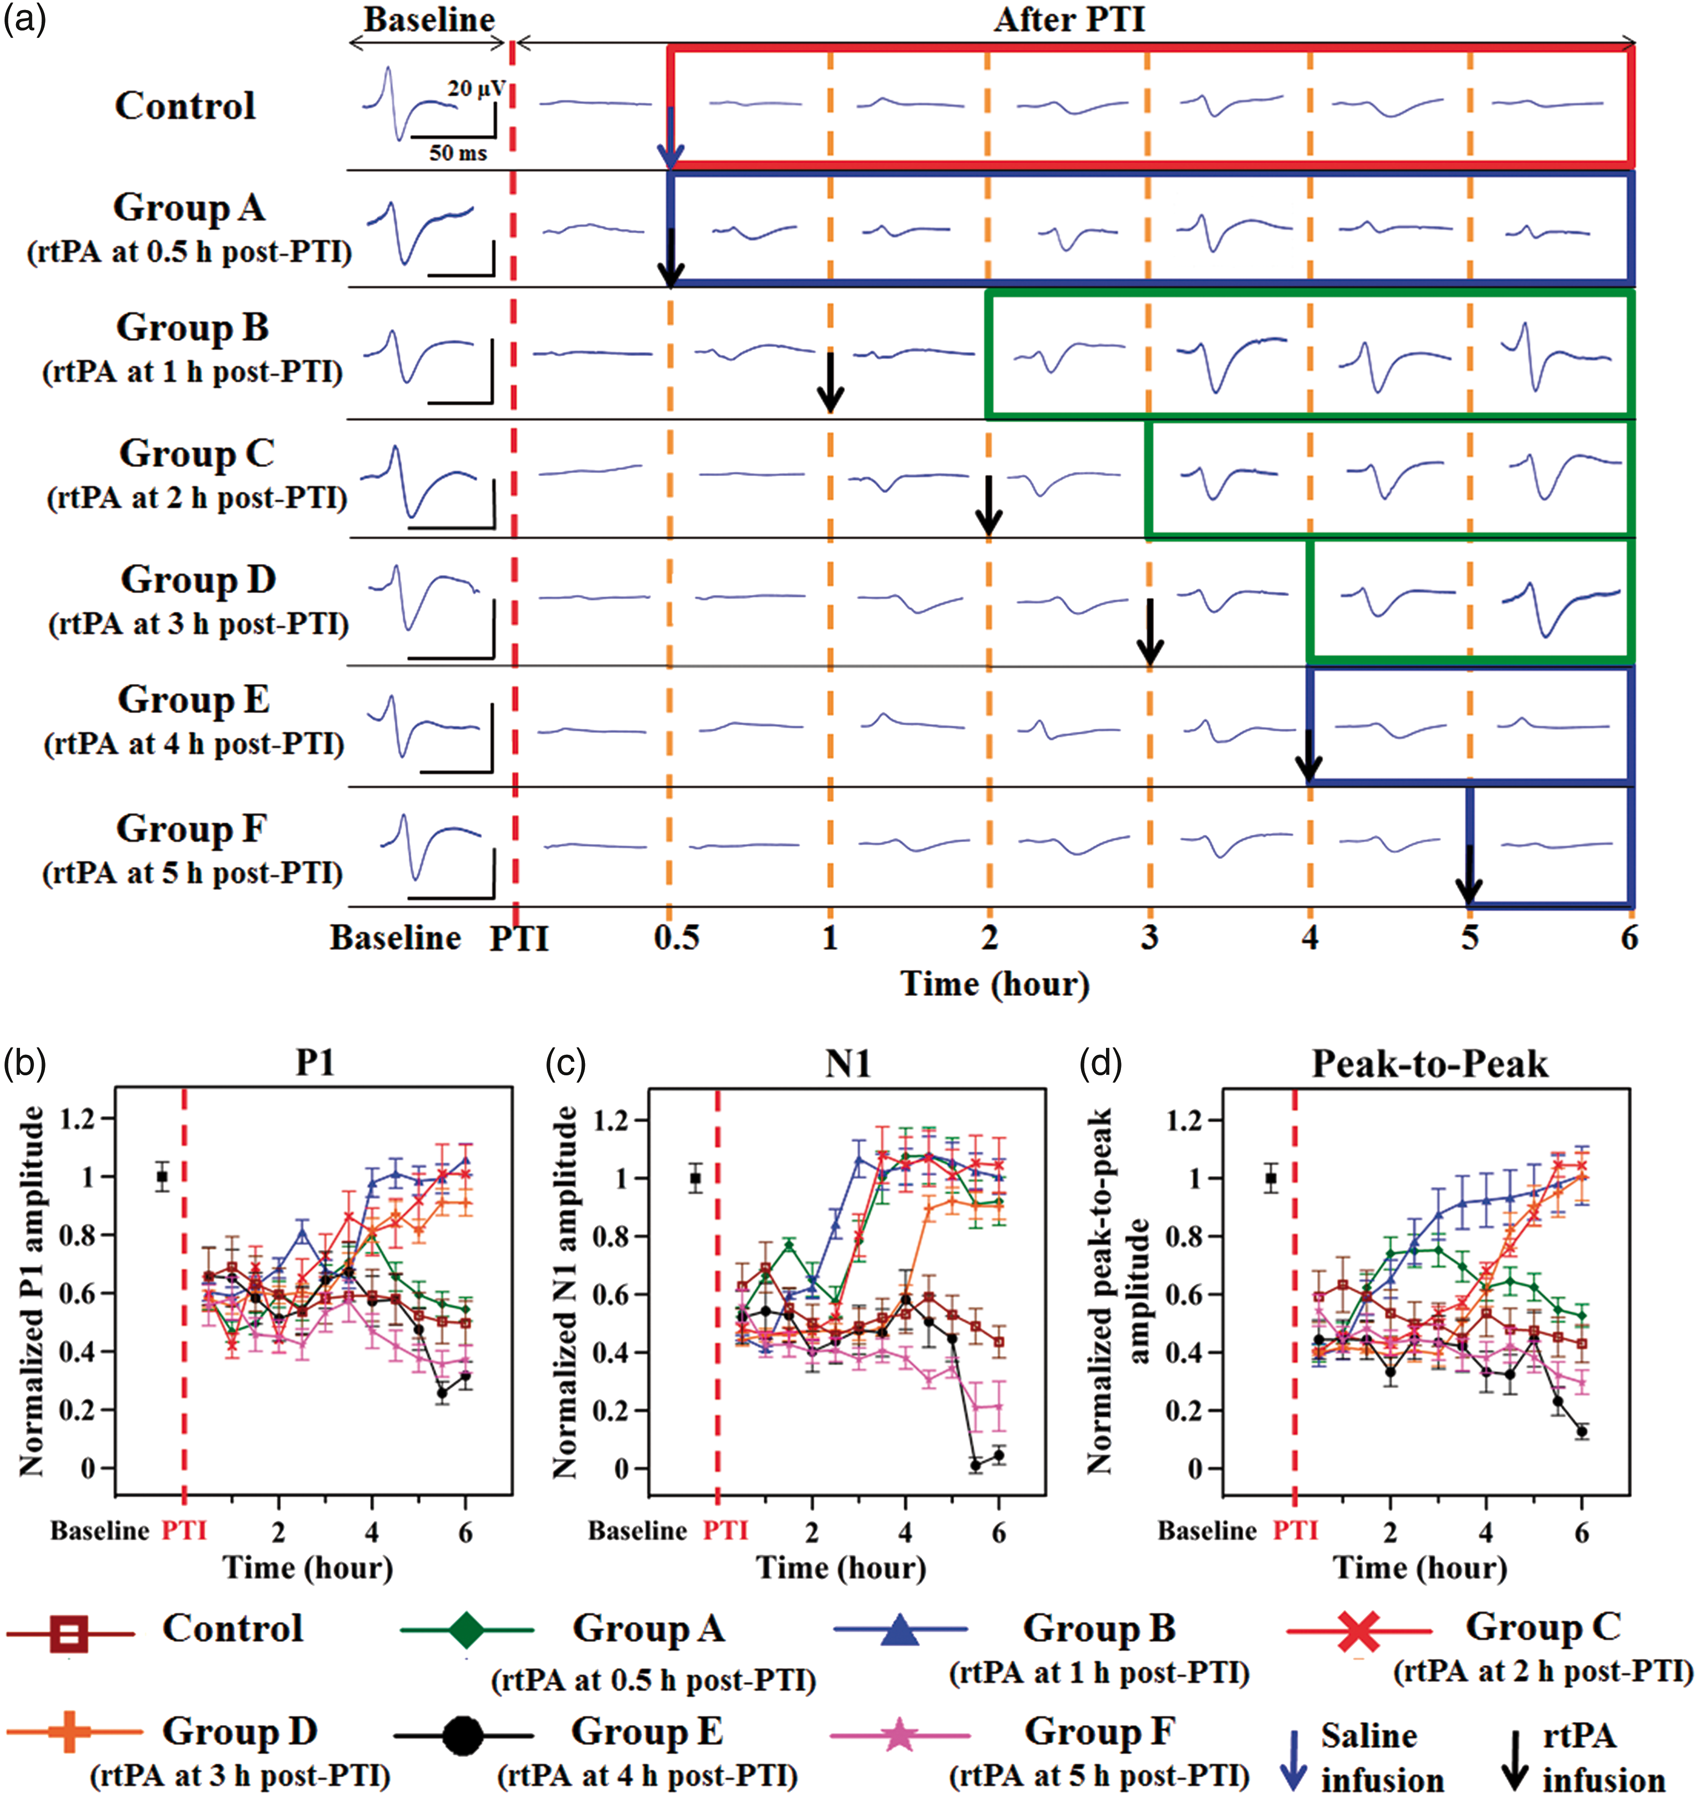
Changes in bilateral S1FL coherence and the ADR following rtPA thrombolysis post PTI
The changes in inter-hemispheric alpha and delta coherence were evaluated across the bilateral S1FL (Ch3 and Ch4) to determine the connectivity changes resulting from rtPA infusion at various onset times post PTI induction (Figure 4(a) and (b)) and to evaluate the effect of rtPA administration on neurovascular functions in the PTI model. Here, Ch3 and Ch4 were used for coherence calculations because they were applied near the PTI location (in iS1FL).
Trends of the RS ECoG changes in the bilateral S1FL before and after PTI onset. Shown here are the alpha (8.0 to 12.0 Hz) (a) and delta (0.1 to 4.0 Hz) (b) inter-hemispheric coherence changes in the bilateral S1FL (Ch3 and Ch4, as shown in Figure 1(a)). (c) The ADR changes at Ch4 in iS1FL and (d) the trend in the BSI across Ch1-Ch6. The ADR results indicated recovery or injury in the infarct region and were calculated for electrode Ch4, located in the lesioned region, i.e., iS1FL, which was contralateral to the side of electrical stimulation. The results indicated significant recovery of alpha and delta coherence and of ADR following rtPA infusion at 1, 2 or 3 h post PTI in groups B–D, respectively (p < 0.05). rtPA infusion at or beyond 4 h post PTI was counter-productive and resulted in decreased inter-hemispheric alpha and delta coherence. Note that ADR is a positive indicator of recovery from cerebral injury, a comprehensive measure of RS ECoG activity, and a clinical measure of neural injury. The variations in the BSI across Ch1-Ch6 provide an estimate of the degree of asymmetry between the ipsilesional and contralesional areas, and the BSI serves as a measure of recovery or damage. Note that a BSI value of 0 or 1 indicates perfect symmetry and asymmetry, respectively, between the ipsilesional and contralesional cortical regions.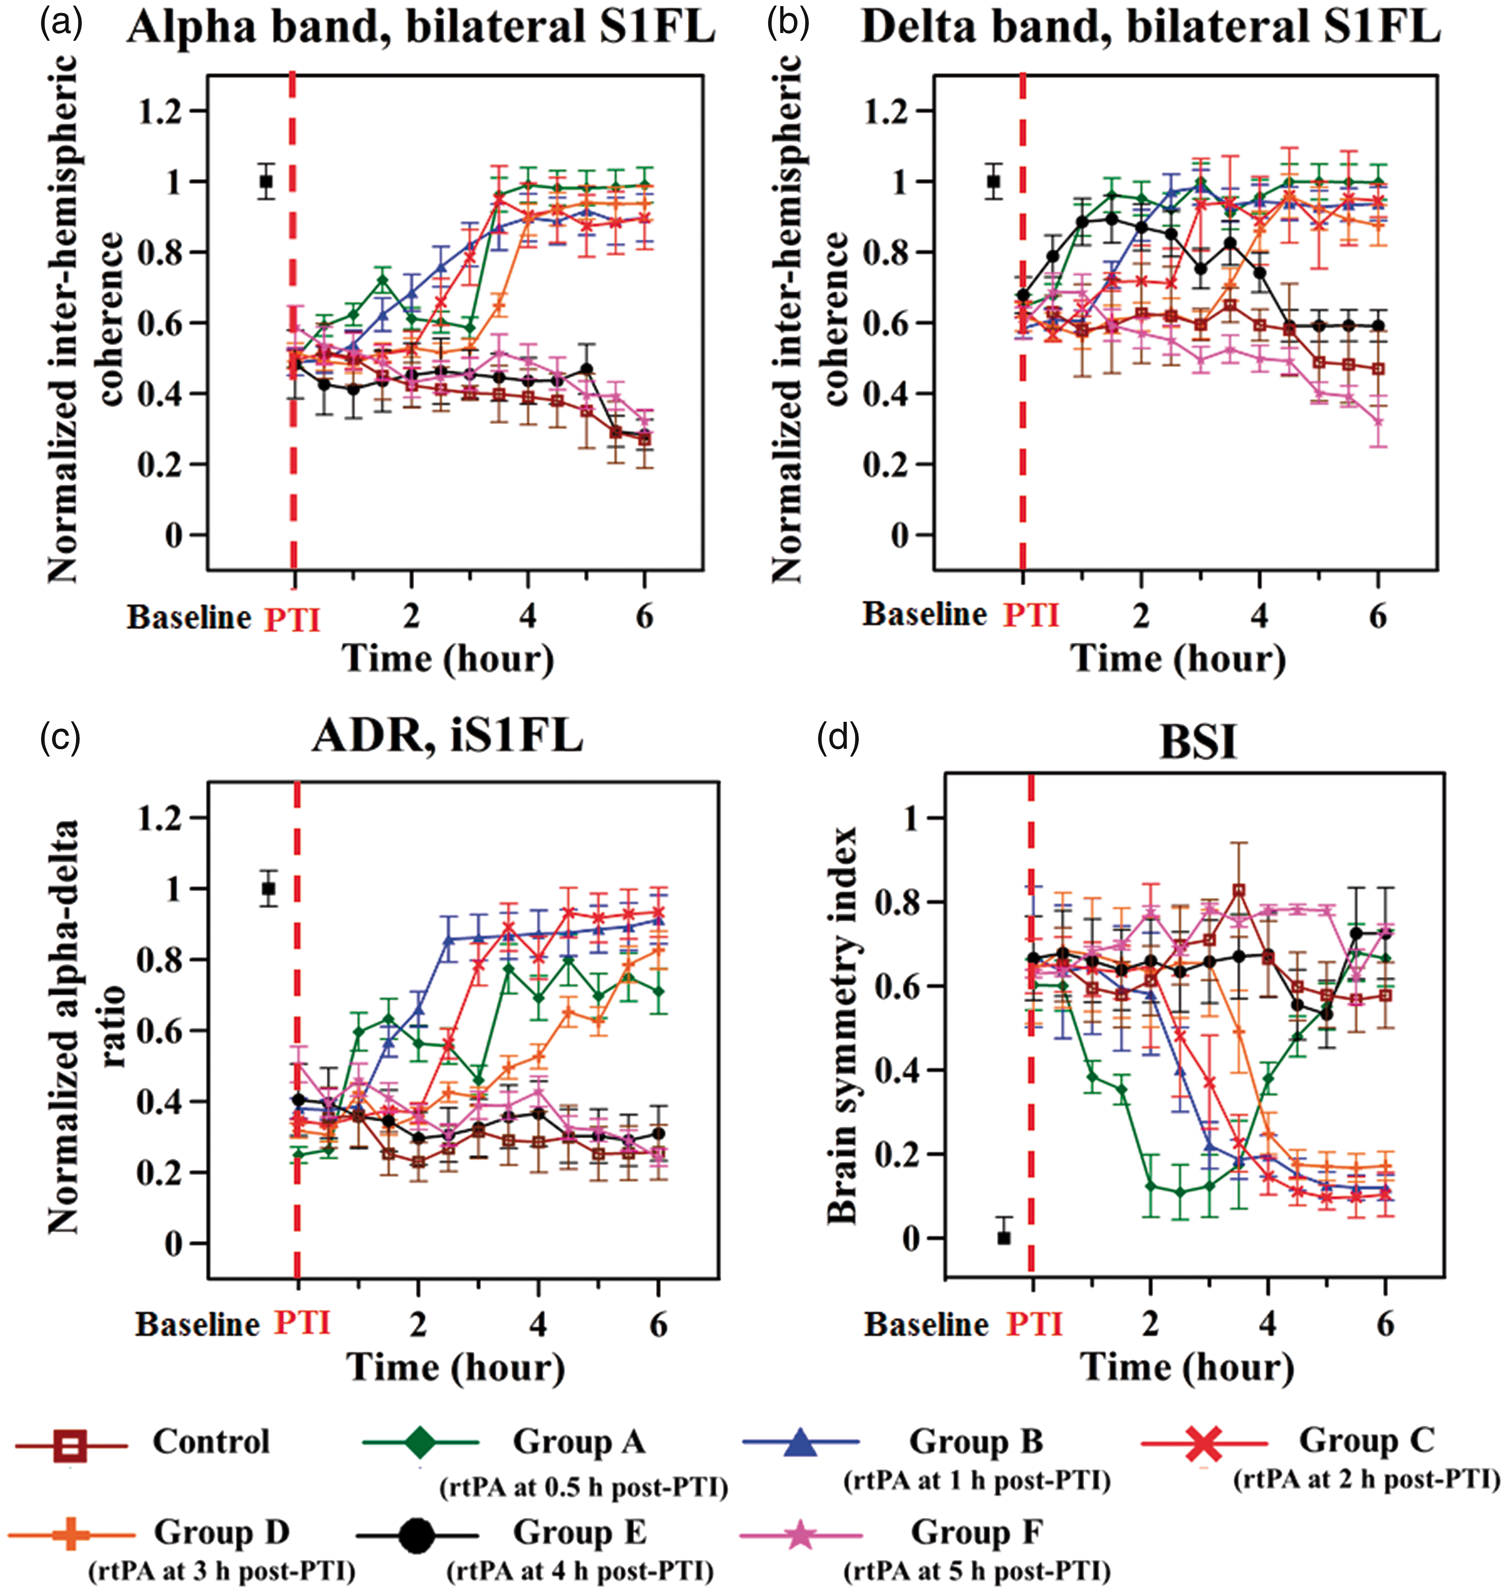
Repeated-measures ANOVA indicated a significant interaction between the frequency band and the rtPA administration onset time point (F = 15.745, p < 0.05). Additionally, the interaction between group, time point, and frequency band were significant (F = 14.258, p < 0.05). The changes in coherence in the alpha band in the bilateral S1FL decreased to approximately 51 ± 4.3% of baseline at PTI onset in all of the groups, as shown in Figure 4(a). Following rtPA administration, in group A (0.5 h post PTI), a significant increase in alpha coherence to 98 ± 4.9% of baseline was observed at the end of the monitoring period. Similarly, in groups B–D, alpha coherence at end of the 6 h post PTI monitoring period increased to 89 ± 4.4%, 90 ± 8.9% and 93 ± 4.6% of baseline, respectively. However, a decrease in alpha coherence (by 72 ± 1.4% and 67 ± 1.6% relative to baseline, respectively) was observed in groups E and F and these results were similar to those of the control group. The changes in coherence in the delta band before and after PTI onset were similar to the trend of alpha coherence, as shown in Figure 4(b). We observed notable recovery of delta coherence only in groups A–D at the end of the monitoring period (F = 16.843, p < 0.05). However, delta coherence decreased (to 59 ± 2.4% and 32 ± 4.8% of baseline, respectively) in groups E and F. The control group exhibited delta coherence of 45 ± 2.4% of baseline after the 6 h monitoring period following PTI onset.
The results for the ADR, an indicator of treatment outcomes in the peri-infarct region, 28 were calculated using the data from electrode Ch4 because it was located in the lesioned hemisphere (iS1FL), i.e. contralateral to the site of peripheral sensory electrical stimulation. 28 The ADR decreased in all groups by approximately 63 ± 7.9% relative to baseline after PTI induction, as shown in Figure 4(c). At the end of the monitoring period, although only a moderate recovery of the ADR (to 71 ± 3.5% of baseline) was observed following rtPA treatment in group A, significant increases were observed in groups B–D; these increases contributed to an overall post-treatment recovery to 93 ± 4.2% of baseline. The ADR of groups E and F (reduced by 69 ± 1.5% and 75 ± 1.2% relative to baseline, respectively at 6 h post PTI) showed a similar trend to that of the control group throughout the monitoring period.
BSI changes due to rtPA thrombolysis following PTI onset
The BSI for all groups increased by approximately 64 ± 3.2% relative to baseline immediately after PTI onset, as shown in Figure 4(d). At 6 h post PTI onset, the BSI in the control group remained at an increased value that was 60 ± 2.9% greater than baseline. As shown in Figure 4(d), Group A (rtPA administration at 0.5 h post PTI) exhibited a rapid recovery of BSI following rtPA infusion (10 ± 1.2% at 2.5 h post PTI); however, the BSI then increased by 66 ± 3.3% relative to baseline at the end of the monitoring period. Groups B–D exhibited an overall recovery in the BSI of approximately 83 ± 5.9% compared to the post PTI value (12 ± 0.6%, 10 ± 0.6% and 17 ± 0.8% of baseline, respectively) (Figure 4(d)). Alternatively, the BSI in groups E and F continued to deteriorate (72 ± 3.6% and 73 ± 4.0% above the baseline value, respectively) at the end of the monitoring period (Figure 4(d)).
Relative hemodynamic response changes due to rtPA thrombolysis post PTI
The selected sites for PA imaging and the open window through the skull to the cortical surface are shown in Figure 1(a). Figure 5(a) shows the maximal CBV (i.e. The results of PA imaging in the hyperacute phase of PTI. (a) In vivo IR(570) PA B-scan images, which reflected the CBV changes, were captured at 0.6 mm from Bregma prior to PTI onset, immediately after PTI onset (15 min post PTI) and 6 h post-PTI. The insets in the top left corners show handheld digital microscope images of the surface of the ischemic hemisphere (iS1FL) of the rat brain captured at intervals corresponding to the PA B-scans. The yellow arrows (handheld microscope images) and corresponding yellow boxes (PA images) indicate the blood vessel cross-section direction of the PA B-scan images. The red scale bar indicates 1 mm. The window for the bilateral PA B-scan images was 8 mm wide and 3 mm deep. The solid green arrows indicate that significant recovery of CBV was observed following rtPA treatment in groups B–D. Normalized functional CBV (i.e. 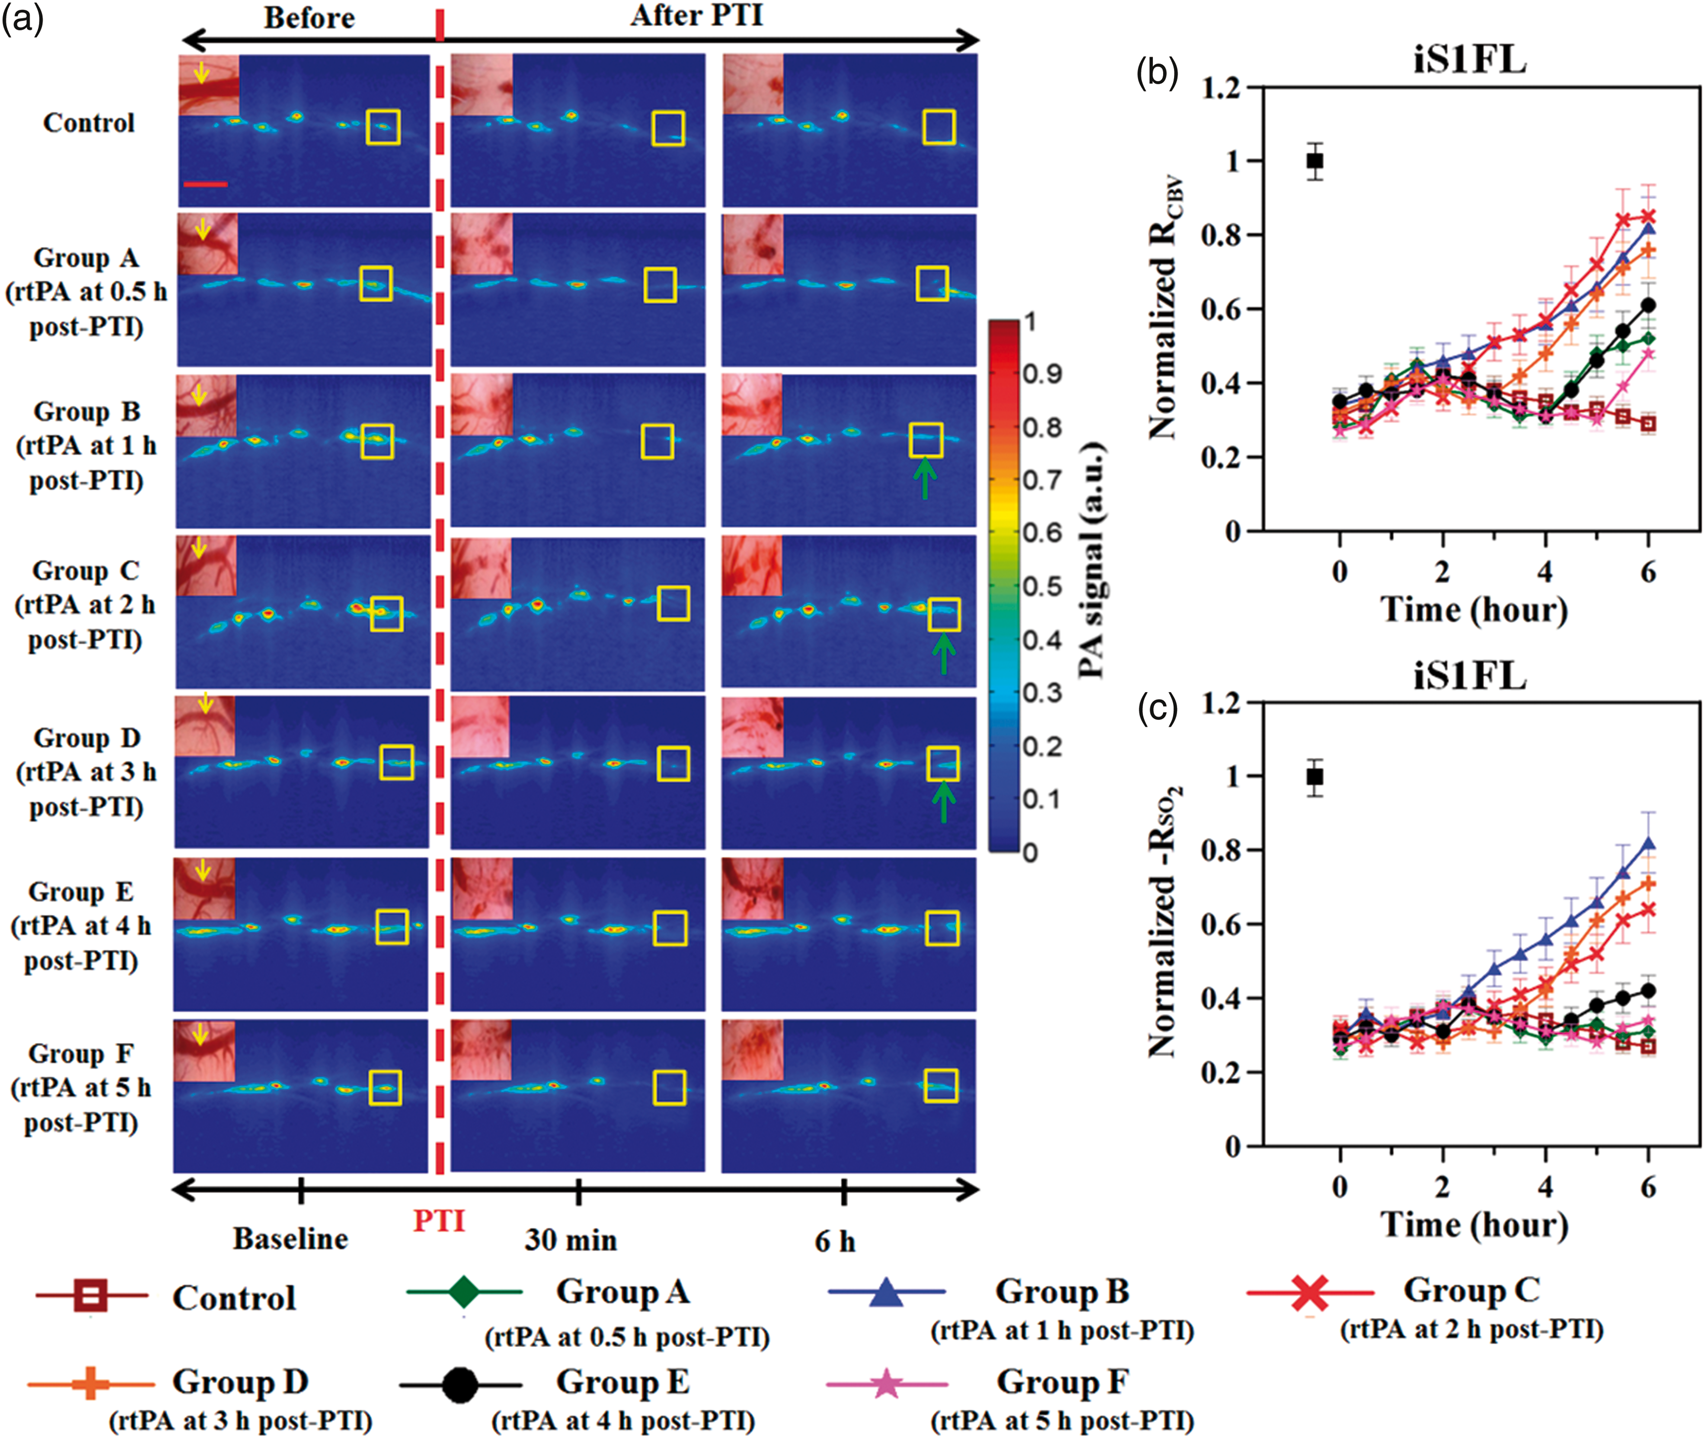
Figure 5(c) shows the fPAM-mediated measurements of the maximum SO2 (i.e.
Quantification of the infarct volume after rtPA thrombolysis
We compared the infarct area in coronal sections from each group using TTC staining (Figure 6(a)) and expressed the lesion volume as a percentage (%) of the contralesional hemispheric volume (Figure 6(b)). The infarcted regions were observed as pale (unstained) regions that included only the S1FL cortex. Groups A–E displayed a significantly smaller infarct volume (% of contralesional hemisphere) than the control group (13 ± 1.9%) (p < 0.05). Groups B–D, which were treated with rtPA between 1 and 3 h post PTI, exhibited the smallest infarct volumes, approximately 72 ± 5.6%, 71 ± 4.2% and 61 ± 3.6%, respectively, relatively lesser than the control group (p < 0.05). In contrast, groups A, E and F displayed greater infarct sizes than groups B–D (infarct volumes of 8 ± 0.9%, 8 ± 0.8% and 9 ± 1.2%, respectively).
Histological quantification of the infarct volume via TTC staining and analysis of the percent change in the infarct volume in the bilateral S1FL cortex. (a) Corresponding representative coronal sections of the ischemic brain at 0.2 mm anterior to Bregma in the control group and the experimental groups, which received rtPA infusion post PTI at various onset times. The black arrow indicates the infarcted tissue, detected as white regions, and the normal tissue was stained red. The inset shows an enlarged volume of infarcted tissue in the respective groups. (b) The bar chart indicates the infarct volume (%). Groups B–D (rtPA infusion at 1, 2 or 3 h post PTI, respectively), which are indicated in green, exhibited a significant reduction in the infarct size compared to the control group (p < 0.05), as indicated by the asterisks. Groups E and F, which are shown in blue (rtPA administration at 4 or 5 h post PTI, respectively), received counter-productive therapy based on their increased infarct size compared to groups B–D. The data are presented as the mean ± S.D. (n = 8 in each of the groups). *p < 0.05 against control by one-way ANOVA with Tukey correction.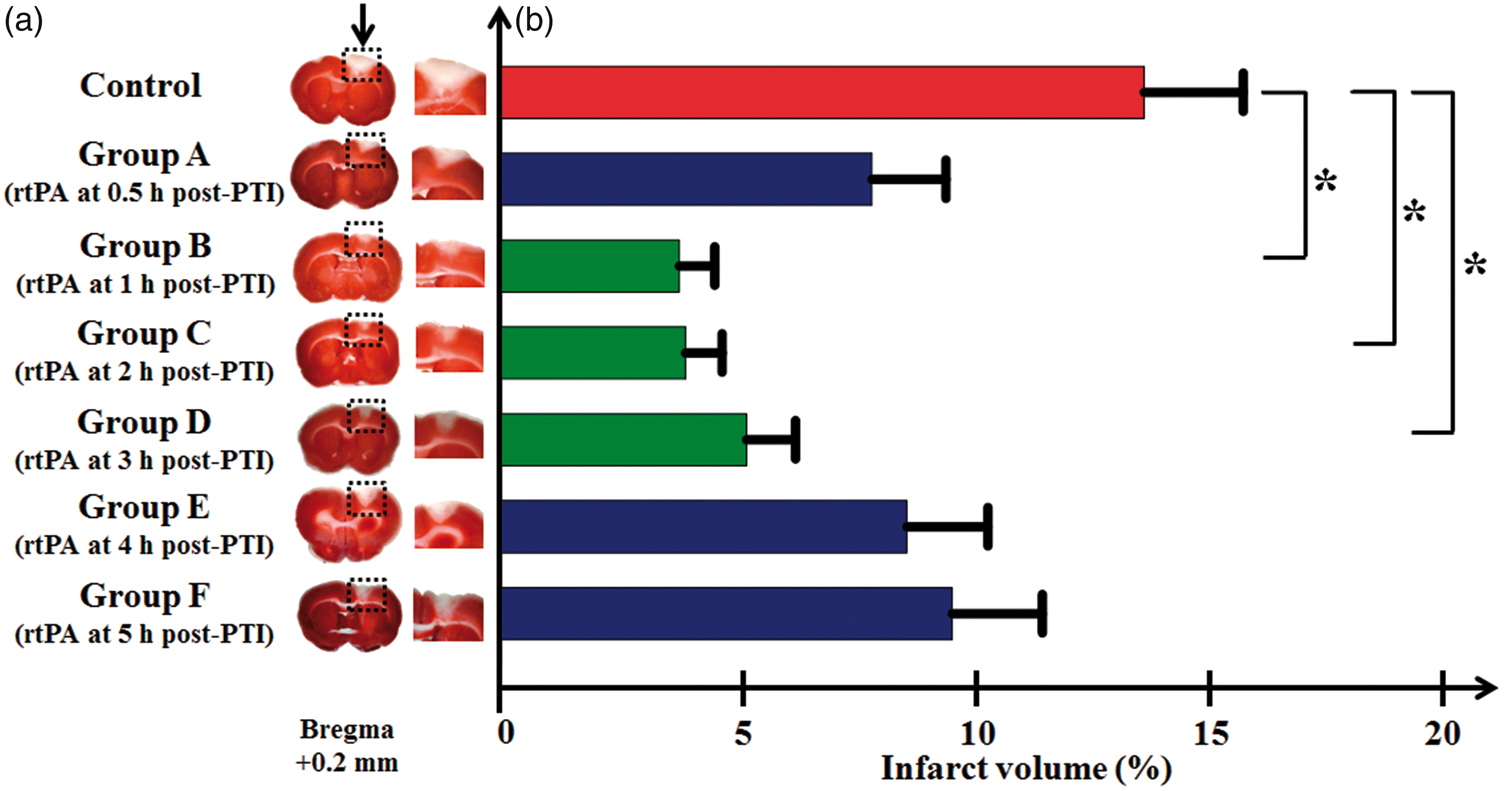
Discussions
In this study, we investigated the neurovascular dynamics during the hyperacute phase of ischemia and following rtPA thrombolysis at various infusion onset times in a rat PTI model. The custom-designed ECoG-fPAM system was employed to study post-PTI neurovascular dynamics in the peri-infarct region by measuring neural integrity and hemodynamic responses in the bilateral S1FL. Our major findings include the following: (1) early onset rtPA infusion (<1 h post PTI) resulted in only partial recovery from PTI, (2) rtPA treatment beginning between 1 and 3 h post PTI improved neurovascular outcomes, (3) delayed rtPA treatment (>4 h post PTI) worsened outcomes. Surprisingly, our experimental data do not support our initial hypothesis that early rtPA administration will result in better improvement within this hyperacute phase following a stroke. These findings may contribute to the holistic understanding of hyperacute ischemia pathophysiology.
In our study, the trend of neurovascular integrity was determined using the ECoG-fPAM system by obtaining the correlation between the BSI, a neural activity indicator, and CBV, a hemodynamic measure (Figure 7(b) to (d)). We further classified the various experimental groups into distinct zones of recovery, based on the trend of neurovascular integrity, as follows: early window – zone 1 in Figure 7(a) in which rtPA infusion was initiated before 1 h post PTI; golden time window – zone 2 in Figure 7(a) in which rtPA infusion was initiated between 1 and 3 h post PTI; and late window – zone 3 in Figure 7(a) in which rtPA infusion was initiated after 4 h post PTI. This characterization is shown in Figure 7(a) as a schematic representation of the trend of neurovascular integrity of the various experimental groups during the hyperacute phase as compared against the control group (without rtPA administration, indicated by the grey curve in Figure 7(a)). This provides a new opportunity to study neurovascular integrity using this multimodal imaging system, and such evidence is key to understanding the progression of ischemic recovery/injury.
Dynamics of neurovascular integrity before and after PTI with rtPA administration in a hyperacute rat PTI model. (a) Schematic interpretation of the trend of neurovascular integrity corresponding to three zones (i.e. windows) of recovery elicited by rtPA infusion at different time points during the hyperacute phase of PTI. In Figure 7(b–d), based on our results shown in Figures 4(d) and 5(b), the trend of neurovascular integrity is determined as a plot of the normalized BSI (solid lines) versus CBV (dashed lines) during various periods of recovery: (b) early (0.5 h post PTI), (c) productive (1–3 h post PTI) and (d) late (> 4 h post PTI) phases of rtPA infusion. The schematic in Figure 7(a) shows the damage to the peri-infarct region in the hyperacute phase of ischemia, where the grey curve indicates the control group (without rtPA post PTI) and the colored dotted curves indicate the trend of neurovascular integrity in the various experimental groups. Zone 1 represents the early window, in which there is increased excitotoxicity, zone 2 indicates the golden time window, in which the tissue is susceptible to inflammation, and zone 3 corresponds to the late window of rtPA infusion after PTI, during which apoptosis and cell death occur.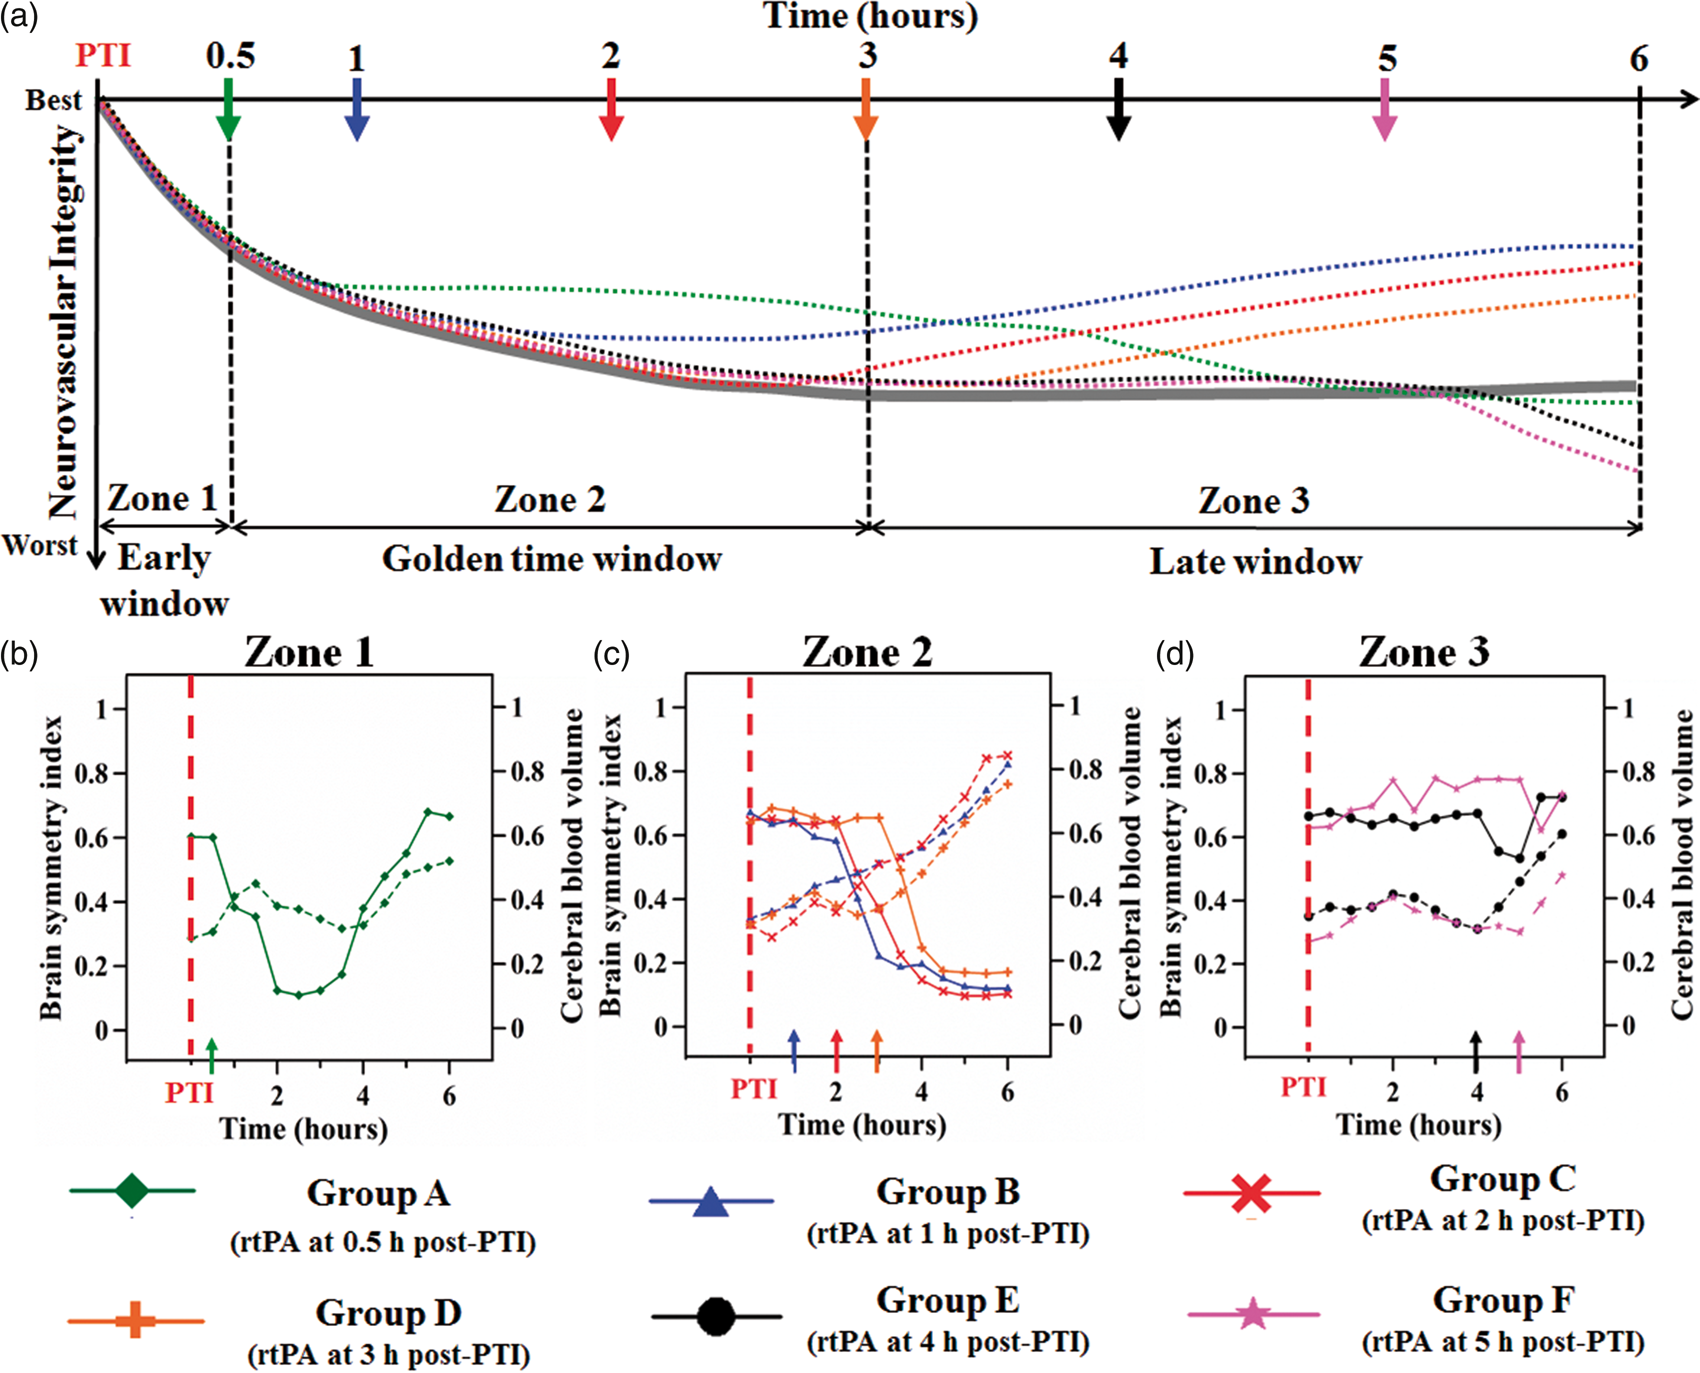
The golden time window (1–3 h post PTI) for safe rtPA thrombolysis in the rat PTI model
In our study, consistent recovery of neurovascular responses was observed following rtPA infusion initiated at 1, 2, or 3 h post PTI in a rat PTI model (Figure 7(c)). The observed increases in local hemodynamic response (Figure 5(b) to (c)) and decreases in the infarct size (Figure 6(a) and (b)) demonstrated that rtPA infusion at 1, 2, or 3 h post PTI was a safe treatment.
The significant increases in functional hemodynamic responses could be attributed to rtPA-mediated recanalization combined with the recruitment of collaterals, as documented in the literature. 29 We hypothesized that temporary vasodilation has a beneficial effect caused by metabolic hyperemia due to reperfusion of CBF in the event of ischemic stroke. Moreover, this beneficial hyperemic-reperfusion phenomenon occurs during the appropriate period to satisfy metabolic demand and promote the recovery of local neural activity, as indicated by the recovery of the P–P amplitude, inter-hemispheric coherence, the ADR and the BSI (Figures 3 and 4). The BSI strongly correlates with long-term outcomes in ischemic stroke patients and with the NIHSS score.30,31 Herein, our results demonstrated that a low BSI score was achieved when rtPA was infused between 1 and 3 h post PTI (groups B–D). This finding implied that rtPA treatment between 1 and 3 h post PTI yielded optimal functional outcomes. We also observed that cortical neural activity recovered marginally earlier than cerebral hemodynamics. In group C following rtPA administration at 2 h post PTI, neural activity recovered as a dynamic surge after rtPA administration (Figures 3 and 4). Conversely, the hemodynamic increases showed a slower, incomplete pattern of recovery (Figure 5). This phenomenon was also observed in our previous work regarding transient ischemic attack, where neural activity fluctuations were greater than hemodynamic fluctuations. 32 These results suggest that reperfusion might not be necessary for complete and early functional recovery. They also raise the question of whether there is a trend of uncoupling during recovery that could be capitalized on for developing therapies.
The results of a previous study indicated that this improvement in outcome (based on inter-hemispheric coherence) might lead to anatomical and functional reorganization during long-term recovery via the recruitment of healthy, remote and secondary cortical areas to compensate for the limited function of the injured region and to respond to inflammation. 33 Our findings also indicated that rtPA infusion initiated at 1, 2 or 3 h post PTI dramatically reduced ischemic brain tissue damage in the cortex and led to a smaller infarct volume (groups B–D in Figure 6). We attribute this beneficial effect of rtPA to its thrombolytic activity, as indicated by the disappearance of the clot (Figure 5, groups B–D), within the appropriate time window, during which the injured tissue remains salvageable. 34 However, the presence of an infarct even after successful recanalization emphasizes that thrombolytic therapy protects only the peri-infarct tissue and does not reduce the size of the infarct core. 35 Collectively, the results of our study showed that a clinically relevant rtPA administration time window between 1 and 3 h post ischemia, conserved neurovascular functions in a rat PTI model.
Early administration of rtPA (< 1 h post PTI) – a boon or a bane?
The parameters of neurovascular function during the first few hours following ischemia are not well understood, but this information is critical for the development of therapeutic interventions. 6 We hypothesized that early re-establishment of CBV (reperfusion) at the ischemic site is associated with beneficial vascular support, as reflected by a favorable functional outcome. However, one of the interesting results of this study was that early administration of rtPA, at 0.5 h post PTI, did not induce greater recovery than rtPA administration at 1–3 h post PTI. Regarding neurovascular function, following early rtPA infusion, neural activity displayed a biphasic trend (i.e. initially increases but further continues to deteriorate) and CBV moderately increased over time (Figure 7(b)).
Surprisingly, we observed that rtPA infusion at 0.5 h post PTI was not followed by a sustained increase in CBV and did not induce complete thrombolysis (Figure 5). One possible explanation for this result is that endogenous tissue plasminogen activator, a key factor contributing to rtPA thrombolysis efficacy, is present at low levels during rtPA administration at 0.5 h post PTI, consequently leading to low thrombolytic activity. 36 Moreover, exogenous rtPA has a short half-life and degrades over time; as a result, the efficacy of rtPA thrombolysis is reduced. Although rtPA mediated only partial recanalization following administration initiated at 0.5 h, CBV was increased at 4 h post PTI (Figure 5). However, interestingly, the restoration of CBV at this time point negatively correlated with the changes in SO2 (Figure 5). The delayed restoration of perfusion may be responsible for the local decrease in SO2 (Figure 5), which occurs due to accelerated cell death and, consequently, the amplification of tissue damage, as indicated by the expansion of the infarct 6 (Figure 6). There is also evidence suggesting that early reperfusion after cerebral ischemia causes opening of the blood–brain barrier (BBB). Using a rat two-vessel ischemia model, Preston et al. 37 were the first to document that widespread opening of the BBB occurs in the forebrain immediately following 10 min and 25 min of ischemia. However, BBB leakiness was not studied at later time points during ischemic injury. Supporting these findings, Kuroiwa et al. 38 found that opening of the BBB occurred 15 min after CBF reperfusion in a 1 h transient middle cerebral artery occlusion model. 38 This suggested the possibility that BBB damage and edema formation could appear during early ischemia, as reperfusion at early time points (in our case, 0.5 h after ischemia) appears to cause reactive hyperemia and furthers poor neurovascular outcomes. Therefore, studies of the temporal events involved in BBB integrity or edema formation during ischemia injury are highly warranted. Furthermore, this treatment induced only a subtle recovery in the SSEP P–P amplitude towards the end of the monitoring period (Figures 3 and 4). This hampered neural activity could be the result of disrupted autoregulation due to vasoparalysis. 19 Additionally, we hypothesize that, Ca2+ overload caused by impaired homeostasis of the ionic gradient may cause excitotoxicity, which further increases the accumulation of glutamate in the extracellular space. 39 The trend of the BSI reflected a state of asymmetry at 6 h post PTI, although the BSI recovered immediately following rtPA infusion onset. This result could be because early thrombolysis leads to global reperfusion and promotes overall inter-hemispheric coherence. However, failure to restore CBF in S1FL subsequently impairs inter-hemispheric coherence over time, as shown in the BSI profile (Figure 4(d)).
Thus, our study has demonstrated for the first time that early thrombolysis (i.e. rtPA infusion at 0.5 h post PTI) may result in partial recanalization and insignificant recovery of neurovascular functions in a rat PTI model, and these results suggest the presence of an early rtPA administration period, in which the treatment of hyperacute ischemia with rtPA is unproductive. Further research is required to understand the failure of thrombolysis and partial recanalization following early rtPA infusion.
Late rtPA administration (> 4 h post PTI) induces hemorrhagic transformation and partial recanalization
Our findings also indicated that initiating rtPA infusion beyond 4 h after PTI leads to moderate changes in CBV but no improvement in neural activity, as indicated by the trend of the BSI (Figure 7(d)). That is, we observed a very slight recovery of local CBV and decrease in SO2 (groups E and F in Figure 5) and a corresponding impairment in neural activity following rtPA infusion at 4 and 5 h post PTI, respectively (Figure 3 and 4). Based on this trend of insignificant improvement in overall neurovascular function, initiating rtPA administration beyond 4 h post PTI is considered unsafe. We hypothesize that the failure of late thrombolysis (poor recovery outcomes) may be due to reactive hyperemia and loss of cerebral autoregulation that leads to partial recanalization beyond the therapeutic window. Multi-phasic increases in paracellular permeability after ischemic occlusion have been demonstrated previously, which explains the observations that early and late recanalization caused deterioration of neurovascular function.37,38,40 Lack of tissue perfusion caused damage to endothelial cells, pericytes, astrocytes, and neurons as well as to extracellular matrix. Cerebral ischemia caused BBB permeability coupled with neutrophil infiltration into the brain parenchyma, leading to secondary inflammatory injury. 41 This led to further damage of the neurovascular unit and the loss of neural activity, which was observed as a sustained decrease in P–P amplitude and ADR at 4, 5 and 6 h post PTI (groups E and F in Figures 3 and 4). Furthermore, a lack of complete cerebral restoration was observed based on the hemodynamic response results (Figure 5(b) and (c)), which indicated partial recanalization following late rtPA administration. Our results are consistent with previous reports of the effects of rtPA treatment on rats subjected to embolic stroke 42 and on ischemic stroke patients, 43 in which late rtPA treatment (beyond 4 h post ischemia) was associated with partial recanalization.
Fanne et al.44,45 demonstrated that permeabilization of the BBB and edema contributes to the neurotoxicity of delayed rtPA. Another potential factor leading to poor recovery from late recanalization is reperfusion injury. 46 The restoration of CBV in the infarct region during the post-ischemic period (Figure 5, groups E and F) may lead to further reactive oxygen species- and inflammation-mediated tissue injury (as reflected by the SO2 levels in groups E and F in Figure 5(c)). 47 Burrows et al. 6 have shown that a flow-dependent response governs ischemic pathology, as a lack of reperfusion at acute time points correlates with decreased neuronal survival. Our findings of decreased P–P amplitude and ADR in groups E and F (Figures 3 and 4) are concordant with the results from a recent study that revealed a correlation between the lack of reperfusion or delayed reperfusion and decreased neuronal survival in a rat ischemia model. 6
Additionally, the BSI results indicated a consistent trend of asymmetry even after late rtPA treatment was administered; these results clearly indicated that late thrombolysis beyond 4 h post PTI may not improve long-term functional outcomes. 30 These factors are supportive of the expanded infarcts observed in groups E and F, which received rtPA infusion at least 4 h after ischemia onset (Figure 6). Thus, our study has demonstrated that the administration of rtPA beyond 4 h post PTI results in neurovascular damage based on an explicit examination of the simultaneous variations in parameters of neurovascular function in a rat PTI model.
Conclusions
In summary, the present study used a cutting-edge ECoG-fPAM system to evaluate the dynamics of neurovascular function in the peri-infarct region pre- and post PTI. Our results have shown that early onset of rtPA infusion (< 1 h post PTI) was, surprisingly, not beneficial, possibly due to a failure of recanalization. We also demonstrated the presence of an rtPA therapeutic window (1–3 h post PTI) in a rat model, and that late onset of rtPA infusion (> 4 h post PTI) was counter-productive to recovery from ischemia. Moreover, our results revealed the presence of an infarct even in cases of rtPA administration within the golden time window. Therefore, we suggest that the primary therapeutic effect of thrombolysis is the protection of peri-infarct tissue rather than reversal of the initial ischemic injury. Our findings have enhanced the current understanding of hyperacute neurovascular function during rtPA-mediated thrombolysis and have provided an important contribution to imminent translational drug development for acute ischemic recovery. Future studies are required to investigate the dynamics of neurovascular function, including BBB integrity and vascular parameters, following rtPA infusion at various time points after ischemia.
Footnotes
Funding
The author(s) disclosed receipt of the following financial support for the research, authorship, and/or publication of this article: The authors thank the National University of Singapore for supporting the Neurophotonics Group at the Singapore Institute for Neurotechnology (SINAPSE) under grant number R-711-000-026-133, A*STAR for their support under grant number R-719-003-100-305 and Ministry of Education for their support under the Academic Research Fund Tier 2 grant number R-719-000-010-592. LD Liao also thanks the Institute of Biomedical Engineering and Nanomedicine at National Health Research Institutes, Taiwan for supporting the Nanoneurophotonics Laboratory (NNPL) under grant number 05A1-BNPP15-014. This work was also partially supported by the Ministry of Science & Technology (MOST), Taiwan, under grant number MOST-105-2221-E-400-006 to LD Liao’s lab.
Declaration of conflicting interests
The author(s) declared no potential conflicts of interest with respect to the research, authorship, and/or publication of this article.
Authors’ contributions
AB, L-DL and JML developed the study concept and design. AB and L-DL were involved in the data acquisition and analysis. A.B, L-DL, SJC, JML, Y-HL, Y-YS, H-CP, PT-HW, H-YL, NKKK, Y-YC, WHN and NT drafted the manuscript. L-DL and NT supervised the study. The content of this manuscript has been reviewed, read, and agreed upon by all designated authors.
References
Supplementary Material
Please find the following supplemental material available below.
For Open Access articles published under a Creative Commons License, all supplemental material carries the same license as the article it is associated with.
For non-Open Access articles published, all supplemental material carries a non-exclusive license, and permission requests for re-use of supplemental material or any part of supplemental material shall be sent directly to the copyright owner as specified in the copyright notice associated with the article.