
Abstract
Thrombolytic therapy of acute ischemic stroke can be successful only as long as there is penumbral tissue perfused at rates between the thresholds of normal function and irreversible structural damage, respectively. To determine the proportion of tissue at risk of infarction, cerebral perfusion was studied in 12 patients with acute ischemic stroke who underwent treatment with systemic recombinant tissue plasminogen activator (0.9 mg/kg body weight according to National Institute of Neurological Disorders and Stroke protocol) within 3 hours of onset of symptoms, using [15O]-H2O positron emission tomography (PET) before or during, and repeatedly after thrombolysis. The size of the regions of critically hypoperfused gray matter were identified on the initial PET scans, and changes of perfusion in those areas were related to the clinical course (followed by the National Institutes of Health stroke scale) and to the volume of infarcted gray matter demarcated on magnetic resonance imaging 3 weeks after the stroke. Whereas the initial clinical score was unrelated to the size of the ischemic area, after 3 weeks there was a strong correlation between clinical deficit and volume size of infarcted gray matter (Spearman's rho, 0.96; P < 0.001). All patients with a severely hypoperfused (< 12 mL/100 g/min) gray matter region measuring less than 15 mL on first PET showed full morphologic and clinical recovery (n = 5), whereas those with ischemic areas larger than 20 mL developed infarction and experienced persistent neurologic deficits of varying degree. Infarct sizes, however, were smaller than expected from previous correlative PET and morphologic studies of patients with acute stroke: only 22.7% of the gray matter initially perfused at rates below the conventional threshold of critical ischemia became necrotic. Actually, the percentage of initially ischemic voxels that became reperfused at almost normal levels clearly predicted the degree of clinical improvement achieved within 3 weeks. These sequential blood flow PET studies demonstrate that critically hypoperfused tissue can be preserved by early reperfusion, perhaps related to thrombolytic therapy. The results correspond with experimental findings demonstrating the prevention of large infarcts by early reperfusion to misery perfused but viable tissue.
Keywords
Therapeutic strategies in acute ischemic stroke are targeted at rescuing from infarction ischemic but potentially viable tissue, the “ischemic penumbra” (Astrup et al., 1981; Heiss and Graf, 1994; Hossmann, 1994). Penumbral tissue is perfused at some level between the thresholds of maintained function and preserved morphology, respectively (Astrup et al., 1981). As long as the duration of ischemia does not exceed a certain time window, tissue damage may be reversible (Heiss and Rosner, 1983). Therefore, the ischemic penumbra is a dynamic process of impaired perfusion and relatively preserved metabolism at an unstable level: there is potential for recovery, but also for progressive, selective necrosis or regional infarction. In patients with acute ischemic stroke, positron emission tomography (PET) studies identify an abnormality termed misery perfusion (Baron et al., 1981), which is characterized by an increase in regional oxygen extraction fraction caused by a severe decrease in CBF and a lesser decrease in the respective cerebral metabolic rate for oxygen.
Systemic thrombolytic therapy was shown to be clinically effective when initiated shortly after onset of clinical signs of cerebral ischemia (National Institute of Neurological Disorders and Stroke [NINDS] 1995, European Cooperative Acute Stroke Study: Hacke et al., 1995). However, evidence has been scarce that thrombolytic treatment of patients actually salvages tissue characterized by dense initial ischemia. This lack of physiologic evidence largely results from the fact that acute therapeutic interventions do not permit time-consuming studies of energy metabolism and CBF. Moreover, placement of arterial lines for blood sampling, as required for absolute quantitation, is contraindicated. In this study, the blood flow of severely hypoperfused cerebral gray matter eventually undergoing infarction or maintaining morphologic integrity was assessed in 12 patients with acute ischemic stroke, using PET at the time of systemic thrombolytic therapy and again approximately 3 and 24 hours later. Since quantitative measures of CBF could not be obtained at this acute stage, relative regional tracer uptake was used to estimate the level of residual blood flow in the affected hemisphere. The clinical deficit and the observed patterns of early flow change then were related to the infarcts detected on anatomically matched magnetic resonance imaging (MRI) scans obtained approximately 3 weeks after the ictus, and to the clinical outcome at that time.
METHODS
Patient selection and manage
Between March 1996 and October 1997, 15 patients with acute hemispheric stroke were admitted to the Neurological Hospital of the University of Cologne, Germany, during operating hours of the PET unit. The onset of their neurologic symptoms was verified to have occurred less than 180 minutes before treatment was begun. The other inclusion and exclusion criteria were adopted from the NINDS study and extended by the following ECASS exclusion criteria: age older than 80 years, hypodensity covering more than one third of the middle cerebral artery territory on initial computed tomography (CT) scans, severely impaired consciousness, or forced head and eye deviation (Hacke et al. 1995). After informed consent had been obtained from the patients or their next of kin, after explanation of the benefits and hazards of the intended treatment and of the diagnostic procedures including PET, systemic thrombolytic treatment was performed according to a protocol similar to the one of the NINDS study (NINDS, 1995), using 0.9 mg of recombinant tissue plasminogen activator (rt-PA) per kg body weight (Altepease, Thomae, Biberach, Germany: 10% of total dose by intravenous bolus injection, 90% by intravenous infusion over 1 hour). This was immediately followed by a medical regimen including intravenous heparin administered first as a bolus of 5000 IU and continued at a dosage maintaining plasma partial thromboplastin time at a level between one and a half and two times the normal value for 10 days. The CT scanning was repeated routinely at 24 hours and when any neurologic deterioration occurred. During the first 3 to 5 days after the stroke, the patients were monitored in the neurologic intensive care unit, where blood pressure was medically controlled between 140/90 and 160/100 mm Hg. In four patients, medical therapy to control blood pressure was necessary during their hospital stay. Three of them received nifedipine in the acute phase, one urapidil. On days 2 to 4, these patients were put on definite antihypertensive treatment (angiotensin converting enzyme inhibitors, diuretics, β-blockers).
Sequence of positron emission tomography and imaging studies
Recombinant tissue plasminogen activator was administered while the patient was positioned in the PET scanner. The first CBF study (taking 2 minutes) was performed right before or during the first 10 minutes of rt-PA infusion. The CBF was reassessed approximately 2 hours and again 18 to 28 hours after the end of that infusion. Three weeks later, the size and location of the final infarct were determined on T1-weighted MRI scans acquired simultaneously as 64 transaxial, 2.5-mm thick slices using a 1.0 T Magnetom impact scanner (Siemens, Erlangen, Germany) and a three-dimensional sequence.
Positron emission tomography procedures and image analysis
The PET studies were performed on an ECAT EXACT HR scanner (Siemens/CTI, Knoxville, TN, U.S.A.) in three-dimensional data acquisition mode providing 47 contiguous 3-mm slices at 5 mm full width at half maximum in-plane reconstructed resolution (Wienhard et al., 1994). Cerebral blood flow was measured according to the [15O]-H2O intravenous bolus method (Herscovitch et al., 1983) using 60 mCi for each study. However, since arterial blood samples could not be obtained because of the thrombolytic treatment, regional tracer uptake was determined voxel by voxel in gray matter structures of the affected hemisphere, and the respective ratio to the mean of the contralateral hemisphere, expressed as a percentage, was used as relative measure of perfusion.
Using an interactive program (Pietrzyk et al., 1994), the [15O]-H2O PET images were coregistered to the individual MRI volume along the anterior commisure-posterior commisure line, and gray matter regions were defined by individually thresholding the MRI data of the affected hemisphere. The cerebral hemispheres, gray matter infarct, and noninfarcted gray matter then were segmented from the MRI volumes by means of Interactive Data Language (Research Systems, Inc., Boulder, CO, U.S.A.) and C-based image analysis system operating at a spatial resolution of 1 mm3 (von Stockhausen et al., 1996).
Data analysis
Clinical scores. The National Institutes of Health Stroke Scale (NIHSS) (Lyden et al., 1994) was used to quantify the neurologic deficit before thrombolytic therapy and 3 weeks later (Table 1). To assess the effect of treatment on clinical symptoms, a percentage improvement, from the initial NIHSS score to the score after 3 weeks, was calculated according to the following equation:
Therefore, patients with no change had a ΔNIHSS of 0%, and those with full recovery achieved a ΔNIHSS of 100%.
Definition of gray matter compartments in the affected hemisphere. The threshold of severe hypoperfusion in gray matter was operationally set to 50% [15O]-H2O uptake relative to the mean of the contralateral hemisphere. This perfusion level was chosen because in a previous quantitative CBF-PET study of acute ischemic stroke in patients not receiving thrombolytic treatment, it had been shown to correspond to a gray matter blood flow of less than 12 mL/100 g/min (Löttgen et al., 1998), which represents the widely accepted viability threshold (Baron et al., 1984; Powers et al., 1985). Hence, gray matter voxels showing only 50% or less uptake on first measurement were considered critically hypoperfused, whereas gray matter initially exhibiting uptake ratios greater than 50% was regarded as hardly being threatened by infarction. That physiologic classification was combined with morphologic outcome (infarcted, noninfarcted) to obtain two compartments: (1) not critically ischemic and not becoming infarcted; and (2) critically hypoperfused or turning into an infarct according to MRI criteria. Only the latter compartment comprising three subcompartments (all voxels ischemic on initial PET or infarcted on late MRI) was the target region of further analyses.
Clinical and magnetic resonance imaging
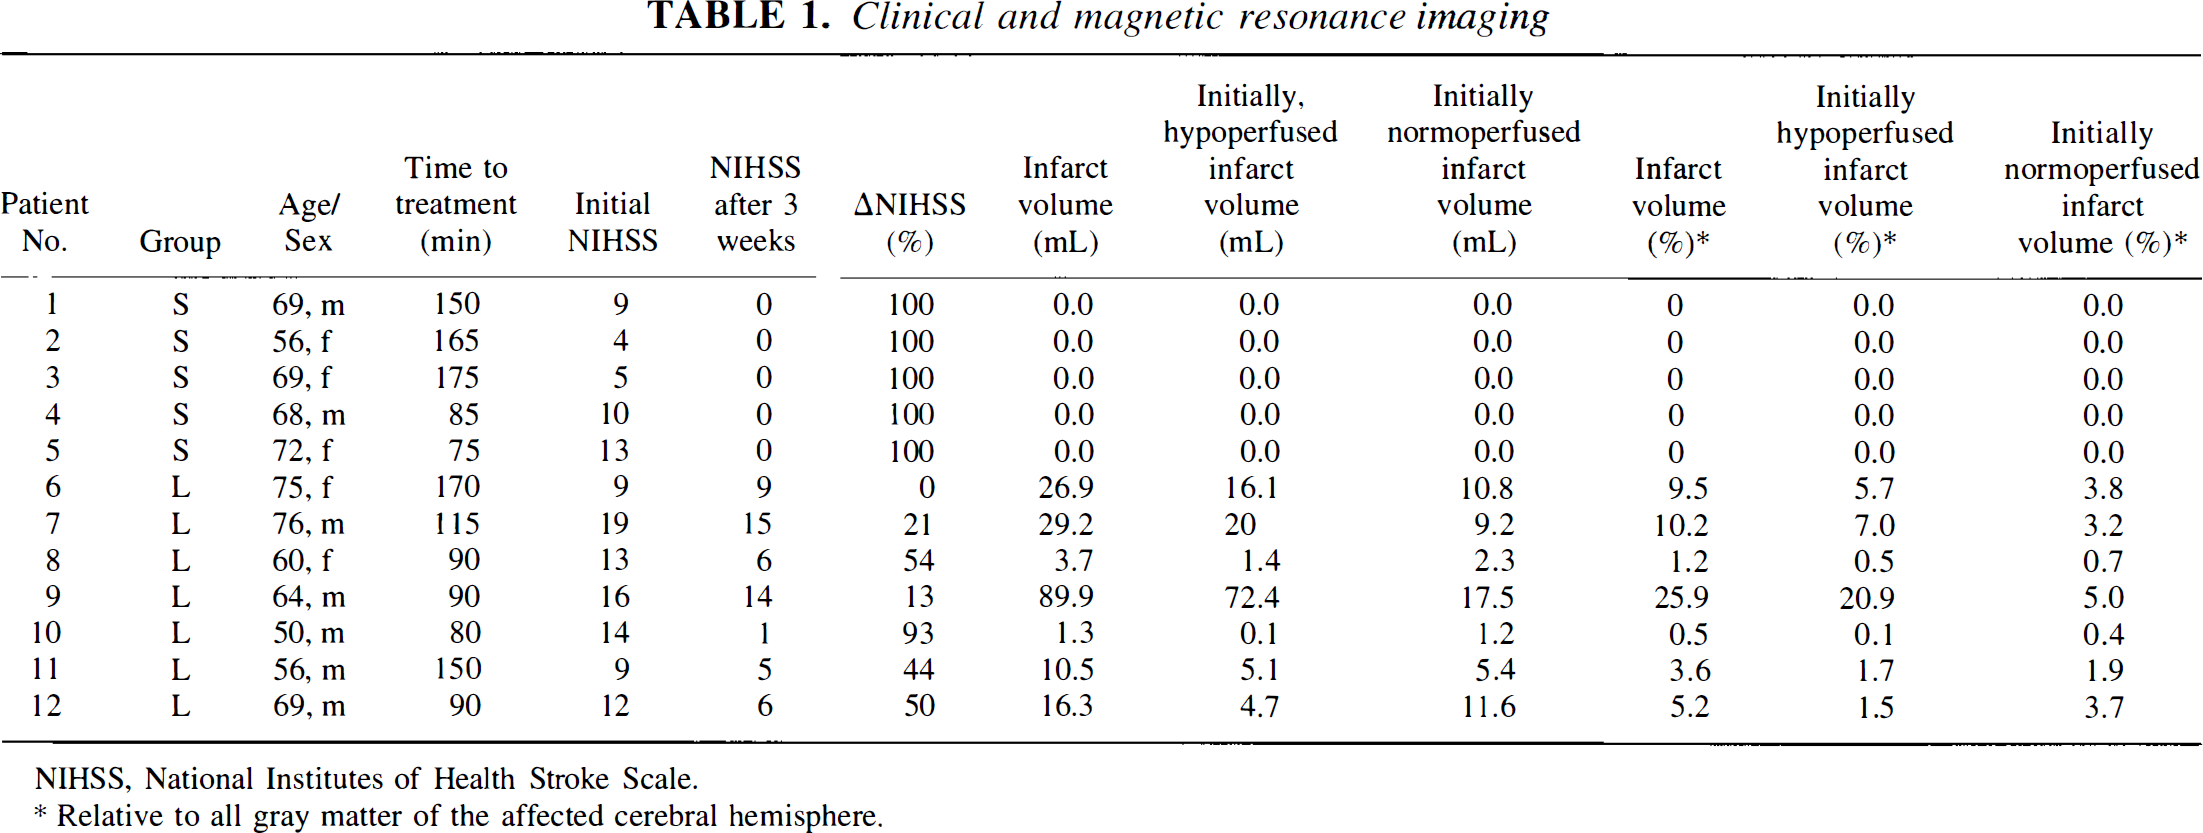
NIHSS, National Institutes of Health Stroke Scale.
Relative to all gray matter of the affected cerebral hemisphere.
Patient grouping. Three eligible patients were excluded from this study for various reasons: one because the initial ischemia demonstrated by PET was restricted to white matter only, one because of reinfarction before MRI, and one because of treatment-related space-occupying hemorrhagic transformation of his infarct, thus avoiding ambiguities of interpretation. Because the size of an infarct is likely related to the severity and spatial extent of the causative ischemia, the remaining 12 patients (5 women, 7 men; median age 68.5 years; range 50 to 76 years) were divided into two groups according to the volume of critically hypoperfused gray matter on their first PET scan: group S (n = 5) exhibiting a small ischemic zone of less than 15 mL (median 10.3 mL; range 0.9 to 14.9 mL), and group L (n = 7) having ischemic areas larger than 20 mL (median 37.2 mL; range 20.5 to 155.3 mL).
Statistics. Because of small sample sizes, nonnormality of the data, and nonlinear relations, descriptive measures are reported as median and range, or Spearman's rho. Likewise, group comparisons were performed using Wilcoxon's signed ranks test, Wilcoxon-Mann-Whitney rank sum tests, or Friedman's rank analysis of variance, as appropriate.
RESULTS
Clinical deficit and infarct size
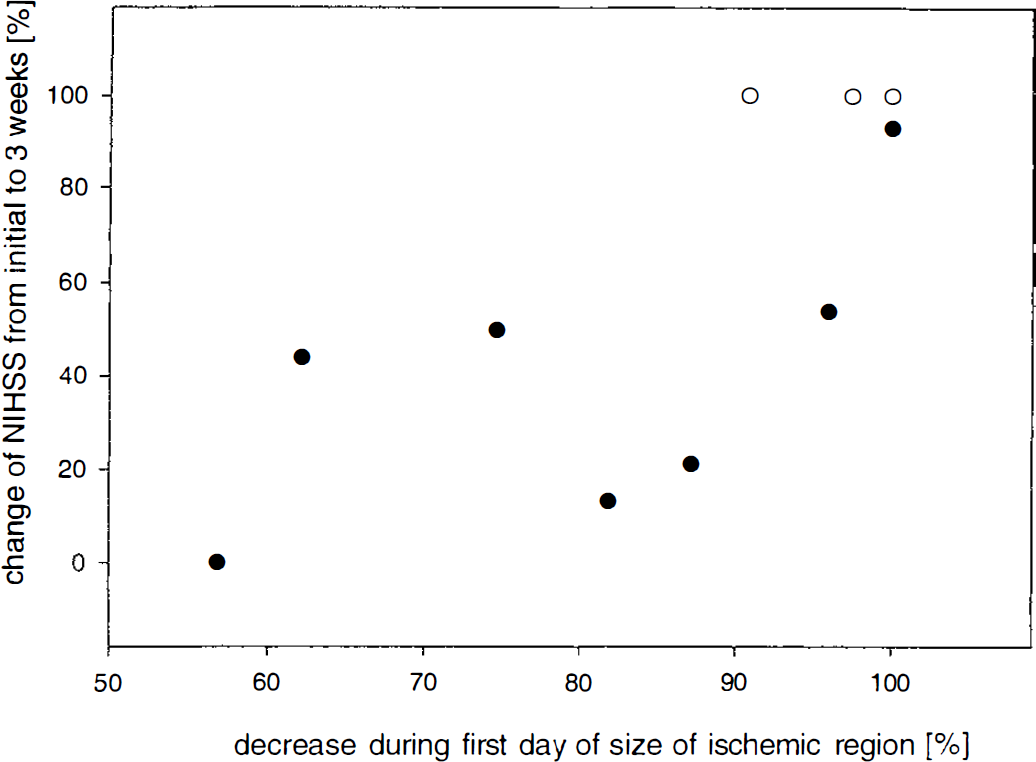
Table 1 summarizes the patients' clinical data together with the time interval between onset of symptoms and beginning of thrombolytic therapy, as well as the clinical deficit score according to the NIHSS, before and 3 weeks after thrombolytic treatment, and the size of gray matter infarction demonstrated by MRI after 3 weeks. The severity of clinical symptoms ranged from slight unilateral weakness or mild aphasia to complete hemiplegia, global aphasia, impairment of consciousness, and gaze deviation. However, although the initial clinical deficit (median NIHSS, 11; range 4 to 19) was not related to the size of the perfusion deficit and therefore did not differ significantly between patient groups S and L, subsequent recovery was significantly (P < 0.005) different and related to the size of the initially hypoperfused tissue. All patients with an initial hypoperfused gray matter volume smaller than 15 mL achieved a ΔNIHSS of 100% and developed no gray matter infarct. Those with larger hypoperfused areas, by contrast (P < 0.005), had infarcts comprising 0.5% to 25.9% (median 5.2%) of all gray matter of the affected hemisphere, and their clinical recovery remained incomplete, with ΔNIHSS ranging from 0% to 93% (median 44%). As expected, after 3 weeks there was a close correlation (rho = 0.96, P < 0.001) between infarct size and clinical deficit (Fig. 1).
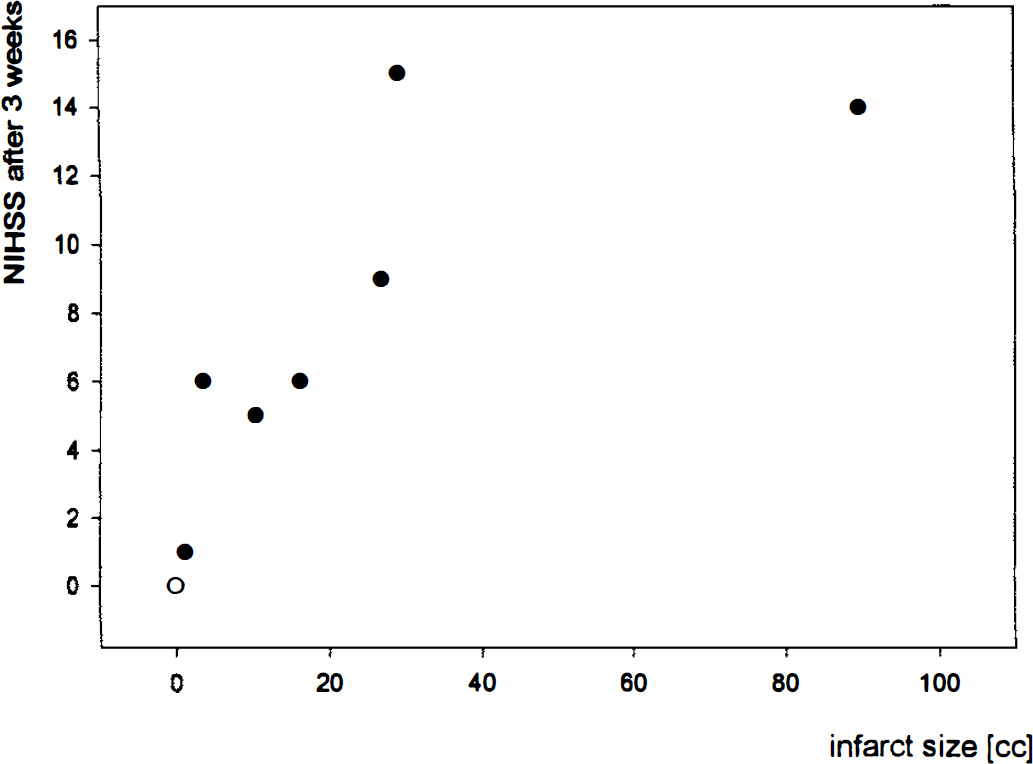
Scatter diagram relating neurologic deficit (National Institutes of Health Stroke Scale [NIHSS]) and size of gray matter infarction on magnetic resonance imaging (MRI) 3 weeks after acute thrombolytic treatment in 12 patients grouped by volume of gray matter initially perfused at levels below threshold of dense ischemia (S, < 15 mL; L, > 20 mL). rho = 0.96, P < 0.001. Four observations hidden at value 0/0. ○ group S; • group L.
Perfusion, infarct, and clinical course
On their first PET measurement, all patients showed marked hypoperfusion in the affected middle cerebral artery territory, as summarized in Table 2. In group S, the critically ischemic gray matter region averaged 2.9% (range 0.4% to 4.9%) of all gray matter of the affected hemisphere. In group L, on average, 11.8% (range 6.6% to 44.7%) were perfused at rates below the threshold, but only a fraction averaging less than one fourth (range 0.8% to 68.7%) of that tissue eventually became infarcted. Therefore, with reference to all gray matter of the affected hemisphere, only 1.7% (range 0.1% to 20.9%) initially showed dense ischemia and became infarcted, whereas 3.2% (range 0.4% to 5.0%) turned into infarction, despite initial perfusion above the threshold of critical ischemia (Table I). In contrast to that relative lack of spatial congruence, overall there was a significant relation (rho = 0.82, P < 0.001) between the size of the initial volume of critically hypoperfused gray matter and of the resulting infarct, but more detailed graphic analysis (Fig. 2) also suggested a shift away from the identity line toward larger volumes of ischemic tissue.
Gray-matter perfusion of target region
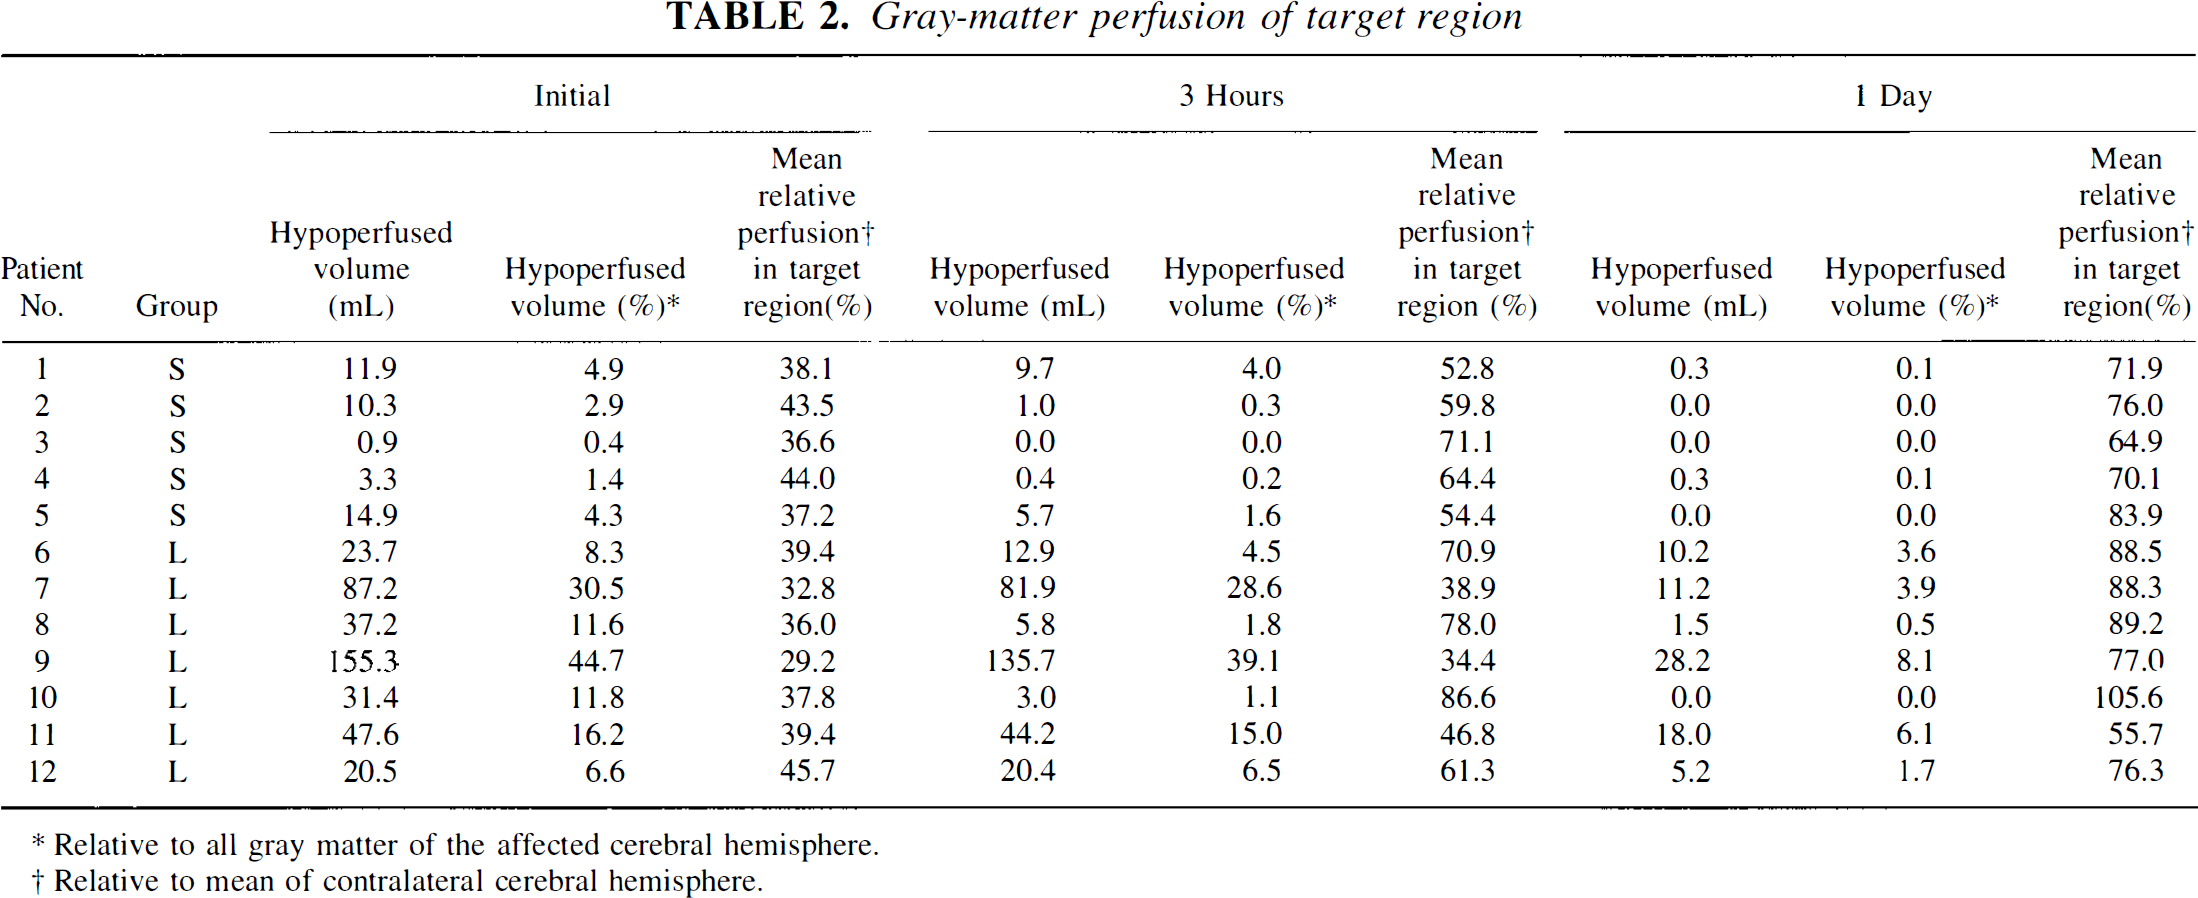
Relative to all gray matter of the affected cerebral hemisphere.
Relative to mean of contralateral cerebral hemisphere.
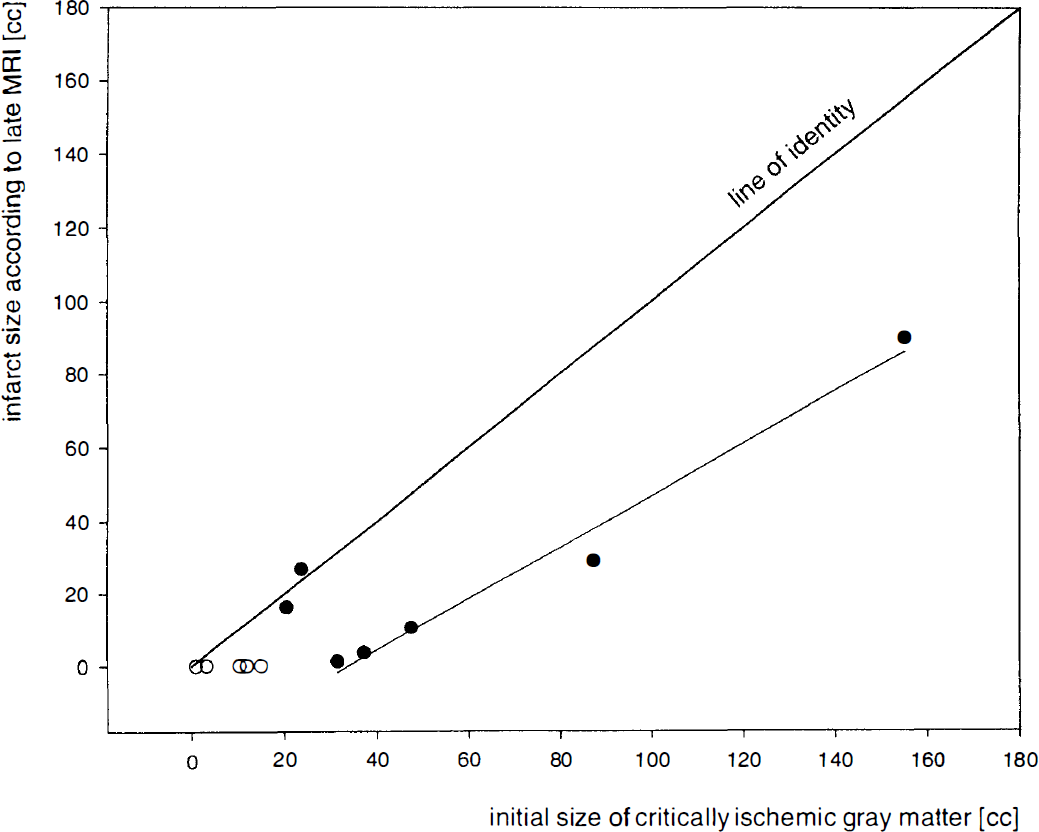
Scatter diagram relating volume of infarcted gray matter according to late MRI and initial volume of gray matter perfused at levels below threshold of dense ischemia. rho = 0.82, P < 0.001. Beside the line of identity, notice the regression line based on five cases with minimized infarcts. ○ group S; • group L.
In the initially ischemic or subsequently infarcted region of interest, at neither PET measurement was a significant difference in mean perfusion found between eventually preserved and infarcted voxels. As illustrated in Fig. 3, averaged across all voxels in the target region, sooner or later during the PET observation period, all patients showed significant (P < 0.0001) reperfusion. However, its degree and spatial extent were so variable as to prohibit analysis by groups. In individual cases, blood flow at second PET was at normal levels or there even was focal hyperperfusion (Fig. 4); in other cases, treatment restored blood flow to only part of the previously ischemic region, thus reducing its size (Fig. 5). Therefore, 1 day after the ictus, in all patients, an average of 93.4% of all voxels in the target region were reperfused at levels above the critical threshold (P < 0.001), but that percentage was significantly (P < 0.025) different in group S (median 100%; range 90.9% to 100%) and L (median 81.8%; range 57.0% to 100%).
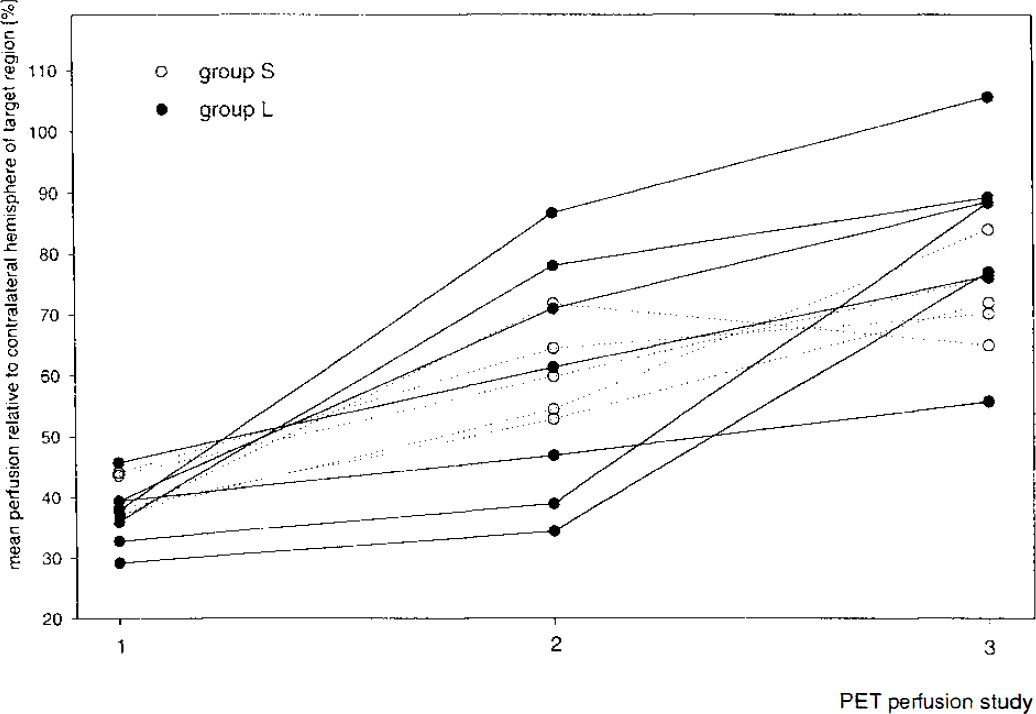
Mean relative perfusion of target region (gray matter initially hypoperfused at levels below 50% threshold or becoming infarcted) before (positron emission tomography [PET] 1) and approximately 2 hours after the end of rt-PA infusion (PET 2), and after the first day (PET 3), showing similar blood flow behavior of patients with smaller or larger hypoperfused areas on first measurement.
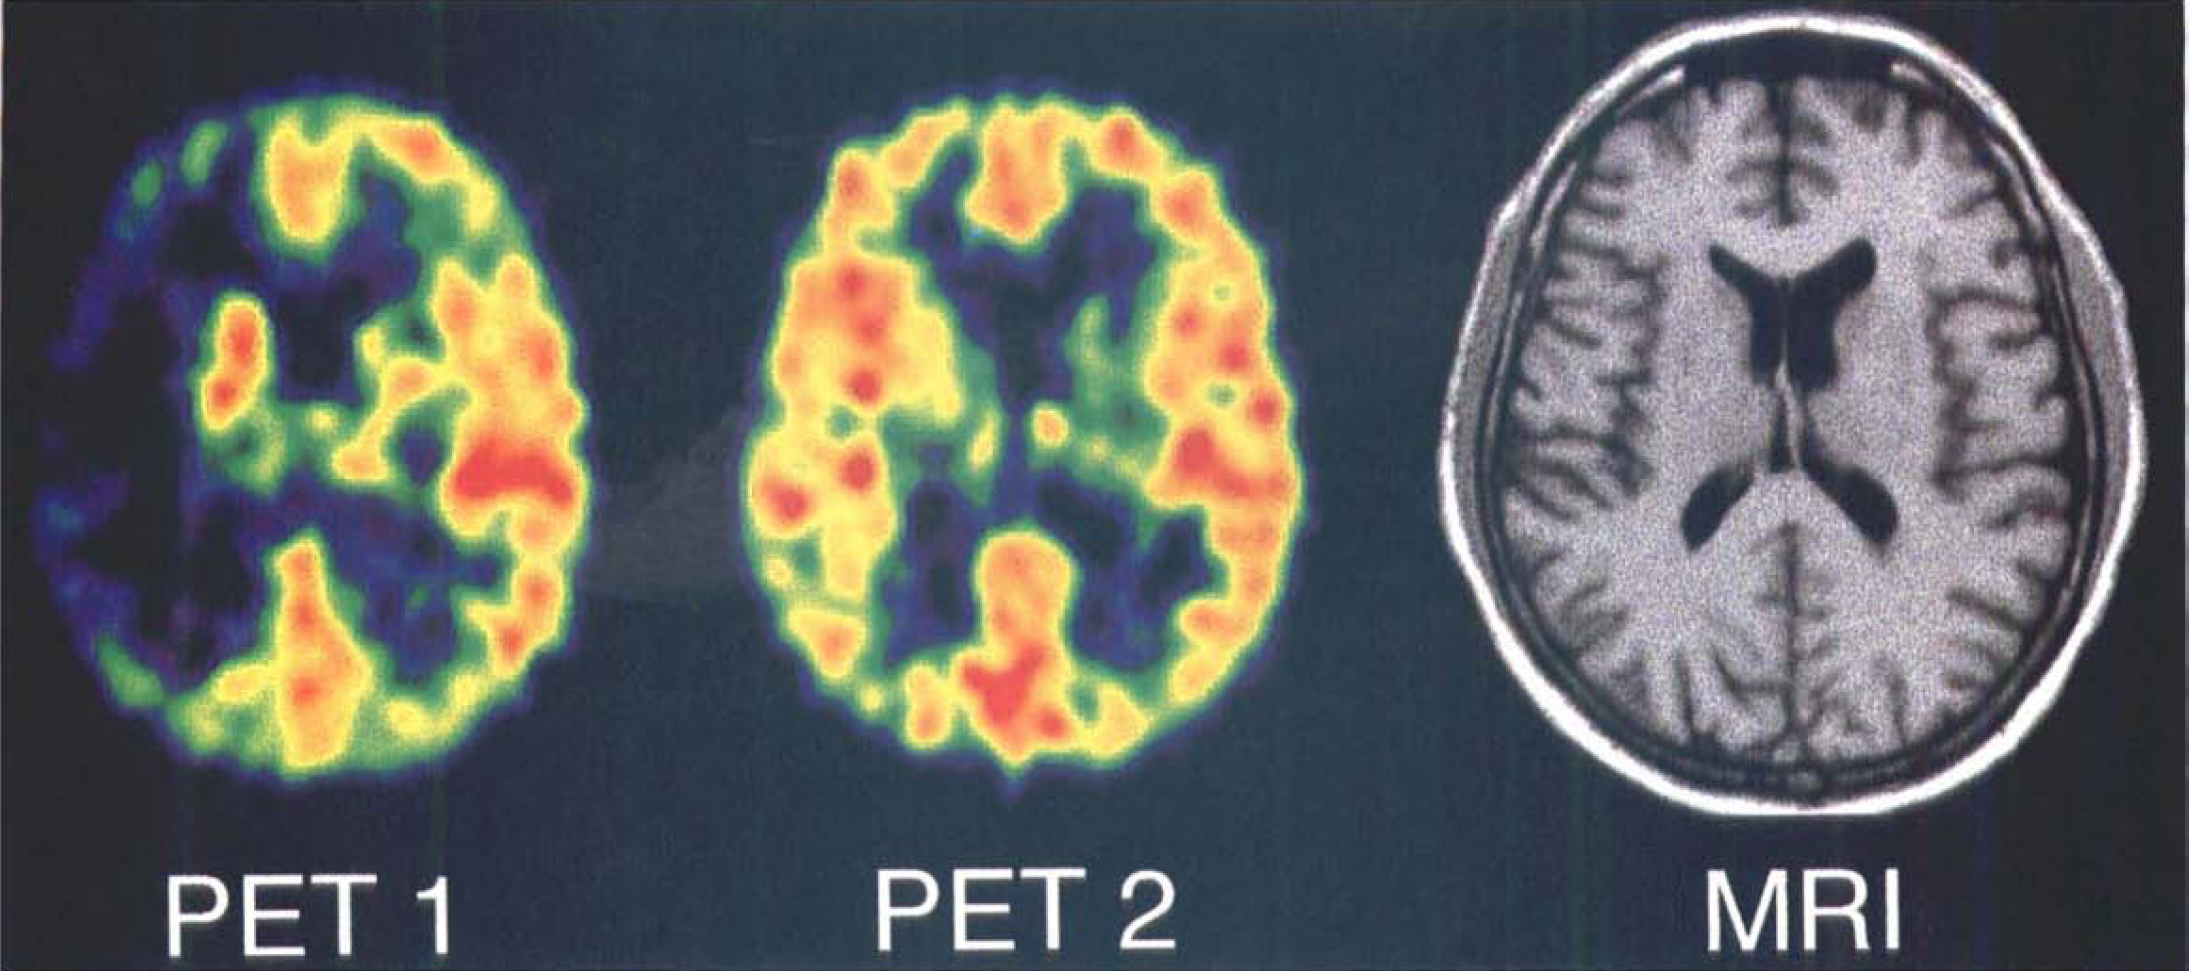
Initial (PET 1) and 3-hour (PET 2) transaxial [15O]-H2O PET images, and corresponding late T1-weighted MRI scan across the center of ischemia of Case 10, showing rapid restoration of blood flow to ischemic area, or even mild hyperperfusion of right insular cortex and only minor infarction of ipsilateral putamen.
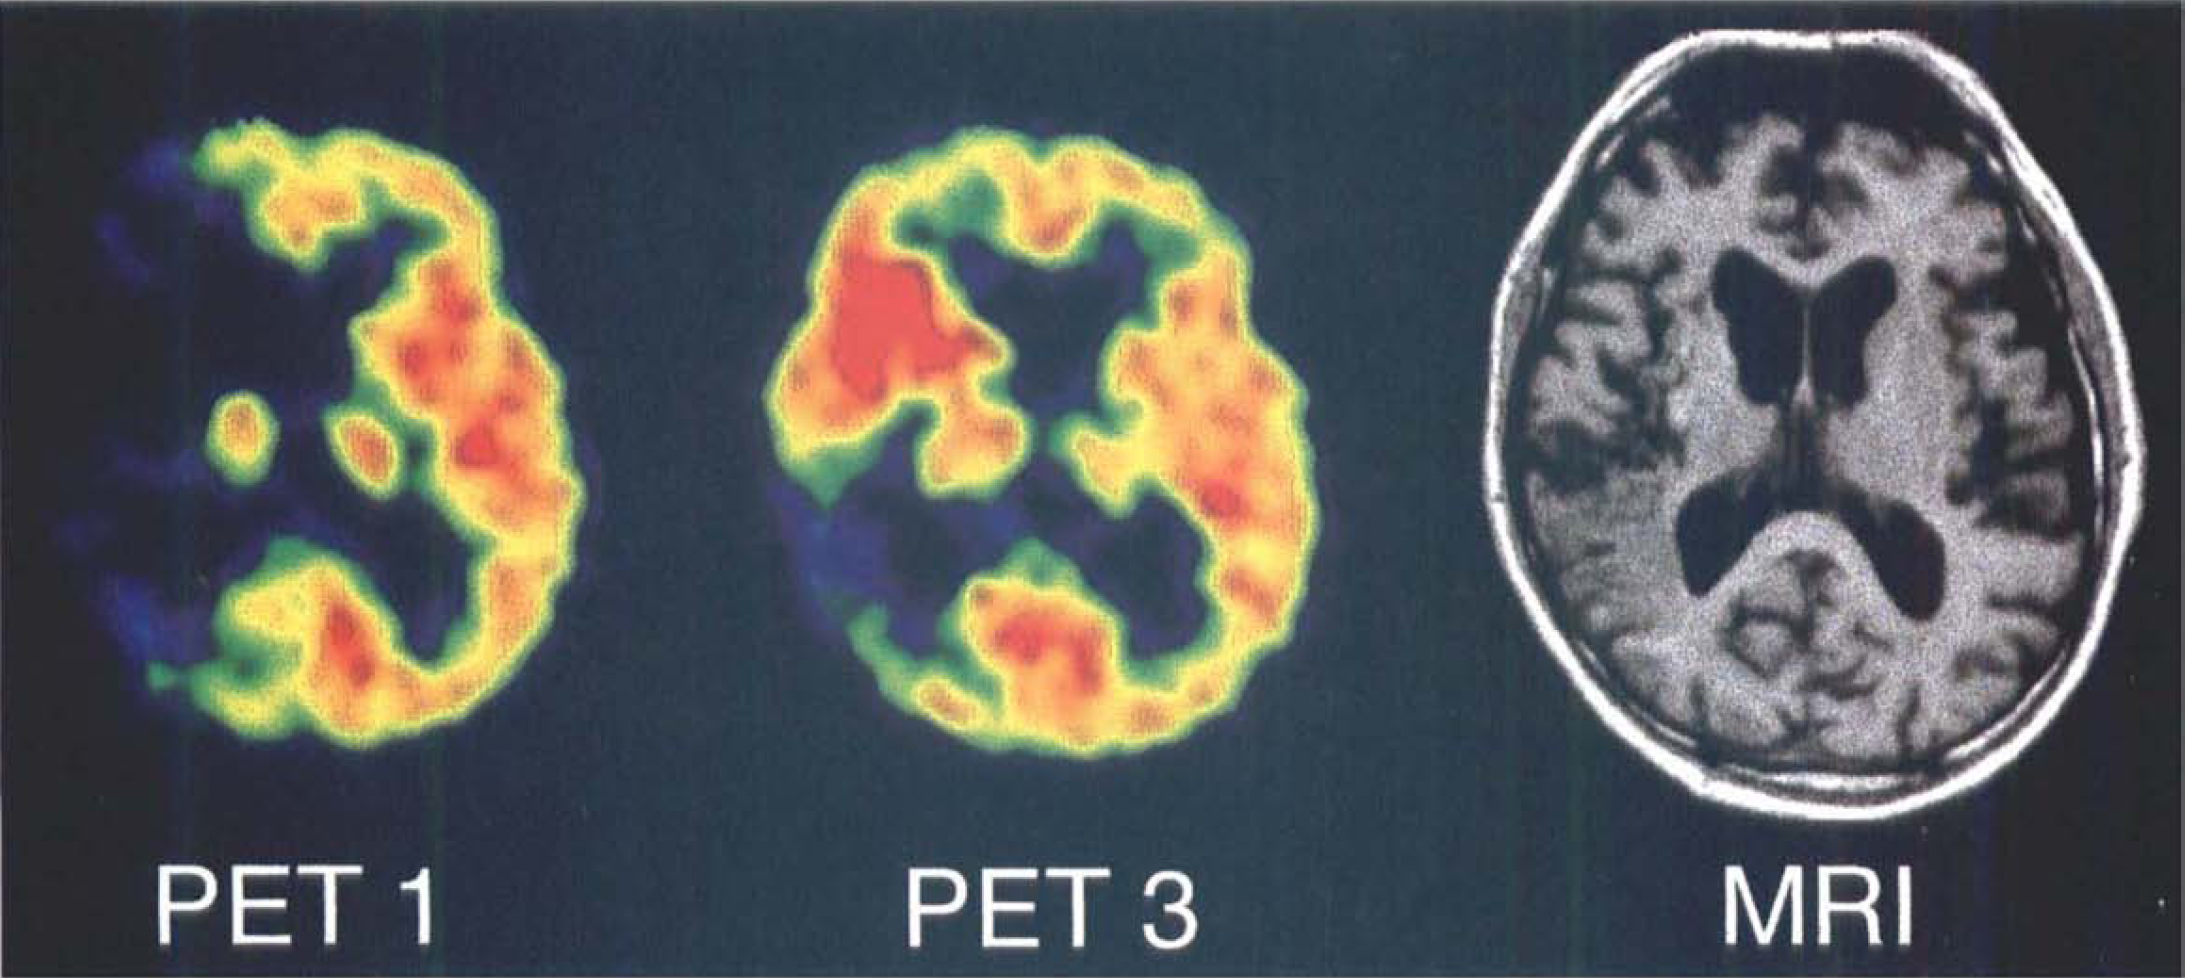
Initial (PET 1) and 1-day (PET 3) transaxial [15O]-H2O PET images, and corresponding late T1-weighted MRI scan across center of infarction of Case 7, showing spatially limited luxury reperfusion in territory of anterior branches of right middle cerebral artery and large temporal—parietal infarct with some hemorrhagic transformation in the border zone.
The hypothesis that early reperfusion to critically hypoperfused regions improves clinical outcome was tested by correlating the change of critically hypoperfused gray matter volume from first to third PET study (before and after thrombolysis), with the change of clinical score during the first 3 weeks after stroke (ΔNIHSS). That analysis revealed a significant relation (rho = 0.82; P < 0.01) between clinical course and extent of reperfusion (Fig. 6).
Scatter diagram relating improvement, from initial assessment to 3 weeks, of neurologic deficit (NIHSS) and percentage decrease in size on the day of acute thrombolytic treatment of gray matter region perfused at levels below threshold of dense ischemia in patient groups S and L. rho = 0.82, P < 0.01. Two observations hidden at value 0/0. ○ group S; • group L.
The different patterns of initial hypoperfusion and final infarcts can be demonstrated in individual patients, when the volumes of ischemic gray matter are coregistered to the final MRI showing the infarct well demarcated. On reconstructed images permitting views in three planes and also from the surface of the brain, the portions of initially hypoperfused tissue eventually turning into infarction can be distinguished from morphologically preserved areas. In Case 9 (Fig. 7), more than half of the initially hypoperfused gray matter turned into infarction and clinical outcome was poor (NIHSS after 3 weeks, 14). In Case 10 (Fig. 8), all of the critically ischemic cortical tissue was effectively reperfused. After 3 weeks, his recovery from severe hemiparesis (initial NIHSS, 14) was complete except for a minimal facial weakness (NIHSS, I), and MRI indicated some ischemic changes only of his right putamen.
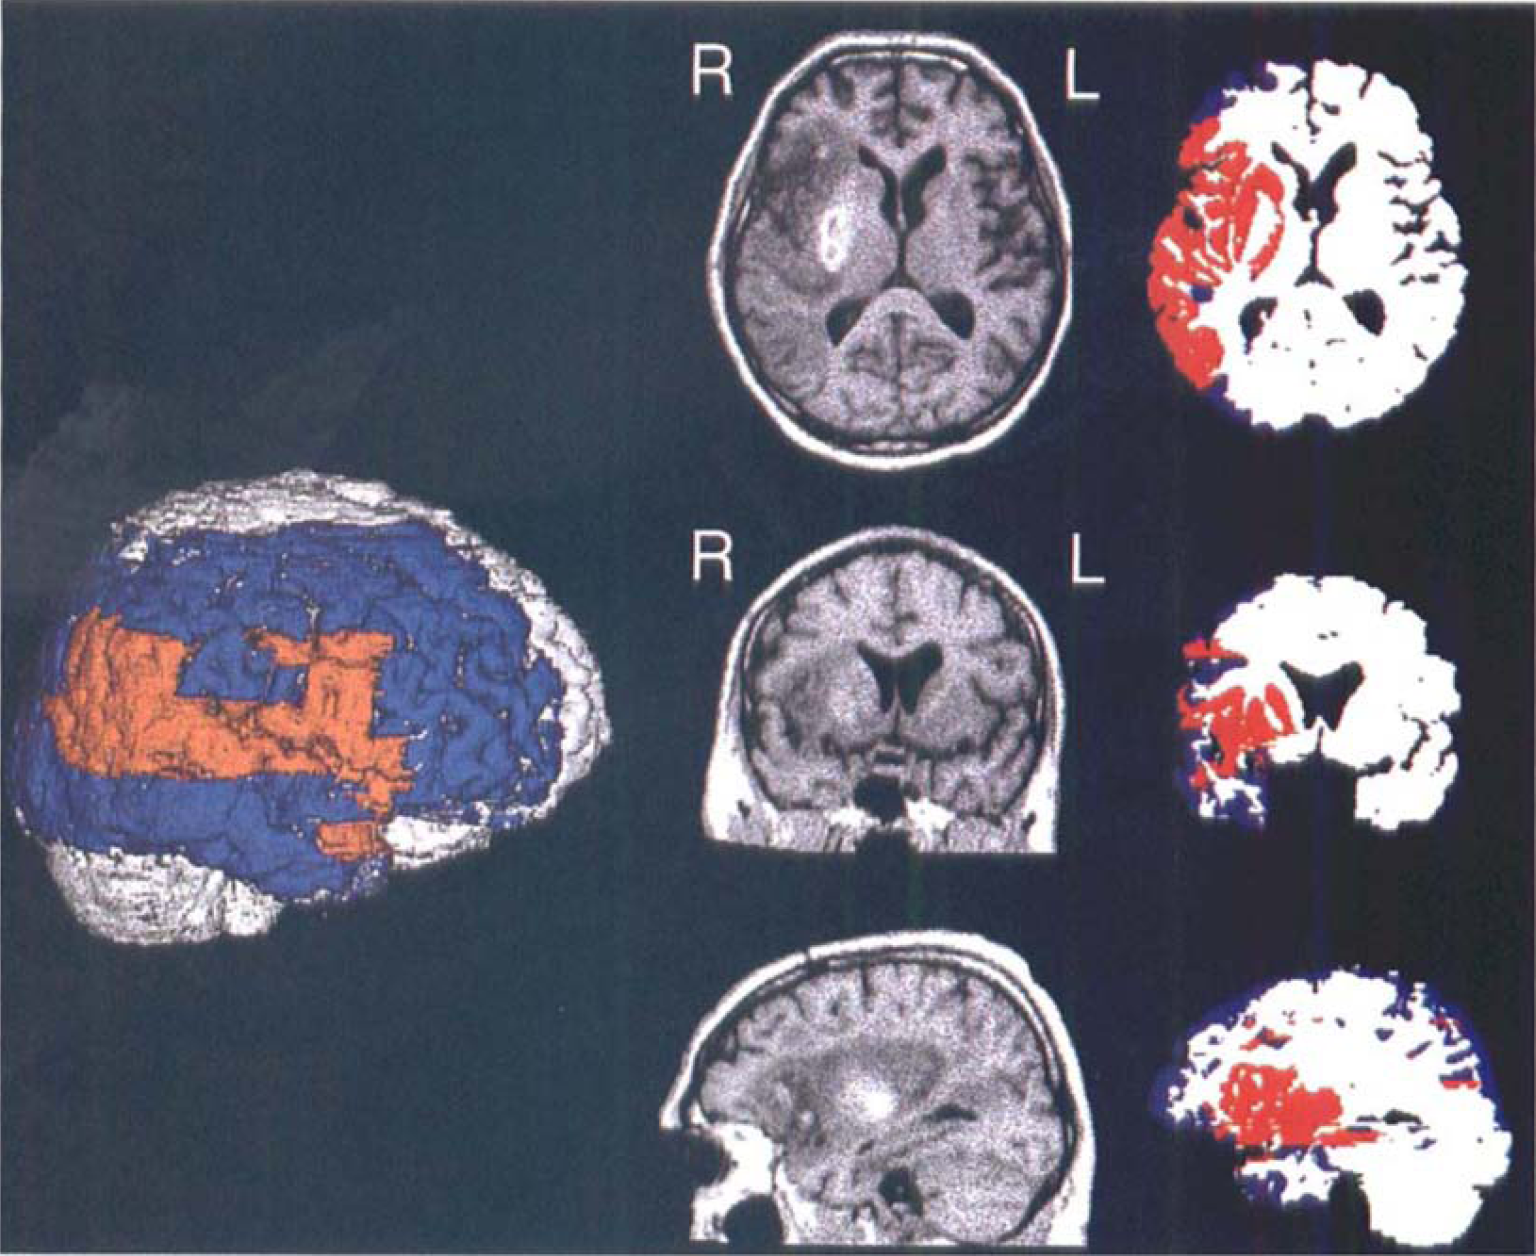
Case 9. The MRI brain surface reconstruction (slightly rotated right lateral view) and superimposed target region (red, infarct; blue, initially hypoperfused at levels below threshold of critical ischemia). Image triplets represent orthogonal T1-weighted MRI or coregistered segmented PET sections across the center of infarction.
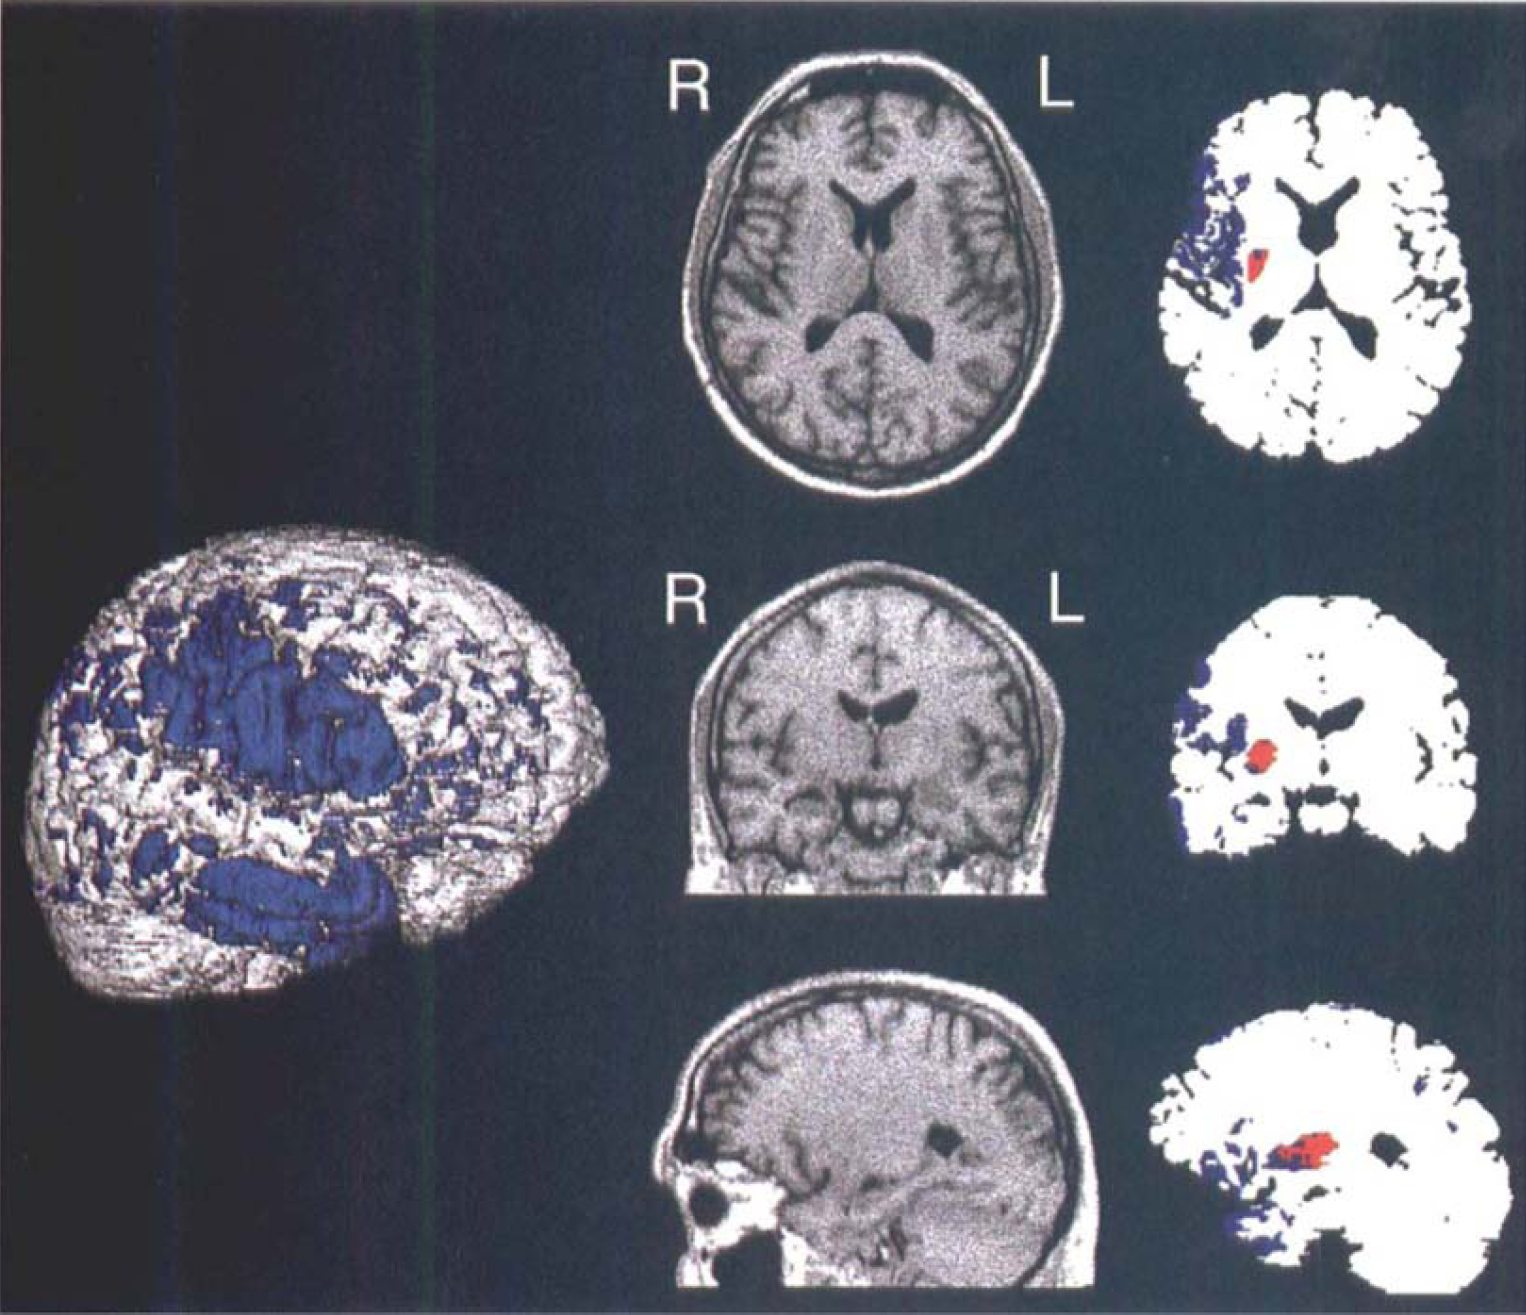
Case 10 (same as in Fig. 4). The MRI brain surface reconstruction (slightly rotated right lateral view) and superimposed distribution of cortical voxels initially hypoperfused at levels below threshold of critical ischemia (blue). Image triplets shown as in Fig. 7. Notice the small subcortical gray matter infarction (red).
DISCUSSIONS
In patients with acute ischemic stroke, CT is the first diagnostic step (Adams et al., 1994) to rule out other pathologies such as intracranial hemorrhage, tumors, or inflammatory diseases, and early hypodensity predicting a large infarct with poor clinical outcome (von Kummer et al., 1994, 1997; Toni et al. 1995, 1996). When thrombolytic therapy is initiated within 3 hours of onset of stroke symptoms, CT cannot sharply discriminate between patients who will benefit or experience additional damage from this treatment. As recently pointed out (Fieschi et al., 1996), imaging of abnormalities of perfusion and metabolism that precede the structural changes visible on early CT is better suited for the identification of ischemic tissue in early stroke, and thus also for demonstration of the effect of thrombolysis.
Functional imaging studies of early stroke have mainly used single photon emission computed tomography (SPECT) to detect perfusion deficits (Alexandrov et al., 1996). Those studies implied a relation between early blood flow changes and long-term clinical outcome or the development of severe edema and hemorrhagic transformation (Giubilei et al., 1990; Hanson et al., 1993; Overgaard et al., 1993; Ueda et al., 1994; Baird et al., 1996). Effects of acute treatment were followed only in a few cases: some of the patients, in whom reperfusion achieved by thrombolytic treatment could be demonstrated, had a favorable clinical outcome (Herderschee et al., 1991; Ezura et al., 1996), whereas no treatment effect on perfusion usually was associated with poor prognosis. Furthermore, severe hypoperfusion (less than 35% of contralateral reference region or of cerebellum) predicted hemorrhagic complications (Ezura et al. 1996; Ueda et al., 1994) or evolution of severe edema and tentorial herniation (Herderschee et al., 1991). When blood flow exceeded a critical value of 70% of the contralateral region, outcome was favorable, without development of infarction, irrespective of the degree of recanalization (Ezura et al., 1996).
A different perfusion range, at which recanalization achieved by intra-arterial thrombolytic treatment within 3.5 to 7.25 hours of onset of stroke can save ischemic tissue, was semiquantitatively determined by Sasaki and colleagues (1996) using [99mTc]HM-PAO SPECT: reperfusion significantly reduced the likelihood of infarction in those regions where isotope uptake was decreased to values between 65% and 85% of the contralateral side, whereas it was without effect in areas with lower uptake before treatment. Regions with higher residual perfusion recovered, irrespective of the success of recanalization. Grotta and Alexandrov (1998) recently reported on the effect of rt-PA on blood flow determined by HMPAO-SPECT in a small cohort selected from the NINDS study. In this controlled study, significantly greater reperfusion occurred in the rt-PA—treated than in the placebo group. All of the SPECT studies used a region-of-interest analysis, but coregistration of early perfusion to late morphologic images was not attempted. Therefore, the volumes of brain tissue rescued by reperfusion could not be determined. It was also beyond the scope of those studies to assess the extent of reperfusion after efficacious thrombolysis as opposed to treatment failures.
Special MRI techniques capable of detecting critically hypoperfused tissue from the differences between perfusion and diffusion-weighted images (Warach et al., 1992, 1995; Welch et al., 1995) may distinguish reversible from irreversible ischemic injury (Hasegawa et al., 1994), but they await broader clinical application (Warach et al., 1997). Therefore, PET continues to be the only validated functional imaging modality permitting visualization of irreversibly damaged tissue in early ischemia (Baron et al., 1984; Powers et al., 1985) that also is able to detect viable but misery perfused tissue that can be followed over time (Wise et al., 1983; Hakim et al., 1989; Heiss et al., 1992). The latter penumbral tissue was repeatedly shown to not necessarily turn into infarction, but to recover function and maintain morphologic integrity in some cases (Heiss et al., 1993; Furlan et al., 1996). Quantitative, multitracer PET studies, therefore, appear ideal to prove the efficacy of therapeutic strategies intended to protect tissue threatened by ischemia. However, their application is limited by complex logistics, thus preventing around-the-clock service. Moreover, they require lengthy procedures that are not commensurate with acute interventional treatment, and conventional quantitation requires arterial blood sampling that is contraindicated in systemic thrombolysis. Therefore, minimally invasive procedures are needed that can be executed rapidly, without interference with therapeutic regimens. The [15O]-H2O bolus injection PET method (Herscovitch et al., 1983) comes closest to those requirements, when perfusion is assessed semiquantitatively using relative tracer uptake values. From the latter data, the flow values in ischemic gray matter could be estimated in our study by reference to a calibration curve obtained from quantitative CBF measurements in a distinct group of patients with acute ischemic stroke who did not receive thrombolytic therapy (Löttgen et al., 1998). That way, critical hypoperfusion could be operationally defined: tracer uptake of 50% of the mean of the contralateral hemisphere was equivalent to 8 to 12 mL/100 g/min and represented CBF at the viability threshold of gray matter (Baron et al., 1984;Powers et al., 1985). This procedure allowed the assessment of perfusion before thrombolytic therapy within 3 hours of onset of stroke, thus making possible the study of tissue compartments selected on grounds of their residual flow and finally infarcted or preserved gray matter structures.
The results clearly demonstrate that clinical outcome and infarct size are correlated. Both depend on the initial spatial extent rather than the depth of critical ischemia and also on the proportion of gray matter that is effectively reperfused. This study was not designed to yield statistically convincing proof of the efficacy of thrombolytic therapy, since only a few patients could be entered and there is no control group. Such evidence must be derived from large, controlled, multicenter trials (NINDS, 1995; Hacke et al., 1995). Our study, however, supports the results of those clinical trials and extends the recent observation of Grotta and Alexandrov (1998) by identifying the portions of compromised tissue that become reperfused and do not proceed to infarction. Remarkably, although patient subgroups could not be distinguished by the severity of their initial clinical deficit, the size of the critically ischemic area on first PET scan was an excellent predictor of infarct size 3 weeks later and, likewise, of the neurologic deficit at the postacute stage, whereas reperfusion occurred to some portions of the hypoperfused tissue in all cases. Clearly, patients with small volumes of ischemic gray matter fared better than those with large ischemic lesions. However, contrary to the expectation derived from previous PET studies of the natural history of acute stroke, whereas two thirds either had no persistent morphologic damage (three in group S) or developed infarcts that were much smaller than predicted (five group L), only one third of the patients (two in group S, two group L) eventually showed either no lesion or infarcts that were almost congruent with the initial area of severe ischemia. Since patients with small and large ischemic areas, respectively, achieved similar levels of reperfusion of their target regions within 1 day of thrombolytic therapy, suggesting a similar efficacy of reperfusion, both groups showed comparable improvement of their absolute clinical scores. However, for group S patients, this meant full clinical recovery, and, therefore, their percentage change was significantly better. Conversely, the clinical improvement observed during the first 3 weeks after thrombolytic treatment was accurately predicted by the relative change in size of the critically hypoperfused area measured on the first day.
The design of our study does not permit conclusive recommendations as to the selection of patients who might benefit from thrombolytic therapy. Because of the semiquantitative nature of the perfusion values and the wide scatter of the time intervals between onset of symptoms and beginning of treatment or PET study, a correlation between residual CBF and duration of ischemia, as was established in animal experiments (Heiss and Rosner, 1983), cannot be derived from the current results. Such a relation is further obfuscated by the varying delays between initiation of rt-PA infusion and recanalization of occluded vessels, which again differed from patient to patient and between different regions within an ischemic territory. Even with intra-arterial administration of thrombolytic agents, it usually takes 2 hours before all branches of an occluded artery are recanalized (Zeumer et al., 1993), and this time interval may be prolonged with systemic intravenous infusion (von Kummer and Hacke, 1992). As was shown in animal experiments with transient occlusion of the middle cerebral artery (Young et al., 1996; Heiss et al., 1997), small changes in residual perfusion and oxygen supply during ischemia have a significant impact on the probability of tissue survival after reperfusion and on final clinical outcome. Depending on the level of residual flow, infarcts may grow for up to several days after vascular occlusion (Touzani et al., 1995). But contrary to a purely experimental setting, highly accurate measurements cannot be obtained under conditions of a clinical emergency. However, blood flow, no matter how important its level may be initially, clearly is not the only parameter predicting the ultimate fate of the tissue at some points in time after the initial ischemic attack. Even our data indicate some growth of infarction into initially nonischemic areas, as expressed in the portion of the final infarct that was not hypoperfused on first measurement, occurring concurrent with the shrinkage of hypoperfused areas. This reflects the complex metabolic and molecular mechanisms involved in the propagation of ischemic tissue damage continuing even after reperfusion. However, as long as quantitation of several variables is not feasible with the required precision, CBF measurements at defined points in time after acute stroke can be helpful in selecting patients who will benefit from thrombolytic therapy and for excluding those in whom thrombolysis is likely to be ineffective or dangerous. In stroke victims for whom thrombolytic treatment is not recommended (Quality Standards Subcommittee, 1996), the assessment and follow-up of initially hypoperfused and ischemically compromised tissue can be helpful in the evaluation of ancillary or alternative regimens of neuroprotection (Dorman et al., 1996) that may restrict the size of final infarcts by using extended therapeutic windows (Baron et al. 1995) and thus improving clinical outcome.