
Abstract
The effect of thrombolytic therapy on metabolic changes was studied in rats submitted to thromboembolic stroke. Reperfusion was initiated at three different time points, 1.5, 3, and 4.5 hours after embolism (n = 3 each), by injection of recombinant tissue-type plasminogen activator (rt-PA). Recovery was observed during 5 hours of reperfusion using perfusion-weighted images and a two-dimensional 1H magnetic resonance spectroscopic imaging (MRSI) technique. Temporal evolution of the cerebral metabolites lactate and N-acetyl-aspartate (NAA) was determined. To analyze the chances of metabolic tissue recovery, the outcome of treatment, defined by a reversal of lactate concentration, was compared with the lactate intensity before treatment. In untreated animals (n = 4), clot embolism resulted in a drop of perfusion signal intensity in the occluded hemisphere followed by an increase of lactate concentration and a decrease of NAA that persisted throughout the observation period. Thrombolysis partially restored blood flow, but the mean lactate concentration decreased only slightly after successful lysis in animals treated 1.5 hours after embolism. If treatment was initiated later, no decline of lactate level was observed. Five hours after initiation of thrombolysis, the average tissue lactate amounted to 95 ± 6, 111 ± 17, and 139 ± 60% of the early ischemic value (40 minutes after embolization) if treatment began 1.5, 3, and 4.5 hours after embolism, respectively. The NAA level declined slightly but never showed a recovery after rt-PA treatment. In individual pixels, the probability of metabolic tissue recovery clearly declined with increasing lactate concentration before thrombolysis. Interestingly, this probability was independent of treatment delay, but the number of pixels with low lactate declined with increasing ischemia time. Potential clinical applications of MRSI include monitoring of therapeutic intervention as well as support for prognosis of outcome after rt-PA treatment.
Keywords
The major risks of thrombolytic therapy of stroke are hemorrhagic complications (Wardlaw et al., 1995). Thus, thrombolytic treatment should be limited to those cases in which tissue viability is preserved. Efforts have been undertaken to establish predictive values that provide information about the reversibility of the ischemic lesion (Welch et al., 1995). However, such “signatures” are difficult to establish because the outcome of an ischemic insult depends not only on the severity of ischemia but also on postischemic events that may either aggravate or reverse the primary pathological impact.
For the early detection of ischemic brain lesions, diffusion-weighted images are highly sensitive (Moseley et al., 1990). Perfusion-weighted images can detect areas with compromised cerebral blood flow (Detre et al., 1994). In addition, magnetic resonance spectroscopy is being developed to provide functional and metabolic information about the ischemic brain (Berkelbach van der Sprenkel et al., 1988; Bruhn et al., 1989). Lactate is shown to be increased in ischemic brain regions (Berkelbach van der Sprenkel et al., 1988; Henriksen et al., 1992; Fenstermacher and Narayana, 1990; Bruhn et al., 1989; Graham et al., 1992) and the N-acetyl-aspartate (NAA) signal to be depleted in infarcted tissue (Bruhn et al., 1989). Therefore, magnetic resonance spectroscopy may provide a means of distinguishing irreversibly damaged tissue from tissue that is still viable but at risk of infarction. However, magnetic resonance spectroscopic imaging (MRSI) (Brown et al., 1982) has an important advantage over nuclear magnetic resonance spectroscopy volume localization techniques: Magnetic resonance spectroscopic imaging simultaneously records spectra from multiple regions, allowing the detection of regions with different degrees of metabolic injury before reperfusion.
In the present investigation, we analyze the relationship between severity and duration of ischemia, quality of reperfusion, and postischemic metabolic recovery in an experimental model of clot embolism in rats. Animals were treated with the recombinant tissue-type plasminogen activator (rt-PA) after different delay times after embolization. The use of perfusion-weighted imaging and MRSI permitted the characterization of the regional evolution of both the pre- and the posttreatment alterations in perfusion and metabolism. Alterations of lactate and NAA concentration before thrombolysis were correlated with recovery after treatment. The purpose of this study was to investigate the probability of metabolic tissue recovery after thrombolytic intervention to establish magnetic resonance parameters that are able to predict metabolic recovery.
MATERIALS AND METHODS
Animal preparation
Animal handling and surgery were performed in accordance with animal protection guidelines and approved by local authorities.
Male Sprague-Dawley rats (n = 13; body wt 350 to 400 g) were anesthetized with 1.5% halothane in a 70:30% mixture of N2O/O2. The animals were tracheotomized, immobilized with pancuronium bromide (0.3 mg/kg/h intravenously), and mechanically ventilated for the whole duration of the experiment. Catheters were inserted in the right femoral artery and vein for blood sampling, blood pressure recording, and intravenous infusion of drugs.
After surgical preparation, halothane concentration was reduced to 0.8%, and animals were placed in a stereotaxic plexiglass head holder for accurate positioning inside the bore of the 4.7 T magnet. Physiological monitoring was performed throughout the experiment. Arterial blood pressure was continuously recorded, and arterial blood samples were taken at regular intervals to measure blood gases, plasma glucose, and hematocrit. A rectal temperature probe was connected to a feedback-controlled water blanket covering the body of the animal. Body temperature was kept constant at 37°C throughout the experiment.
Thromboembolic stroke was induced using a modification (Busch et al., 1998) of the method described by Overgaard et al. (1992). The right internal carotid artery was cannulated and rinsed with saline. The common carotid, the pterygopalatine artery, and the external carotid artery were permanently occluded. Embolization was performed by injection of 10 autologous blood clots [diameter and length 0.35 and 1.5 mm, respectively (Busch et al., 1998)] through the catheter into the right internal carotid artery, resulting in obstruction of the right middle cerebral artery (MCA). Animals were divided into one untreated (n = 4) and three treated (n = 3 each) groups. The animals in the untreated group received an infusion of 2 mL of saline 3 hours after embolization, intraarterially over 1 hour, through the catheter into the internal carotid artery; these served as a control group. Treated animals received an intracarotid infusion of 10 mg/kg human rt-PA (Actilyse; Boehringer Ingelheim, Germany) dissolved in 2 mL of distilled water. Thrombolysis was started after different delays (1.5, 3, and 4.5 hours) between embolization and treatment initiation. Embolization and treatment were performed inside the magnet.
Nuclear magnetic resonance experiments
Magnetic resonance experiments were performed using a 4.7 T Biospec MSL X-11 experimental scanner (Bruker Medical GmbH, Ettlingen, Germany) with a 30-cm-bore magnet and actively shielded gradient coils (100 mT/m; rise time < 250 μs
For characterization of the tissue perfusion status during occlusion of the MCA and after treatment, single-slice perfusion-weighted images through the center of the MCA territory were recorded. An arterial spin-tagging technique (Detre et al., 1994) was combined with snapshot FLASH (fast low-angle shot) imaging (Kerskens et al., 1996) using the following parameters: echo time = 3.5 ms, repetition time = 7.4 ms, field of view = 40 mm, slice thickness = 2 mm, matrix = 128 × 64, averages = 8, total scan time = 1.3 min. Qualitative perfusion-weighted images were obtained by subtraction of the acquisitions with and without adiabatic spin inversion.
Spectroscopic imaging was achieved using a combination of localized excitation and phase-encoded acquisition. Phase-encoding gradients with 16 × 16 steps were applied over a field of view of 20 × 20 mm, resulting in an in-plane resolution of 1.25 × 1.25 mm2. A rectangular region within the rat brain was selected, encompassing the caudate putamen, the hypothalamus, and the lateral cortex in both hemispheres but excluding extracranial muscle and subcutaneous fat. The selected region was +10 × 6 mm in the coronal plane with a slice thickness of 3 mm. For positioning of the volume of interest, a FLASH sequence (TE = 8 ms, TR = 300 ms) in sagittal and coronal orientations was used. The volume of interest was localized using a PRESS (three-dimensional point-resolved spectroscopy) sequence (Bottomley, 1987). For data acquisition, a short echo time of 20 milliseconds was chosen to reduce J modulation effects on spin-coupled resonances and to detect resonances with a short T2 relaxation time. For an optimal signal-to-noise ratio without averaging (512 data points with a sweep width of 2 kHz), a repetition time of 1, 000 milliseconds was used. Water suppression was implemented prior to the PRESS localization by applying three CHESS (chemical shift-selective) radiofrequency pulses. Total measurement time of one MRSI data set was ∼4.5 minutes.
The experimental protocol was as follows: The rat was placed in the magnet with the selected coronal plane 5.9 mm posterior to the rhinal fissure positioned in the isocenter, thus focusing on the center of the ischemic territory in the MCA occlusion model. In sequence, two perfusion-weighted images and one set of spectroscopic imaging were obtained before embolization. After embolization and before the infusion of rt-PA or saline, perfusion-weighted imaging and MRSI were performed continuously. After rt-PA infusion, eight further combinations of these two measurement sequences were acquired during the following 5 hours in each group.
Data processing
Perfusion-weighted images were transferred to a Macintosh Power PC 7200/66 (Apple, Cupertino, CA, U.S.A.), and image analysis was carried out using the image-processing software Image (NIH, Bethesda, MD, U.S.A.). Images were interpolated onto a 128 × 128 matrix.
Data processing of the spectroscopic images included zero filling to 2, 048 points in the time domain and exponential line broadening of 5 Hz. Final postprocessing of the MRSI data sets was performed on an 02 station (Silicon Graphics, Santa Barbara, CA, U.S.A.) using a program written in Interactive Data Language (IDL; Research Systems, Boulder, CO, U.S.A.). When using magnitude-calculated images for quantitative signal intensity analysis, errors due to incorrect baseline and increased linewidth influence the result. Therefore, in the present study, metabolite maps were constructed consisting of only the real component of the recorded data. After fast Fourier transformation, the spectra were automatically baseline and phase corrected and the peaks of NAA and lactate were assigned according to their frequency positions relative to the water signal at 4.7 ppm.
Construction of spectroscopic images was based on integrals over user-defined spectral regions of the spectrum. Metabolite maps of lactate and NAA were produced by integrating each peak in the complete array of spectra. The images were then interpolated for display onto a 128 × 128 matrix using bilinear interpolation.
The metabolite maps of lactate and NAA were transferred to a Macintosh Power PC for pixelwise analysis of signal intensities using the Image program. For the determination of the area of metabolic changes during vascular occlusion and after thrombolysis, we included only those pixels that showed a signal intensity higher (lactate) or lower (NAA) than ̅x ± 2 SD, where ̅x defines the mean signal intensity during preischemic conditions. The analysis of the temporal evolution of both metabolites and of the perfusion signal intensity was done in a region of interest including the right half of the volume excited during MRSI, corresponding to the central part of the occluded hemisphere. Furthermore, signal intensities of lactate and NAA were normalized to the mean NAA signal intensity in the contralateral hemisphere. For the calculation of the probability of metabolic tissue recovery, all pixels (both hemispheres) were included.
Statistics
Values are given as means ± SD. Statistical analysis was performed between groups by one-way analysis of variance. A value of P < 0.05 was accepted as significant.
RESULTS
Physiologic conditions
Table 1 summarizes the physiologic parameters measured before clot embolism, at the start of treatment, and at the end of experiments. All parameters remained in the physiological range. Only the mean arterial blood pressure showed a slight decrease (in all animals) during the course of the experiment. However, there was no statistically significant difference between treated and untreated animals.
Physiologic variables before, during, and after MCAO
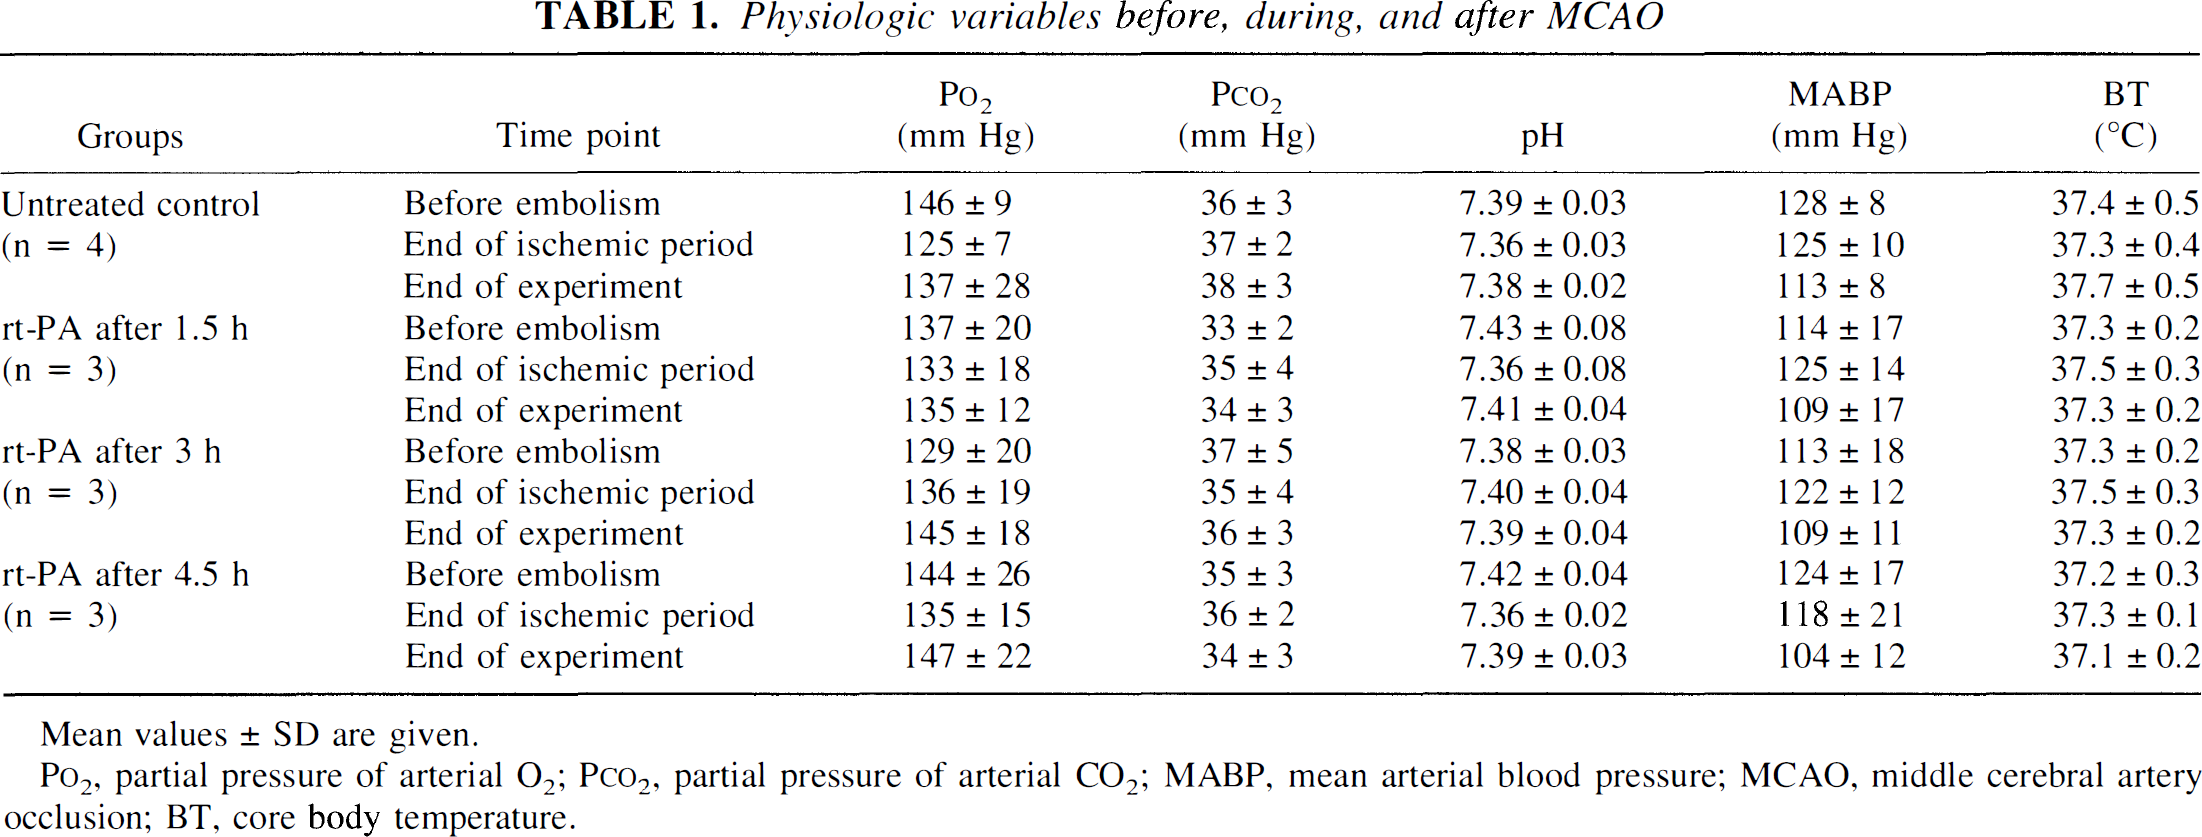
Mean values ± SD are given.
P
Time course of perfusion-weighted imaging signal intensity
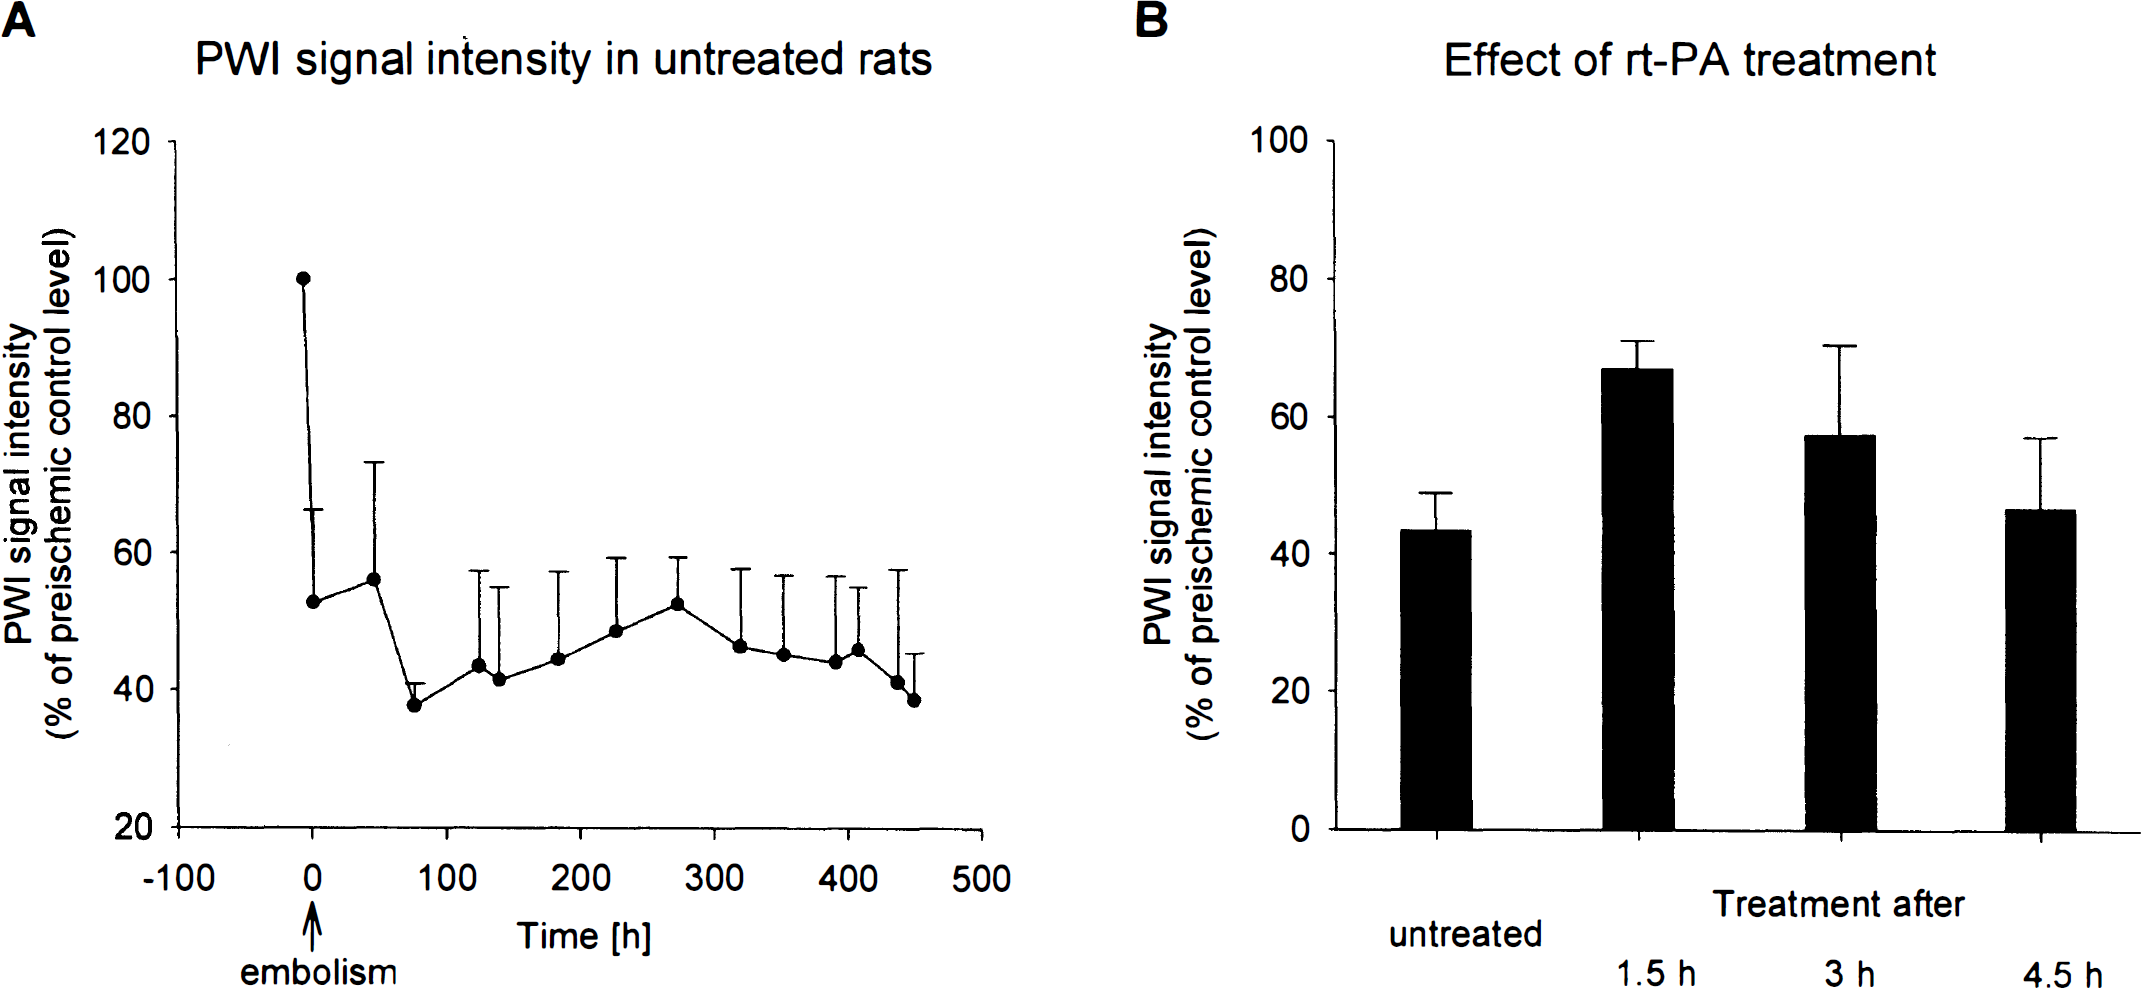
During control conditions, animals exhibited no inter-hemispheric asymmetries in the perfusion-weighted images. Directly after vascular occlusion, the blood flow in the territory of the MCA was markedly reduced, as visualized in the perfusion-weighted images (Figs. 1 and 2). In untreated animals, signal intensity in the center of the MCA territory fell to 52 ± 14% (P = 0.03) of the control level, followed by a small further decrease down to 43 ± 10% (P = 0.01) during the next 8 hours (Fig. 3A).
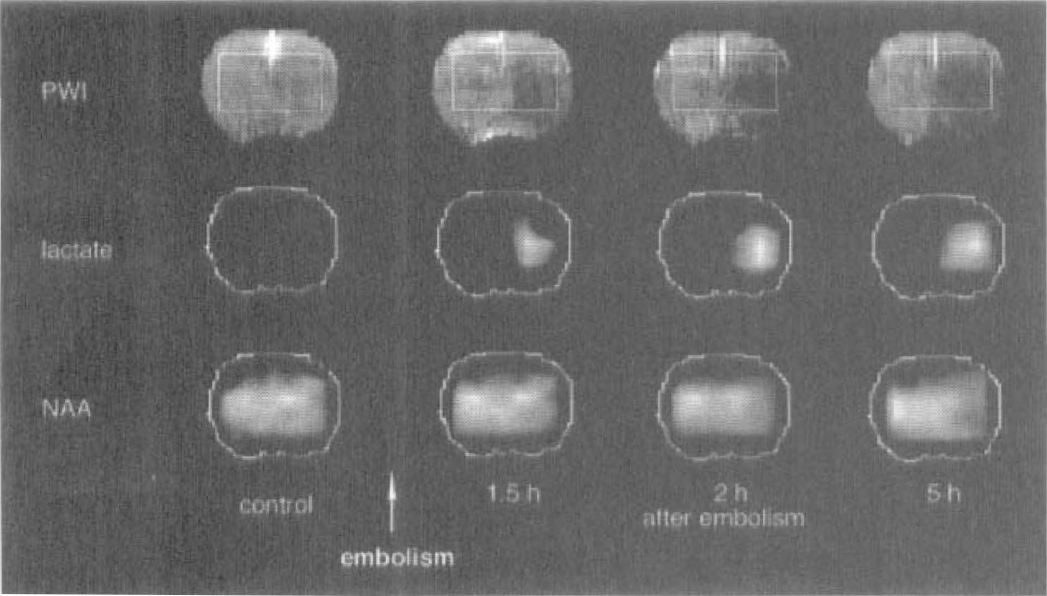
Perfusion-weighted images and lactate and N-acetyl-aspartate (NAA) maps before occlusion of the middle cerebral artery (MCA) and over 8 hours after occlusion in one representative animal. In the control phase, no abnormal signal intensity is observed. At 1.5 hours after embolization, a large drop in the perfusion signal intensity is visible in the occluded hemisphere, which persists over time. The area in which spectroscopic imaging was recorded is indicated on the perfusion-weighted image. In that area, MCA occlusion is followed by steadily increasing lactate signal intensity and a decreasing NAA signal.
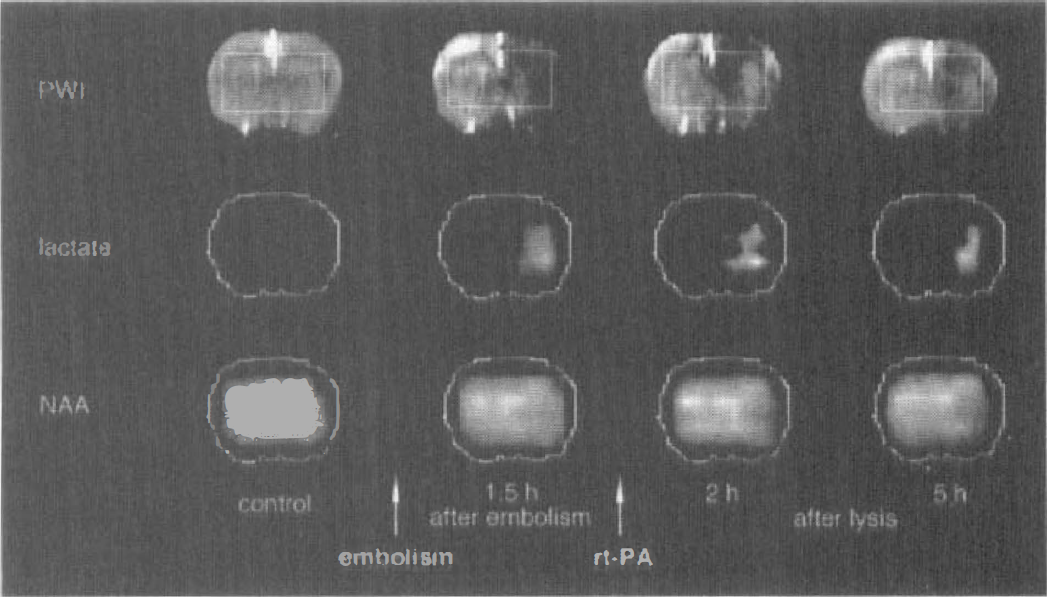
Perfusion-weighted images and lactate and N-acetyl-aspartate (NAA) maps before occlusion of the middle cerebral artery (MCA), 1.5 hours after MCA occlusion, and over 5 hours of reperfusion in one representative animal. The decreased signal intensity in perfusion-weighted images 1.5 hours after embolism was followed by a partial reperfusion in the basal ganglia. Successful reperfusion after recombinant tissue-type plasminogen activator treatment resulted in a decrease of the initially increased lactate signal intensity. The NAA signal remained at the ischemic decreased level.
(
For the investigation of effects of rt-PA on reperfusion, signal intensity before treatment was compared with the corresponding values 5 hours after lysis. In all treated animals, the dissolution of the clots was detected by a significant increase of perfusion-weighted imaging signal intensity to 87 ± 37% of the preembolic control level (P = 0.002) during a time interval of 30 to 90 minutes after initiation of treatment. Despite cerebral blood flow quality, spatially heterogeneous patterns were observed, with the heterogeneity varying between animals. In animals with thrombolysis 90 minutes after embolism, the mean cerebral blood flow increased to 67 ± 7% of the preembolic value (P = 0.1; Fig. 3B). If treatment was initiated 180 and 270 minutes after embolism, only transient improvement of perfusion was observed. In those two groups, values at the end of the observation period were not significantly higher than signal intensities in the untreated group (57 ± 22 and 47 ± 18% of control, respectively; Fig. 3B).
Time course of metabolite changes in magnetic resonance spectroscopic imaging
Before embolization, no abnormal signal intensities were seen in any of the animals in NAA or lactate maps. Furthermore, the NAA signal measured in the contralateral hemisphere showed no changes in signal intensity over the whole observation period. Therefore, all changes in the NAA and lactate signal intensities on the ipsilateral side reflect ischemia-induced alterations of metabolite concentrations.
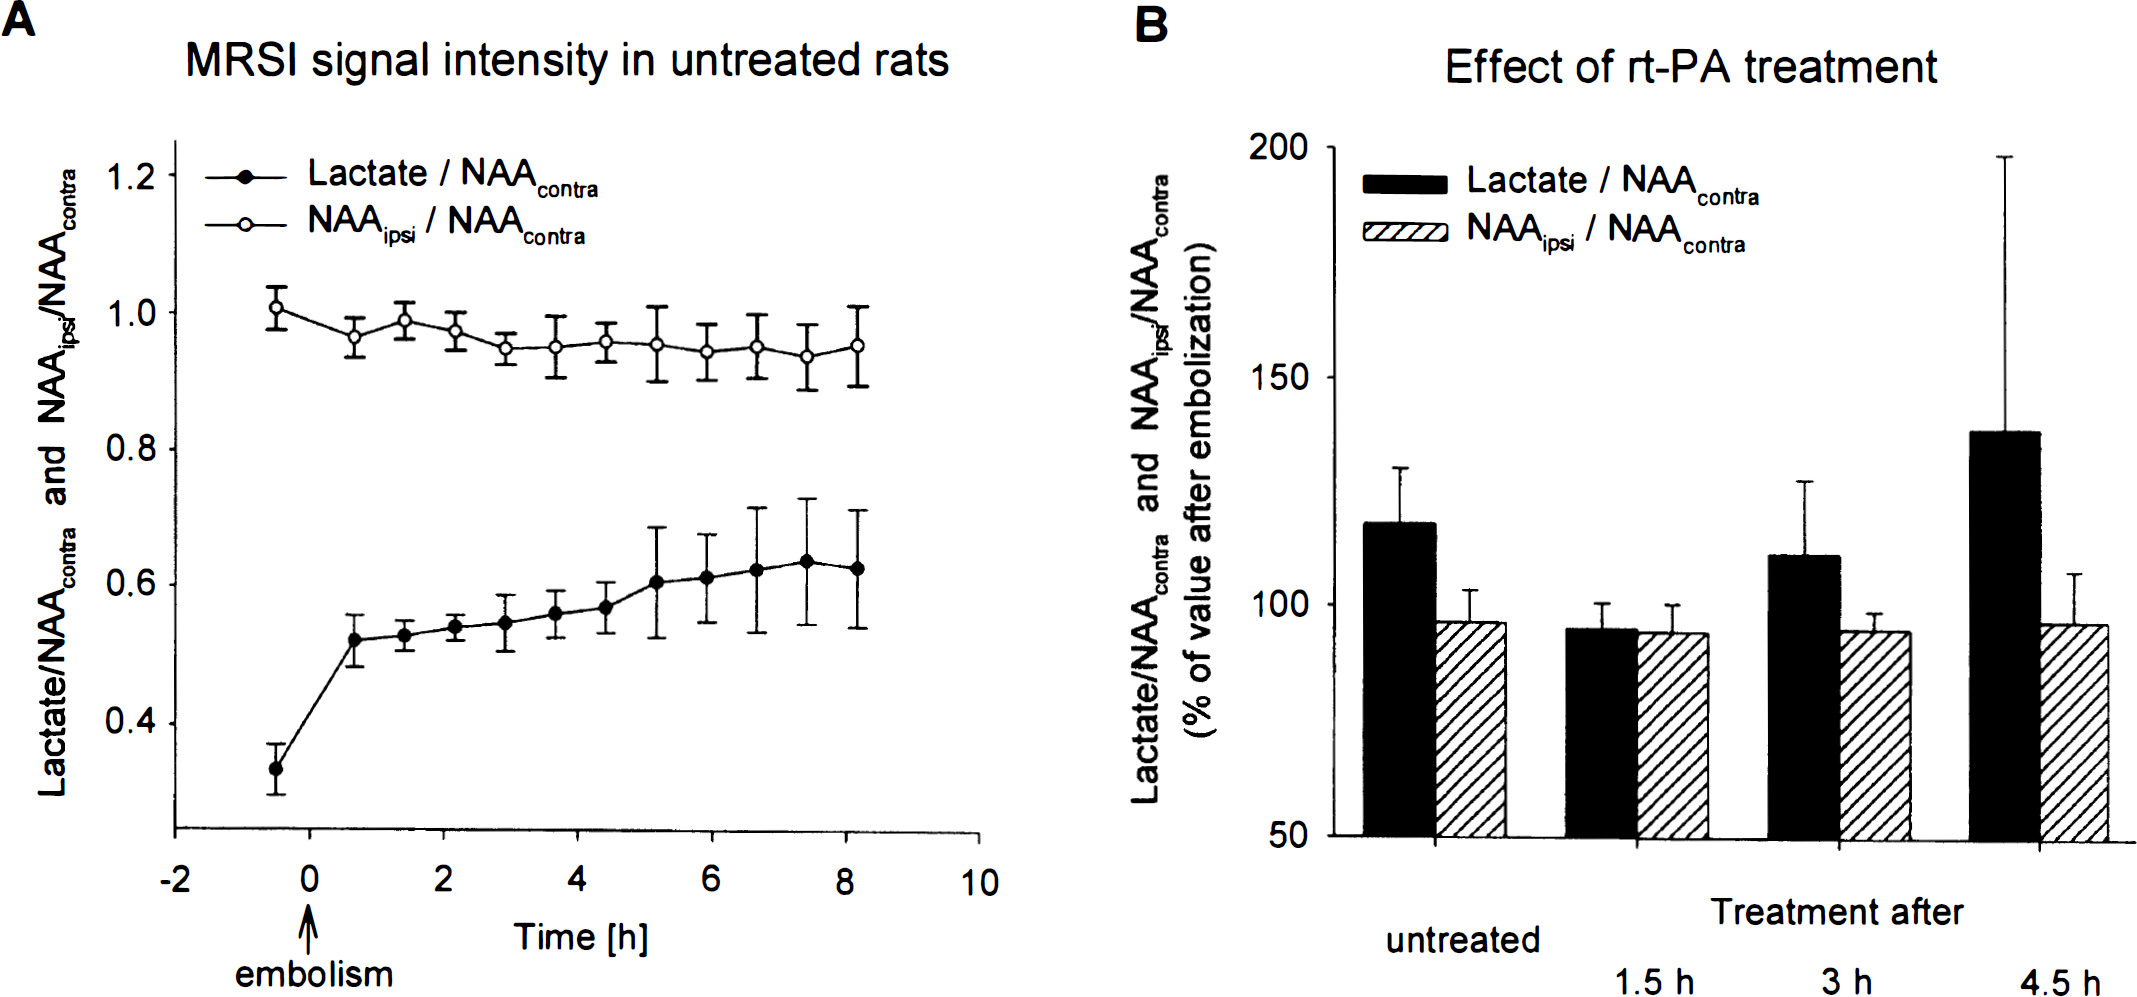
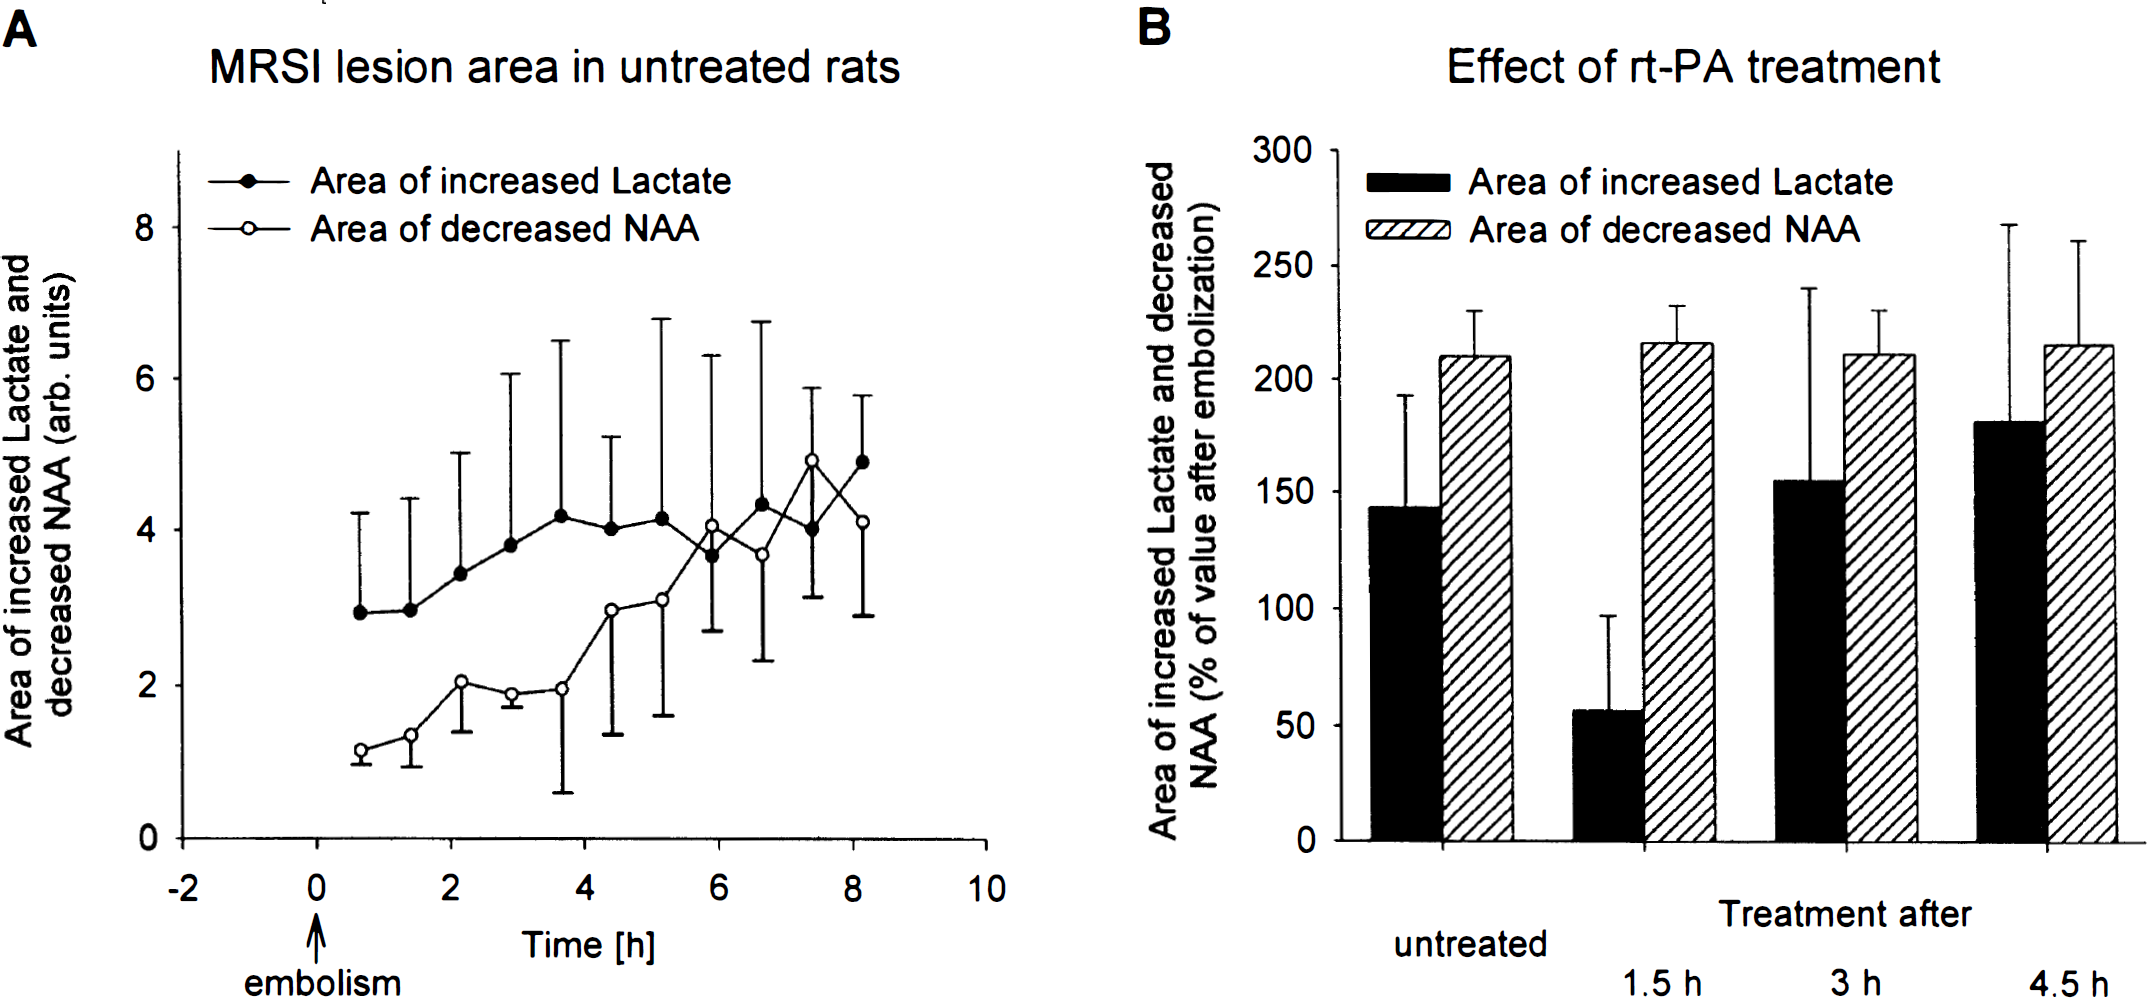
Untreated animals. After embolization, the normalized lactate intensity increased significantly to 0.52 ± 0.04 (P = 0.001) followed by a stabilization of the elevated lactate concentration after 6 to 8 hours (0.63 ± 0.08 after 8 hours; P = 0.03). The normalized NAA signal intensity slightly but gradually declined with ongoing ischemia time (0.97 ± 0.03 of preembolic control value at 40 minutes after embolization; NS), followed by a further decrease down to 0.94 ± 0.05 during the next 8 hours (NS; Fig. 4A). There was also a distinct expansion of the area with increased lactate and with reduced NAA (cf. Fig. 5A).
(
(
Treated animals. The efficiency of rt-PA lysis was evaluated by comparing normalized lactate and NAA intensities in the center of the MCA-supplying territory at the end of the observation period with those values 40 minutes after embolization. To express improvement or aggravation, the lactate and NAA intensities (normalized to the contralateral NAA signal intensity) and the areas of lactate and NAA 40 minutes after embolization were defined as 100%.
When treatment started 90 minutes after embolization, lactate slightly but not significantly declined to 95 ± 6% of signal intensity after embolism (Fig. 4B). The NAA level did not improve but continued to fall to 94 ± 6% of the signal intensity after embolization (Fig. 4B). In animals treated 180 or 270 minutes after embolization, lactate even further increased to 111 ± 16 and 139 ± 60% of signal intensity before treatment (NS), respectively, despite partially successful reperfusion. The NAA level declined to 95 ± 4 and 94 ± 11 % of postembolic values after 180- and 270-minute treatment delays (NS), respectively.
The beneficial effect of treatment after 90 minutes is shown in a clear decline of the area of increased lactate (57 ± 40% of the value after embolism; P = 0.07; Fig. 5B). In contrast, treatment initiated 180 or 270 minutes after embolism did not result in reduction of the area of elevated lactate but instead led to further expansion (155 ± 85 and 181 ± 87% of postembolic value; NS). Similarly, the area of reduced NAA showed a trend, although not statistically significant, for further growth (222 ± 50, 211 ± 20, and 215 ± 46% of the postembolic area after 90-, 180-, and 270-minute treatment delays, respectively).
Probability of metabolic recovery
The probability in individual pixels for the return of the lactate signal intensity under rt-PA treatment is given in Fig. 6. For this analysis, we used the lactate signal intensities measured before lysis (normalized to the contralateral NAA signal intensity). All pixels were sorted into subgroups depending on their individual lactate value. The probability of recovery was defined as that number of pixels in each subclass (expressed as percentage of all pixels in that subclass) in which thrombolysis led to a decrease of the lactate-to-NAA ratio to ≤0.4. With increasing lactate before treatment, the probability of recovery strongly decreased, but no difference was observed between different treatment delays. If the lactate-to-NAA ratio before treatment was above the value of 0.7, recovery was never observed, independently of the onset of treatment.
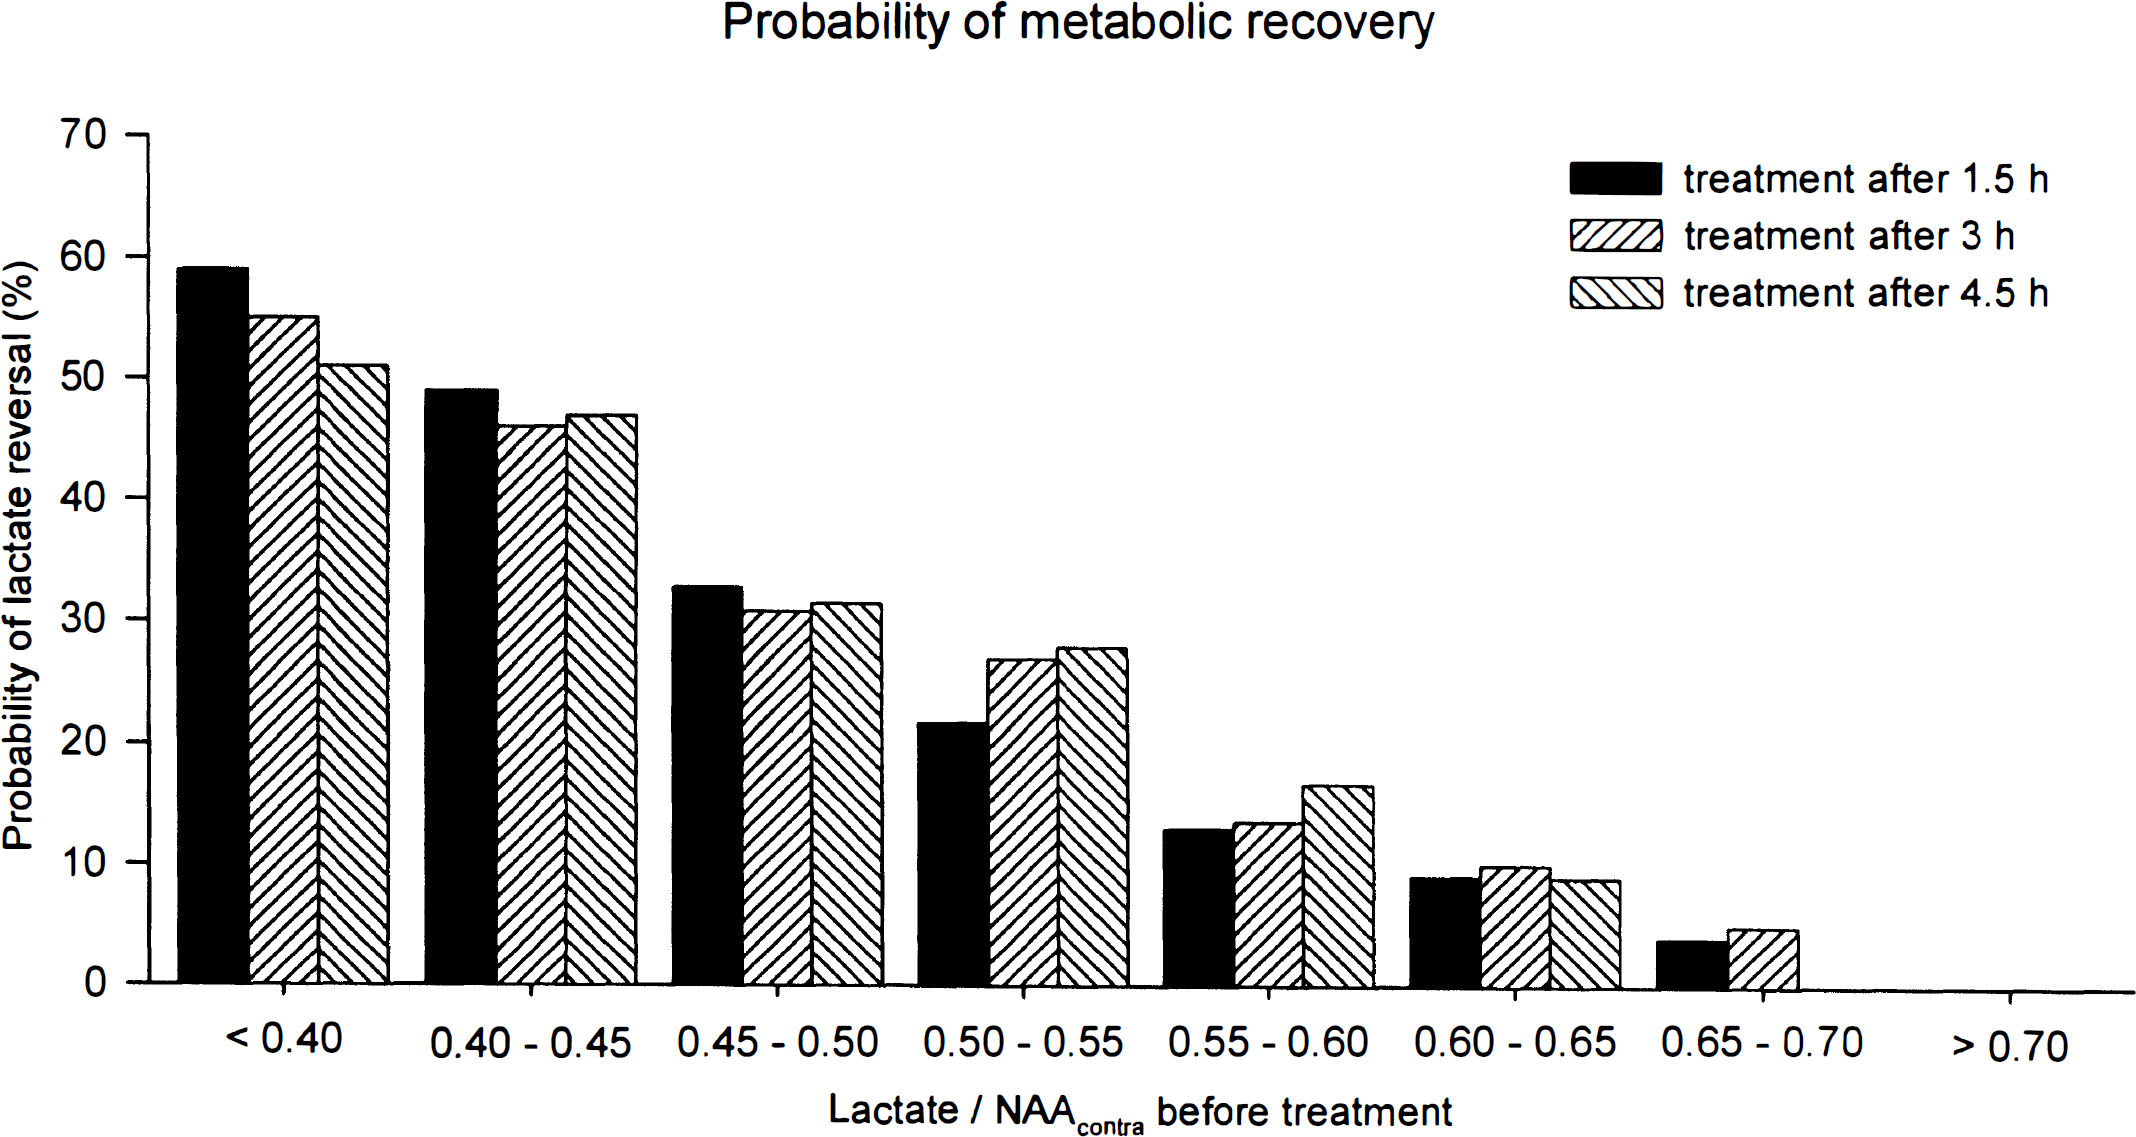
Probability of metabolic tissue recovery as a function of the lactate-to-N-acetyl-aspartate (NAA) ratio before treatment. The probability was defined as the recovery of lactate signal intensity in individual pixels to a lactate-to-NAA ratio of 0.4. The probability of metabolic tissue recovery showed a clear decline with increasing lactate-to-NAA ratio before treatment but was independent of treatment delay.
DISCUSSION
Perfusion status after embolism and treatment
The results of this investigation show that rt-PA treatment improves blood flow after lysis. However, the extent of perfusion signal intensity observed at the end of the experiment decreased with increasing treatment delay, indicating that the quality of reperfusion is strongly dependent on the delay between embolism and treatment. Moreover, even when treatment was started 1.5 hours after embolization, reperfusion did not reach preischemic control values.
The disappointing incomplete reversal of blood flow cannot be explained by insufficient thrombolysis. Although rat plasminogen has a lower responsiveness to human rt-PA than human plasminogen, the presently used dose of 10 mg/kg has been shown to completely dissolve clots (Busch et al., 1997). However, it is conceivable that at slow reperfusion rates, the “trickle” of flow suffices to promote cell swelling but not to supply enough glucose and oxygen for restoration of active ion transport. As a result, endothelial and perivascular glial cells swell to such an extent that microcirculation is compressed and blood flow further declines.
Evolution of lactate concentration after embolism and treatment
Intraarterial application of rt-PA at 1.5 hours after clot embolism substantially ameliorated metabolic disturbances, leading to a decrease of the tissue lactate concentration in the ischemic hemisphere. The degree of reduction of the area of elevated lactate is in the same order of magnitude as described for the infarct size in a previous study (Brinker et al., 1999) and in other thrombolysis studies after treatment delays ranging from 15 minutes to 2 hours (Overgaard et al., 1994; Jiang et al., 1998; Busch et al., 1998).
Our results further show that the probability for reversal of lactate accumulation in the ischemic tissue strongly decreases with increasing lactate concentration before treatment. This probability is independent of treatment delay, which is the major finding of the study. A decrease of the tissue lactate content measured with MRSI after thrombolytic intervention after clot embolism was found, primarily dependent on the severity of the metabolic disturbance. In pixels in which lactate was already markedly elevated during ischemia, the level continued to rise despite thrombolysis. In pixels with moderately high lactate before treatment, the level remained constant or even decreased on reperfusion.
The observation of reduced probability of recovery with increasing lactate is not surprising in view of the flow data. With declining blood flow, lactate increases because an increasing portion of ATP turnover has to be provided by anaerobic glycolysis. Only at complete flow arrest is lactate production limited by tissue glucose; otherwise, lactate increases more the lower the flow value. Our present data showed that reperfusion, observed in all treated groups, was only partial and that the final value at the end of the observation period was rather low in comparison with that in healthy tissue. Hence, in the penumbra, where blood flow is only mildly reduced and where energy and ion homeostasis are preserved (Hossmann, 1994; Hoehn-Berlage et al., 1995), the tissue is still viable. When blood flow is restored in such regions, the cellular lactic acidosis reverses. On the other hand, lactate remains in high concentrations in the center of the ischemic infarction, which is not successfully reperfused upon rt-PA treatment.
The most important finding of the study is that the probability of metabolic recovery is independent of treatment delay, although the area of elevated lactate as well as the infarct size increase with increasing time delay between embolism and treatment (Brinker et al., 1999). Obviously, in the present standardized model, the number of pixels with high lactate correlates with the treatment delay. But under clinical conditions, this is much less evident because (1) time of ischemia onset is not always known and (2) the severity of ischemia varies depending on the severity of vascular disease.
With this knowledge, some previous observations can now be better understood. The clinical estimation of ischemic severity is based mainly on the time interval from the onset of symptoms, but in some patients thrombolysis improves recovery after treatment delay of as much as 6 hours and in others it leads to hemorrhagic complications before 1.5 hours (Hacke et al., 1998). If the present findings are applicable to humans, one would have a chance to predict outcome based on the actual severity of the metabolic injury and not on the duration of neurological symptoms.
Animal studies have indicated that high lactate concentrations in the acute stages of the ischemic process correlate with a bad clinical outcome. Rehncrona et al. (1980, 1981) showed that severe tissue lactic acidosis during brain ischemia prevents postischemic recovery. This was also confirmed in a human study of acute stroke, where Graham et al. (1994) found a clear relationship between acute lactate levels within a stroke lesion and clinical outcome. However, the lactate concentration for which Rehncrona et al. (1980) found no lactate reversal (31 mmol/L) is much higher than the lactate concentration observed in the present study, which was estimated as follows: At full relaxation, peak amplitudes of NAA and lactate correlate linearly with molar tissue concentration. With use of the T1 and T2 relaxation times of both metabolites (van der Toorn et al., 1995; Dreher et al., 1998) and the measurement parameters of echo time and repetition time in this study, the lactate concentration that was found to limit recovery was estimated. As NAA in healthy brain tissue is ∼8 to 10 mmol (Nagatomo et al., 1995), a lactate-to-NAA ratio of 0.7 corresponds to a lactate concentration of ∼6.5 to 8 mmol.
During global ischemia, this level is reached within < 10 to 30 minutes (Nagatomo et al., 1995; Pulsinelli and Duffy, 1983), that is, after an ischemia time that is well within the revival time of the brain. A similar dissociation between focal and global ischemia has been reported for the apparent diffusion coefficient. In another study at our laboratory (F. Pillekamp, in preparation), the probability of recovery was poor after the apparent diffusion coefficient declined below 70%, but during global ischemia, the same value is reached within 10 minutes, that is, after an ischemia time that is also within the revival time of the brain. This suggests that it is not only the severity of metabolic recovery that determines postishemic outcome and supports the notion that recovery is also determined by other ischemic as well postischemic processes like the quality of reperfusion.
Nevertheless, our present data demonstrate for the first time that the pretreatment tissue lactate concentration can provide information about the probability of metabolic tissue recovery after thrombolytic intervention. This probability is strongly dependent on the lactate concentration before treatment and irrespective of the treatment delay. Therefore, we could define a critical value for the possibility of metabolic recovery as follows: For a lactate-to-NAA ratio of ≥0.7, no pixel was observed with lactate normalization during the reperfusion phase.
Evolution of N-acetyl-aspartate concentration after embolism and treatment
N-Acetyl-aspartate has the highest signal in the 1H spectra of the brain and is found almost exclusively in neurons (Birken and Oldendorf, 1989; Simmons et al., 1991), where it has been shown to be produced in the mitochondria (Patel and Clark, 1979). Despite its high concentration, its function is still unknown.
In humans as well as in animals, an ischemic insult is followed by a rapid decrease of NAA concentration and a subsequent further decline (Bruhn et al., 1989; Graham et al., 1993; Gideon et al., 1994; Gyngell et al., 1995). In our study, we have shown that the mean NAA content in the brain decreased in all animals independently of treatment delay. Furthermore, despite treatment, an increase of the area of reduced NAA concentration was observed in all animals. These findings suggest that NAA decrease is in proportion to the severity of ischemic neuronal damage. However, our data have shown that the metabolic turnover of NAA is slower than lactate changes after focal cerebral ischemia, and decreases in concentrations of NAA were found to be irreversible: Once a brain region exhibited reduced NAA, no subsequent images showed any recovery of NAA.
Due to the clear reduction of NAA concentration in the brain after stroke, NAA was already reported to be strongly correlated with clinical outcome (Graham et al., 1994; Federico et al., 1996; Pereira et al., 1999). However, this is not consistent with our observation in the acute phase of ischemic injury. In animals with successful reperfusion 1.5 hours after stroke, rt-PA treatment led to a clear reduction of lesion growth (Franke et al., 1998; Brinker et al., 1999) and a significant reduction of tissue lactate content, which represents a clear beneficial effect of thrombolysis at such short delay times. This development could not have been predicted using the NAA signal. We rather observed a further decreased NAA signal after reperfusion in all groups, independent of the time between embolism and treatment.
SUMMARY
The major findings of the study are that a substantial improvement of perfusion and a reduction of the area of elevated lactate can be expected only after short treatment delays. Furthermore, using a fast spectroscopic imaging method, we have shown that the tissue lactate content in the acute phase of focal cerebral ischemia is well correlated with the outcome defined by tissue lactate content after successful reperfusion and independent of treatment delay. Moreover, with the presented MRSI method, it is possible to determine the metabolic state of ischemic tissue without knowledge of the exact infarct time point. Due to the clear dependence of the recovery chances on the degree of the metabolic disturbances, we have presented for the first time a noninvasive tool that can be used in support of prediction of the evolution of the ischemic tissue after treatment.
However, the critical value of 0.7 for the lactate-to-NAA ratio as described in this investigation is strongly dependent on measurement conditions like echo time. Therefore, for further investigations and clinical applications, the definition of the absolute lactate concentration as a prognostic value would be necessary. Future studies will focus on a quantitative method of proton spectroscopic imaging.
Identifying the region of reversible brain injury is a topic of intensive research. We believe that MRSI in combination with other MR methods such as perfusion- and diffusion-weighted imaging is able to provide insight into the functional as well as metabolic aspects of pathological brain conditions.
Footnotes
Acknowledgment
The authors gratefully acknowledge the stimulating discussions with Dr. M. L. Gyngell and his help with the development of the early version of the MRSI measurement sequence.