
Abstract
Glucose transport is important for understanding brain glucose metabolism. We studied glucose transport with a presumably non-toxic and non-metabolizable glucose analog, 3-O-methyl-
Introduction
In the brain, the high-energy demand requires continuous delivery of glucose from blood, and the transport of blood glucose by glucose transporters across the blood–brain barrier (BBB) and into individual cells is an essential step for energy metabolism and brain function. Alterations in glucose transporter function and expression can drastically affect brain function, and the glucose transport can become a rate-limiting step for energy metabolism in pathological conditions, such as Alzheimer’s disease, epilepsy, ischemia, and traumatic brain injury. 1 Thus, glucose transport in the brain is important for understanding glucose metabolism in normal and disease states. Studies of disease-altered glucose transport can also lead to new diagnostic methods2,3 and therapeutic interventions.4,5
Glucose transport has often been studied with the glucose analogs, 2-deoxy-
Previous studies of 2DG and 3OMG have mostly used a radioisotope-labeled compound with PET or autoradiography techniques. The autoradiography method is almost exclusively limited to animal studies and can only be obtained at a single time point due to the requirement of histology. The PET technique has poor spatial resolution, and the radiation exposure limits the scan frequency and excludes certain patient groups. Recent MRI studies showed that the transport and metabolism of non-labeled glucose and analogs may be imaged with chemical exchange-sensitive techniques, including chemical exchange-sensitive spin-lock (CESL) and saturation transfer (CEST) MRI techniques,15–20 or a variant of CEST.21,22 For example, CEST with 3OMG injection was used to detect cancerous tissue in mice with xenograph mammary tumors.
10
In these approaches, non-labeled glucose (or analog) is indirectly detected from a reduction of the water signal during an irradiation pulse, induced by the fast chemical exchange between hydroxyl (i.e. −OH group in Figure 1(a)) and water protons. Compared to direct measurements of glucose or analogs by magnetic resonance spectroscopy, the indirect measurement enhances the sensitivity by about two orders of magnitude.13,19 However, because other physiological perturbations may be induced by the injection and affect the water signal, it is important to evaluate properties and sources of chemical exchange-sensitive MRI signals.
Conceptual schematics to map 3OMG uptake by CESL-MRI. (a) Normal water signal is reduced when on-resonance spin-lock irradiation is applied (right vs. left), due to intrinsic relaxation mechanisms unrelated to chemical exchange (blue bracket). Addition of glucose analog 3OMG causes further signal decay due to chemical exchange between 3OMG hydroxyl (OH) protons and water hydrogen (H) protons (example indicated by green arrow). (b) Timeline of 3OMG-CESL MRI experiments shows T1ρ-weighted images acquired before and after injection to generate R1ρ (=1/T1ρ) maps. 3OMG uptake is reflected in ΔR1ρ maps (i.e. R1ρ changes induced by the 3OMG injection).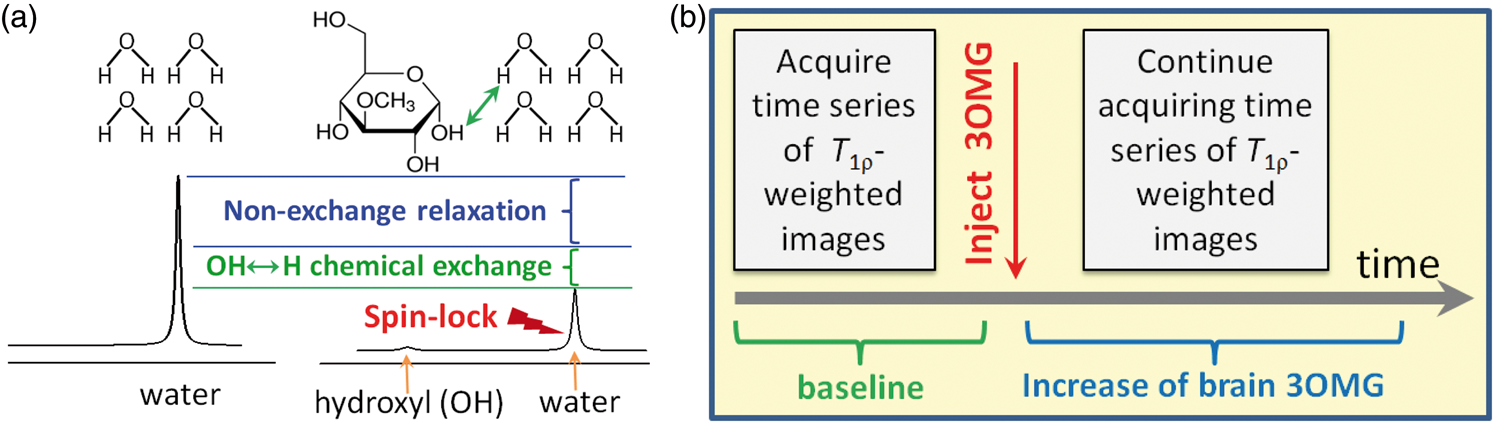
Both CESL and CEST measure similar chemical exchange-related signals of introduced glucose or analogs, but a few studies have suggested that CESL has higher sensitivity than CEST.19,20 Thus, to investigate the feasibility of MRI for examining glucose transport, we measured CESL MRI with intravenous injection of 3OMG in normal and ischemic brains. We first determined the chemical exchange properties of 3OMG in phantoms. In vivo CESL MRI of 3OMG in normal rat brain was compared to that of glucose and 2DG. To evaluate the sensitivity and signal source of in vivo studies, 3OMG-CESL experiments of the dependence on the injection dose and the applied spin-lock power were performed. As a preliminary study, we also evaluated the potential of 3OMG-CESL in acute stroke to classify different ischemic tissues.
Materials and methods
Animal preparation
Male Sprague–Dawley rats weighing 264–385 g were purchased from Charles Rivers Laboratories, Inc, and were studied with approval by the Institutional Animal Care and Use Committee at the University of Pittsburgh in accordance with the National Institutes of Health guide for the care and use of laboratory animals. All procedures were conducted in accordance ARRIVE (Animals in Research: Reporting In Vivo Experiments) guidelines (www.nc3rs.org.uk/arrive-guidelines). Efforts were made to minimize the number of animals used and to ensure that the animals received the highest quality care. The animals were anesthetized with isoflurane (5% for induction and 2% during surgery) in a mixture of O2 and air gases with the O2 concentration kept at about 30% throughout the experiment. The right femoral vein was catheterized for the delivery of maintenance fluid and injection of 3OMG, and the femoral artery was catheterized to monitor the arterial blood pressure. In stroke studies, middle cerebral artery occlusion (MCAO) was carried out to induce permanent ischemia in the left hemisphere. 23 After surgery, the isoflurane level was reduced to 1.4–1.5% during MRI scans. The dynamic blood pressure and end-tidal CO2 were monitored. The rectal temperature was maintained at 37.5 ± 1.0℃ using a feedback-controlled heating pad.
MR experiments
All experiments were performed on a 9.4-T magnet equipped with an actively shielded 12 cm gradient system (Magnex, UK), interfaced to a DirectDrive 2 console (Agilent, Santa Clara, CA, USA). For phantom experiments, a 3.8 cm ID quadrature volume coil (Rapid Biomedical, OH, USA) was used for radiofrequency transmission and detection. For in vivo studies, a detunable volume excitation (6.4 cm diameter) and surface receiver coil combination (2.2 cm diameter) (Nova Medical Inc, MA, USA) was used, and a 1.6 cm ID home-made surface coil was used for spin-lock power-dependent studies to achieve a maximum power of 5200 Hz. In all experiments, B1 maps were first obtained to determine the transmit power for spin-lock experiments. 24 Since the change in CESL signal induced by 3OMG administration is relatively small, it is critical to maintain stable baseline R1ρ during long experiments. Thus, we performed CESL experiments after waiting for 0.5–1 h for the animal conditions (e.g. body temperature) to be stabilized inside the magnet.
During on-resonance spin-lock, decay of the water signal is determined by T1ρ, the spin-lattice relaxation time in the rotating frame (Figure 1(a)). Addition of 3OMG increases the relaxation rate R1ρ ( = 1/T1ρ) due to chemical exchange-mediated relaxation between its hydroxyl groups and water protons, thus decreasing the signal of T1ρ-weighted images. R1ρ at a given spin-lock power of B1 was measured by varying the spin-lock duration (TSL) and fitting to a monoexponential decay function as


Phantom experiments and data analyses
3OMG dissolved in phosphate-buffered saline (PBS) was placed in individual vials, and data from multi-vial phantoms were acquired at 37℃ to characterize various chemical exchange properties—i.e. relative population of hydroxyl to water protons p and exchange rate kex between 3OMG hydroxyl and water protons. (i) To study the concentration dependence, 0, 10, 15, 20, and 30 mM of 3OMG were titrated to pH = 7.07, and 0.15 mM of MnCl2 was added to reduce the T1 and T2 of water so that they are closer to in vivo values. (ii) To study the pH-dependence, 20 mM of 3OMG was titrated to pH = 6.3, 6.6, 7.05, and 7.5. No MnCl2 was added due to the difficulty to control pH.
For all phantoms, T1ρ-weighted images were measured with single-shot spin-echo echo planar imaging (EPI) for 11 γB1 values between 125 and 4000 Hz, with TSL from 0 to 200 ms for the concentration-dependent samples and 0 to 1 s for the pH-dependent samples, 64 × 64 matrix size, 4 × 4 cm2 field of view (FOV), 5 mm slice thickness, echo time (TE) = 25 ms, and repetition time (TR) = 15 s. Two separate sets of phantoms were prepared, and the data were averaged from the two measurements. At each γB1 value, R1ρ was computed from each phantom using equation (1). To obtain pH-dependent exchange parameters, dispersion curves (R1ρ vs. spin locking power γB1) were fitted to equation (2) with δ = 1.4 ppm 19 .
In vivo experiments
CESL MRI studies were performed with injection of 3OMG under 1.5% isoflurane anesthesia. Images with different T1ρ weighting (i.e. different TSL values) were acquired before and after the intravenous injection of 3OMG in 30% weight/volume solution (Figure 1(b)). Specifically, spin-lock MRI images were continuously acquired during a 30–60-min pre-injection and 60–120-min post-injection period. For spin-lock preparation, 50 ms spin-lock irradiation at the desired γB1 level was sandwiched between an adiabatic half-passage pulse and an inverse adiabatic half-passage pulse (each of 1.5 ms duration).19,27 Immediately after the spin-lock preparation, MR images were acquired by EPI. Images with (i) TSL = 0 (without average) and (ii) TSL = 50 ms and γB1 = 500 Hz (three averages) were interleaved for all studies except the spin-lock power-dependent studies (Paradigm 3). In pilot studies (not shown), the temporal signal-to-noise ratio (tSNR) measured with TSL = 0 was about 2–3 times higher than that with TSL = 50 ms; thus, the latter images were averaged three times to improve tSNR of the R1ρ time series. In Paradigm 3, one image with TSL = 0 and six images with TSL = 50 ms and γB1 that was varied from 500 Hz to 5200 Hz were interleaved. Images were acquired with a 64 × 64 matrix size, FOV = 32 mm × 32 mm, 2–4 slices with 2 mm thickness, TE = 28 ms and TR = 3 s.
Paradigm 1: A single bolus of 1 g/kg of 3OMG (n = 5 rats) was given to determine the sensitivity and the temporal characteristics of 3OMG-CESL, and its results were compared to data obtained from the same 1 g/kg dose injection of 2DG (n = 4) and Glc (n = 4) in our recent study. 19
Paradigm 2: To determine the dose dependence, a bolus of 1 g/kg 3OMG was injected in about 2 min and repeatedly injected every 30 min, accumulating to 4 g/kg 3OMG (n = 5 rats). CESL images were measured for a total of 2.5 h.
Paradigm 3: One concern is that the CESL signal change is affected by non-chemical exchange effects, such as an increase of the osmolality effect caused by the injection of hypertonic solution, leading to a water shift between blood and extravascular tissue and affecting the tissue R1ρ. To separate chemical exchange-dependent and -independent R1ρ contributions (see equation (3)), spin-lock power-dependent T1ρ studies were performed, since the non-chemical exchange signal should be independent of spin-lock pulse power. 19 For this, a home-built surface coil (1.6 cm diameter) was used to achieve high transmit power. 28 Since surface coil excitation induces an inhomogeneous B1 field, a small region of interest (ROI) was selected in the cortex. To ensure that a similar γB1 was applied to all animals, the transmit power was adjusted so that the averaged γB1 during TSL in this small cortical ROI reached the targeted value of about 500, 800, 1280, 2000, 3280, and 5200 Hz. As an “osmolality control”, mannitol was used. 19 Because mannitol cannot be transported across the BBB, 29 the osmotic gradient will be sustained longer than that from the injection of 3OMG, because 3OMG can be quickly transported to the extravascular space, and consequently, the osmotic gradient will decline. Thus, for the spin-lock dispersion studies, CESL was measured with a 4 g/kg injection of 3OMG (n = 4) and a smaller 2 g/kg injection of mannitol (n = 4). Due to the high dose, the solution was slowly injected for 8–10 minutes to reduce the impact on animal physiology.
Paradigm 4: In ischemic stroke studies, CESL R1ρ maps were acquired at about 1 h after the MCAO onset, for a total duration of 10 min—i.e. 2.5 min before to until 7.5 min after an injection of 0.6 g/kg 3OMG (n = 3). ADC maps were acquired with a low b-value of 5 s/mm2 applied on one axis and a high b-value of 1200 s/mm2 applied on six different directions, at about 1 h and 3 h post-MCAO onset to determine the ischemic lesion and its progression, respectively. For comparison with 3OMG, the same CESL experiments were repeated on MCAO animals with injection of saline (n = 3) at 1 h post-MCAO onset. In this preliminary study, only six animals were studied without randomization or blinding for group allocation.
In vivo data analysis
Data were analyzed with in-house Matlab® programs and STIMULATE software. 30 Time series of images with the same spin-lock parameters (i.e. TSL and/or γB1 value) were first extracted from each run, and time series of R1ρ maps were calculated by ln (STSL=0/STSL=50 ms)/50 ms where STSL=0 and STSL=50 ms are the signal intensity of TSL = 0 and 50 ms, respectively. Thus, a time series of R1ρ with γB1 = 500 Hz was generated in Paradigms 1, 2, and 4, and six time series of R1ρ with γB1 = 500 Hz to 5200 Hz were generated in Paradigm 3.
To obtain statistical maps, the Student’s t-test was performed to compare pre- vs. post-injection images on a pixel-by-pixel basis. In normal rats, baseline pre-injection images were defined as data spanning 30 min before the start of injection, while post-injection images were from data spanning 20–60 min post-injection (Paradigms 1 and 3) or 10–30 min after each individual injection in Paradigm 2. In stroke rats (Paradigm 4), the baseline pre-injection images were defined as data spanning 2.5 min before the start of injection, while post-injection images were from data spanning 2.5–7.5 min post-injection. The R1ρ change or t-value maps were obtained where a threshold of p < 0.05 and a minimum cluster size of three pixels were applied. A threshold of baseline R1ρ value of 20 s−1 was additionally applied to exclude pixels with significant partial volume fractions of cerebrospinal fluid (CSF) because ΔR1ρ can be induced by a change of volume fractions between tissue and CSF which have different R1ρ values (2.5 s−1 for CSF vs. 23 s−1 for tissue).19,24
Quantitative analyses were performed in ROIs from the middle of the cortex in normal rats (Paradigms 1–3). In Paradigm 3, the ΔR1ρ as a function of spin-lock power was fitted to equation (3), also assuming δ = 1.4 ppm. In stroke rats of Paradigm 4, ROIs were selected based on different regions identified from the ADC maps—namely early lesion, recruited lesion, and the contralateral normal tissue. The lesion ROI was defined as the pixels with ADC values ≤77% of the mean value from the contralateral hemisphere. The early lesion ROI was obtained from the ADC map at 1 h after the occlusion, while the recruited lesion ROI was the difference between the early lesion ROI and the later lesion ROI obtained at 3 h. The normal contralateral ROI was a mirror of the early ipsilateral lesion ROI across the midline. Histograms were obtained from all pixels within ROIs, and the time courses were obtained from all pixels passing the CESL statistical threshold within these ROIs. Data are shown as mean ± standard deviation (SD).
Results
Properties of 3OMG-CESL
Figure 2(a) compared the dispersion curve of PBS with that of 3OMG at four different concentrations. Note that the PBS sample has relative high R1ρ values (>7.5 s−1) with minimal dispersion, because the addition of MnCl2 increases R2,0. The increase of R1ρ due to 3OMG (vs. PBS only) is linearly proportional to the concentration, and a linear fit of the R1ρ vs. concentration yields an R1ρ of 0.063 s−1/mM at γB1 = 500 Hz (Figure 2(b)). Figure 2(c) compared the R1ρ dispersion curves of 3OMG with four different pH values. For on-resonance spin-lock, the exchange-mediated relaxation rate is maximized at the intermediate exchange regime—i.e. the chemical exchange rate between labile proton and water proton is similar to the difference of their Larmor frequencies.
26
The R1ρ at a γB1 value of 125 Hz is the highest for the pH = 7.05 phantom (Figure 2(d)); thus, hydroxyl-water proton exchange of 3OMG at pH = 7.05 is close to the intermediate exchange regime. By fitting the R1ρ dispersion data to equation (2), we determined the exchange rate between water and 3OMG hydroxyl protons to be 4420 s−1 for a pH of 7.05, which is similar to 2DG and Glc.
19
Chemical exchange properties of 3OMG. (a) R1ρ dispersions of 0, 10, 15, 20, and 30 mM 3OMG samples with 0.15 mM of MnCl2 were dissolved in phosphate-buffered saline (PBS) and titrated to pH = 7.07. (b) The difference of R1ρ (measured at 500 Hz) between 3OMG samples and the PBS-only sample is linearly proportional to the 3OMG concentrations. The best fitted slope is 0.063 s−1/mM. (c) R1ρ dispersion curves of 20 mM 3OMG in PBS titrated to different pH values. It should be noted that R1ρ values were small compared to those of concentration phantoms, because no MnCl2 was added. (d) The kex as a function of pH was fitted from equation (2), assuming a chemical shift δ = 1.4 ppm.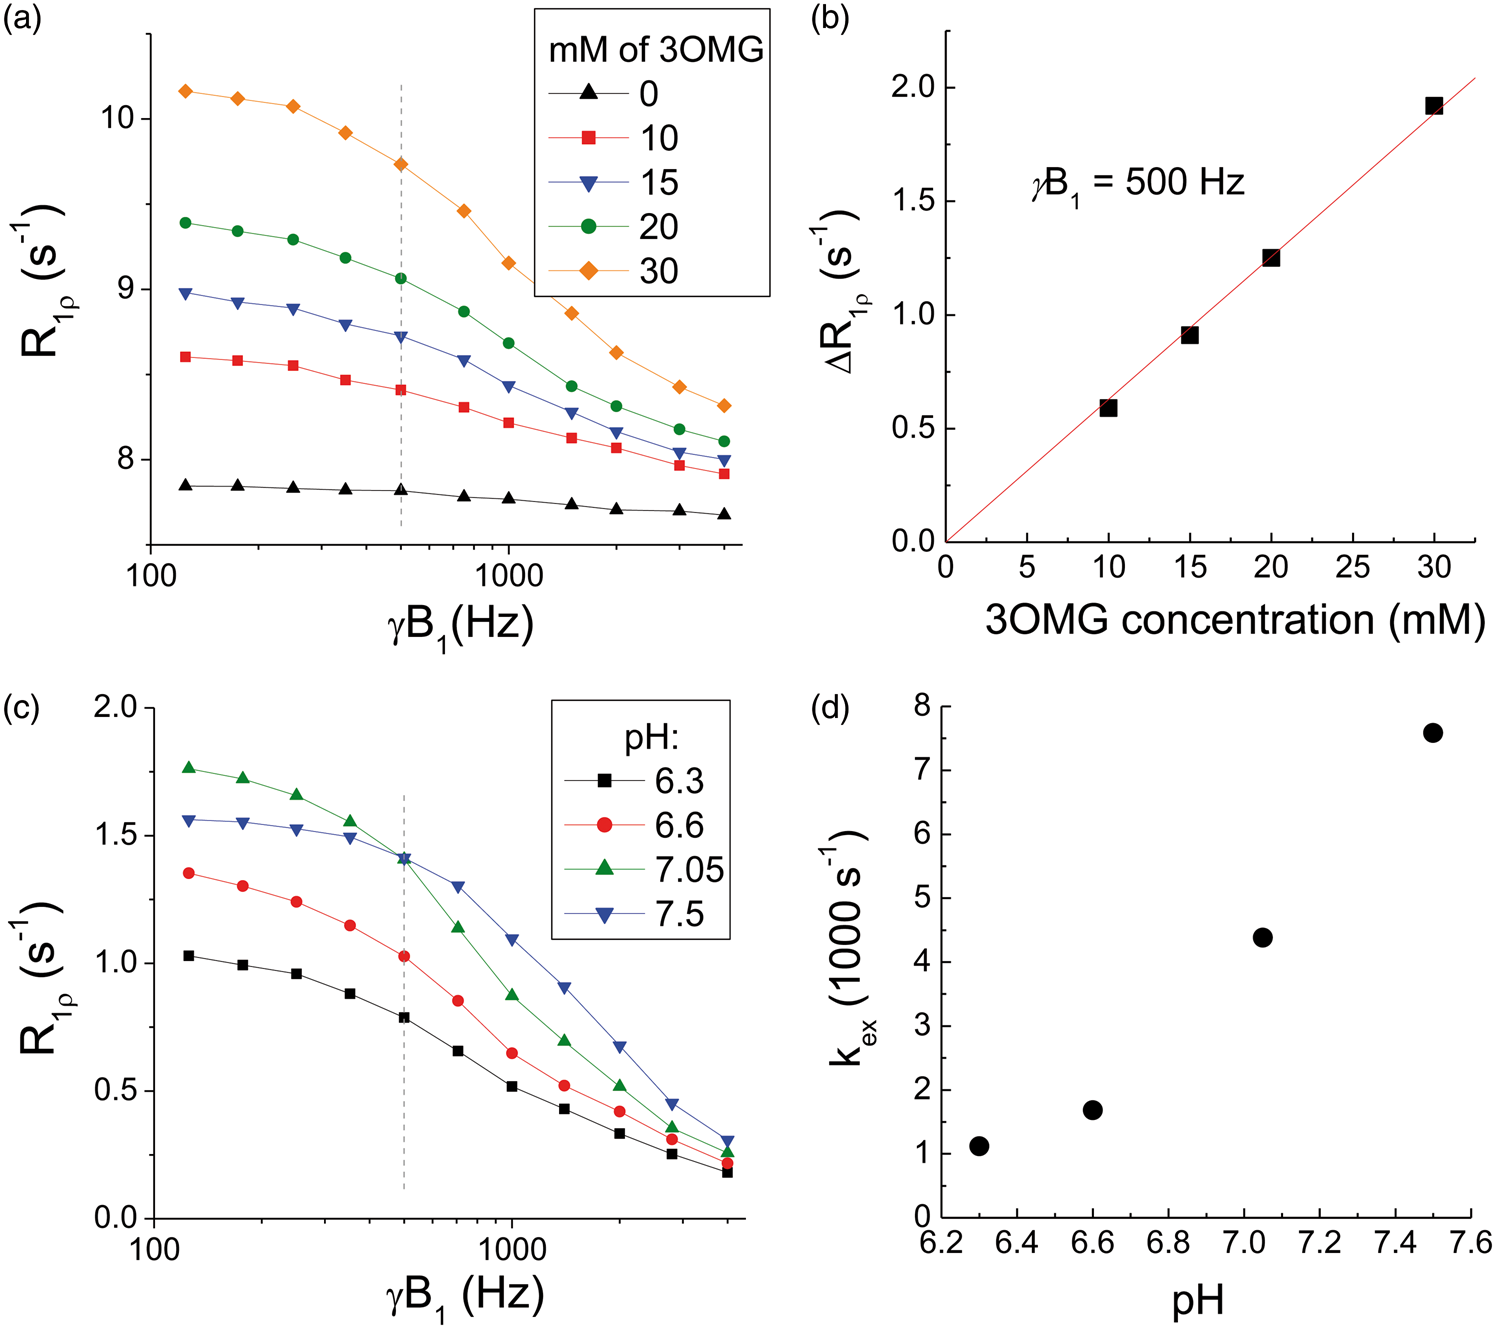
In vivo characteristics of 3OMG-CESL were compared to that of Glc and 2DG. Figure 3(a) shows a simple three-compartment model of how Glc, 3OMG and 2DG are transported and metabolized in the brain. Note that 3OMG and 2DG6P cannot be metabolized, while the thick and thin arrows indicate the directionality of transport by glucose transporters in the brain. Because the intravascular component contributes negligibly to CESL R1ρ,
19
only the addition of extracellular and intracellular hydroxyl groups (i.e. Glc and 2DG and their metabolic products and 3OMG) will contribute to a CESL R1ρ change. In Figure 3(b), the time course of the R1ρ change induced by the injection of 1 g/kg 3OMG was compared with that of Glc and 2DG.
19
CESL time courses of Glc, 2DG, and 3OMG can be explained by the transport and metabolic properties of each molecule. R1ρ of the fully metabolizable Glc peaks at 10–20 min post-injection and returns to baseline after approximately 60 min, while R1ρ time courses of 2DG and 3OMG have higher peaks and almost remain on a plateau for >60 min, decreasing at much slower rates. At 60 min, the ΔR1ρ values of 2DG and 3OMG are approximately 85–88% of their peaks.
In vivo characteristics of intravenously injected 3OMG, Glc and 2DG. (a) Three-compartment schematic illustration of transport and metabolism of Glc, 2DG, and 3OMG in normal brain. Intravascular, extravascular–extracellular, and intracellular pools are considered. Molecules with red label indicate non-metabolizable. (b) Glucose or glucose analogs were intravenously injected into normal rats. Rat brain R1ρ changes by 1 g/kg administration of 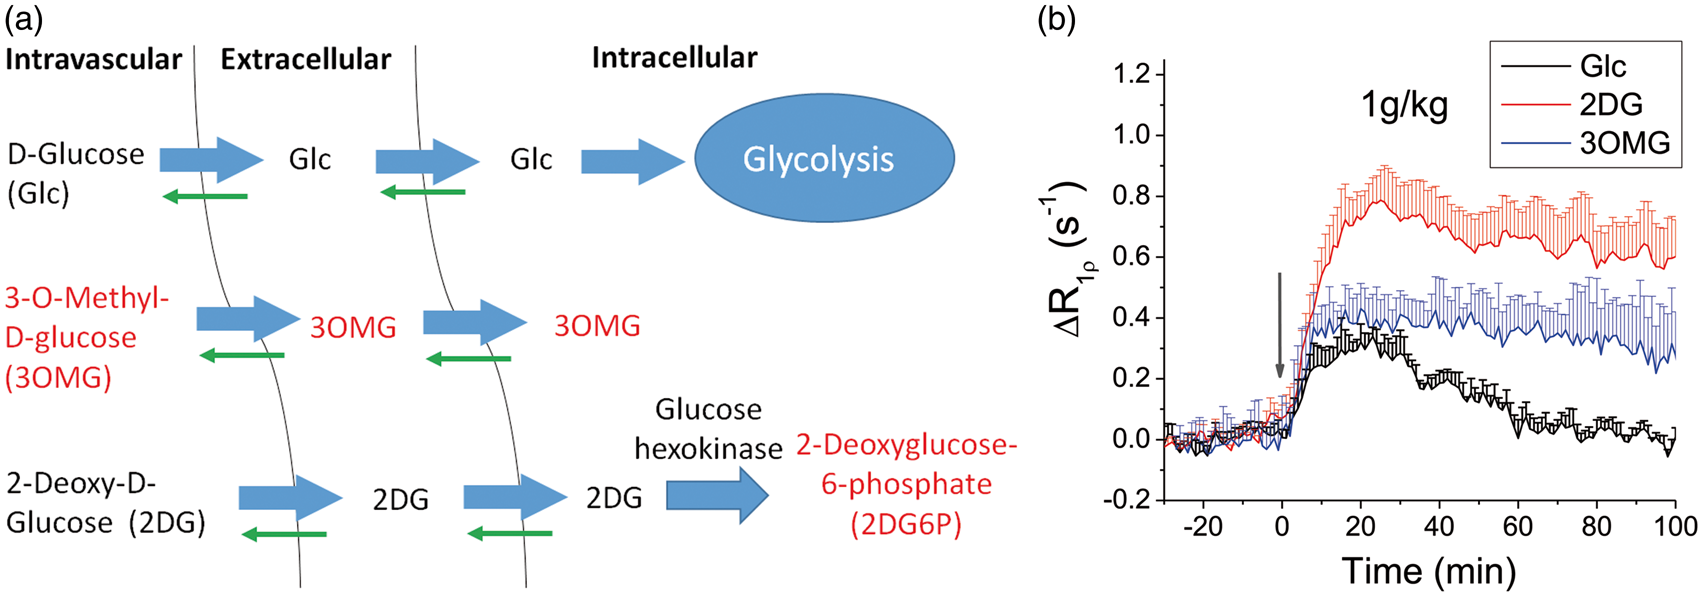
Dose dependence and signal sources of 3OMG-CESL
The dose dependence of 3OMG-CESL was investigated to determine the relation between in vivo R1ρ change and dose. With four consecutive 1 g/kg 3OMG injections, ΔR1ρ was elevated in the whole brain for all doses (Figure 4(a)). The time course from the cortical ROI shows a stepwise increase of R1ρ (Figure 4(b)). This R1ρ increase is almost linearly proportional to the injection dose (Figure 4(c)) with a slope of 0.32 s−1 per 1 g/kg injection, and this increase of brain 3OMG can be converted to approximately 5.1 mM for each 1 g/kg IV injection, assuming an R1ρ of 0.063 s−1/mM obtained from the phantom experiments. Another important issue is the effect of 3OMG on physiology. Except for a short period (∼3–5 min) after the onset of injection, in all animals, the blood pressure, cardiac pulsation, and end-tidal CO2 level remained relatively stable when the cumulated 3OMG dose reached 4 g/kg, suggesting that a high 4 g/kg dose does not interfere with animal physiology significantly. The average mean arterial pressure dipped from 88.7 ± 7.3 to 62.4 ± 8.2 mm Hg during the injection and recovered back to 84.3 ± 6.5 mm Hg at 3–5 min after the onset of injection.
In vivo dose-dependent 3OMG-CESL. Comparison of the R1ρ change maps (a) and the time course (b) of R1ρ change with four consecutive intravenous (IV) injections of 1 g/kg 3OMG every 30 min. The injection periods are indicated by the gray bars. (c) The increase of R1ρ calculated from middle cortical ROIs shows a linear dependence on the injection dose. The best fitted slope is 0.32 s−1 per 1 g/kg injection. Error bars indicate standard deviations (n = 5).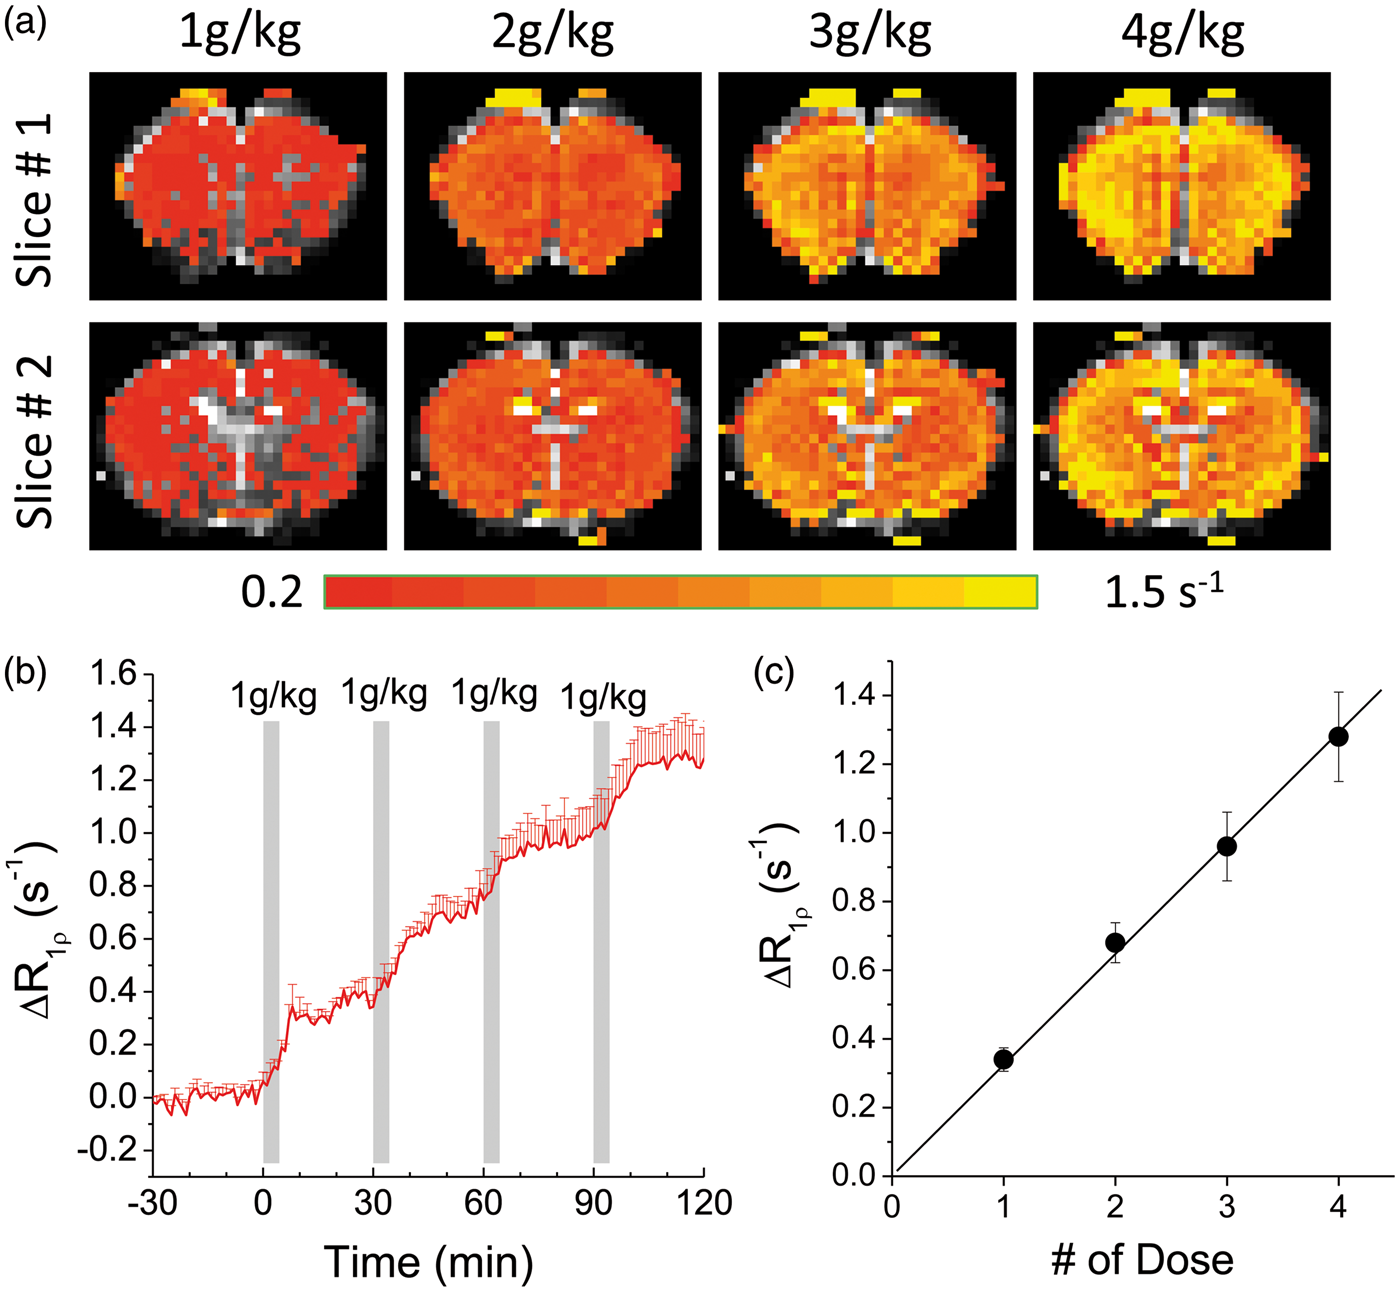
In vivo R1ρ change induced by 3OMG can be a combination of chemical exchange-sensitive and -insensitive contributions (see equation (3)). The chemical exchange effect of 3OMG is highly sensitive to the spin-lock power and diminishes at high γB1, as shown in Figure 2(c). Thus, to separate these two components, spin-lock power-dependent experiments were performed with a high 4 g/kg dose of 3OMG for enhancing the sensitivity (Figure 5(a)). The increase of R1ρ reached a peak at about 30–40 min after the injection and then decreased slowly. The peak intensity depends upon γB1 and decreases as γB1 increases. The averaged ΔR1ρ from 30 to 60 min post-injection is 1.99 s−1, 1.32 s−1, and 0.77 s−1 for 500 Hz, 2000 Hz, and 5200 Hz, respectively. The ratio of ΔR1ρ at 500 Hz to that at 2000 Hz is about 1.5. As an osmolality control, non-transportable mannitol was also studied for spin-lock power dependency. Figure 5(b) shows the time course of CESL with injection of 2 g/kg of mannitol, which rises to peak at approximately 10 min post-injection, much faster than that of 3OMG. Also, the magnitude is smaller, and the ΔR1ρ is almost independent of γB1, indicating that the source of change originates from non-chemical exchange effects, e.g. the osmolality effect via the ΔR2,0 term.
Separation of chemical exchange-sensitive and -insensitive contributions to 3OMG-CESL. Averaged time courses of brain cortical R1ρ changes were obtained at six different power levels with the IV injection of (a) 4 g/kg 3OMG (note that CESL data were not acquired during the ∼10-min injection period, indicated by the gray bar; n = 5 rats), and (b) 2 g/kg of mannitol (over 3–4 min; n = 4 rats). (c) The change of R1ρ, averaged from 30 to 60 min after injection as a function of spin-lock power. Unlike mannitol, ΔR1ρ of 3OMG decreases with spin-lock power, indicating dominant chemical exchange-sensitive contributions. A fitting of in vivo 3OMG-CESL dispersion data to equation (3) (black curve) yielded kex = 7480 s−1 and ∼25 mM of 3OMG.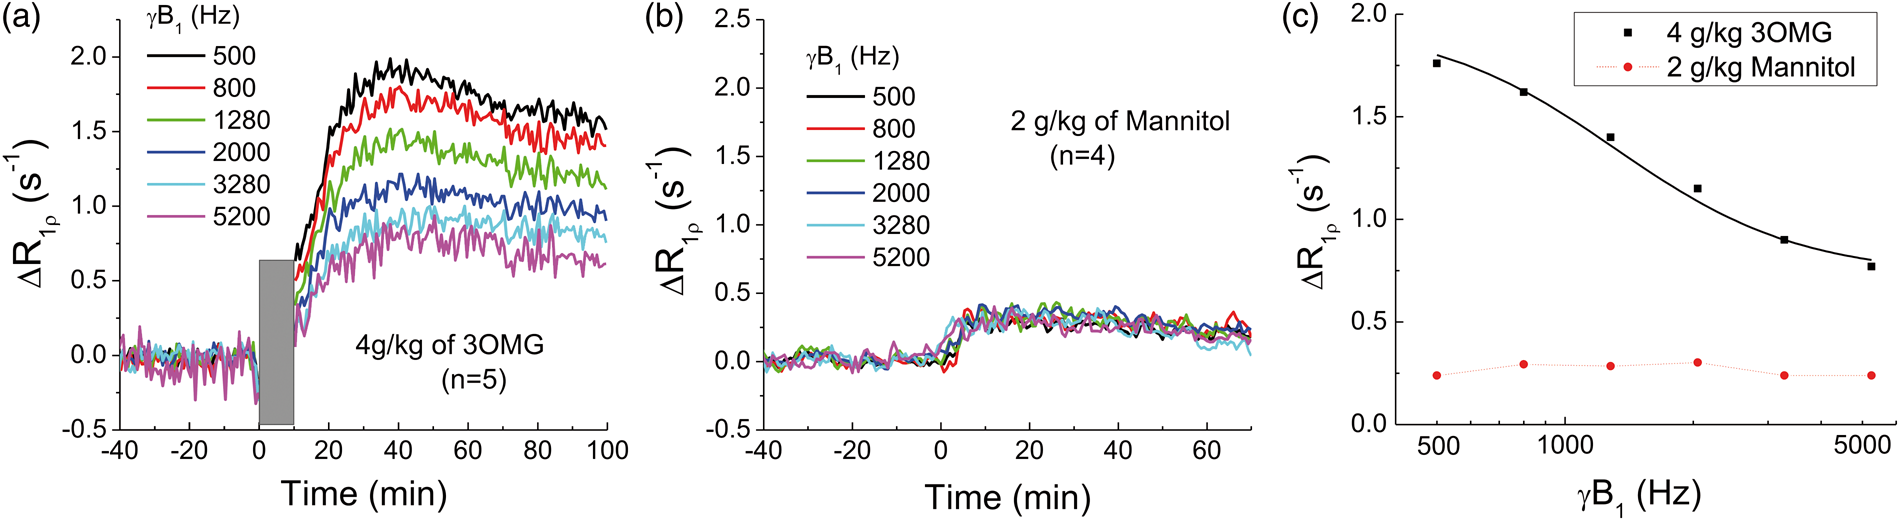
A fitting of the 3OMG-CESL dispersion data (black curve in Figure 5(c)) to equation (3) with a fixed chemical shift of 560 Hz yields Δp = 0.0009, kex = 7480 s−1, and ΔR2,0 = 0.75 s−1. Given that bulk water has 110 M of protons and that each 3OMG molecule has four hydroxyl protons, this increase of hydroxyl concentration (Δp) is equivalent to about 25 mM of 3OMG (=110 × 0.0009/4). Note that the fitted in vivo kex is much faster (∼70%) than that of the phantom with pH = 7.05 and similar to that of pH = 7.5. This difference is probably due to the presence of exchange catalysts in vivo.
Stroke imaging with 3OMG-CESL
Figure 6 shows the CESL MRI of stroke rats for the injection of 3OMG (Rat #1) or saline (Rat # 2) at ∼1 h post-MCAO. With 3OMG injection, the ΔR1ρ map (Figure 6(a)) shows a decrease in R1ρ within the 1 h ADC-defined ischemic core (green outlines in A–D), where the blood flow should be severely impaired, and thus the delivery and uptake of 3OMG are minimal. Similar R1ρ-decreasing pixels were detected within the ADC-defined core (green outlines in Figure 6(e) and (f)) in rats with saline injection.
Permanent MCAO rat brain MRI studies. (a, b) ΔR1ρ maps acquired with IV injection of 0.6 g/kg 3OMG at 1 h after MCAO onset. In (a), distinct regions of hypo-CESL (blue/purple pixels), normo-CESL (red pixels), and hyper-CESL (yellow pixels) are visible when no ΔR1ρ threshold is applied. In (b), only pixels with ΔR1ρ threshold ≥0.4 s−1 are shown. (c, d) ADC maps at 1 and 3 h after the MCAO onset. The early ADC-defined lesion at 1 h (green outline) has expanded at 3 h to include additional regions (purple outlines), representing recruitment to the ischemic lesion during this period. There is excellent overlap between hyper-ΔR1ρ regions in early (1 h) 3OMG-CESL data and the later (3 h) recruitment of additional pixels to the ADC-defined lesion. ΔR1ρ map of MCAO rats with saline injection at 1 h only showed a region with decreasing R1ρ (e), which matches with the ischemic core region from the ADC map (f). (g) ΔR1ρ histograms from 3OMG-CESL studies at 1 h after MCAO onset (n = 3 rats, averaged) were obtained from all pixels within three ADC-based ROIs—namely, the early lesion, recruited lesion, and contralateral normal regions. Clear distinction of ΔR1ρ is observed between early lesion, recruited lesion, and the contralateral normal tissue. The averaged ADC values (n = 3) for early and recruited lesion ROIs were 0.46 ± 0.05 and 0.63 ± 0.02 × 10⁻³ mm2/s at 1 h, and 0.41 ± 0.05 and 0.47 ± 0.04 × 10⁻³ mm2/s at 3 h post-MCAO, respectively. (h) Comparison of time courses of ΔR1ρ from all pixels passing the statistical threshold in the early lesion, recruited lesion, and contralateral regions.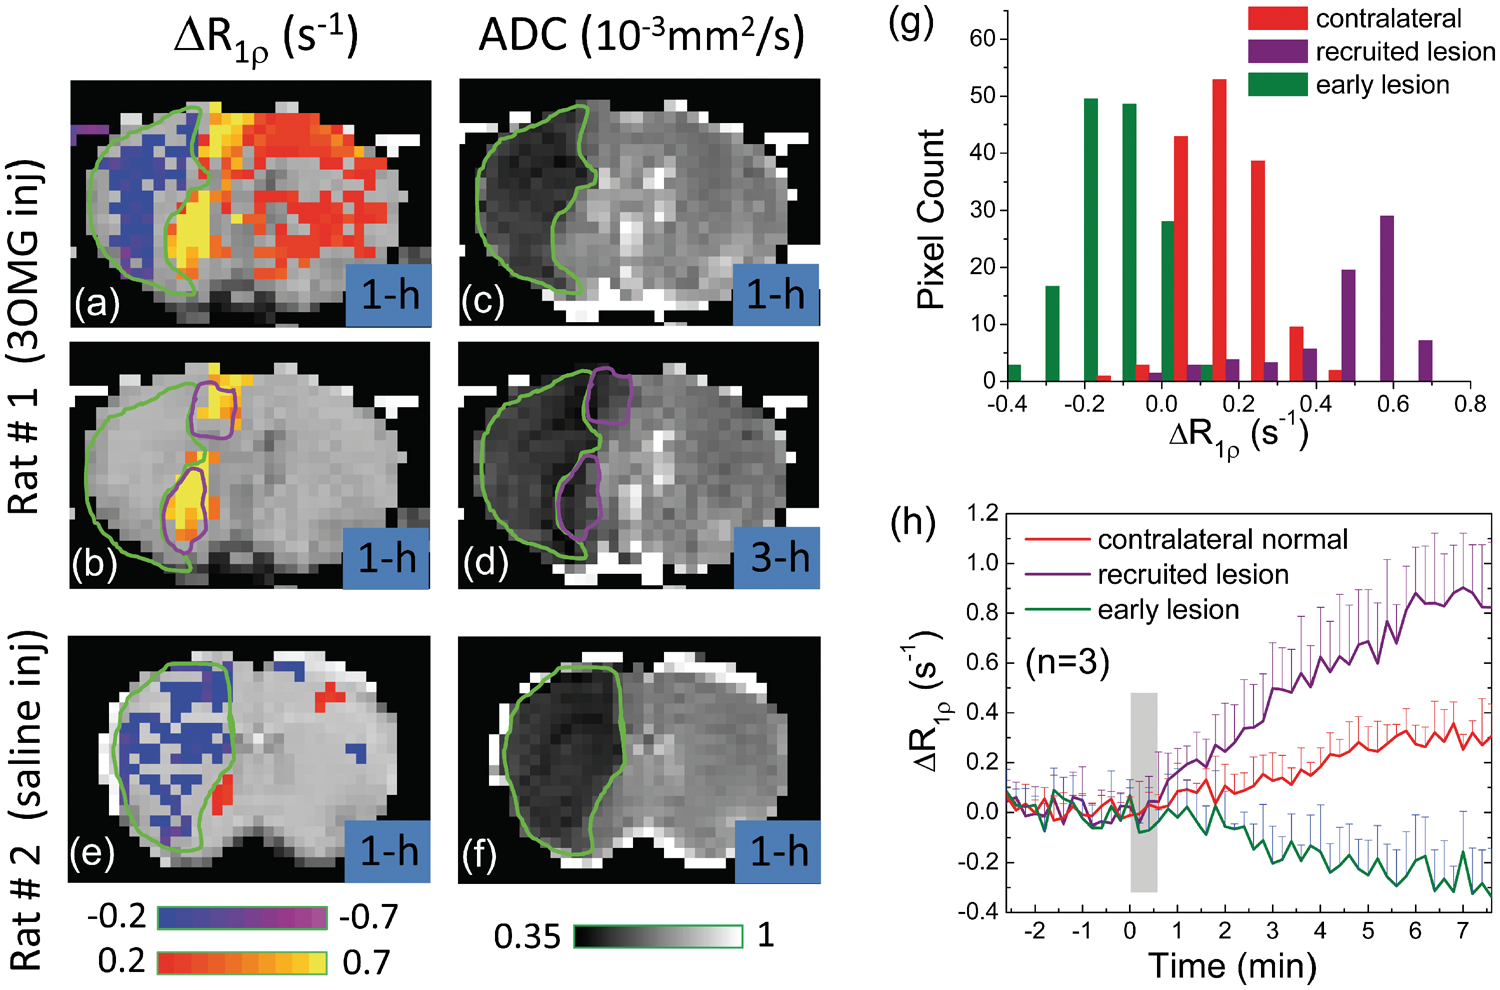
With 3OMG injection, the mild R1ρ increase in the contralateral side indicates the uptake of 3OMG in normal tissue. Interestingly, a much larger R1ρ increase appears adjacent to the ischemic core. These hyper-CESL pixels (yellow in Figure 6(b)) at 1 h match well with the expansion of the ADC lesion from 1 h to 3 h (purple outline in Figure 6(b) and (d)). Since the ischemic lesion evolves rapidly in MCAO for these Sprague–Dawley rats and the ADC lesion at 3 h can be used as a surrogate of the final lesion,31,32 such recruitment of the lesion retrospectively identifies the at-risk tissue at an earlier time (i.e. 1 h here). The averaged ADC values (n = 3) for the contralateral normal, early lesion, and recruited lesion regions are 0.68 ± 0.02, 0.46 ± 0.05, and 0.63 ± 0.02 × 10⁻³ mm2/s at 1 h post-occlusion and 0.67 ± 0.01, 0.41 ± 0.05, and 0.47 ± 0.04 × 10⁻³ mm2/s at 3 h post-occlusion, respectively. The histogram of Figure 6(g) obtained from the early lesion, recruited lesion, and contralateral normal tissues shows three distinct groups of hypo-, normo-, and hyper-CESL values with only small overlaps. Further, the ΔR1ρ time courses demonstrate very different temporal characteristics for three groups of pixels (Figure 6(h)). The rate of increase in R1ρ for the hyper-CESL region is about three times faster than that of contralateral normal tissues.
Discussion
Source of 3OMG-CESL
A change to the in vivo 3OMG-CESL signal would come mainly from the net change of total 3OMG molecules in the intravascular and extravascular space. While the 3OMG level in the intravascular blood rises to a peak immediately after the bolus injection, the slow time to peak of the ΔR1ρ time course indicates that the intravascular contribution should be negligible. This may be due to (1) a small arterial vascular volume fraction (about 1%) and (2) suppression of the venous component (with very short T2) in EPI acquisitions at a relatively long TE. 19 Since 3OMG cannot be metabolized, the signal would only derive from the 3OMG molecules in the intracellular and the extravascular–extracellular space. Nevertheless, since the intravascular 3OMG contribution to ΔR1ρ may be dependent on imaging readout scheme or magnetic field strength, further studies would be necessary to examine the intravascular signal contribution with flow-crushing gradients or intravascular contrast agents.
Previous studies showed a linear dependence of the blood glucose level versus the brain glucose concentration for a wide plasma glucose range of 4.5–30 mM,33,34 suggesting that under normal physiological conditions, glucose transport across the BBB is not rate-limiting within this blood glucose range. Our recent glucose-CESL study indicated that the ΔR1ρ is linearly dependent on the injection dose in the 0.25–1 g/kg range, 19 and this study extended the linear dependence up to 4 g/kg. The ratio of ΔR1ρ, averaged from 30 to 60 min post-injection at 500 Hz to 2000 Hz, is 1.5 for 3OMG with a 4 g/kg dose, smaller than both Glc and 2DG with a lower 1 g/kg dose (1.75 for Glc and 2.1 for 2DG). 19 When exchange rates are similar, the lower ΔR1ρ ratio indicates less relative chemical exchange contribution. This suggests that the osmolality effect on ΔR1ρ does not increase linearly with the injecting dose and that a large injection dose (4 g/kg) may introduce greater relative non-exchange contribution than a lower dose (1 g/kg). Indeed, with a bolus injection of 4 g/kg 3OMG, the non-exchange contribution (i.e. ΔR2,0) is about 37% of the total ΔR1ρ measured at 500 Hz. This is much larger than that obtained from a 0.25 g/kg dose of 2DG, 13 where the non-chemical exchange contribution was estimated to be less than 20% of the total ΔR1ρ. Thus, a lower injection dose would be preferred for CESL studies to increase the relative contribution of the chemical exchange component.
With a large dose of 3OMG injection, the osmolality of the blood plasma is much higher initially (with no 3OMG in extravascular space), which is expected to attract water from the extravascular space to the intravascular space. This osmolality induced water shift should lead to an increase of R2,0 as the concentration of macromolecules relative to water in the tissue increases. Note that compared to mannitol which stays in the intravascular space, the transport of 3OMG across the BBB to the brain would reduce this osmolality gradient towards a balance.
Sensitivity of 3OMG-CESL
Our phantom results show that 3OMG has similar chemical exchange properties to Glc and 2DG. For the same g/kg dose, the CESL sensitivity is dependent on its R1ρ per mM concentration and the molar weight. The R1ρ per mM concentration of 3OMG (0.063 s−1/mM) is similar to that of Glc (0.066 s−1/mM), but higher than 2DG (0.05 s−1/mM). 19 Also, the hydroxyl water exchange rate (4420 s−1 for pH of 7.05) is very close to that of Glc and 2DG (4500–4700 s−1). 19 Note that the molecular weight of 3OMG is higher than both Glc and 2DG (194 g/mol vs. 180 g/mol and 164 g/mol). Thus, the overall chemical exchange sensitivity of 3OMG is similar to that of Glc and 2DG.
The in vivo sensitivity of CESL is dependent on the net increase of hydroxyl-protons in the extravascular space induced by the administration of Glc or analogs. Both 3OMG and 2DG can be distributed in similar extravascular pools (see Figure 3(a)), but additional contribution from the accumulated intracellular 2DG6P further enhances the CESL response of 2DG compared to 3OMG (Figure 3(b)). Despite the lower CESL sensitivity of 3OMG than 2DG, an important advantage of 3OMG is its less detrimental effect on systemic physiology and brain function. 11 Consequently, a high 3OMG dose can be used, even though its maximum dose is undetermined.
The in vivo sensitivity of 3OMG-CESL within 30 min after injection is higher than Glc by approximately 40% (Figure 3(b)), presumably due to the non-metabolizable nature of 3OMG. Indeed, imaging of 3OMG transport in tumors has been recently reported with CEST MRI, showing a much higher CEST signal in tumors after an injection of 3OMG than Glc. 10 Besides offering higher sensitivity, a unique advantage of 3OMG is that it can be applied to certain diseases where the utility of Glc is limited. For example, in diseases where a hyperglycemic condition is detrimental to tissue, such as brain injury and acute stroke,35–37 injection of glucose may accelerate the lesion growth and should be prevented.
Stroke imaging with 3OMG-CESL
In acute ischemic stroke, one of the most important therapeutic targets is the penumbra—i.e. at-risk tissue that can recover its function with timely restoration of perfusion and will progress to an infarct otherwise. In MRI, the diffusion–perfusion mismatch has been often regarded to roughly approximate the penumbra. Despite the simplicity of this approach, its accuracy remains controversial. 38 Figure 6 suggested that CESL can differentiate ischemic core, at-risk, and normal tissues. The decrease of R1ρ over time in the ischemic core indicated minimal uptake of 3OMG and agreed with previous spin-lock MRI studies of MCAO rats.39–41 This observation can be explained by the well-known gradual R2-decreasing effect (i.e. T2 increase) caused by vasogenic edema. The early hyper-CESL responses at the normal-ADC region adjacent to the ischemic core likely indicated the at-risk tissue, because it progressed to an ischemic core a few hours later. This is similar to animal autoradiography42–44 and fluorodeoxyglucose PET studies,45–48 which demonstrated elevated glucose metabolism within the penumbral zone surrounding a focal infarct.
Unlike PET or autoradiography studies, the 3OMG-CESL contrast is indirectly obtained from water and may be caused by differences in glucose transport, tissue pH, the osmolality effect, or BBB permeability between ischemic and normal tissues. Thus, the exact source of the CESL contrast in ischemic brain is still unclear. A dynamic R1ρ dispersion study, similar to that in Figure 5, may be needed to determine if the contrast is mostly due to the changes in 3OMG transport or is strongly affected by the pH, BBB permeability, and/or the osmolality effect. Nonetheless, our proof-of-principle study showed that the 3OMG-CESL approach can differentiate at-risk tissue from other ischemic and normal tissues in <10 min of scan time. This duration may be further reduced with optimization of the acquisition paradigm. Thus, 3OMG-CESL may provide a valuable diagnostic tool to aid therapeutic decision-making.
Conclusion
We have demonstrated that 3OMG has similar chemical exchange properties as 2DG and Glc and unique advantages relative to 2DG and Glc for in vivo studies—i.e. less toxicity than 2DG and higher sensitivity than Glc. The in vivo 3OMG-CESL signal is mainly caused by the 3OMG transport to the extravascular space but also has a small contribution from the non-chemical exchange effect. In MCAO rats, preliminary results suggest that 3OMG-CESL can stratify different ischemic regions, and identify a region in the ipsilateral brain that will progress to an infarct. This glucose analog can be an attractive molecule to study in disease models that affect glucose transport, especially in applications where the injection of
Footnotes
Funding
The author(s) disclosed receipt of the following financial support for the research, authorship, and/or publication of this article: This work is supported by NIH grants EB003324, P30-NS076405 and P30-CA047904, and the Institute for Basic Science in Korea (IBS-R015-D1).
Acknowledgement
We thank Kristy Hendrich for maintaining the 9.4 T system.
Declaration of conflicting interests
The author(s) declared the following potential conflicts of interest with respect to the research, authorship, and/or publication of this article: A patent has been filed by the University of Pittsburgh, and TJ, HM, and SGK are listed as authors on this application.
Authors’ contributions
TJ contributed to the study design, data acquisition, data analysis and interpretation, manuscript drafting and revision. MH took part in the data acquisition, analysis and manuscript revision. PW was involved in study setup, animal surgery, and manuscript revision. SGK was involved in the experimental design, data interpretation, and manuscript revision.