
Abstract
Brain slice glucose utilization (SGU) can be measured by methods analogous to those used for in vivo cerebral glucose utilization. In order to make this technique more accessible and applicable to a broad range of experimental conditions, we have derived a simplified operational rate equation and generated the table of apparent rate coefficients necessary to apply the equation under different experimental situations. Calculations of the apparent rate coefficients were based upon an eight-parameter kinetic model combined with Michaelis–Menten theory to account for changes in the rate constants as a function of buffer glucose concentration. The theory was tested with a series of experiments using rat brain slices, [14C]-2-deoxyglucose (2DG) and [14C]-3–O-methylglucose (3OMG). The errors involved in the simplified technique were estimated by a variety of techniques and found to be acceptable over a broad range of conditions. A detailed, practical protocol for the simplified method is presented.
Measurement of glucose utilization with radiolabeled 2-deoxyglucose (2DG) is among the most useful methods available for studying the metabolic activity of brain. Since the original description (Sokoloff et al., 1977), this method has been used to analyze the metabolic behavior of a very broad range of normal and pathological processes, both in animal models and in humans. Our laboratory has attempted to extend this valuable technique to the analysis of brain metabolism in vitro. The relative accessibility of in vitro material has allowed us to propose and test detailed kinetic models of 14C-2-deoxyglucose (2DG) metabolism in brain slices from both hippocampus and hypothalamus (Newman et al., 1990). Unfortunately, the theoretical considerations and complexity of determining rate constants can obscure the basic simplicity of the method unless standardized protocols and rate constants are available. The present work is an effort to simplify and standardize the method. It is possible to state the operational rate equation for in vitro glucose utilization as a simple linear equation and calculate in vitro glucose utilization analogous to in vivo results after measuring total tissue radioactivity, C*i, and radioactivity of the perifusing medium, C*p. In order to make this practical, however, it is necessary to generate apparent rate coefficients, K′, which are applicable to the experimental conditions, including the times of tissue incubation and rinse and the glucose concentration, Cp. Ideally, these Ks will be relatively insensitive to changes in the kinetic rate constants, which can change with experimental conditions.
The primary goals of this article are to establish the theoretical basis for this simplified method and to generate the tables of apparent rate coefficients required for the calculations, correcting for as many experimental variables as possible. The technique for the simplified method is presented below. We also estimate the error introduced by the use of coefficients that are not specific for the experimental system. Calculations of rate coefficients are based on a Michaelis–Menten model that was tested by incubating hippocampal brain slices with [14C] 2DG and measuring the 2DG phosphorylation rate constant, rate*; volume of distribution, Vd, for 2DG; the hexokinase rate constant, k3; and brain slice glucose utilization (SGU). The model was also tested using [14C]-3–0-methylglucose (3OMG), which was used to measure the hexose efflux rate from tissue.
THEORY
Our approach to calculating brain SGU is based on a compartmental kinetic model that is modified using Michaelis–Menten theory to predict the changes in the kinetic rate constants as glucose concentration changes. Unfortunately, calculation of SGU in this manner is dependent upon the value of Ve, the physical space accessible to glucose, and Ve cannot be determined experimentally. We attempt to address this issue by establishing upper and lower limits for Ve, determining the theoretical predictions for how these limits effect the kinetic rate constants, and then choosing between the limits based on the experimental behavior of the rate constants with changing glucose concentrations.
Prior kinetic studies of 2DG metabolism in brain slices are consistent with the known biochemistry of this glucose analogue (Newman et al., 1990). We consider five metabolic compartments: the perifusing bath, the tissue pool of unreacted 2DG, tissue 2-deoxyglucose-6-phosphate (2DG6P), a combined pool of 2-deoxyglucose-l-phosphate (2DG1P) and deoxyglucose-uridine diphosphate (UDP-2DG), and 2DG-glycosylated macromolecules, primarily glycogen and glycoproteins (Fig. 1). Dephosphorylation of 2DG6P is treated as a single step since, subject to the assumptions of our model, transport into endoplasmic reticulum was found to be rate-limiting, with ester hydrolysis and transport out of the organelle being much faster, so that adding a separate compartment is unnecessary. By incubating brain slices from hippocampus or hypothalamus with 2DG for varying periods of time or incubating slices for 60 min and then rinsing them for varying times, it has been possible to determine rate constants for transport among the five compartments. In general, the rate constants K*1, K*2, K*3, K*4, and K*6 are very similar to those found in vivo (Schmidt et al., 1989), considering our K*6 analogous to their K*5. Although no in vivo estimates are available for comparison of rate constants K*5, K*7, or K*8, our values are in agreement with measurements of radiolabeled glycogen after administration of 2DG (Nelson et al., 1984; Bass et al., 1987). Based on the differential equations that describe this kinetic model, it is possible to derive an operational equation for calculation of glucose utilization.
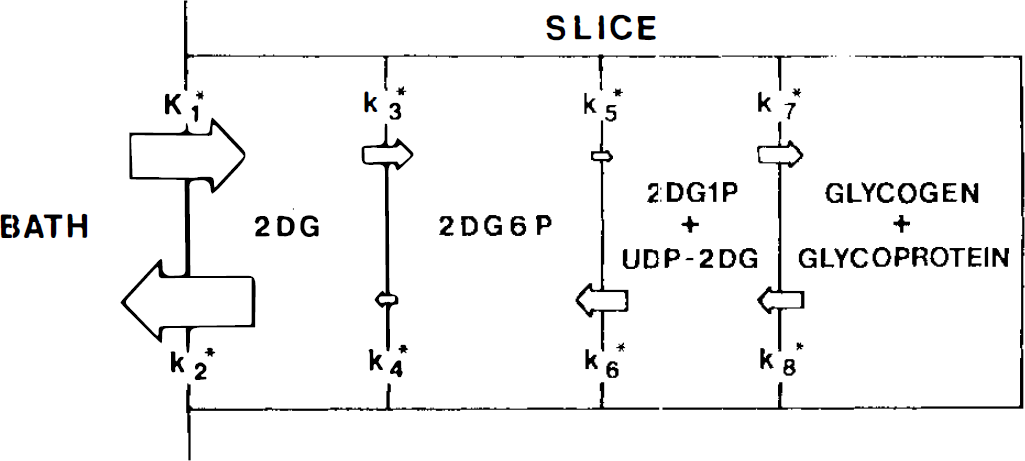
Five compartment-eight parameter model of 2-deoxyglucose metabolism (taken from Newman et al., 1990). 2DG6P is 2-deoxyglucose-6-phosphate, 2DG1P is 2-deoxyglucose-1-phosphate, and UDP-2DG is uridine diphosphate 2-deoxyglucose. Area of individual arrows is scaled to the relative size of the appropriate rate constants for 540 μm hippocampal slices. See Theory for further details.
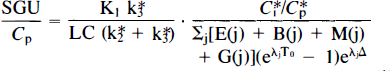
In Eq. 1, SGU is the rate of slice glucose utilization; Cp is the concentration of glucose in the perifusate; C*i is the total radioactivity in the tissue; C*p is the perifusate radioactivity; LC is the lumped constant; E(j), B(j), M(j), G(j), and λj are kinetic parameters derived from the rate constants K*1-K*8; To is the time of incubation; and A is the duration of rinse (Newman et al., 1990, Eq. 9). This form of the equation (Hutchins et al., 1984) was chosen over other possible forms based upon error analysis. An additional benefit of this form of the equation, however, is that, once the rate constants have been determined for the tissue, and Cp, To, and δ are chosen, the entire equation reduces to a single value multiplied by C*i/C*p, and Cp to obtain glucose utilization.

In Eq. 2, K′ represents an apparent rate coefficient with units min−1 and includes all of the elements in Eq. 1 except Cp and measured tissue and bath radioactivities. Once the rate constants are known for any Cp, it is possible to generate a table of apparent rate coefficients for Cp at any incubation and rinse times. Additionally, if the behaviors of the rate constants as a function of glucose concentration are also known, then it is possible to expand the set of tables to account for variations in incubation glucose concentrations as well as the times of isotope exposure and rinse. Availability of such a set of tables makes it possible to calculate glucose utilization for a broad range of conditions simply by measuring tissue and bath radioactivity and using the appropriate apparent rate coefficient.
Generating the table of apparent rate coefficients requires that values be assigned to each of the kinetic rate constants, K*1-K*8 and to LC. Our simplified model for calculating SGU describes the variation of K*1-K*3 with extracellular glucose, Cp, using a Michaelis–Menten model and assumes that the rate constants K*4-K*8 remain unchanged with Cp, consistent with our prior kinetic results with 540 and 1,000 μm hippocampal slices in 4 mM glucose, and 540 and 1,000 μm hypothalamic slices in 10 mM glucose (Newman et al., 1990). Once calculated using kinetic rate constants determined at a single Cp, Michaelis–Menten parameters can be used to estimate kinetic rate constants at Cps not actually studied. The parameters also provide insight into the kinetic behavior of the tissue. The theory relating Michaelis–Menten kinetics to the operational rate equation is found in the Appendix.
EXPERIMENTAL PROCEDURES
Materials
All buffers and inorganic salts were obtained from Sigma Chemical (St. Louis, MO, U.S.A.) and were tissue culture grade. The 95% O2-5% CO2 mixture and liquid nitrogen were purchased from Matheson (E. Rutherford, NJ, U.S.A.). All [14C]-2-deoxyglucose [specific activity (SA) >50 mCi/mmole], [14C]-glucose (SA >50 mCi/mmole), 14C-3-O-methylglucose (3OMG) (SA >154 mCi/mmole), and 14C standards were from Amersham (Arlington Heights, IL, U.S.A.). Isopentane, Class IA, was obtained from Fisher Scientific (Fair Lawn, NJ, U.S.A.) and scintillation cocktail from National Diagnostics (Manville, NJ, U.S.A.). Water was deionized and purified to a resistance of 17 MOhm with a Barnstead NANOpure system (Boston, MA, U.S.A.)
Tissue preparation and analysis
All of our methods for brain slice preparation, tissue extractions, anion exchange column chromatography, and scintillation counting were the same as previously described (Newman et al., 1990). In brief, 500 μm thick brain slices were isolated from the hippocampi or hypothalamus of male Sprague-Dawley rats (250–300 g), preincubated in Krebs–Ringer (K-R) at 37°C for 1 h and then incubated with radioisotopes as discussed below. After 2DG incubation and rinsing, slices were freeze-clamped in liquid nitrogen. The frozen tissue was trimmed of macroscopic white matter at −20°C and homogenized to a slurry in three aliquots (totaling 200 μl) of ice-cold 0.6 M perchloric acid. A protein pellet was obtained by centrifuging at 10,000 g for 15 min, after which the perchloric acid was removed by neutralization, precipitation, and recentrifugation. The supernatant was loaded onto AG1-X8 anion exchange columns for separation of 2DG from 2DG6P by elution with sequential solutions at pH 10–11 and pH 1.2. Radioactivity of all fractions was determined with an LKB 1214 scintillation counter and normalized for sample protein content (Lowry et al., 1951). Perifusate radioactivity was taken as the average of pre- and postincubation measurements since the radioactivity declines by only 2–3% during the course of the incubation.
All tissue radioactivity was reported (in ml/g) by normalizing C*i, the radioactivity per gram of tissue (in nCi/g) to the bath radioactivity, C*p (in nCi/ml). Tissue weight was, in turn, calculated by multiplying the measured sample protein by the previously determined protein to wet weight ratios of 84 mg/g for hypothalamic slices (Newman et al., 1988) or 74 mg/g for hippocampal slices (unpublished results). Total tissue water was determined by subtracting the measured slice dry weight from the measured slice wet weights for slices incubated 1.5 to 4 h in K-R. Slices were weighed on a Mettler H51AR balance (Mettler Instrument Co., Hightstown, NJ, U.S.A.), dried for 48 h at 60°C at −29 kPa, and then re-weighed.
For direct measurement of the rate constant of 2DG phosphorylation at different glucose concentrations, four slices were isolated from a single animal and maintained together in a single incubation chamber until individual slices were removed. Hippocampal slices were preincubated at K-R with 4 mM glucose for 1 h while hypothalamic slices were preincubated in K-R with 10 mM glucose to maintain uniformity with our prior experiments. In either case, osmolarity was maintained at 299 mOsm, through adjustment of NaCl. For both hippocampal and hypothalamic slices, after 1 h, slices were transferred to incubation chambers, equilibrated with K-R with the test glucose concentration, which was either 4, 7, or 10 mM, and maintained in that chamber for 20 min to have the slices come to steady state at the new glucose concentration. Based on our prior studies, steady state is expected in <15 min. After this 20 min period, slices were then transferred as a group of four to a third chamber equilibrated with K-R buffer containing the same test glucose concentration and 0.28 μCi/ml of 14C-2DG. Individual slices were then removed after 15, 25, 35, or 45 min and frozen for analysis as previously described, with exact times assigned at the time of freeze-clamping. Additional hippocampal slices at Cp of 4, 7, and 10 mM, were incubated in the presence of 2DG for 30 min and rinsed for 15 min for calculation of SGU with Eq. 2 as described below using K′ = 12.8 min−1. These SGU results were compared to values of SGU calculated with Eq. 27 and the results of the graphical analysis method in order to test the predictions of our theory. Finally, a set of hippocampal slices were incubated and rinsed for varying periods in 4 mM glucose for calculation of SGU using Eq. 2 with the appropriate values of K′ from Table 1 in order to test the range of times over which the method is applicable. SGU values were compared by analysis of variance (ANOVA).
Apparent rate coefficients (K′) for 500 μm hippocampal slices a
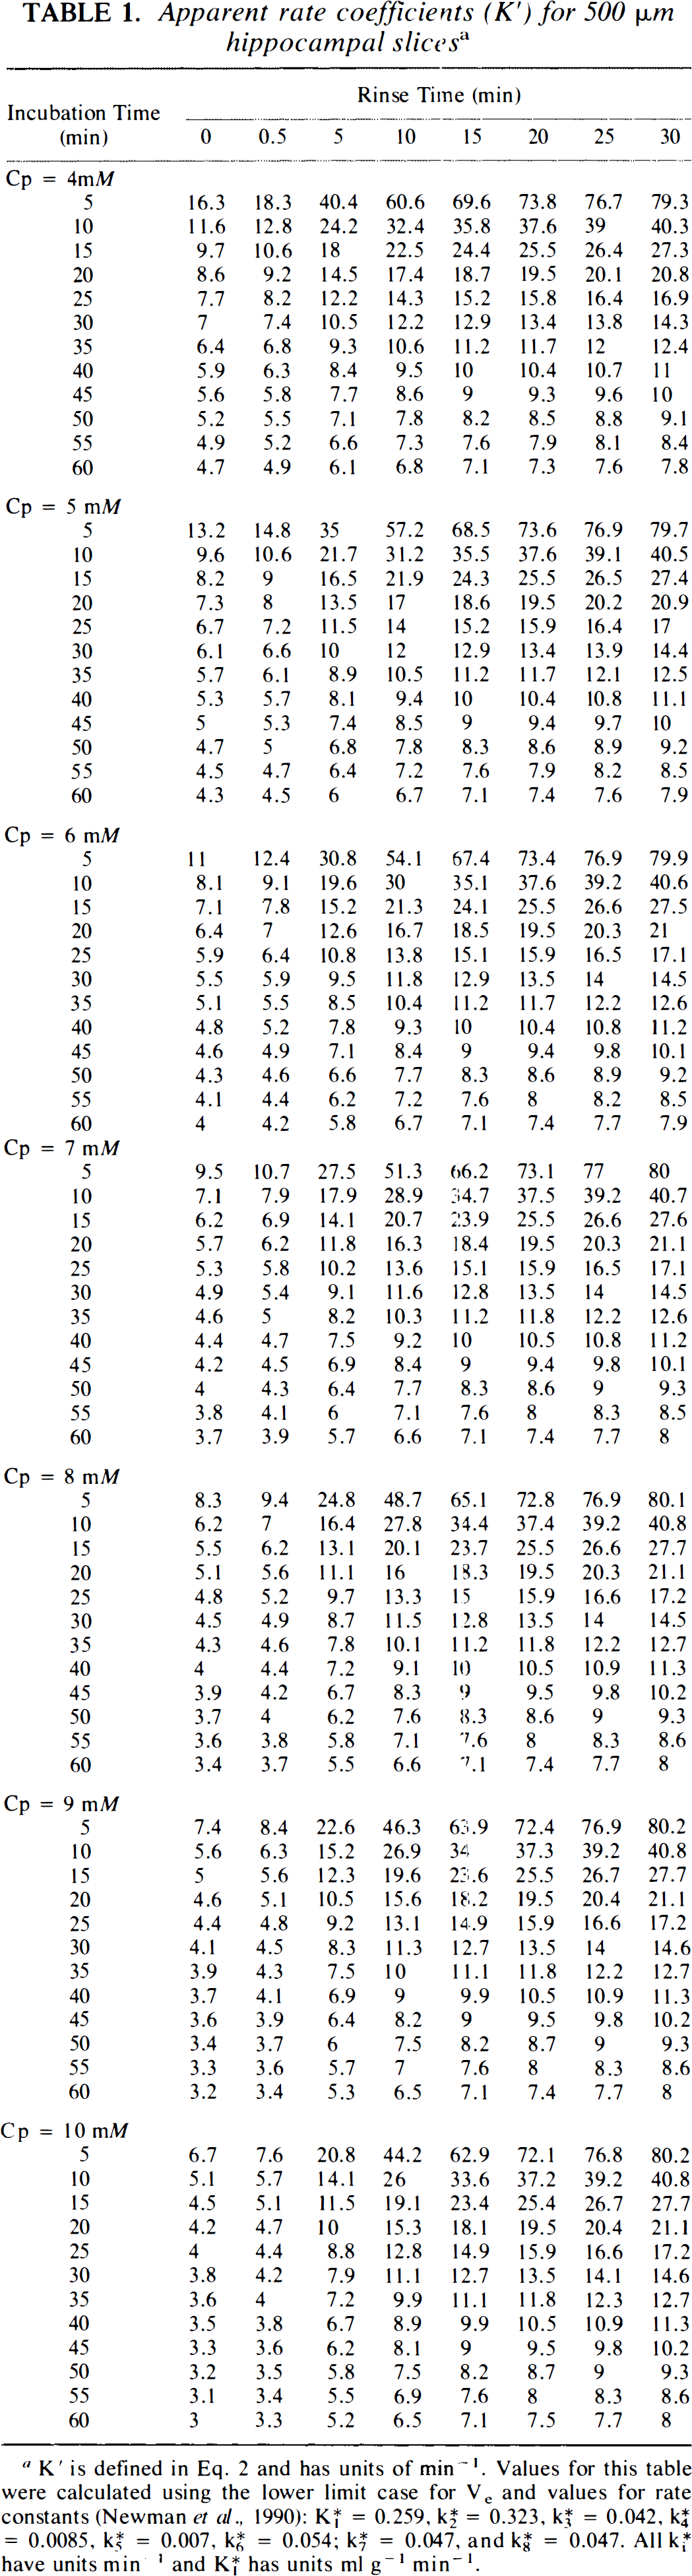
K′ is defined in Eq. 2 and has units of min−1. Values for this table were calculated using the lower limit case for Ve and values for rate constants (Newman et al., 1990): K*1 = 0.259, K*2 = 0.323, K*3 = 0.042, K*4 = 0.0085, K*5 = 0.007, K*6 = 0.054; K*7 = 0.047, and K*8 = 0.047. All K*i have units min−1 and K*1 has units ml g−1 min−1.
A similar paradigm was followed for experiments involving measurement of 3OMG efflux. Six or seven 500 μm hippocampal or hypothalamic slices were isolated from a single animal, incubated for 1 h in K-R with 4 or 10 mM glucose, respectively, and then incubated in K-R with either 4, 7, or 10 mM glucose for 20 min. After 20 min at the test glucose concentration, slices were transferred as a group to a chamber pre-equilibrated with K-R containing the same test glucose concentration and 0.28 μCi/ml of 3OMG. All slices were incubated with radioisotope for 60 min and then transferred back to the chamber equilibrated with K-R at the test glucose concentration without radiotracer. Individual slices were then removed after rinse times varying from 5 s to 22 min, with exact times assigned at the time of freeze clamping.
Mathematical analysis
The 2DG phosphorylation rate constant was calculated using the graphical analysis method (Patlak and Blasberg, 1985) treating the four slices obtained from a single animal and co-incubated in 2DG as a single data set. For our experimental procedure, the graphical analysis method reduced to plotting C*I/C*Pv. (1 – e−kbt)/Kb, where t is the time, kb is ∼k*2 k*4/(k*2 + k*3), representing the effective constant for loss of 2DG6P from the tissue, and the slope is equal to the phosphorylation rate constant. The value of kb was chosen empirically, using data for 10 mM hippocampal slices by altering kb to minimize the sum of the squares. The value obtained in this manner, kb = 0.010 min−1, was used for all subsequent calculations. Because the measured volume of distribution for 2DG at later time points includes contributions from dephosphorylation of 2DG6P in tissue as well as dephosphorylation of acid-labile phosphorylated compounds during tissue extraction (Newman et al., 1990), we estimate the volume of distribution for 2DG for each data set by using only the measured volume of distribution for 2DG of slices incubated for 15 min. Our prior studies suggest that this is more than enough time for 2DG to come to steady state but that contribution of later reaction products is still minimal. For this case, the volume of distribution of 2DG will be equal to V*d. The value of K*3 was calculated for each set of slices by dividing the 2DG phosphorylation rate constant by V*d, since
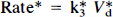
where V*d = a*e/C*p in the early steady state. The mean values of Rate*, V*d, and K*3 were calculated for each tissue type and each Cp from the values of each set. Two of 34 data sets were not included in the calculation of mean values since a negative slope was observed. SGU was calculated from the 2DG phosphorylation rate constants, the glucose concentration, Cp, and the lumped constant, LC, using the equation

where the 2DG phosphorylation rate constant (Rate*) is in ml g−1 min−1, Cp is in mM, LC is unitless, and multiplication by 100 yields units of μmole/100 g/min.
For analysis of 3OMG experiments, the three sets of slices for each glucose concentration (4, 7, and 10 mM) were analyzed individually and then together by least squares methods using one, two, or three exponential equations, with weighting as 1/C2. As in our earlier studies (Newman et al., 1990), because single exponential equations could not adequately describe the combination of initial rapid decline in 3OMG and slower efflux after 10 min, and since three exponents did not improve the sum of the squares beyond that produced with two exponents, a double exponential equation was used to analyze the 3OMG data. We also used the two exponential curve to analyze the data with a four parameter, serial three compartment model by least squares methods. For hippocampal slices in 10 mM glucose, it was necessary to fix one of the rate constants in order to achieve convergence. This has been necessary on rare occasions in the past for particular data sets. We chose to set k3MG = 0.04 to avoid fixing the rate constants of the larger pool. Equivalently, k3MG could have been used. The value of 0.04 was chosen from the fit of the entire hippocampal data at all Cp. Setting k3MG = 0.02, based on results at 4 and 7 mM glucose, would have changed the other rate constants only slightly and would not affect the overall conclusions of the analysis.
Comparison among best fit curves for 3OMG efflux was accomplished by calculating the F statistic for sum of squares,
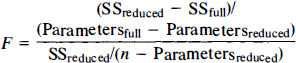
where “full” refers to the complete model using a separate equation for each Cp with a total of 12 parameters (Parametersfull = 12), “reduced” refers to a simpler model in which a single equation is assumed to describe the efflux of 3OMG at all three Cp (Parametersreduced = 4), SS is sum of the squares for the full or reduced model, and n is the total number of measurements at all Cp. With n = 59, the comparison for three equations in the full model utilizes F8,55.
It is possible to predict the changes which occur in K*1, K*2, and K*3 and other kinetic parameters, and, thus, for K′ in Eq. 2, as a function of Cp by using the Michaelis–Menten models. However, calculation of K′ is sensitive to Ve, so that it is necessary to assign a value for this parameter as well. Because Ve cannot be measured, we have taken the approach of estimating the upper and lower limits and then exploring the kinetic predictions of each limit. These predictions can be tested experimentally so that the appropriate value of Ve can be chosen for calculation of K′. As discussed in the Appendix, the upper limit for Vc. was assumed to be the measured tissue water compartment and the lower limit was taken to be Ve = K*1/K*2. The upper limit estimate depends on the additional assumptions that 2DG partitions only into water and that the volume of distribution of 2DG cannot exceed the total tissue water space. The y-intercept of 3OMG efflux can provide an independent estimate of K*1/K*2, since this compound is not significantly phosphorylated in mammalian brain tissue during the time course of these experiments (Jay et al., 1990; Holden et al., 1991). Rinse times as short as 5 s were measured. Predicting the values of the kinetic parameters at varying Cp also requires that K*1, K*2, K*3, and Vd be known accurately for at least one Cp. We have previously determined values for these constants for hippocampal slices in 4 mM glucose and for hypothalamic slices in 10 mM glucose (Newman et al., 1990). Using these assumptions, relationships and values, it is possible to use the Michaelis–Menten model to predict the behavior of K*1/K*2, K*1, k*2, k*3, LC, ae, the 2DG phosphorylation rate constant, and SGU as functions of Cp and to calculate values of K′, the apparent rate coefficient, at any Cp. Predictions of the model for 2DG phosphorylation rate constants, V*d K*3, and SGU can be compared to the experimental values at 4, 7, and 10 mM glucose.
A complete set of apparent rate coefficients, K′, were generated for 500 (Am hippocampal slices at Cp of 4, 5, 6, 7, 8, 9, and 10 mM glucose, with To, the duration of incubation, varying from 5 to 60 min in 5-min increments, and values of A, the duration of rinse at 0 and 0.5 min, as well as 5–30 min in 5-min increments. Tables were also generated for 500 (Am hypothalamic slices at Cp = 10 mM and 1,000 (Am thick hippocampal slices at Cp = 4 mM.
The error introduced by using 500 μm hippocampal slice apparent rate coefficients for slices from other tissues was estimated by comparing the 500 (Am hippocampal slice K′ to the set of K′ based upon the kinetic rate constants for 500 (Am hypothalamic slices at Cp = 10 mM and to the K′ for 1,000 (Am hippocampal slices at Cp = 4 mM, conditions for which we have previously determined kinetic rate constants (Newman et al., 1990). In addition, error analysis was conducted by doubling or halving K*2 or K*3 and recalculating K′. There is no need to test or state the variability of K′ with K*1 since we have chosen from among the several possible forms of the rate equation (Hutchins et al., 1984) to use a form of the operational rate equation in which K*1 does not appear. Sensitivity was similarly determined with apparent rate coefficients generated after increasing either K*2 or K*3 by 1%. The error in all cases was calculated as

where K′true is the apparent rate coefficient for hypothalamic slice, thick hippocampal slices or altered kinetic rate constants and K′hc is the apparent rate coefficient for control 500 μm hippocampal slices at the same Cp, To, and Δ.
SIMPLIFIED METHOD OF BRAIN SGU
Every effort has been made to design the technique so that animal species, region of brain, and methods of slice preparation are not critical. Thus, investigators can employ their usual brain slice methods. Our techniques with rat hippocampal slices have been described in detail (Newman et al., 1989). We recommend that all brain slices be allowed to recover at least 75 min after isolation, including at least 15 min to reach thermal equilibrium at the eventual incubation temperature, which should be as close to 37°C as tolerated by the slices. We use K-R as our control buffer. If the slices are to be incubated in an experimental buffer, we change the buffer after 75 min of preincubation and allow the slices at least an additional 15 min to reach equilibrium. Incubations are begun by exposing the slice to an otherwise identical buffer containing 0.28 μCi/ml of 2DG (Amersham, Arlington Heights, IL, U.S.A.; sp. act. >50 mCi/mmole). It is important that the buffer change be completed in <1 min. Our chamber and ring system design (Newman et al., 1989) permits a complete buffer change in seconds. In standard brain slice chambers, it may be preferable to add an aliquot of buffer directly to the chamber and change buffer flow using a stopcock placed immediately adjacent to the chamber buffer inflow port. Buffer recirculation with volumes as small as 5 ml does not appear to alter the results as long as buffer oxygenation is adequate. Slices should be incubated in radioactive buffer for exactly 30 min, at which point the buffer should be changed back to the same buffer without isotope. After 15 min of rinse, the slice is then removed from the chamber using a brush or other slice handling device, but definitely not with forceps, which can crush the slice, releasing intracellular label. Buffer radioactivity, C*p, should be calculated as the mean of radioactivities measured with 50 μl aliquots taken at the beginning and end of the incubation period since bath radioactivity declines by 2–3% during a 30-min incubation, depending on incubation buffer volume.
SGU can be measured either for whole slice by scintillation counting or with regional analysis by autoradiography. For whole slice assay, the slice is removed from the chamber after incubation and rinse, and placed on Teflon tape resting on a glass microscope slide. All buffer transferred with the slice to the Teflon is removed with a wedge of filter paper, which is counted by scintillation counting as below. Since buffer accompanying the slice after the brief rinse was initially free of radioactivity, any radioactivity present in the buffer during the removal with filter paper must have come from the slice and should be included in the total tissue radioactivity. The slice is then covered with a plastic cap to lessen dessication, weighed on an analytical balance with ±0.01 mg resolution, picked up with a spatula, placed in a 1.5 ml centrifuge tube, and frozen. The microscope slide with tape and cap is re-weighed to obtain the weight of the slice. The slice is thawed and then homogenized (Newman et al., 1989) or sonicated in 200 μl of distilled water (Microson XL Ultrasonic Cell Disrupter with a 3/32 inch microprobe, Heat Systems, Farmingdale, NY, U.S.A.) at 30% maximum power with three 1-s pulses or until complete dispersion. The tip is rinsed in an additional 200 μl water and the entire 400 μl sample counted in 5 ml of scintillation cocktail (National Diagnostics, Manville, NJ, U.S.A) for 10 min using an LKB 1214 scintillation counter. Radioactivity of the wedge of filter paper, measured by placing the wedge in 5 ml of scintillation cocktail, is added to the extract radioactivity to obtain the total radioactivity for that slice. The radioactivity is then divided by slice weight to obtain C*i, the tissue radioactivity, with units of dpm/mg. It is also possible to use slice protein as the indicator of mass. Although we believe that wet weight is preferable for SGU, we recognize the value of also measuring slice protein, which then permits calculation of the wet weight/protein ratio for the slice. Because this is a useful independent parameter, we continue to measure both wet weight and protein of the slices. Regional SGU may be obtained directly in units of nCi/g by autoradiography, as previously described in detail (Newman et al., 1989). Bath radioactivity should be expressed as dpm/μl for whole slice SGU or calculated as nCi/ml for SGU by autoradiography using the relationship that 1 nCi = 2,220 dpm.
SGU is calculated with the same operational rate equation regardless of whether scintillation counting or autoradiography is used to determine total tissue radioactivity

where K′ represents an apparent rate coefficient taken from Table 1, C p is buffer glucose concentration in mM, C*p is total tissue radioactivity, and C*p is the bath radioactivity. As discussed below, for 30-min incubations with a 15-min rinse, K′ varies only slightly, from 12.9 at 4 mM glucose to 12.7 at 10 mM glucose, so that we suggest the use of a single value, K′ = 12.8. SGU, calculated with Eq. 7 in this manner, is in units μmole/100 g/min and is, thus, directly comparable to that obtained by the usual in vivo method (Sokoloff et al., 1977).
RESULTS
2DG kinetics
A graph illustrating the calculation of the 2DG phosphorylation rate constant is shown for a typical experiment with hippocampus for Cp = 7 in Fig. 2, with C*i/C*p for 2DG plotted against the quantity (1 — e−kbt)/kb, which has units of time. This graph illustrates that there is a linear increase in C*i/C*p from 15 to 45 min when plotted by the graphical analysis methods, with kb = 0.01. Note also that the intercept is below the value of V*d. This is appropriate since

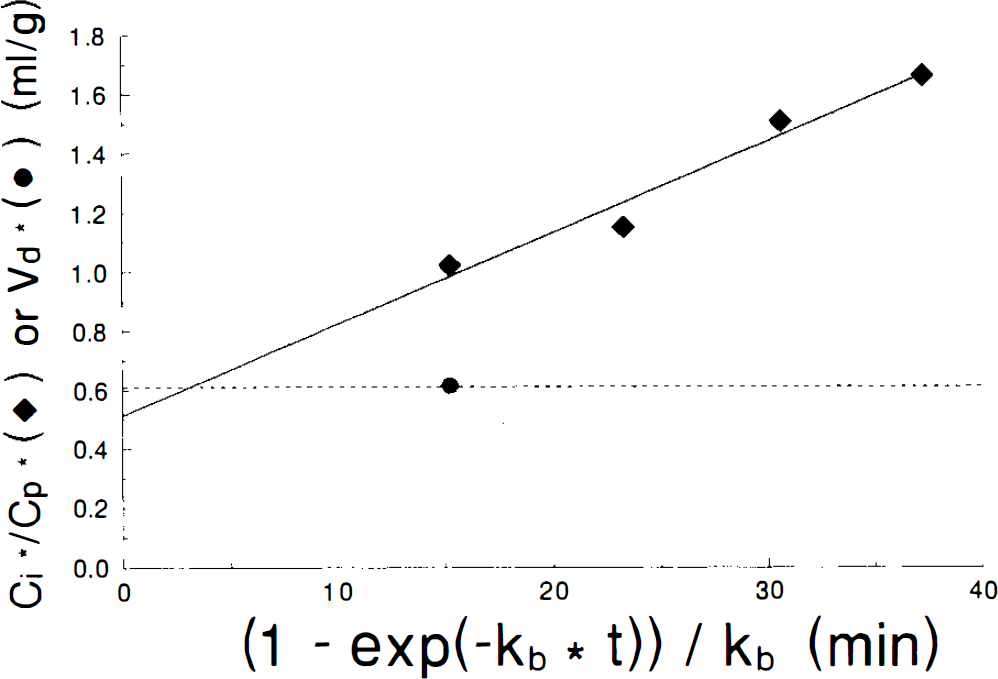
Graphical analysis plot of C*i data (diamonds) with linear least squares fit (solid line). V*d for 2DG is shown at 15 min (circle and extended dashed line). Note that the abscissa has units of time and that the time appears to be contracted from the actual 45 min experimental period because kb = 0.01. Note also that the intercept lies below the measured V*d as predicted by Eq. 8.
(Patlak and Blasberg, 1985). Mean values and standard deviations of the 2DG phosphorylation rate constants, V*d, K*3 and calculated SGU for both hippocampal and hypothalamic slices at Cp of 4, 7, and 10 mM glucose are shown in Table 2. These results demonstrate that the 2DG phosphorylation rate constant declines as Cp increases over the range of Cp studied in both tissues. However, the other parameters differ for hippocampal and hypothalamic slices. In hippocampal slices, V*d increases slightly but not significantly with increasing Cp, K*3 varies as 1/Cp, and SGU is essentially constant. On the other hand, in hypothalamic slices, V*d remains constant, K*3 varies inconsistently, and SGU tends to increase at higher Cp, although the values do not differ statistically. These results, which are independent of any kinetic model, if the LC is assumed to remain constant, can be compared to the predictions of Michaelis–Menten kinetics to test the applicability of that model to brain slice metabolism.
Measured rates and V*d with calculated k*3 and SGU from 2-deoxyglucose data
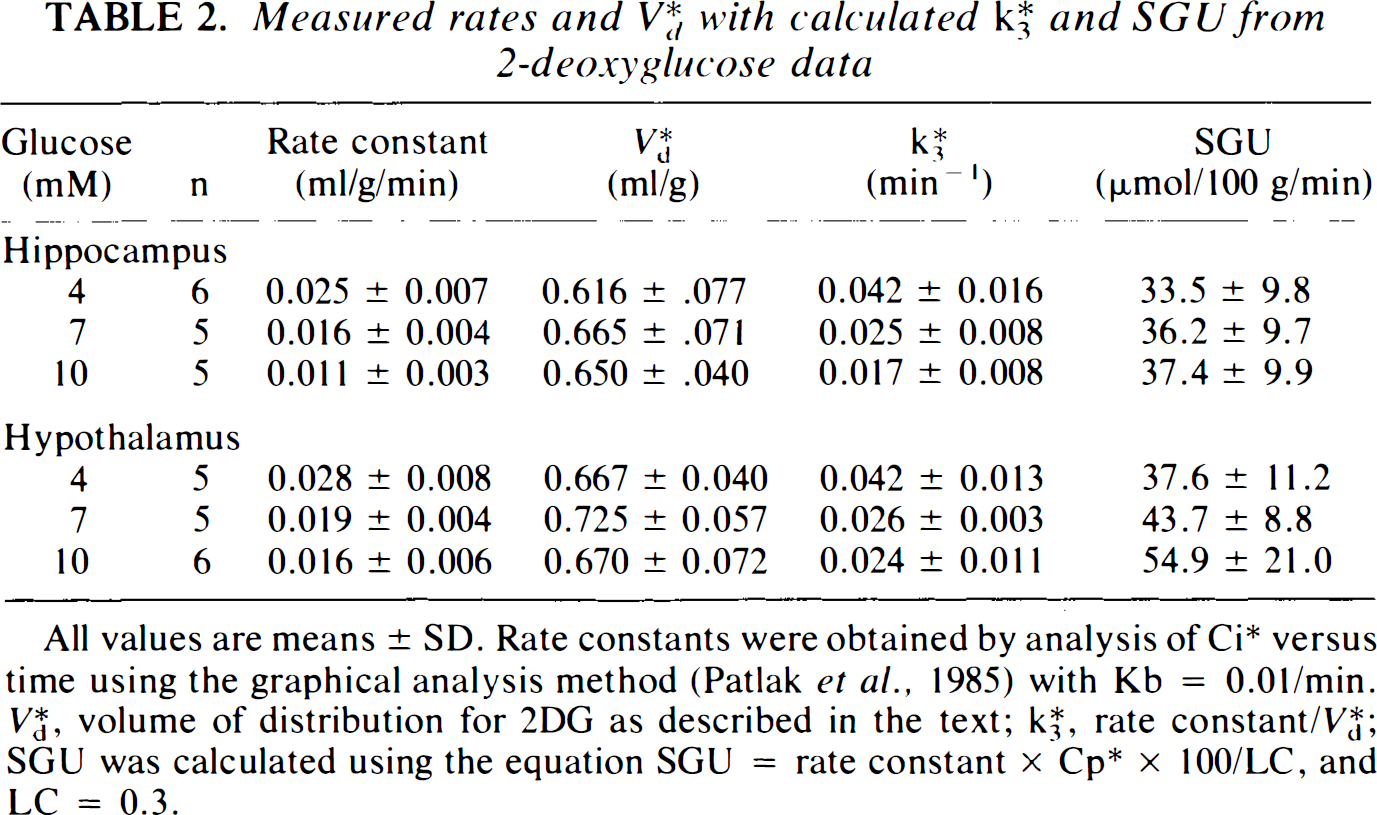
All values are means ± SD. Rate constants were obtained by analysis of C*i versus time using the graphical analysis method (Patlak et al., 1985) with Kb = 0.01/min. V*d, volume of distribution for 2DG as described in the text; K*3, rate constant/V*d; SGU was calculated using the equation SGU = rate constant × Cp* × 100/LC, and LC = 0.3.
Michaelis–Menten model
Kinetic parameters based on the application of Michaelis–Menten models are shown for hippocampal slices in Table 3 and for hypothalamic slices in Table 4. For each tissue type, results are presented for both the upper limit and lower limit estimates of Ve. For hippocampus, the upper limit of Ve, based on the wet weight estimate of the tissue, is 0.859. For this upper limit case, K*1 and K*2 vary in the opposite direction of Cp, K*3 varies as 1/Cp, while V*d shows only small variability, SGU remains absolutely constant, and the LC remains nearly constant. It is important to note that the predicted variation in K*2 is large enough to be observed experimentally when the upper limit of Ve is used. When hippocampal constants are estimated using the lower limit estimate for Ve = 0.734, based on the ratio K*1/K*2,K*3 still varies as 1/Cp, SGU is constant, and the LC is nearly constant; however, Vd and V*d increase slightly with increasing Cp. Based on Eqs. A12 and A20, the values of K*1, K*2, and k2 become independent of Cp for the lower limit case. Thus, measurement of K*2 should provide a means for choosing, experimentally, between the upper and lower limits of Ve. The predicted relationships for hypothalamus are similar to those for hippocampus, based on an upper limit of Ve = 0.840 and lower limit of Ve = 0.742. The numerical values of the kinetic rate constants using the lower limit of Ve are similar for hypothalamus and for hippocampus, except that k*1 is higher for hypothalamus at all Cp. Using the upper limit for Ve produces several numerical differences that reflect the fact that, although our experimental values of K*1 and K*2 from prior studies are similar in the two tissue types, they were measured at 4 mM for hippocampus but at 10 mM for hypothalamus. As a result, as variability with Cp is introduced with the upper limit Ve case, K*1 and K*2 decrease for hippocampal slices when calculated for 7 and 10 mM glucose, respectively, while K*1 and K*2 increase for hypothalamic slices when calculated for 4 and 7 mM, respectively. The net result in both tissues, however, is that K*1 and K*2 are predicted to vary as 1/Cp for the upper limit Ve case, and remain constant for the lower limit of Ve. With either value of Ve,k*3 is predicted to vary as 1/Cp and SGU is independent of Cp.
Summary of Michaelis–Menten kinetics for hippocampus
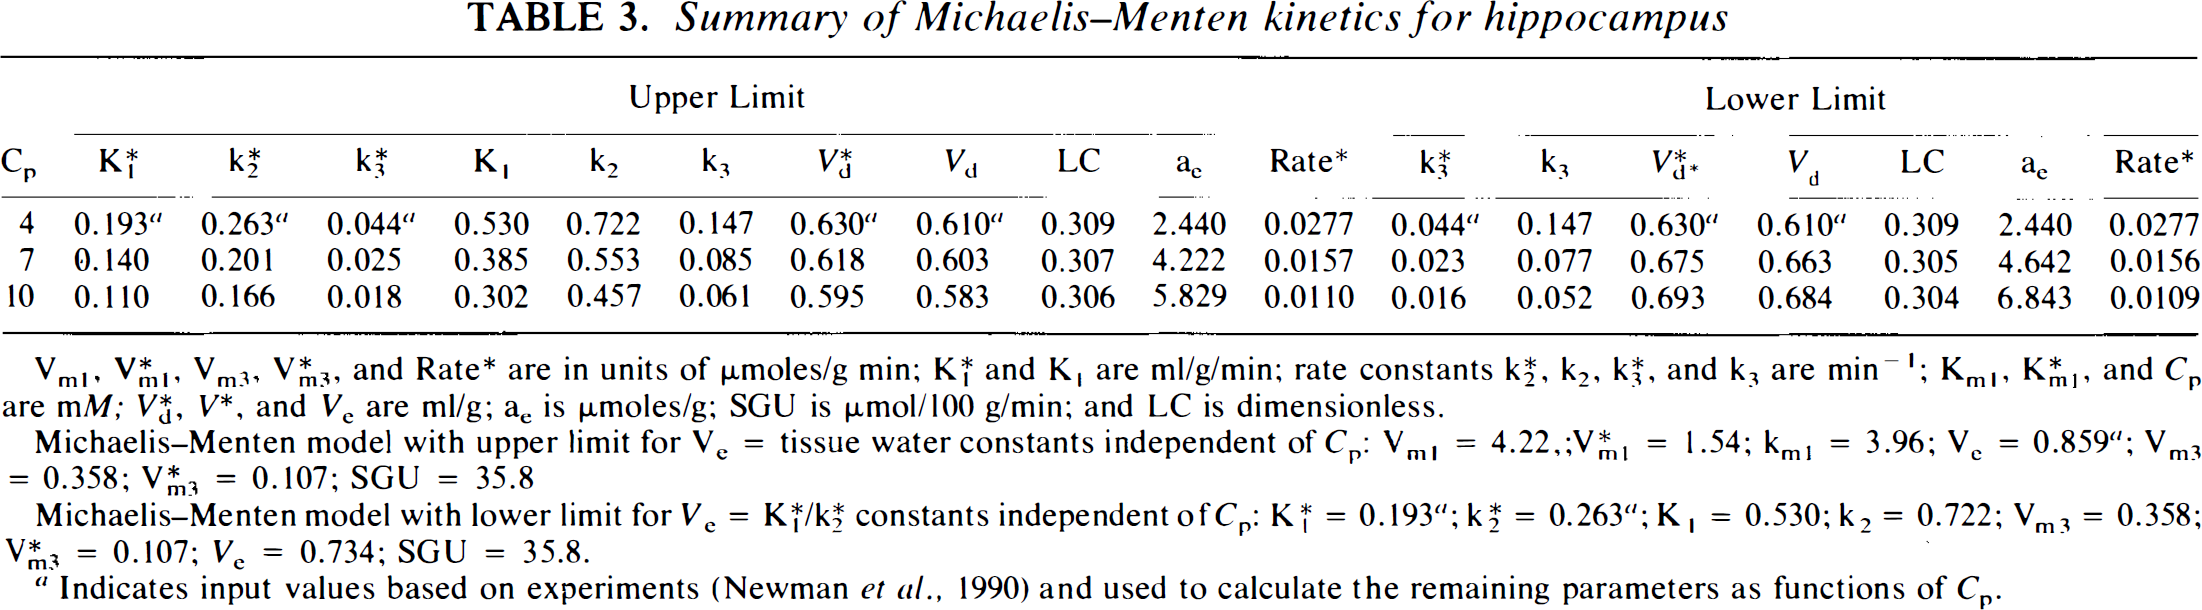
Vml, V*ml Vm3, and Rate* are in units of μmoles/g min; K*1 and K1 are ml/g/min; rate constants K*2, k2, K*3, and k3 are min−1; Kml, K*ml, and Cp are mM; V*d, and Ve are ml/g; ae is μmoles/g; SGU is μmol/100 g/min; and LC is dimensionless.
Michaelis–Menten model with upper limit for Ve tissue water constants independent of Cp: Vml = 4.22,;Kml = 1.54; kml = 3.96; Ve = 0.859 a ; Vm3 = 0.358; V*m3 = 0.107; SGU = 35.8
Michaelis–Menten model with lower limit for Ve = K*1/K*2 constants independent of Cp: K*1 = 0.193 a ; K*2 = 0.263 a ; K1 = 0.530; k2 = 0.722; Vm3 = 0.358; V*m3 = 0.107; Ve = 0.734; SGU = 35.8.
Indicates input values based on experiments (Newman et al., 1990) and used to calculate the remaining parameters as functions of Cp.
Summary of Michaelis–Menten kinetics for Hypothalamus
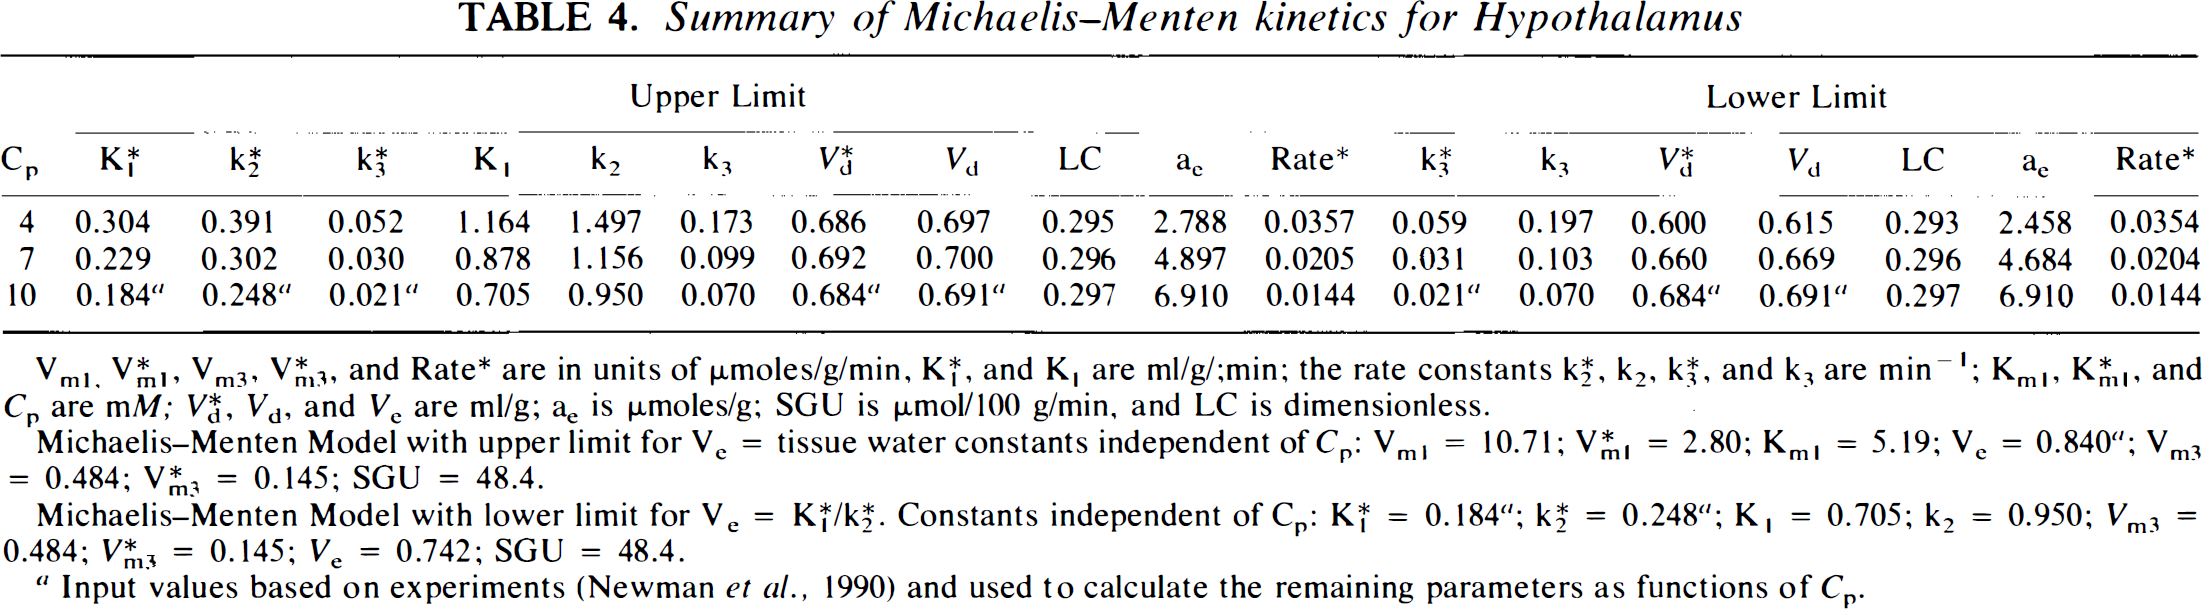
Vml, V*m3, Vm3, V*m3 and Rate* are in units of μmoles/g min; K*1 and K1 are ml/g/min; rate constants K*2, k2, K*3, and k3 are min−1; Kml, K*ml, K*ml and Cp are mM; V*d, Vd and Ve are ml/g; ae is μmoles/g; SGU is μmol/100 g/min; and LC is dimensionless.
Michaelis–Menten model with upper limit for Ve = tissue water constants independent of Cp: Vml = 10.71,; V*ml = 2.80; kml = 5.19; Ve = 0.840 a ; Vm3 = 0.484; V*m3 = 0.145; SGU = 48.4
Michaelis–Menten model with lower limit for Ve = K*1/K*2 constants independent of Cp: K*1 = 0.184 a ; K*2 = 2.248 a ; K1 = 0.705; k2 = 0.950; Vm3 = 0.484; V*m3 = 0.145; Ve = 0.742; SGU = 48.4.
Indicates input values based on experiments (Newman et al., 1990) and used to calculate the remaining parameters as functions of Cp.
Comparison of the actual results from Table 2 with the predictions of the Michaelis–Menten models shown in Tables 3 and 4 reveals that hippocampal slices follow the Michaelis–Menten kinetic model, whereas there are apparent discrepancies between the measured and predicted results for hypothalamus, suggesting that slices from hypothalamus do not follow the Michaelis–Menten model. For example, hippocampal slices are predicted to have a SGU = 35.8 μmole/100 g/min for hippocampus at all Cp, and the measured values vary from 33.5 at Cp = 4 mM to 37.4 at Cp = 10 mM glucose. On the other hand, for hypothalamus, the predicted value is 48.4 at all Cp, but measured values range from 37.7 at Cp = 4 mM to 54.9 at Cp = 10 mM, although the large standard deviations for SGU in hypothalamic slices prevent demonstration of statistical significance. These results suggest that the metabolism of hypothalamic slices is more complex than just the simple reaction sequence assumed by the Michaelis–Menten model. It should be noted that these results for SGU in hypothalamus are entirely in agreement with previous observations in vivo, i.e., that glucose utilization in anterior hypothalamus varies significantly as Cp changes in a manner not consistent with Michaelis–Menten kinetics (Orzi et al., 1988). Our in vitro results also suggest that intrinsic metabolic responsiveness to changing Cp is likely to be the cause of the changing glucose utilization, rather than response to insulin, as previously suggested.
The 2DG data suggest, but do not establish with certainty, that the Michaelis–Menten calculations employing the lower limit of Ve provide a more accurate description of metabolism in hippocampal brain slices. Predicted values of SGU and K*3 do not differ significantly between the two limits. On the other hand, the predicted behavior of V*d is different for the two cases, with the value decreasing for the upper limit of Ve but increasing with Cp for the lower limit case. Results for hippocampus, demonstrating a progressive increase in V*d with increasing Cp, are, therefore, more consistent with the lower limit case. However, because the standard deviation for V*d is close to the size of the difference sought (see above), it is desirable to have additional support for this conclusion.
3OMG
Results obtained with the radiolabeled glucose analogue 3OMG provide a more direct means of testing whether Michaelis–Menten calculations with the upper limit or lower limit values of Ve give a more accurate description of the actual tissue glucose metabolism, since the Michaelis–Menten theory predicts that K*2 varies if the upper limit for Ve is used, but remains constant if the lower limit of Ve is used. The graph showing the efflux of 3OMG from hippocampus (Fig. 3) clearly shows that there is no change in either efflux rate or intercept as Cp increases from 4 to 10 mM glucose. The calculated intercepts are 0.749 ml/g for 4 mM, 0.761 ml/g for 7 mM, 0.784 ml/g for 10 mM and 0.762 ml/g for the complete data set of all Cp. The least squares fit values of K1MG–K1MG are presented in Table 5. Statistical comparison of the curves by calculation of the F statistic yields F8,55 = 1.368 (p > 0.20) for the hippocampal slice curves and .F8,53 = 1.227 (p > 0.25) for hypothalamic slices. These results indicate that the fits for the individual curves do not differ from the fits of all data simultaneously, and confirm the visual impression of Fig. 3 that there is no significant variation with Cp. The lack of variation in the efflux rate with Cp, along with Eq. A23, implies the constancy of K*2 and k2 with Cp. Further, the similarity of the intercepts with Cp implies that K1/k2 and K*1/K*2 are also constant with respect to Cp. This is consistent only with the Michaelis–Menten predictions found using the lower limit of Ve with Ve = 0.734 ml/g for hippocampus. Thus, both 2DG and 3OMG data suggest that Ve is closer to its lower than to its upper limit and that use of the lower limit value will yield a more accurate model of in vitro metabolism. Incidentally, the better correspondence of hippocampal 2DG results with the lower limit of Ve suggests that only 0.734/0.859, or 85%, of slice tissue water is accessible to 2DG.
Kinetic parameters for 3OMG a
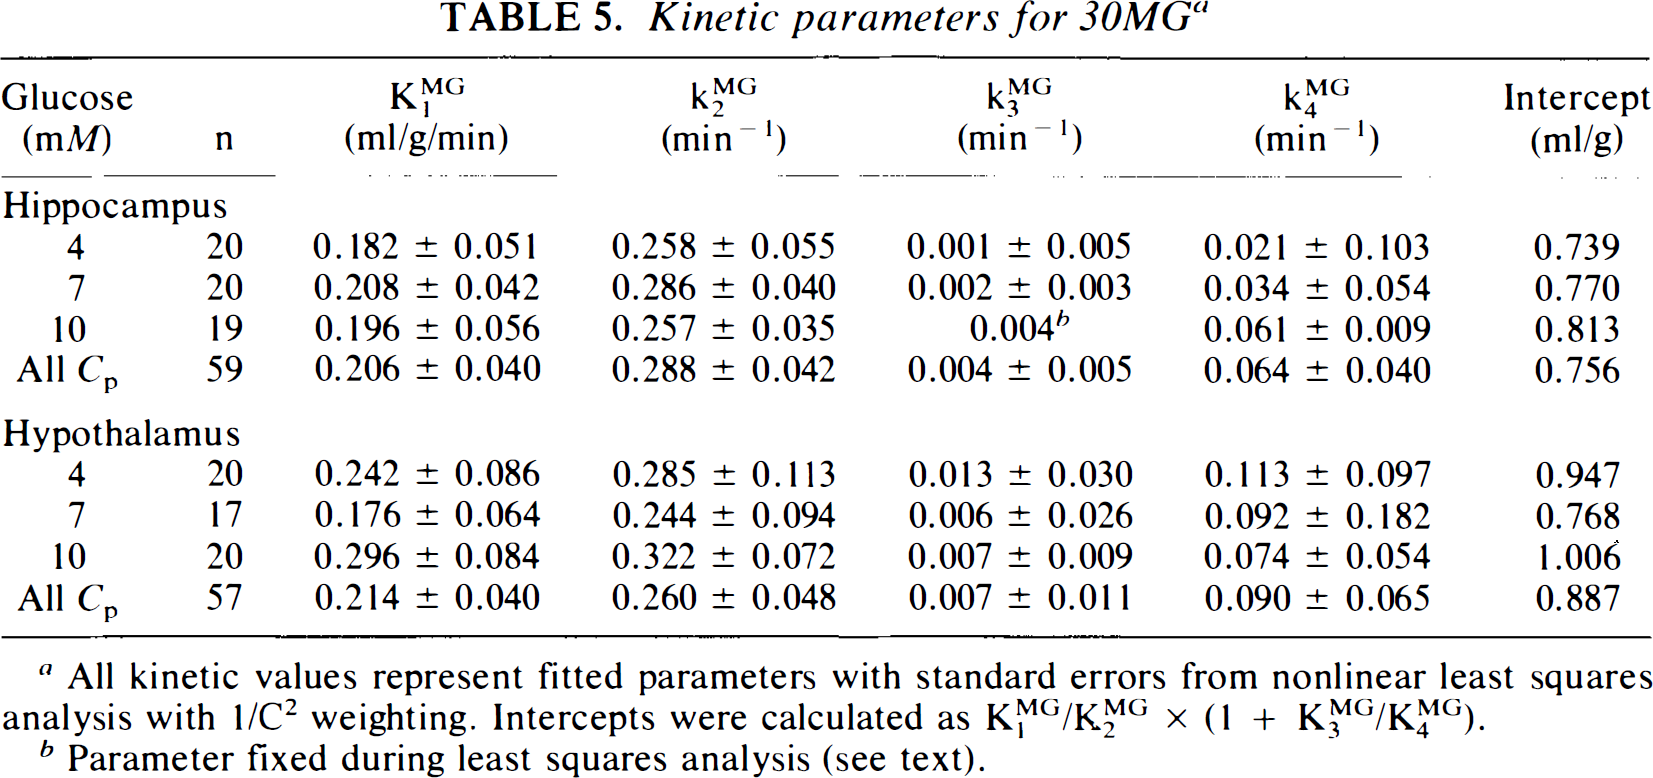
All kinetic values represent fitted parameters with standard errors from nonlinear least squares analysis with 1/C2 weighting. Intercepts were calculated as K1MG/K2MG × (1 + K3MG/K4MG).
Parameter fixed during least squares analysis (see text).
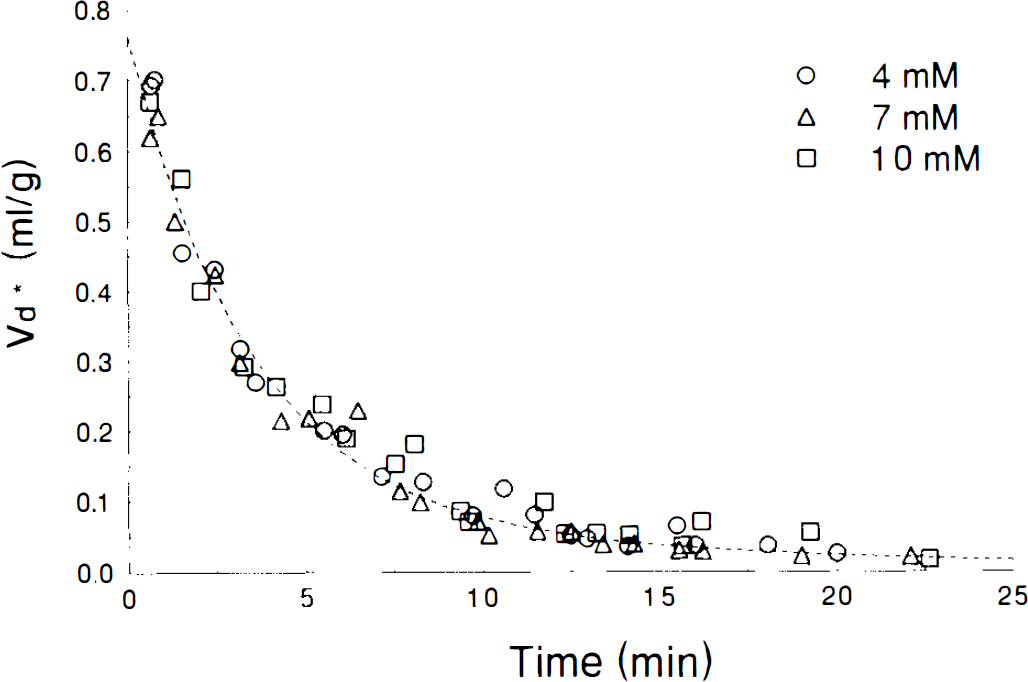
Washout curves for 3OMG from 500 m hippocampal slices previously incubated with 3OMG for 60 min. Dashed line is best fit of a two exponential function for the combined data at all Cp. Data obtained at individual Cp are identified by symbols as shown in the legend.
Interpretation of the data for hypothalamic slices is more complex than that for hippocampal slices. As for hippocampus, no variation in efflux of 3OMG with Cp is observed for hypothalamus, either visually (Fig. 4) or statistically (Table 5), consistent with predictions using the lower limit of Ve, so that the results for 3OMG in hypothalamus are also inconsistent with Michaelis–Menten kinetics.
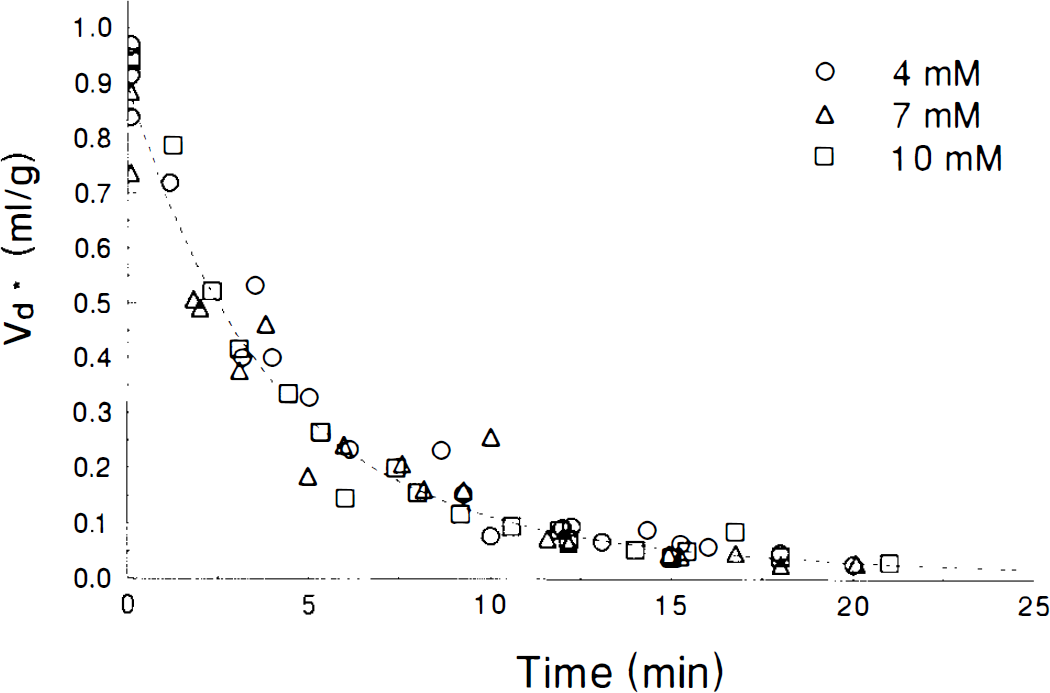
Washout curves for 3OMG from 500 μ m hypothalamic slices previously incubated with 3OMG for 60 min. Dashed line is best fit of a two exponential function for the combined data at all Cp. Data obtained at individual Cp are identified by symbols as shown in the legend.
Apparent rate coefficients
The apparent rate coefficients, K′, needed for calculation of SGU with Eq. 2, are presented in Table 1. These values, generated using the lower limit for Ve, are for hippocampal slices over a broad range of buffer glucose, Cp, incubation times, To, and rinse times, Δ. Inspection of this table reveals that, at any Cp, K′ varies considerably with To, being much larger for short incubation times, especially with long A. K′ also varies considerably with Δ, being much larger with long rinse times, especially with short To. Variation of K′ with Cp depends heavily on the value of A, but only minimally on the value of To. Considerable variability of K′ occurs for values of Δ <10 min, but this variability essentially disappears with longer rinse times. Values of K′ are also presented for hypothalamic slices at Cp = 10 mM (Table 6), based on our previous detailed kinetic results (Newman et al., 1990), but values at other Cp are not calculated since the tissue does not appear to behave in a manner described by Michaelis–Menten kinetics. Similarly, thick hippocampal slices may not follow Michaelis–Menten kinetics, so that values of K′ are presented only for Cp = 4 mM (Table 7), again based on our prior detailed kinetic analyses. Variation of K′ as a function of To and A in hypothalamic slices at 10 mM glucose and in thick hippocampal slices at 4 mM glucose follows the same pattern as that observed in thin hippocampal slices. In general, values of K′ at intermediate To and Δ are similar for hippocampal and hypothalamic slices at Cp = 10 mM and for thin and thick hippocampal slices at Cp = 4 mM.
Apparent rate coefficients (K′)for 500 μm hypothalamic slice at Cp = 10 mM
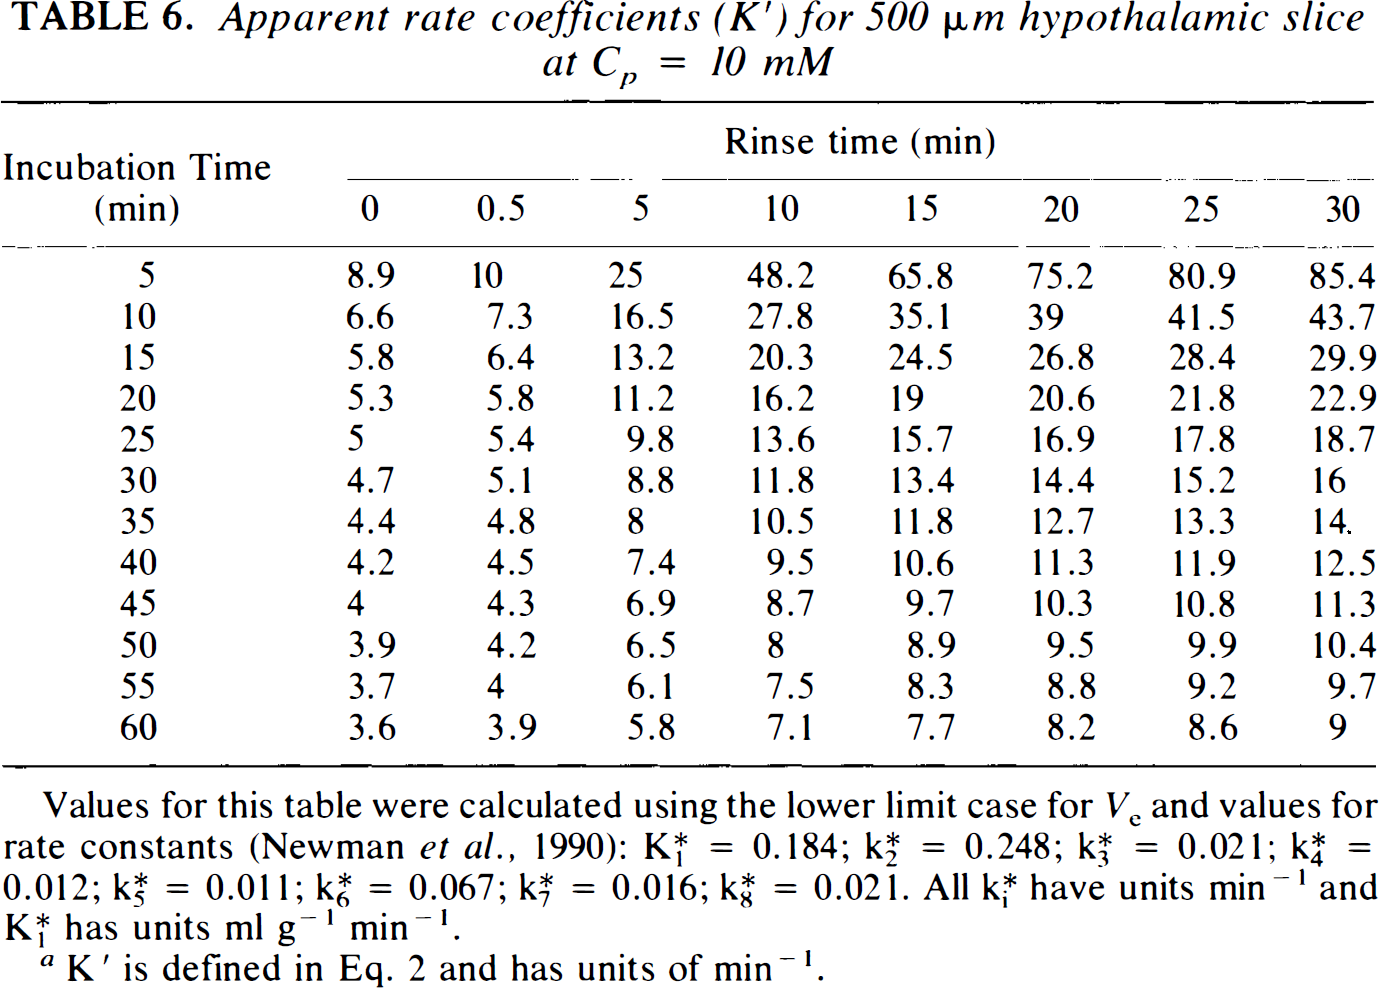
Values for this table were calculated using the lower limit case for Ve and values for rate constants (Newman et al., 1990): K*1 = 0.184; K*2 = 0.248; K*3 = 0.021; K*4 = 0.012; K*5 = 0.011; K*6 = 0.067; K*7 = 0.016; K*8 = 0.021. All K*i have units min−1 and K*1 has units ml g−1 min−1.
K′ is defined in Eq. 2 and has units of min−1.
Apparent rate coefficients (K′) for 1,000 μm hippocampal slices, Cp = 4 mM a
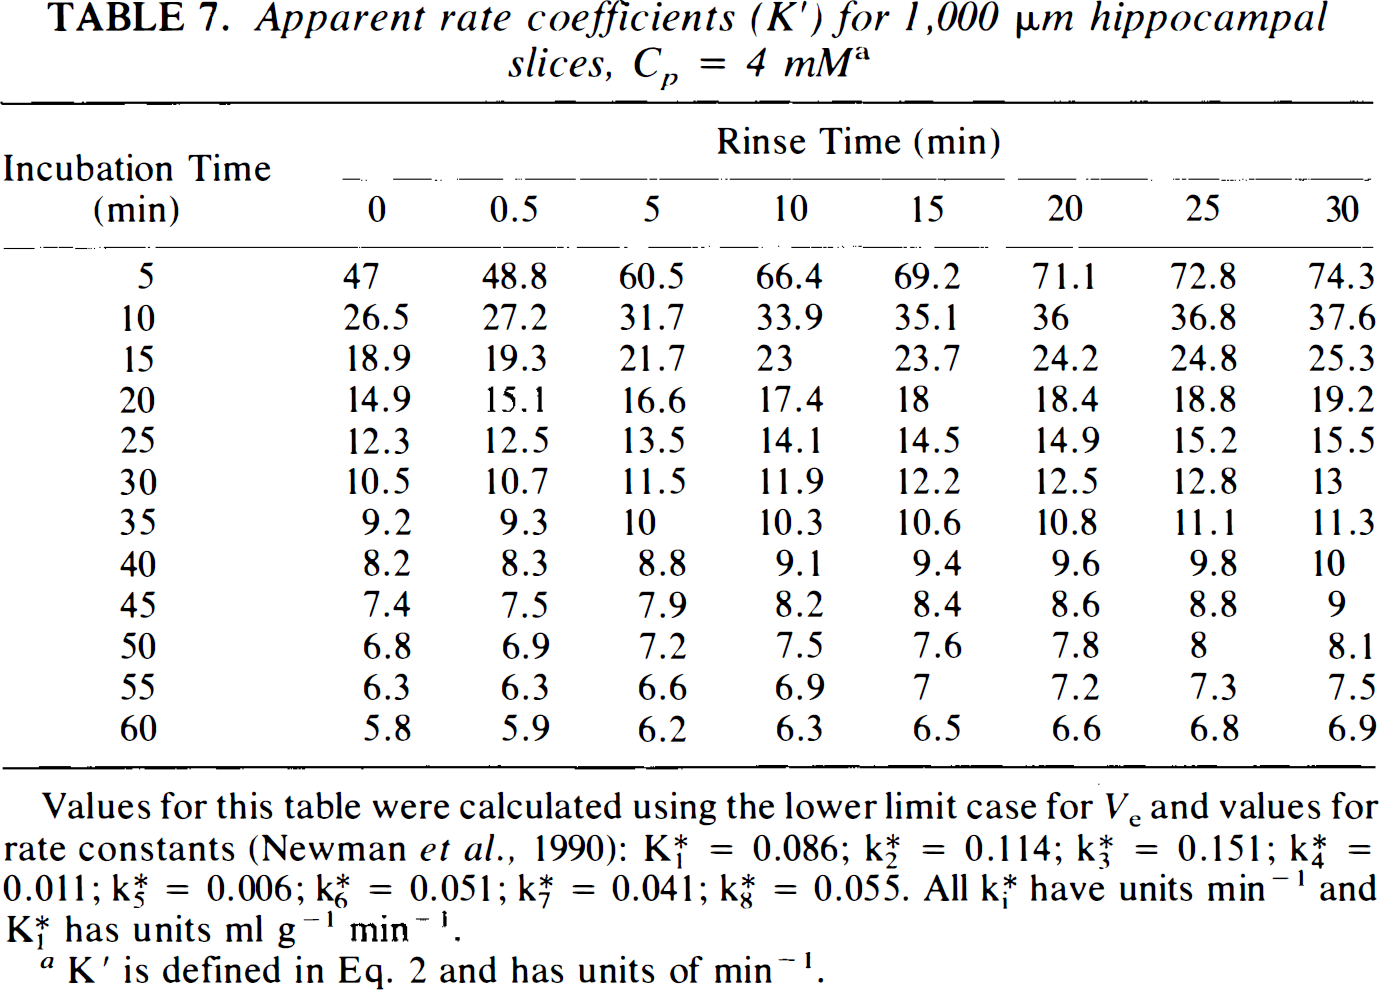
Values for this table were calculated using the lower limit case for Ve and values for rate constants (Newman et al., 1990); K*1 = 0.086; K*2 = 0.114; K*3 = 0.151; K*4 = 0.011; K*5 = 0.006; K*6 = 0.051; K*7 = 0.041; K*8 = 0.055. All K*i have units min−1 and K*1 has units ml g−1 min−1.
K′ is defined in Eq. 2 and has units of min−1.
The error introduced by using the K′ for hippocampal slices to calculate SGU for tissues with different kinetic properties was estimated by recalculating K′ values using altered kinetic rate constants, K*2 or K*3, and then determining the error that would be introduced at Cp = 4 and 10 mM if the unmodified values of K′ for hippocampal slices were used to calculate SGU instead of the “true” kinetic parameters (Table 8). No errors for K*1 are presented since, as discussed above, K*1 does not appear in Eqs. 1 and 2. This analysis reveals that, in general, the smallest errors arise with incubation times of >30 min and rinse times of >15 min. However, brief incubation times, of only 5 or 10 min, can be accurate if coupled with long rinse times. Large errors consistently arise if short rinse times are used, and this is worse if incubations are ≤15 min. The error analysis also reveals that, for incubation times of 30 min with rinse times of 15 min, Eq. 2 is very insensitive to changes in K*3, so that applying the hippocampal values of K′ to tissue with twice or half the value of K*3 introduces no <4% error. The equation is more sensitive to changes in K*2, with errors of 8% introduced at Cp = 4 mM if the hippocampal constants are applied to a tissue with one half the value of K*2. If K*2 is halved, the error at Cp = 10 mM is even larger, reaching 27%. Much smaller errors occur if K*2 is doubled. The sensitivity of Eq. 2, with To = 30 and Δ = 15, to changes in K*2, varies from 0.003% at 4 mM glucose to −0.034% at Cp of 10 mM. For K*2, sensitivity varies from −0.087% at Cp = 4 mM to −0.191% at Cp = 10 mM. The worst sensitivity occurs at higher Cp with short To and intermediate duration for Δ. For the singular condition of tissue with small K*2 incubated at higher Cp, a longer rinse time may be of benefit to reduce the magnitude of the error.
Error analysis using hippocampal apparent rate coefficients a
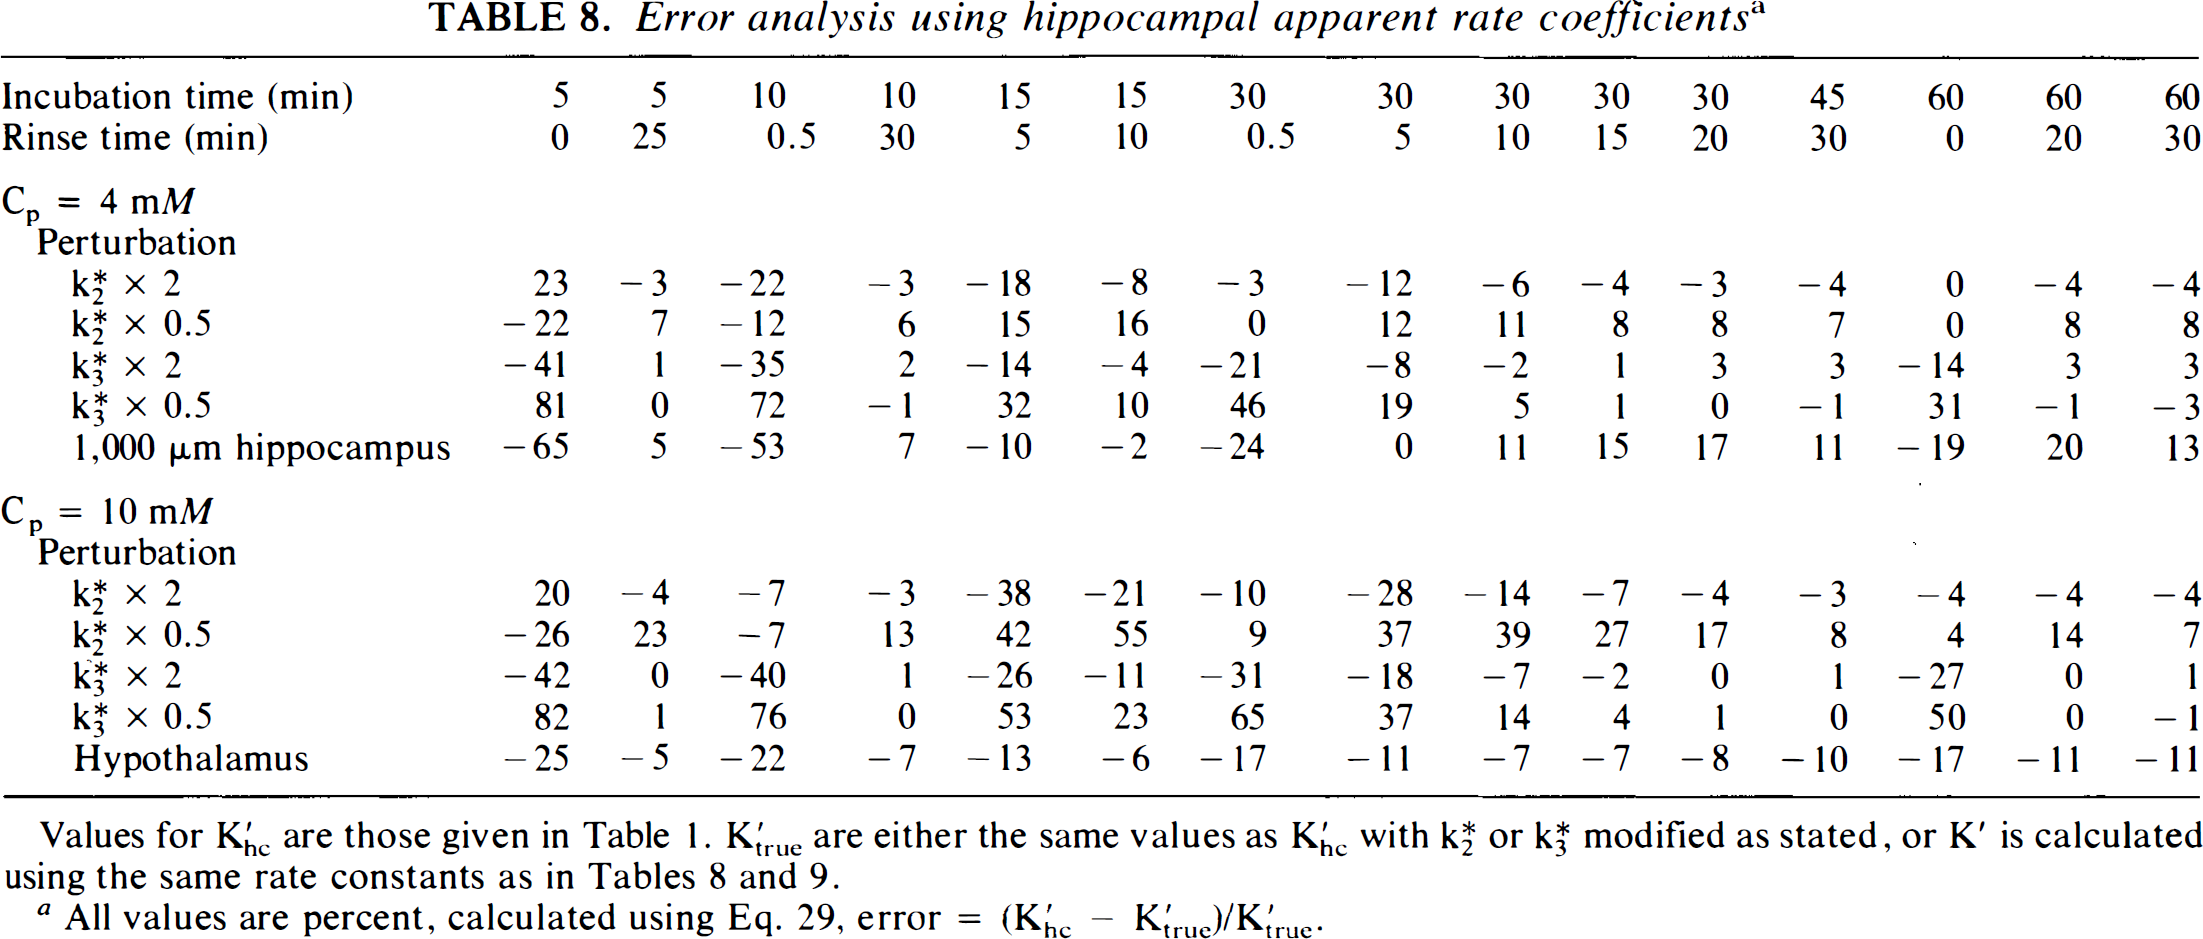
Values for K′hc are those given in Table 1. K′true are either the same values as K′hc with K*2 or K*3 modified as stated, or K′ is calculated using the same rate constants as in Tables 8 and 9.
All values are percent, calculated using Eq. 29, error = (K′hc – K′true)/K′true.
The errors introduced when the K′ for thin hippocampal slices are used to calculate SGU for thick hippocampal slices at Cp = 4 mM or for hypothalamic slices at Cp = 10 mM are also shown in Table 8. The error for thick hippocampal slices at Cp = 4 mM varies according to experimental conditions. The smallest error is found with To = 30 min and relatively short rinse times. For To = 30 min with Δ = 15 min, SGU would be overestimated by 15%. With hypothalamic slices, SGU is underestimated by about 1% with To = 30 min and Δ = 15 min. To help place the size of these errors in perspective, using K′ for 30-min incubations and 15-min rinses produces an estimated SGU of 44.7 μmole/100 g/min for hypothalamus at Cp = 10 mM instead of the “true” value of 47.9 μmole/100 g/min based on the actual hypothalamic kinetic rate constants. Use of the thin hippocampal slice apparent rate coefficients for 4 mM glucose yields an estimate of 94 instead of 83.1 μmole/100 g/min, which is the result if the value of K′ derived specifically from thick slice kinetic rate constants is used. Similarly, the results in Table 9, describing the effects of varying incubation and rinse times on the measured value of SGU, demonstrate that calculation of SGU, using Eq. 2 and the values of K′ from Table 1, are accurate over a relatively broad range of incubation and rinse times. Although incubation times of 5 min are statistically different than are values obtained with other times, all other incubation and rinses combinations tested are statistically equivalent by ANOVA. SGU, calculated using K′ = 12.8 min−1 in Eq. 2, for hippocampal slices incubated with To = 30 min and Δ = 15 min (Table 10) are in good agreement with the results obtained by the graphical analysis method (Table 2). For both methods, ANOVA indicates that SGU remains constant with Cp, and the values at all Cp are in close agreement with the predicted value of 35.8 μmole/100 g/min (Tables 3 and 4).
Hippocampal SGU obtained with varying times for incubation and rinse with 4 mM glucose a
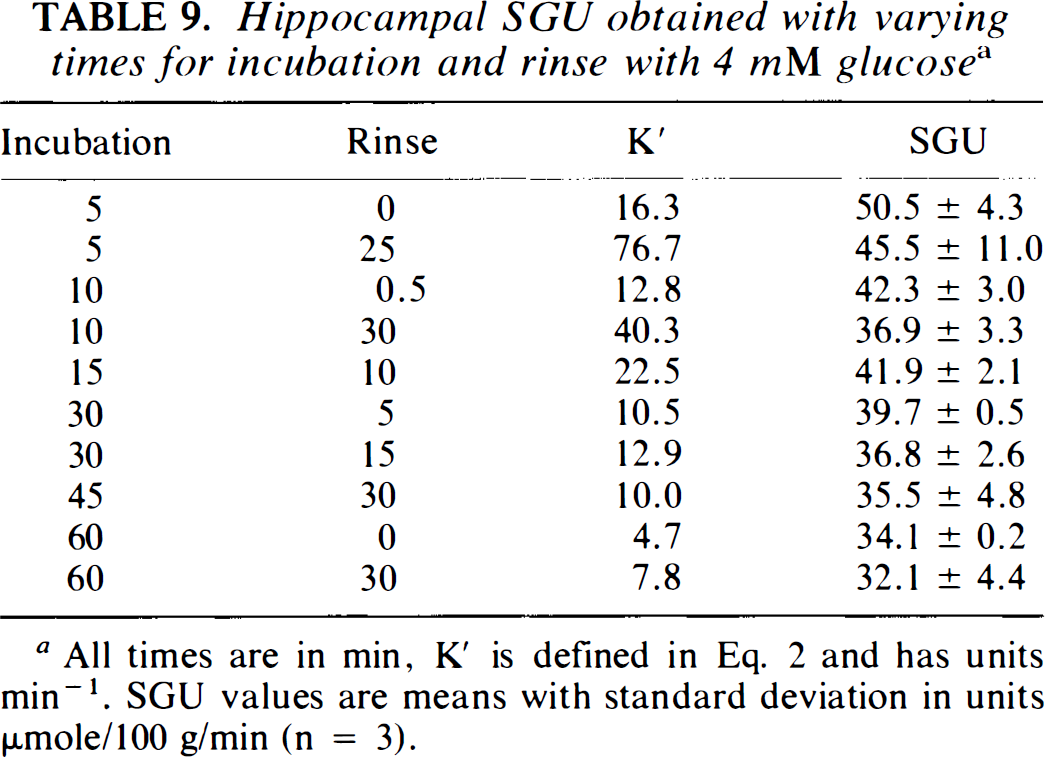
All times are in min, K′ is defined in Eq. 2 and has units min−1. SGU values are means with standard deviation in units μmole/100 g/min (n = 3).
DISCUSSION
Our goal is to make in vitro glucose utilization accessible to other investigators who may wish to use this valuable method but are uncertain about how to introduce the technique into their existing brain slice methodologies. This goal was among the factors that led us to choose a form of the operational glucose utilization rate equation (Eq. 1) that could be readily simplified (Newman et al., 1990). The simplified operational rate equation that we present here (Eq. 2) is both immediately useful and reveals the basic simplicity of in vitro glucose utilization. In order to make this rate equation practical, however, it is necessary to have available a series of apparent rate coefficients, K′, for a range of incubation, To, and rinse times Δ, as well as differing perfusing glucose concentrations, Cp. To accomplish this, we begin with an eight-parameter kinetic model, apply Michaelis–Menten kinetics to calculate K*1-K*3, assume that K*4-K*8 remain constant with Cp, employ several experimental values from the literature, and chose Ve experimentally. The resulting predictions and tables of K′ have been tested against measurements with 2DG in hippocampal and hypothalamic brain slices as well as by a series of error analyses. Together, the rate equation and coefficients provide a simple, flexible system with acceptable calculational error.
Our approach to the kinetic theory of 2DG metabolism and calculation of glucose utilization is based upon prior approaches to radiotracer measurement of steady state glucose metabolism (Sokoloff et al., 1977; Hawkins et al., 1984) and the known biochemistry of 2DG (Nelson et al., 1984; Keppler, 1985; Bass et al., 1987). We employ a rate equation for a five-compartment, eight-parameter kinetic model that includes reversible hexose transport, phosphorylation, isomerization of 2DG6P to 2DG1P, conjugation to UDP, and incorporation into glycosylated macromolecules (Newman et al., 1990). For the present purpose of deriving a simplified model, we have assumed that K*4-K*8 remain constant as Cp changes. As with in vivo calculations of glucose utilization (see above), we assume that the phosphorylation coefficient, K*3-K3, remains constant with Cp. In order to apply Michaelis–Menten kinetics, we have made the usual assumptions that glucose transport is reversible and symmetrical and that Km3 is small compared to Ce, the glucose concentration in tissue. This latter assumption is based upon measurements of Km3 for glucose and 2DG that confirm that the values for both substrates are, in fact, small under all conditions except, perhaps, hypoglycemia (Grossbard and Schimke, 1966). The values of Michaelis–Menten constants taken from the literature are discussed in the Appendix. Like others, we assign a value of 0.3 to the phosphorylation coefficient, K*3/k3 (Gjedde, 1982). This value is purposely limited to one significant digit based upon the wide range of values in the literature, 0.37 (Cunningham and Cremer, 1981)—0.22 (Mori et al., 1989). In general, higher values usually are based on measurements for whole hemispheres, including white matter. When measurements are restricted to gray matter, a mean of 0.31 is found (Pardridge et al., 1982).
Calculation of K′ and SGU are very sensitive to the input value of Ve, the tissue volume accessible to glucose. Unfortunately, this quantity cannot be measured directly. We have attempted to deal with this problem by calculating Michaelis–Menten predictions for the two extreme cases of Ve, namely with an upper limit of Ve equal to measured total tissue water and a lower limit of Ve = K*1/K*2 (Eq. A19), using rate constants obtained for hippocampal slices in 4 mM glucose (Newman et al., 1990). We assume that Ve = V*e, based on the assumptions that both glucose and 2DG have access to the same water spaces in the tissue and that neither hexose accumulates in nonaqueous compartments. Most hippocampal slice Michaelis–Menten parameters are very similar for these two extremes of Ve, but certain parameters do differ for the two cases (Tables 3 and 4). The Michaelis–Menten constants Vm3 and V*m3 are the same for either value of Ve, as is SGU. The constants Kml, K*ml, Vmland K*ml, cannot be estimated for the lower limit case, which implies that Kml » Cp. The predictions of Rate*, k3, and K*e are very similar for the two extremes of Ve, with all three parameters varying inversely with Cp. LC also varies in the opposite direction of Cp with either limit, although the variation is minimal. In either case, ae, the total tissue glucose content, increases with Cp, as expected. There are, however, several kinetic parameters which differ between the two limits for Ve. The rate constants K1, K*1, k2, and K*2 vary inversely with Cp in the upper limit case but do not change with Cp in the lower limit case. Vd and V*d vary inversely with Cp in the upper limit case but directly with Cp in the lower limit case. Thus, the assignment of a value for Ve depends upon the ability to distinguish V*d and either K*1 or K*2.
The glucose analogue 3OMG is useful because it is transported in a manner similar to that of glucose but is not significantly phosphorylated. Our in vitro experiments have confirmed earlier in vivo studies, which demonstrate that a two-exponential equation is necessary to describe the kinetics of 3OMG in brain (Vyska et al., 1985; Brooks et al., 1986; Newman et al., 1990). The reason for this is not clear, but may involve diffusion, transport into more than one compartment, tissue heterogeneities, or a small extent of metabolism. Recent studies have demonstrated that, although 3OMG can be phosphorylated in some nonmammalian species (Malaisse-Lagae et al., 1986; Ortiz and Haspel, 1993) and some mammalian tissues to a small degree (Gatley et al., 1984), it is unlikely that this occurs to a significant extent in mammalian brain during the course of relatively brief experiments (Jay et al., 1990; Holden et al., 1991). In the present study, experiments with 3OMG provide strong support for the conclusion that Michaelis–Menten predictions of hippocampal slice kinetics are more accurately described using the lower limit rather than the upper limit value of Ve. The observed invariance of K*2 with changing Cp, based on the analysis of 3OMG efflux from hippocampal slices, can be extended to other radiotracers, such as 2DG, because the ratio of the K*2S for any two glucose analogues in tracer concentrations depends only on the transport properties of glucose (see Eq. A23). 3OMG analyses are conducted in two steps. The first step employs nonlinear least squares methods to fit the data curves. The best fit for these curves, which are independent of any kinetic model, are used to determine statistically whether the curves at the three Cp differ or are identical. The second step in analyzing 3OMG experiments uses the compartmental parameters from the least squares analysis to derive kinetic rate constants for influx and efflux. This step requires that a choice be made between a serial or parallel model. Without experimental justification, we have chosen to present values for the serial model, although the results are very similar for the parallel model. In either case, K*2, representing efflux from the larger tissue compartment, is independent of Cp.
The uptake transport processes, represented by Vml, Kml, and K1 for glucose and V*ml and K*1 for 2DG, are not the same in vivo and in vitro. The most obvious difference is that, in vitro, there is no blood-brain barrier (BBB) and, therefore, no endothelial transport, so that tissue uptake is dependent only on extracellular diffusion and cellular uptake. The calculated value of Kml for the upper limit Ve case of hippocampal slices was 3.96 mM. This value, which represents a lower bound for Kml in our system, compares very favorably with in vivo values that vary from 4 to 8 mM (Buschiazzo et al., 1970; Betz et al., 1973; Gjedde, 1982; Pardridge et al., 1982; Holden et al., 1991). For the lower limit case, the assumption is made that Kml » Cmax, where Cmax represents the highest glucose concentration encountered in these experiments (10 mM). This assumption is integral to the lower limit case since it follows from Eq. A12 that, Kml is very large when Ve is close to its lower limit of K*1/K*2. The actual Ve must lie between the two extremes of the upper and lower cases. Our results appear to indicate that Ve lies close to the lower limit of K*1/K*2. Because of the sensitivity of the Michaelis–Menten calculations as Ve approaches its lower limit, it would be very difficult to experimentally distinguish the value of K*1/K*1, which yields a Kml of 10 mM from a value of the ratio that yields an infinitely large Kml. Finally, it should be noted that Kml will be just as sensitive to the value of Ve chosen for in vivo experiments as in vitro. Given the uncertainty in estimating Ve in vivo, it may be appropriate to reexamine this issue.
The kinetics of the in vitro hexokinase reaction reflect the slower metabolic rate of hippocampus in slices than in vivo, an observation that has been made repeatedly (McIlwain and Bachelard, 1971; Lipton and Whittingham, 1984; Jurgensen and Wright, 1988; Newman et al., 1990). Although most authors have attributed this to slice injury, we have previously argued that this is more likely to represent the low level of spontaneous neuronal activity in hippocampal slices in vitro, since SGU of the suprachiasmatic nucleus (SCN), which is spontaneously active in vitro, is as high as, or higher than in vivo SCN glucose utilization (Newman et al., 1992).
The experimental procedure for the simplified method for brain SGU describes the practical and technical details involved in the incubations, analyses and calculations. The fundamental simplicity of the technique is evident. Several issues require further clarification, however. Calculation of SGU requires measurement of tissue radioactivity and bath radioactivity after incubation in 2DG followed by a rinse period. Based on the error analyses done using K′ with altered K*2 and K*3 and by applying K′ calculated for 500—1,000 μm hippocampal slices or 500 μm hypothalamic slices, it is clear that intolerably large errors may occur with short rinse times, especially if incubation times are also brief. This is confirmed experimentally (Table 9). The calculations of Table 8 and the experimental results of Table 9 demonstrate that several combinations of times can yield acceptably small errors for a broad range of conditions. Our preference involves incubation of slices with 2DG for 30 min with a 15-min rinse in buffer without 2DG, since this is the briefest experimental paradigm likely to uniformly sample the entire brain slice from surface to interior. This is, coincidentally, very similar to the recommended 45-min protocol that has become the standard for in vivo glucose utilization measurements (Sokoloff et al., 1977). It should be noted that the calculated errors of Table 8 and experimental errors of Table 9 are not directly comparable, since Table 8 assumes variation in K*2 or K*3, while Table 9 assumes that the rate constants do not change from one incubation paradigm to the next and that only experimental times change.
Calculation of tissue radioactivity also requires measurement of slice mass in order to obtain a value for C*i. This can be accomplished most simply by weighing the slice at the end of the incubation. Alternatively, the total protein of a perchloric acid extract of the homogenized slice can be measured (Lowry et al., 1951) and wet weight calculated using a previously determined wet weight/protein ratio. Using the actual slice wet weight has the advantages of simplicity and automatically correcting for any change in slice water content that occurs during incubation. Measuring slice protein retains the relationship to the tissue mass originally present in vivo but requires recalculation of the tissue wet weight/protein ratio as conditions change. Because we are interested in how slice water changes with varying conditions and how this affects tissue metabolism, including SGU, we continue to follow a protocol that yields both measures.
Error analysis also provides useful information about the sensitivity of SGU calculations to changes in the rate constants. There is no error related to the uncertainty of K*1 since this constant is not present in the chosen formulation of the rate equation. In most situations, the rate constant that changes with metabolic stimulation or inhibition is K*3. This is fortunate since the operational equation for SGU is extremely insensitive to changes in this constant. If the recommended 30-min incubation time with 15-min rinse time are used, a 100% increase in K*3 introduces an error of <1% in the calculation of SGU. Thus, it is possible to ignore errors due to K*3. The situation is more complicated for K*2. Changes in K*2 can produce errors for SGU calculations in a manner that varies with Cp. It is also fortunate, therefore, that K*2 appears to remain relatively constant with changing Cp both in vivo (Orzi et al., 1988) and in vitro (Table 3). At Cp of 4 mM glucose, the error is relatively small. If K*2 doubles because of experimental conditions but calculations are based on the assumption that K*2 remains constant, then an error of −4% is introduced. If K*2 is halved, the error is 8%. At a Cp of 10 mM, the error is larger, with corresponding errors of −7 and 27%, respectively. The largest potential error, therefore, occurs at high Cp under conditions that may produce a decline in cellular glucose transport. This condition is likely to arise primarily under conditions that are injurious to the tissue, e.g., ischemia. Thus, experiments related to ischemia that involve measurement of SGU are more likely to be accurate if Cp is maintained ≤5 mM. It is worth emphasizing, however, that the good correspondence of SGU calculated with 500 μm hippocampal rate constants to the “true” SGU of hypothalamic slices at 10 mM (Table 6) and the generally good correspondence of actual thick slice SGU (Table 7) to that predicted using K′ for thin slices indicates that the apparent rate coefficients that we have generated are likely to provide a reasonably accurate assessment of SGU in a variety of tissues over a broad range of conditions.
It is possible to check the applicability of the 500 μm hippocampal rate constants for any tissue under any set of conditions by using the graphical analysis method (Patlak and Blasberg, 1985). We have performed this comparison for hippocampal slices at Cp of 4, 7, and 10 mM glucose and observe excellent correspondence between the two methods. The graphical analysis method, which, as discussed above, is independent of any kinetic model, provides an estimate of the phosphorylation rate, related to SGU by Eq. 4, and the intercept that can be used to obtain a lower limit estimate of V*d for 2DG as shown in Eq. A8. The practical problem involved in using this technique with brain slices is the need for either a brief rinse or blotting the slice in some manner in order to remove adherent radioactive buffer. Tissue rinse time and variability of rinse times can have a major effect on total tissue radioactivity, since K*2 has a half-time of only 2 min. Unless the utmost care in slice handling is used, the potentially large standard deviations mean that the method is useful for ascertaining that SGU calculations are reasonably accurate but that it is difficult to obtain a precise phosphorylation reaction rate. Table 10 illustrates the larger standard error of the graphical analysis method compared to the simplified method.
Comparison of SGU measured with simplified and graphical analysis methods
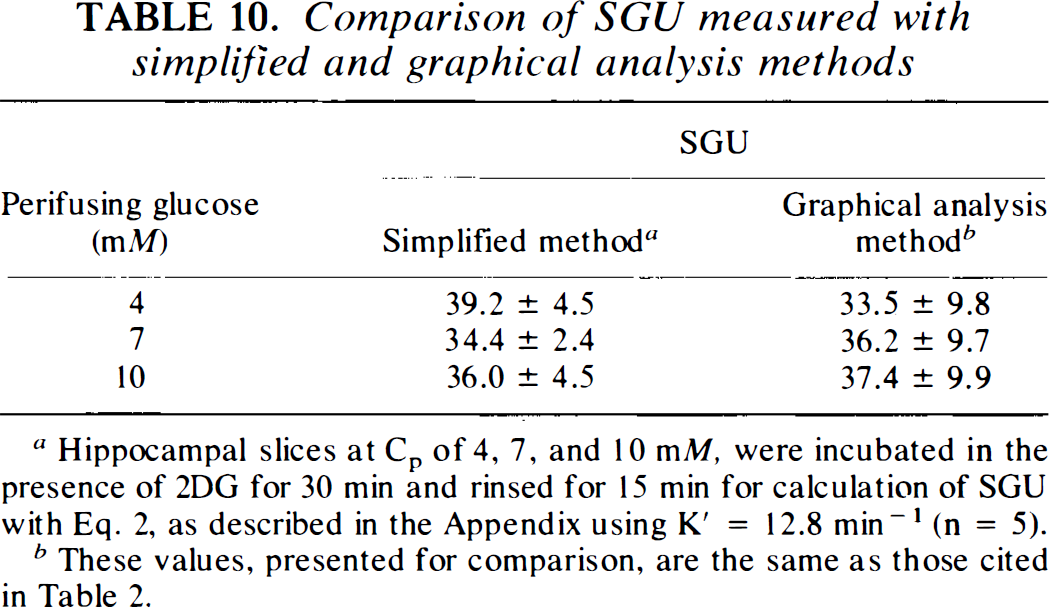
Hippocampal slices at Cp of 4, 7, and 10 mM, were incubated in the presence of 2DG for 30 min and rinsed for 15 min for calculation of SGU with Eq. 2, as described in the Appendix using K′ = 12.8 min−1 (n = 5).
These values, presented for comparison, are the same as those cited in Table 2.
These studies thus demonstrate that Michaelis–Menten theory can be used to predict the behavior of rat hippocampal brain slice kinetic rate constants as a function of buffer glucose concentration and suggest that the apparent rate coefficients derived for hippocampus are applicable over a broad range of experimental conditions to brain slices from other regions, and, possibly, to other species, as well. The SGU method has already been applied to ischemia (Newman et al., 1989), circadian rhythms (Newman et al., 1992), and intrinsic glucose metabolism (Newman et al., 1990) using both whole slice analysis and regional autoradiography. However, the method should also be widely applicable for studies of other brain slice models of pathophysiology (such as seizure models) and a broad range of problems related to neuropharmacology, and for clarifying issues of cerebral metabolism that remain difficult to interpret because of the BBB in vivo.
Footnotes
Acknowledgment:
We gratefully acknowledge the assistance of Drs. Hui Qi and Katherine G. Grundy. These studies were supported by a VA Merit Review Grant and NINDS grant no. NS28429.
APPENDIX
This discussion follows standard Michaelis–Menten notation except that all symbols with subscript “1” refer to hexose transport into the tissue and those with subscript “3” refer to the hexokinase reaction. In addition, all symbols with an asterisk refer to 2DG while those without refer to glucose. It should be noted that, while the Michaelis–Menten model applies to concentrations in solution, kinetic models may apply either to concentrations in solution and tissue, Cp and Ce, or to the amounts of a substance in tissue per unit volume or weight, ae. Most kinetic rate constants refer to tissue amounts and are represented by lower case symbols, but K1 and K*1 are represented by uppercase symbols since they refer to concentrations in solution.
Assuming that glucose transport into tissue is reversible and symmetrical, and behaves as a single, saturable barrier, the rate constants for glucose may be written in terms of Michaelis–Menten theory as
and
where Vml is the maximum rate of transport of glucose into tissue, Kml is the concentration of glucose at which transport is half maximal, Ve is the volume of tissue accessible to glucose, and ae = VeCe. In addition
where Vm3 is the maximum rate of the hexokinase reaction with glucose as substrate, Km3 is the concentration of glucose at which phosphorylation is half maximal, and ae is as defined above.
In order to simplify the writing of equations, we will define Vml, as
where V*mi is the actual maximum velocity of 2DG transport (i = 1) or phosphorylation (i = 3) when glucose is not present. It will be further assumed that the physical distribution spaces of all hexoses in brain are identical so that Ve = V*e, the tissue volume accessible to 2DG. Thus, the rate constants for 2DG, which is present in tracer concentrations, may be written (Sokoloff et al., 1977) as
and
In brain, glucose-6-phosphate is rapidly converted to fructose-6-phosphate or glucose-1-phosphate. As a result, the rate of dephosphorylation of glucose-6-phosphate in brain is very small, the tissue rapidly achieves steady state, and k4 can be neglected for purposes of calculating the volume of distribution of glucose, Vd, which is then given by
For 2DG, V*d is defined as
The lumped constant, LC, is, by definition, the utilization ratio of radiotracer 2DG to glucose. Under the assumption that there is effectively no backflux of either glucose or 2DG from the phosphorylated to nonphosphorylated form (Hers, 1957), the LC may be written as
Since Km3 is of the order of 0.06 mM (Holden et al., 1991), we will also assume that Km3 « Ce, which is equivalent to assuming that Ce + Km3 ≅ Ce. Thus, Km3 can be ignored in the Michaelis–Menten equations. Further, as also discussed below, we will employ the experimental relationship that V*m3/Vm3 = 0.3 (Cunningham and Cremer, 1981; Pardridge et al., 1982; Gjedde, 1982; Mori et al., 1989). From Eqs. A3 and A7,
The assumption that Km3 ≪ Ce means that our results may not apply when tissue is exposed to very low glucose concentrations.
Based on these assumptions and relationships, all of the Michaelis–Menten parameters may be solved for in terms of K*1, K*2, K*3, Ve and Vd for a particular Cp. After simple algebraic manipulation, the solutions are
These Michaelis–Menten parameters may then be used to solve for the rate constants for all other values of Cp. Since glucose is in the steady state,
Since Vml, Kml, and Vm3 are constant with varying Cp, this equation may be used to solve for ae at any Cp once the values of the Michaelis–Menten parameters are determined for one particular Cp. Solving for ae yields
It also can be seen from Eq. A12 that, if Ve is close to its lower limit of K*1/K*2, Kml must be much larger than Cp. Under this condition, glucose transport is linear with respect to Cp, and K1, k2, K*1, and K*2 are independent of Cp. Further, for this case, using Eqs. A8, A11, and A19 with Eq. A16 yields
Therefore
and
Thus, for the Michaelis–Menten model, the values of the Vms, V*.ms, and Kmls can be found if values of K*1, K*2, K*3, and Vds are known for a single value of Cp and if a value can be assigned for Ve. The Michaelis–Menten parameters can then be used to calculate K1, k2, k3, K*1, K*2, and K*3 for other values of Cp with the above equations. Since Ve cannot be measured directly, however, further assumptions must be made. We will consider the two extreme cases, namely, that Ve is equal to the total tissue water space (upper limit Ve case) or that Ve = K*1/K*2 (lower limit Ve case).
Finally, from Eq. A6, for any two glucose analogues, denoted by a and b, present in tracer concentrations
Thus, if K*2 is shown to be constant with changing Cp in a particular system for one radiotracer glucose analogue, then K*2, for any other radiotracer glucose analogue, will also remain constant as Cp changes (Gjedde, 1982).