
Abstract
Glucose is the major energy source the adult brain utilizes under physiologic conditions. Recent findings, however, have suggested that neurons obtain most of their energy from the oxidation of extracellular lactate derived from astroglial metabolism of glucose transported into the brain from the blood. In the present studies we have used 2-[N-(7-nitrobenz-2-oxa-1,3-diazol-4-yl)amino]-2-deoxy-D-glucose (2-NBDG), a fluorescent analogue of 2-deoxyglucose, which is often used to trace glucose utilization in neural tissues, to examine glucose metabolism in neurons in vitro and in vivo. Cultured neurons and astroglia were incubated with 2-NBDG for up to 15 minutes, and nonmetabolized 2-NBDG was washed out. We found that fluorescence intensity increased linearly with incubation time in both neurons and astroglia, indicating that both types of brain cells could utilize glucose as their energy source in vitro. To determine if the same were true in vivo, Sprague-Dawley rats were injected intravenously with a pulse bolus of 2-NBDG and decapitated 45 minutes later. Examination of brain sections demonstrated that phosphorylated 2-NBDG accumulated in hippocampal neurons and cerebellar Purkinje cells, indicating that neurons can utilize glucose in vivo as energy source.
Glucose is the main and essential substrate for energy metabolism in the adult brain under physiologic conditions (Clarke and Sokoloff, 1999). Its metabolic pathway consists of two sequential processes, first by glycolysis to pyruvate/lactate in the cytosol, followed by oxidation in the mitochondria to CO2 and H2O. On the basis mainly of studies with cultured neurons and astroglia, it has been proposed that these glycolytic and oxidative components are compartmentalized between astroglia and neurons respectively (Magistretti and Pellerin, 1999; Pellerin et al., 1998). The extent of this partition is, however, controversial; some suggest that it is partial (Itoh et al., 2003a,b) and others that it is complete (Sibson et al., 1998). The purpose of the present study was to evaluate the degree of the proposed compartmentalization of glycolysis between astroglia and neurons in vivo.
Autoradiographic measurement of local cerebral glucose utilization with radioactive 2-deoxyglucose is a well-established method and is widely used to evaluate energy metabolism in the brain (Sokoloff et al., 1977). Intravenously injected 2-[14C]deoxyglucose is transported into the brain and phosphorylated by hexokinase in the brain cells. There is very little glucose-6-phosphatase activity to hydrolyze glucose-6-phosphate in neurons or astroglia (Dienel et al., 1988; Gotoh et al., 2000), and, therefore, the rates of 2-[14C]deoxyglucose phosphorylation can be determined from the accumulation of the isotope within the tissues, measured by quantitative autoradiography, and the time courses of the arterial plasma 2-[14C]deoxyglucose and glucose concentrations (Sokoloff et al., 1977). The rates of glucose utilization are subsequently calculated from the rates of 2-[14C]deoxyglucose phosphorylation and a proportionality constant that encompasses the ratios of the kinetic constants of 2-[14C]deoxyglucose and glucose for blood-brain barrier transport and phosphorylation by hexokinase (Sokoloff et al., 1977). The autoradiographic 2-[14C]deoxyglucose method, however, has too limited spatial resolution to distinguish between neurons and astroglia.
Recently, 2-[N-(7-nitrobenz-2-oxa-1,3-diazol-4-yl)amino]-2-deoxy-D-glucose (2-NBDG), a fluorescent analogue of 2-deoxyglucose, has become available (Yoshioka et al., 1996b) and has been used to assess glucose transport in vascular smooth muscle cells (Lloyd et al., 1999), Escherichia coli (Natarajan and Srienc, 2000; Yoshioka et al., 1996b), astrocytes (Loaiza et al., 2003), cardiomyocytes (Ball et al., 2002), enterocytes (Román et al., 2001), yeast Candida albicans (Yoshioka et al., 1996a), and pancreatic β-cells (Yamada et al., 2000). In the present study, we first validated the usefulness of 2-NBDG as a fluorescent tracer to trace glucose utilization in cultured neurons and astroglia and then applied it in studies in whole animals. The results showed that neurons in the brain utilize glucose as a substrate for energy metabolism, thus corroborating previous reports suggesting that neurons in vivo utilize glucose in addition to lactate provided by astroglia (Itoh et al., 2003a,b).
MATERIALS AND METHODS
Materials
Chemicals and materials were obtained from the following sources: 2-NBDG, and Texas red goat anti-mouse IgG antibody from Molecular Probes Inc (Eugene, OR, U.S.A.); high-glucose (25 mM) Dulbecco's modified Eagle medium (DMEM), penicillin, and streptomycin from Life Technologies (Gaithersburg, MD, U.S.A.); defined fetal bovine serum (FBS) from HyClone Laboratories (Logan, UT, U.S.A.); trypsin-EDTA from Boehringer Mannheim (Indianapolis, IN, U.S.A.); Dulbecco's phosphate buffered saline (PBS), Hanks' Balanced Salt Solution (HBSS), poly-L-lysine, cytosine arabinoside, monoclonal anti-calbindin-D-28K antibody, monoclonal anti-glial fibrillary acidic protein (GFAP) antibody, and monoclonal anti-Neurofilament 68-kDa antibody from Sigma (St. Louis, MO, U.S.A.); anti-vimentin antibody from Roche Molecular Biochemicals; anti-NeuN antibody and monoclonal antibodies against Neurofilament 160-kDa from Chemicon (Temecula, CA, U.S.A.); and sodium pentobarbital from Dainippon Pharmaceutical (Tokyo, Japan).
Animals
All procedures on animals were in accordance with The Animal Experimental Guideline of Keio University School of Medicine and approved by the Experimental Committee of Keio University. Cell cultures were prepared from timed pregnant Sprague-Dawley rats (Japan SLC, Hamamatsu, Japan). In vivo glucose utilization studies were carried out in normal adult male 350–400 g Sprague-Dawley rats (Charles River, Yokohama, Japan), maintained on a 12-hour light/dark cycle with humidity and temperature controlled at normal levels and allowed food and water ad libitum.
Cell cultures
Neuronal and astroglial cultures were prepared from mesencephalon of fetal rats on embryonic day 16. The mesencephalon was excised and, after removal of meninges and blood vessels, mechanically disrupted by gentle passage through a 22-gauge needle. Neuronal cultures were prepared by dispersion of the dissociated cells (1.5 × 10⁶ cells per mL) in poly-L-lysine-coated 35-mm glass-bottom dishes (Matsunami, Japan) and incubation in high-glucose (25 mM) DMEM containing 10% (vol/vol) FBS, penicillin (100 units/mL), and streptomycin (100 μg/mL) at 37°C in humidified air containing 7% CO2. After 3 days of incubation, cytosine arabinoside (20 μM) was added to the culture medium. Assays were done on 8-day-old cultures. Astroglial cultures were prepared by dispersion of the dissociated cells (5 × 10⁵ cells per mL) in uncoated 35-mm glass-bottom dishes and incubation under the same conditions, except no cytosine arabinoside was added, and the culture medium was changed on day 2 and every third day thereafter. Assays were done on 15-day-old cultures.
Some cells from the neuronal and astroglial cultures were plated in six-well culture plates for immunohistological examination. Neurons were stained with monoclonal antibodies against Neurofilament 68-kDa (Sigma) and 160-kDa (Chemicon) proteins. Astroglia were identified by GFAP and vimentin. More than 99% of the cells in the cultures showed the immunohistological character of the targeted cells.
Glucose utilization in cultured neurons and astroglia
The use of radioactive 2-deoxyglucose to determine glucose utilization in cultured brain cells has been described in detail (Brookes and Yarowsky, 1985) and well validated (Gotoh et al., 2000). To overcome the limitations in spatial resolution associated with autoradiography, fluorescent 2-NBDG was used in place of 2-[14C]deoxyglucose. After 15 minutes of preincubation with HBSS containing 2 mM glucose in air/5% CO2, the preincubation medium was replaced by HBSS with 2 mM glucose containing one of six concentrations of 2-NBDG (0, 10, 30, 50, 70, and 90 μM), and incubation was continued for either 0, 5, 10, 15, or 20 minutes. At the end of the incubation, the reaction mixture was replaced by fresh HBSS with 2 mM glucose, and incubation was continued for 5 minutes to allow efflux of residual nonphosphorylated 2NBDG from the cells. The cell carpets were washed three times with HBSS containing 2 mM glucose.
Fluorescence imaging was obtained with a fluorescence microscopy system, which consisted of an inverted microscope (TE2000, Nikon, Japan), a Xe arc lamp (C6979, Hamamatsu Photonics, Japan), a charge-coupled device (CCD) camera (C4742–95, Hamamatsu Photonics, Japan), and imaging software (Aquacosmos, Hamamatsu Photonics, Japan). Excitation light and emission light wave-lengths were set at 475 nm and 535 nm, respectively, by means of a filter set (XF100–2, Omega Optical, U.S.A.). Fluorescence intensity of standardized concentrations of 2NBDG, each of which filled a culture dish without cells, was measured for calibration. To minimize artifacts derived from photo bleaching and to enable comparisons of fluorescence intensities among different dishes, a series of measurement was performed continuously.
Glucose utilization in cultured neurons in each dish was calculated by averaging fluorescence intensity in a single visual field with a magnification of 10x. Thirty consecutive visual fields were evaluated to determine the mean fluorescence intensity for each dish. The fluorescence intensity was calibrated by setting the intensity obtained from 2 mL of 50 nM 2-NBDG in a culture dish without cells at 100 units.
Glucose utilization in cultured astroglia was measured in the same way as for neurons except that region of interest to measure fluorescence was set as a whole visual field obtained with a 20x objective lens. Fluorescence intensity of each image was calibrated in the same way.
Local cerebral glucose utilization in vivo
Rats were prepared for determination of local cerebral glucose utilization by insertion of PE50 catheters (Clay-Adams, NJ, U.S.A.) into a femoral artery and femoral vein under isoflurane anesthesia (5% for induction and 1.0–1.5% for maintenance in 70% N2O/30% O2). Lidocaine ointment (5%) was applied to the surgical wounds after closure, and loose-fitting plaster casts were applied to the animals' lower torsos to minimize locomotion. Body temperature was monitored and maintained at 37°C throughout the procedure. At least 3 hours were allowed for recovery from surgery and anesthesia before initiation of determinations of glucose utilization.
Cerebral glucose utilization was determined in six rats by a fluorometric deoxyglucose method based upon the quantitative autoradiographic 2-[14C]deoxyglucose method (Sokoloff et al., 1977). Either 2.5 μmol/kg or 25 μmol/kg of 2NBDG was intravenously injected as a bolus, and 45 minutes later the rats were injected with a lethal dose of pentobarbital. The brains were rapidly removed, frozen in isopentane maintained at −40° to −50°C with dry ice, and cut into 20-μm sections in a cryostat at −22°C. The frozen brain sections were thaw-mounted on glass cover-slips and immediately dried on a hot plate at approximately 60°C, and fluorescent images were obtained with the same fluorescence system as was used for the in vitro fluorescence studies described previously.
Additional in vivo studies were performed in four rats with 2-NBDG administered intracisternally to overcome the limited transport of 2-NBDG across the blood-brain barrier. In these studies, a silastic catheter (0.012-inch inner diameter x 0.025-inch outer diameter) (Read Plastic, Rockville, MD, U.S.A.) was inserted into the cisterna magna, and 2-NBDG, dissolved in artificial cerebrospinal fluid at a concentration of 15 μmol/mL, was infused continuously at a rate of 2.0 μL/min for 60 minutes. The intracisternal infusion was then discontinued, and 60 minutes were allowed for the washout of nonphosphorylated 2-NBDG from the tissues by transport and the circulation. The brain was then removed, frozen in isopentane, cut into 20-μm sections, and examined by fluorescence microscopy.
Immunohistochemistry of the brain sections
After fluorescent images of the 2-NBDG distribution were obtained, the same brain sections were processed for immunohistochemistry to identify the brain cells. The sections were immersed in PBS for 5 minutes, and the PBS was then replaced with fresh PBS. This washing with PBS was repeated three times to remove completely the fluorescent dye from the tissues. After application of 1.5% skim milk for 60 minutes, antibodies to either NeuN (1:200), Calbindin (1:3000) or GFAP (1:400) were placed on the sections, and the sections were kept at 4°C overnight. After three repeated 10-minute washouts, secondary antibody, that is, goat anti-mouse antibody conjugated with Texas-Red (1:400), was applied. After 2 hours of exposure to the antibody, 10-minute washouts were repeated, and the sections were mounted with a fluorescence mounting medium and observed with the fluoroscope.
To facilitate identification of the fluorescent sections, corresponding sections were obtained from independent rats and stained with cresyl violet.
RESULTS
Glucose utilization in cultured neurons and astroglia
Representative images of phosphorylated 2-NBDG in neurons are shown in Fig. 1. After incubation with 50 μM 2-NBDG for either 0 (A), 5 (B), 10 (C), 15 (D), or 20 (E) min, the nonphosphorylated 2-NBDG was washed out, and fluorescence intensity derived from phosphorylated 2-NBDG in neurons was found to increase with increasing incubation time (Fig. 1). Average fluorescence intensity for each incubation time was measured. Duplicate dishes were used for each incubation time, and values are expressed as means ± SD (graph in Fig. 1). Fluorescence intensity increased proportionately to incubation time. In some dishes, fluorescence intensity was followed intermittently for additional 60 or more minutes, and during that time fluorescence intensities did not decrease, confirming that the fluorescent tracer remaining in the cells was phosphorylated and trapped.
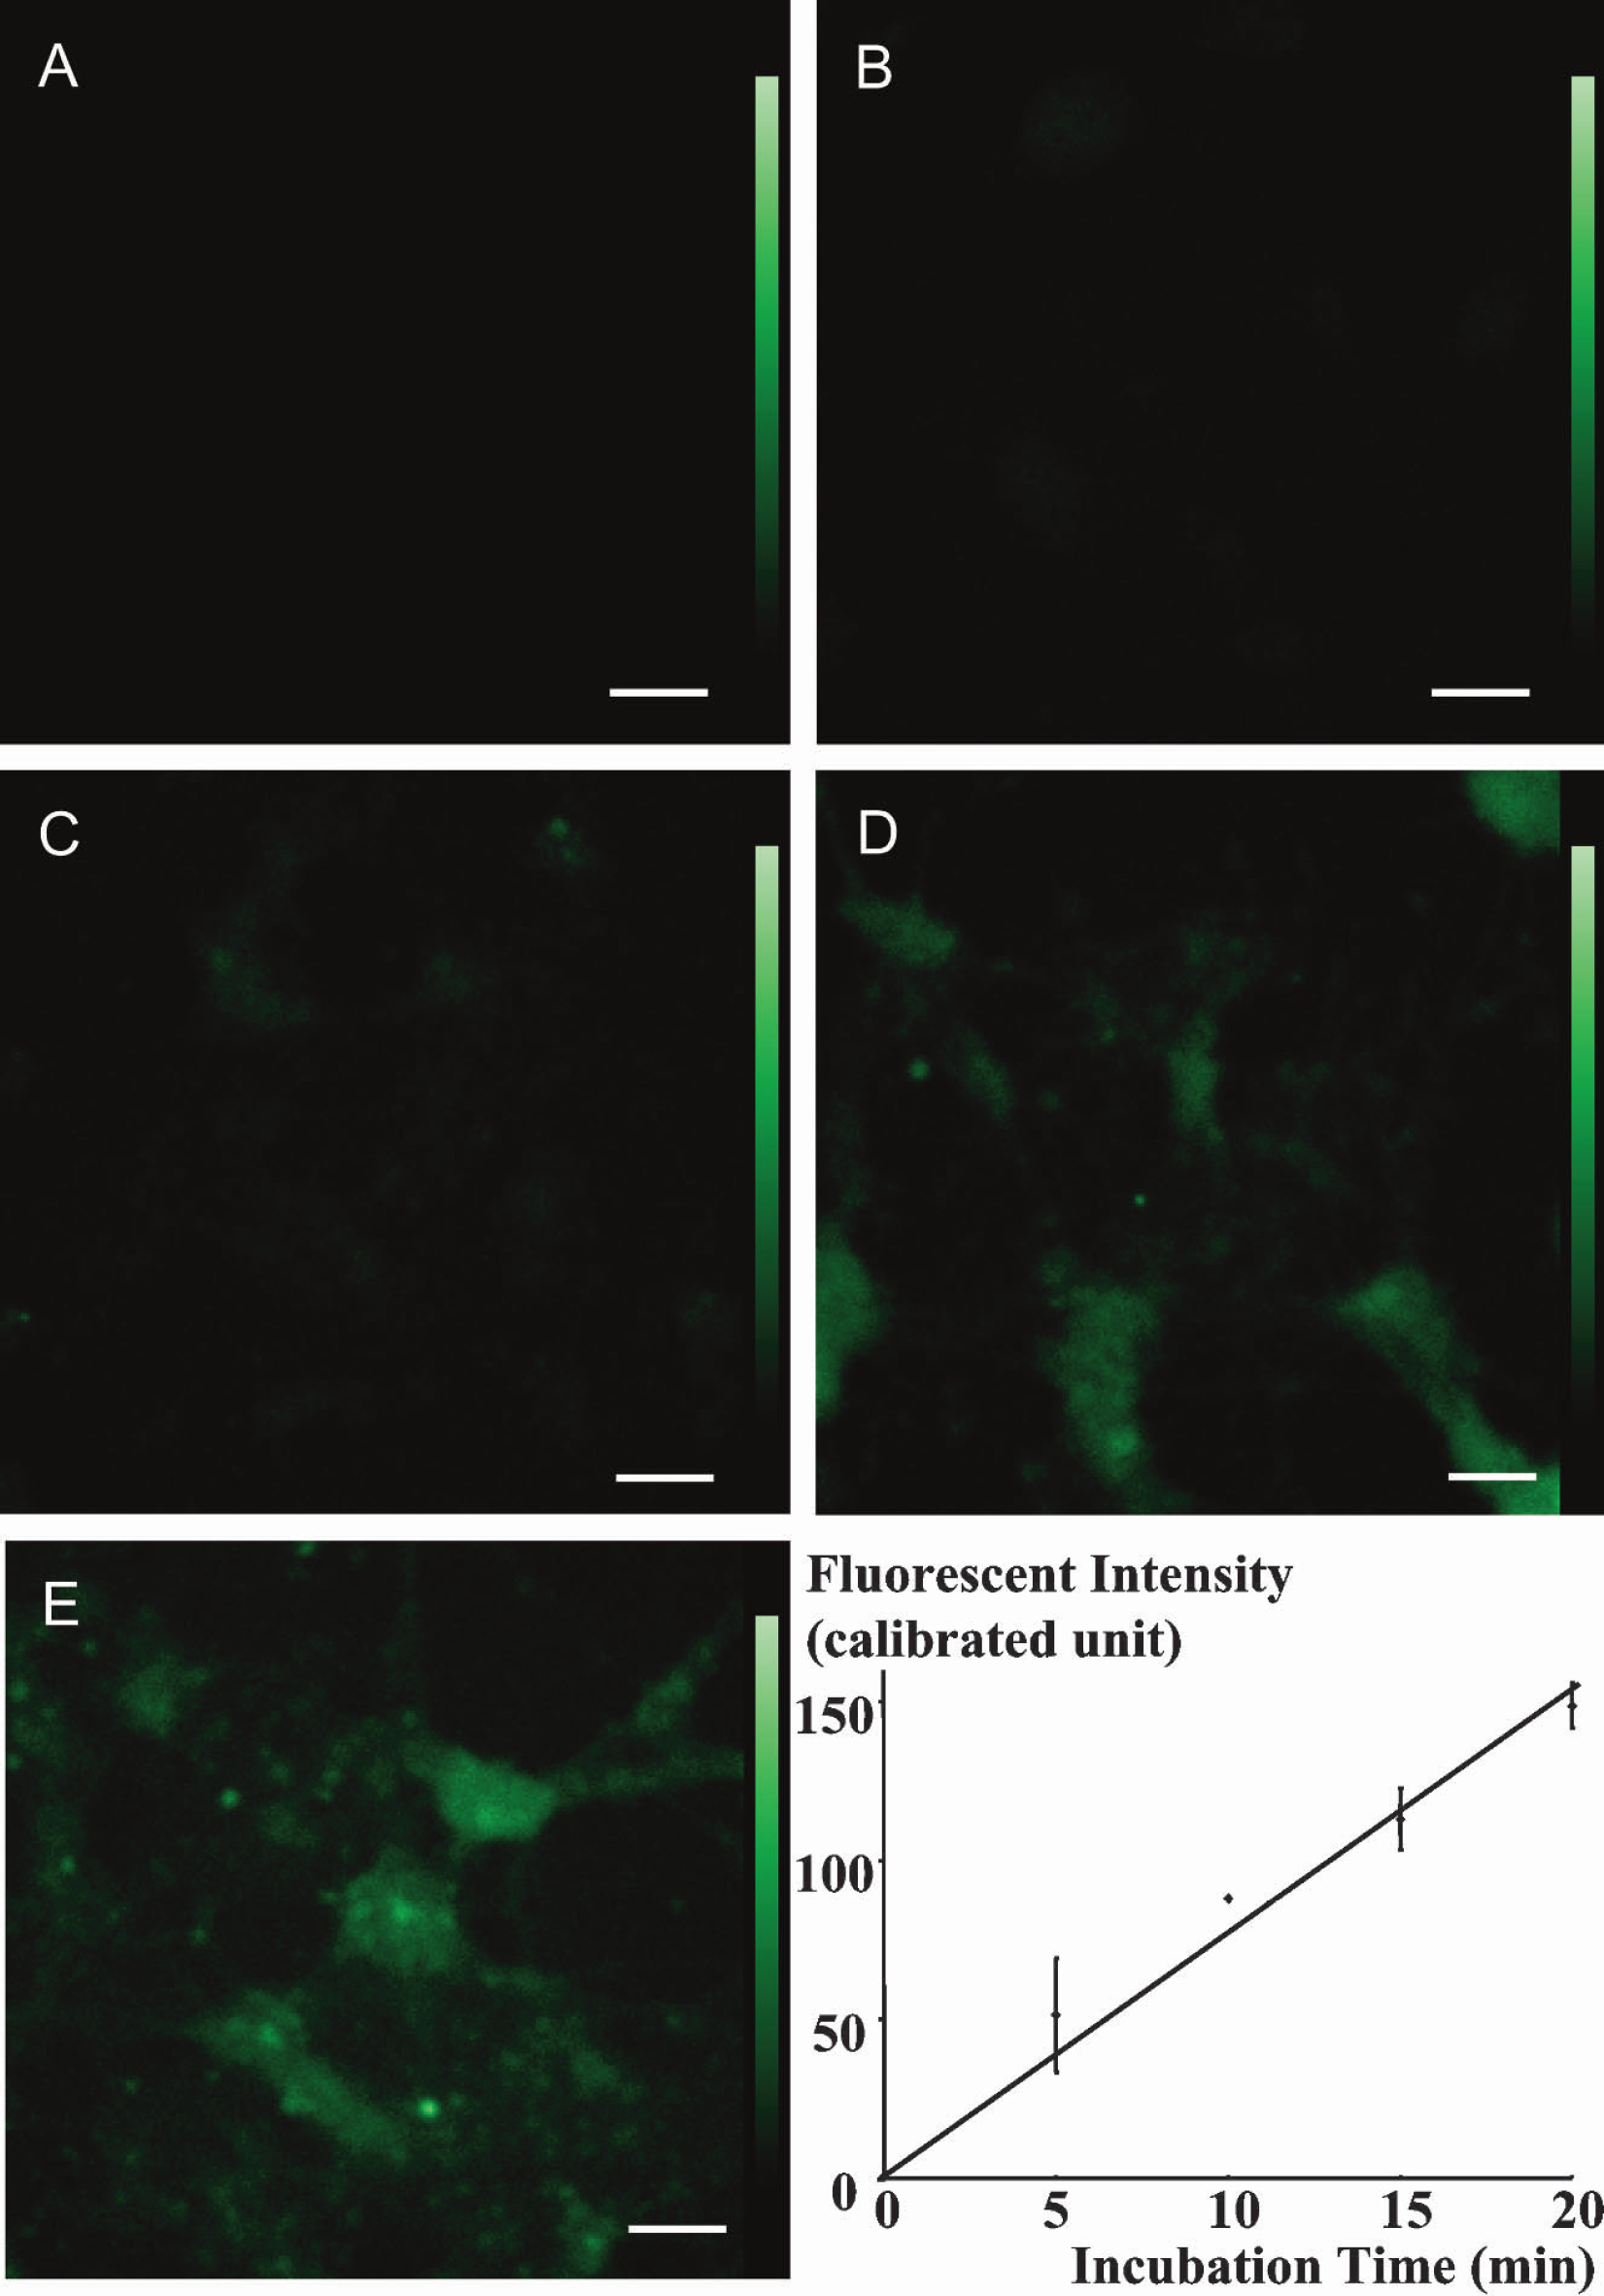
Phosphorylation of 2-NBDG in neurons. After incubation of neurons with 2-NBDG for either 0 (A), 5 (B), 10 (C), 15 (D), or 20 minutes (E), the residual unmetabolized dye was washed out. Fluorescence intensity derived from phosphorylated 2-NBDG in the neurons increases with the incubation time. Scale bars = 100 μm. The graph shows phosphorylation of 2-NBDG in neurons. Fluorescence intensity derived from phosphorylated 2-NBDG in neurons increases proportionately with incubation time. Values are expressed as means ± SD.
Similar assays were carried out with the 2-NBDG method in astroglia, and these provided images of phosphorylated 2-NBDG in astroglia (Fig. 2). After incubation of astroglia with 50 μM 2-NBDG for either 0 (A), 5 (B), 10 (C), 15 (D), or 20 (E) minutes, nonphosphorylated 2-NBDG was washed out. As found in the neurons, fluorescence intensity derived from phosphorylated 2-NBDG also increased with incubation time in the astroglia. Average fluorescence intensity for each incubation time was measured. Triplicate dishes were used for each incubation time, and values are expressed as means ± SD (graph in Fig. 2). Fluorescence intensity increased proportionately with incubation time in the astroglia as in the neurons. The effects of 2-NBDG concentration in the reaction mixture on 2-NBDG phosphorylation were also examined in astroglia. Astroglia were incubated with 0, 10, 30, 50, 70, or 90 μM 2-NBDG for 15 minutes followed by the washout of nonphosphorylated 2-NBDG as described previously. Fluorescence intensity in 30 consecutive visual fields was measured. Values are expressed as means ± SD (Fig. 3). Fluorescence intensity increased in proportion to the concentration of 2-NBDG in the reaction mixture, suggesting that hexokinase, the enzyme catalyzing the phosphorylation, is far from saturation in this range of concentration. (i.e., <90 μM).
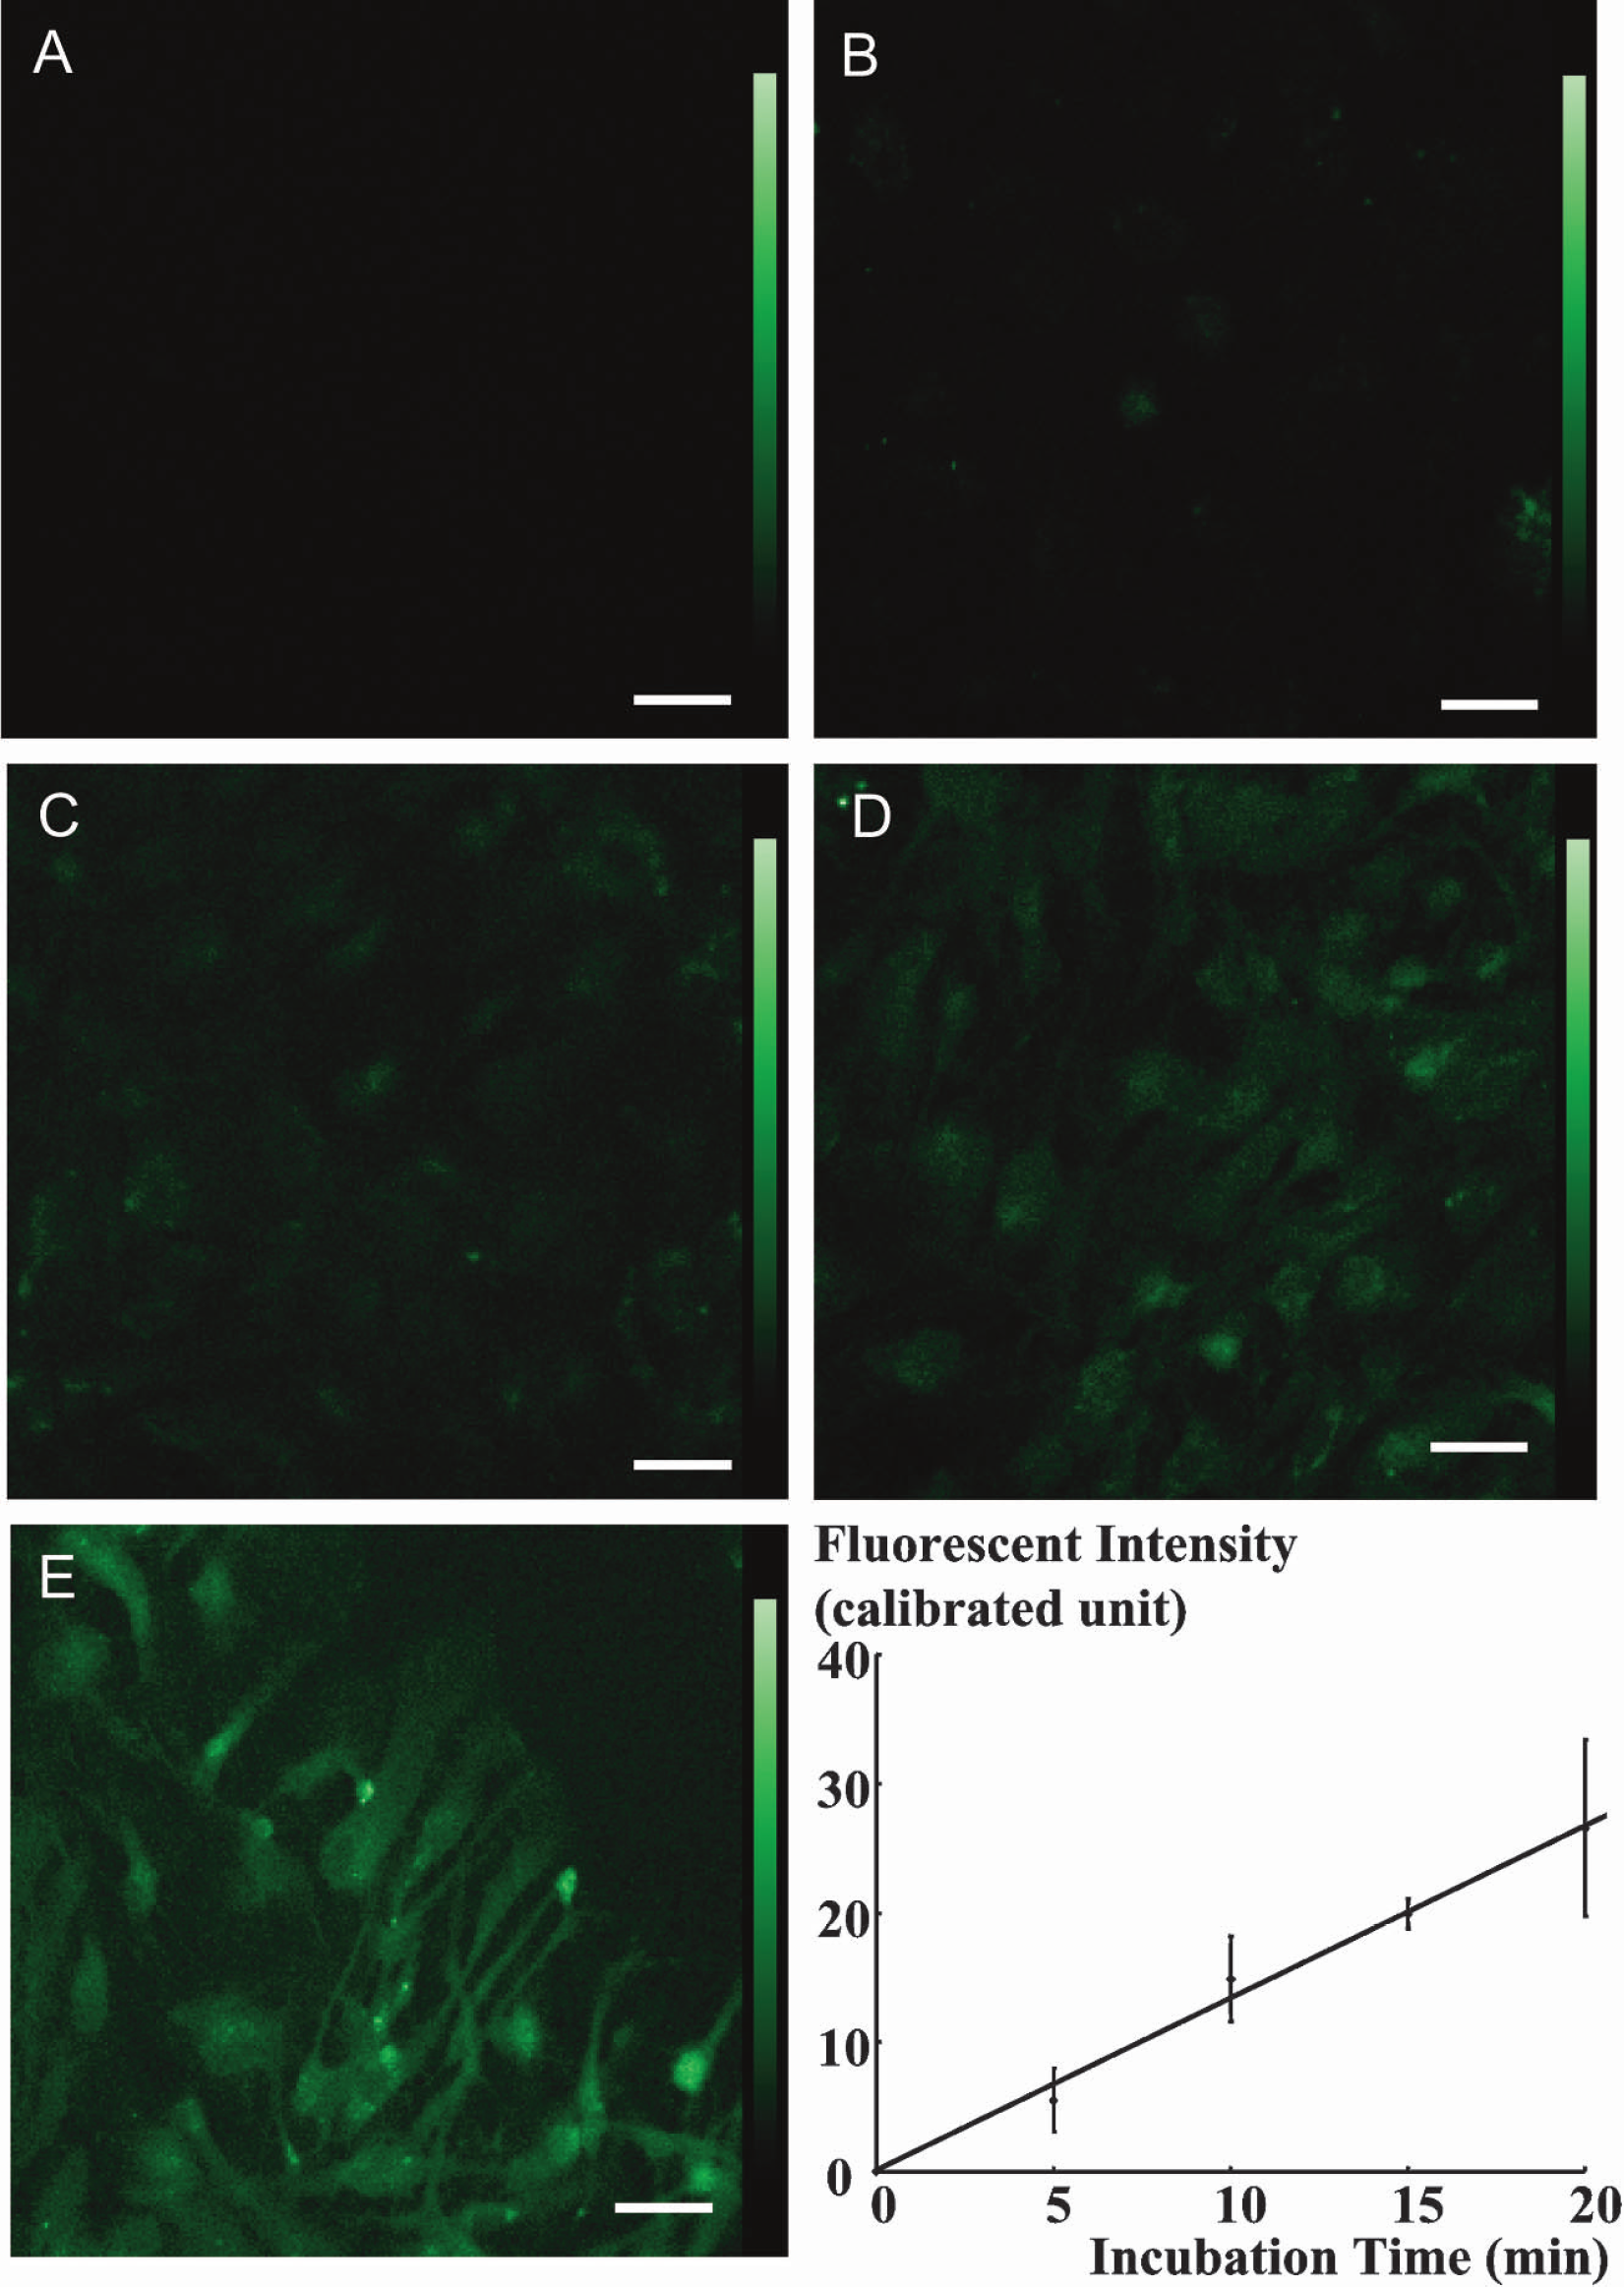
Phosphorylation of 2-NBDG in astroglia. After incubation of astroglia with 2-NBDG for either 0 (A), 5 (B), 10 (C), 15 (D), or 20 (E), the residual unmetabolized dye was washed out. Fluorescence intensity derived from phosphorylated 2-NBDG in the astroglia increases with the incubation time. Scale bars = 50 μm. The graph shows phosphorylation of 2-NBDG in astroglia. Fluorescence intensity derived from phosphorylated 2-NBDG in the astroglia increases proportionately with incubation time. Values are expressed as mean ± SD.
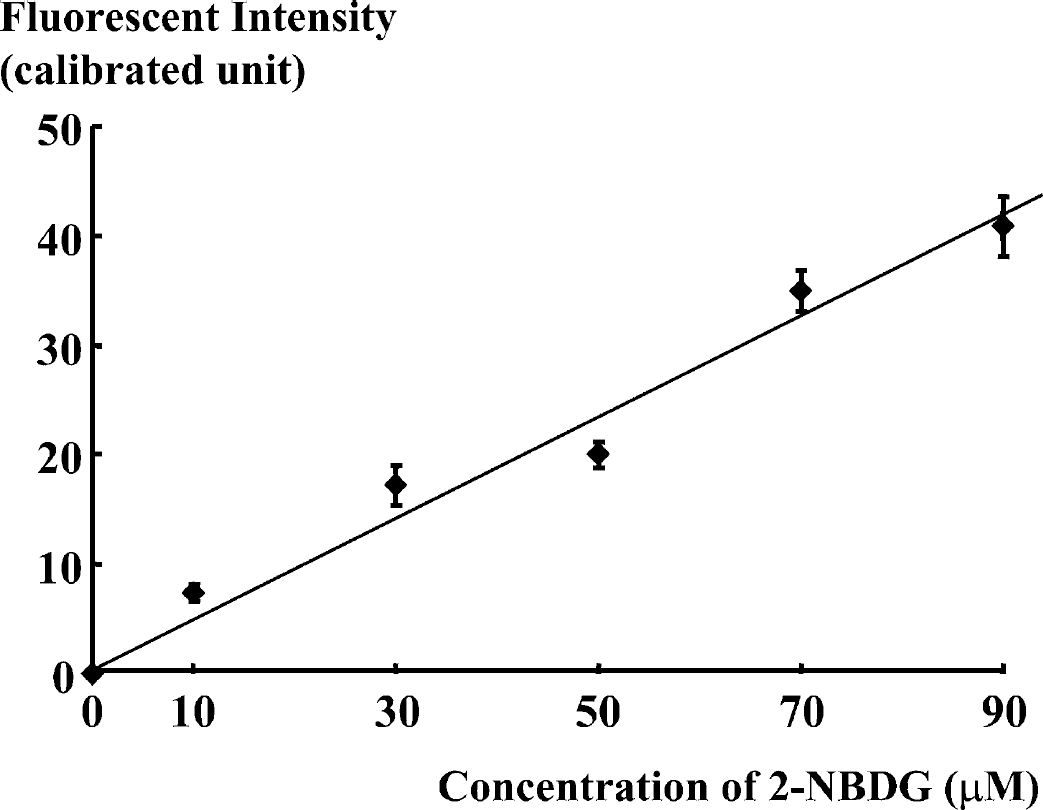
Phosphorylation of 2-NBDG in astroglia. Fluorescence intensity derived from phosphorylated 2-NBDG in astroglia during 15 minutes of incubation increases proportionately with the 2-NBDG concentration in the reaction mixture. Thirty consecutive regions of interest were measured, and values are expressed as means ± SD.
These incubation time and concentration dependencies that we observed indicate that the 2-NBDG is a useful fluorescent tracer with which to assay and localize glucose utilization in neurons and astroglia in vitro.
Local cerebral glucose utilization in vivo
A number of physiologic variables, including body temperature and arterial blood pressure, PCO2, PO2, and pH were monitored in those experiments in which glucose utilization was determined in vivo. None of these was found to change significantly during the procedure.
After fluorescence images for 2-NBDG were obtained from them, the tissue sections were washed out to remove phosphorylated 2-NBDG and then immunostained for histochemistry. Definitive images were obtained only with the high dose of 2-NBDG (25 μmol/kg). Figure 4 shows coronal brain sections at the level of hippocampus. Panels A to F demonstrate fluorescent images at the CA3 region of hippocampus. The region of observation is indicated with a square in panel G, which shows a section stained with cresyl violet. Panel A shows phosphorylated 2NBDG fluorescence in the pyramidal cell layer. A closer examination reveals that the majority of the fluorescence is located over cell bodies. Panel B shows anti-NeuN positive pyramidal neurons in CA3. Panel C is a superimposed image of panels A and B, showing high agreement (yellow regions) in distribution and morphology between 2-NBDG-accumulated cells and NeuN positive neurons. Arrows in these panels indicate some of the double-labeled cells. Artifacts such as the one in panels A, B, and C (thick arrow) were used to construct overlay of 2-NBDG images and immunohistochemical images.
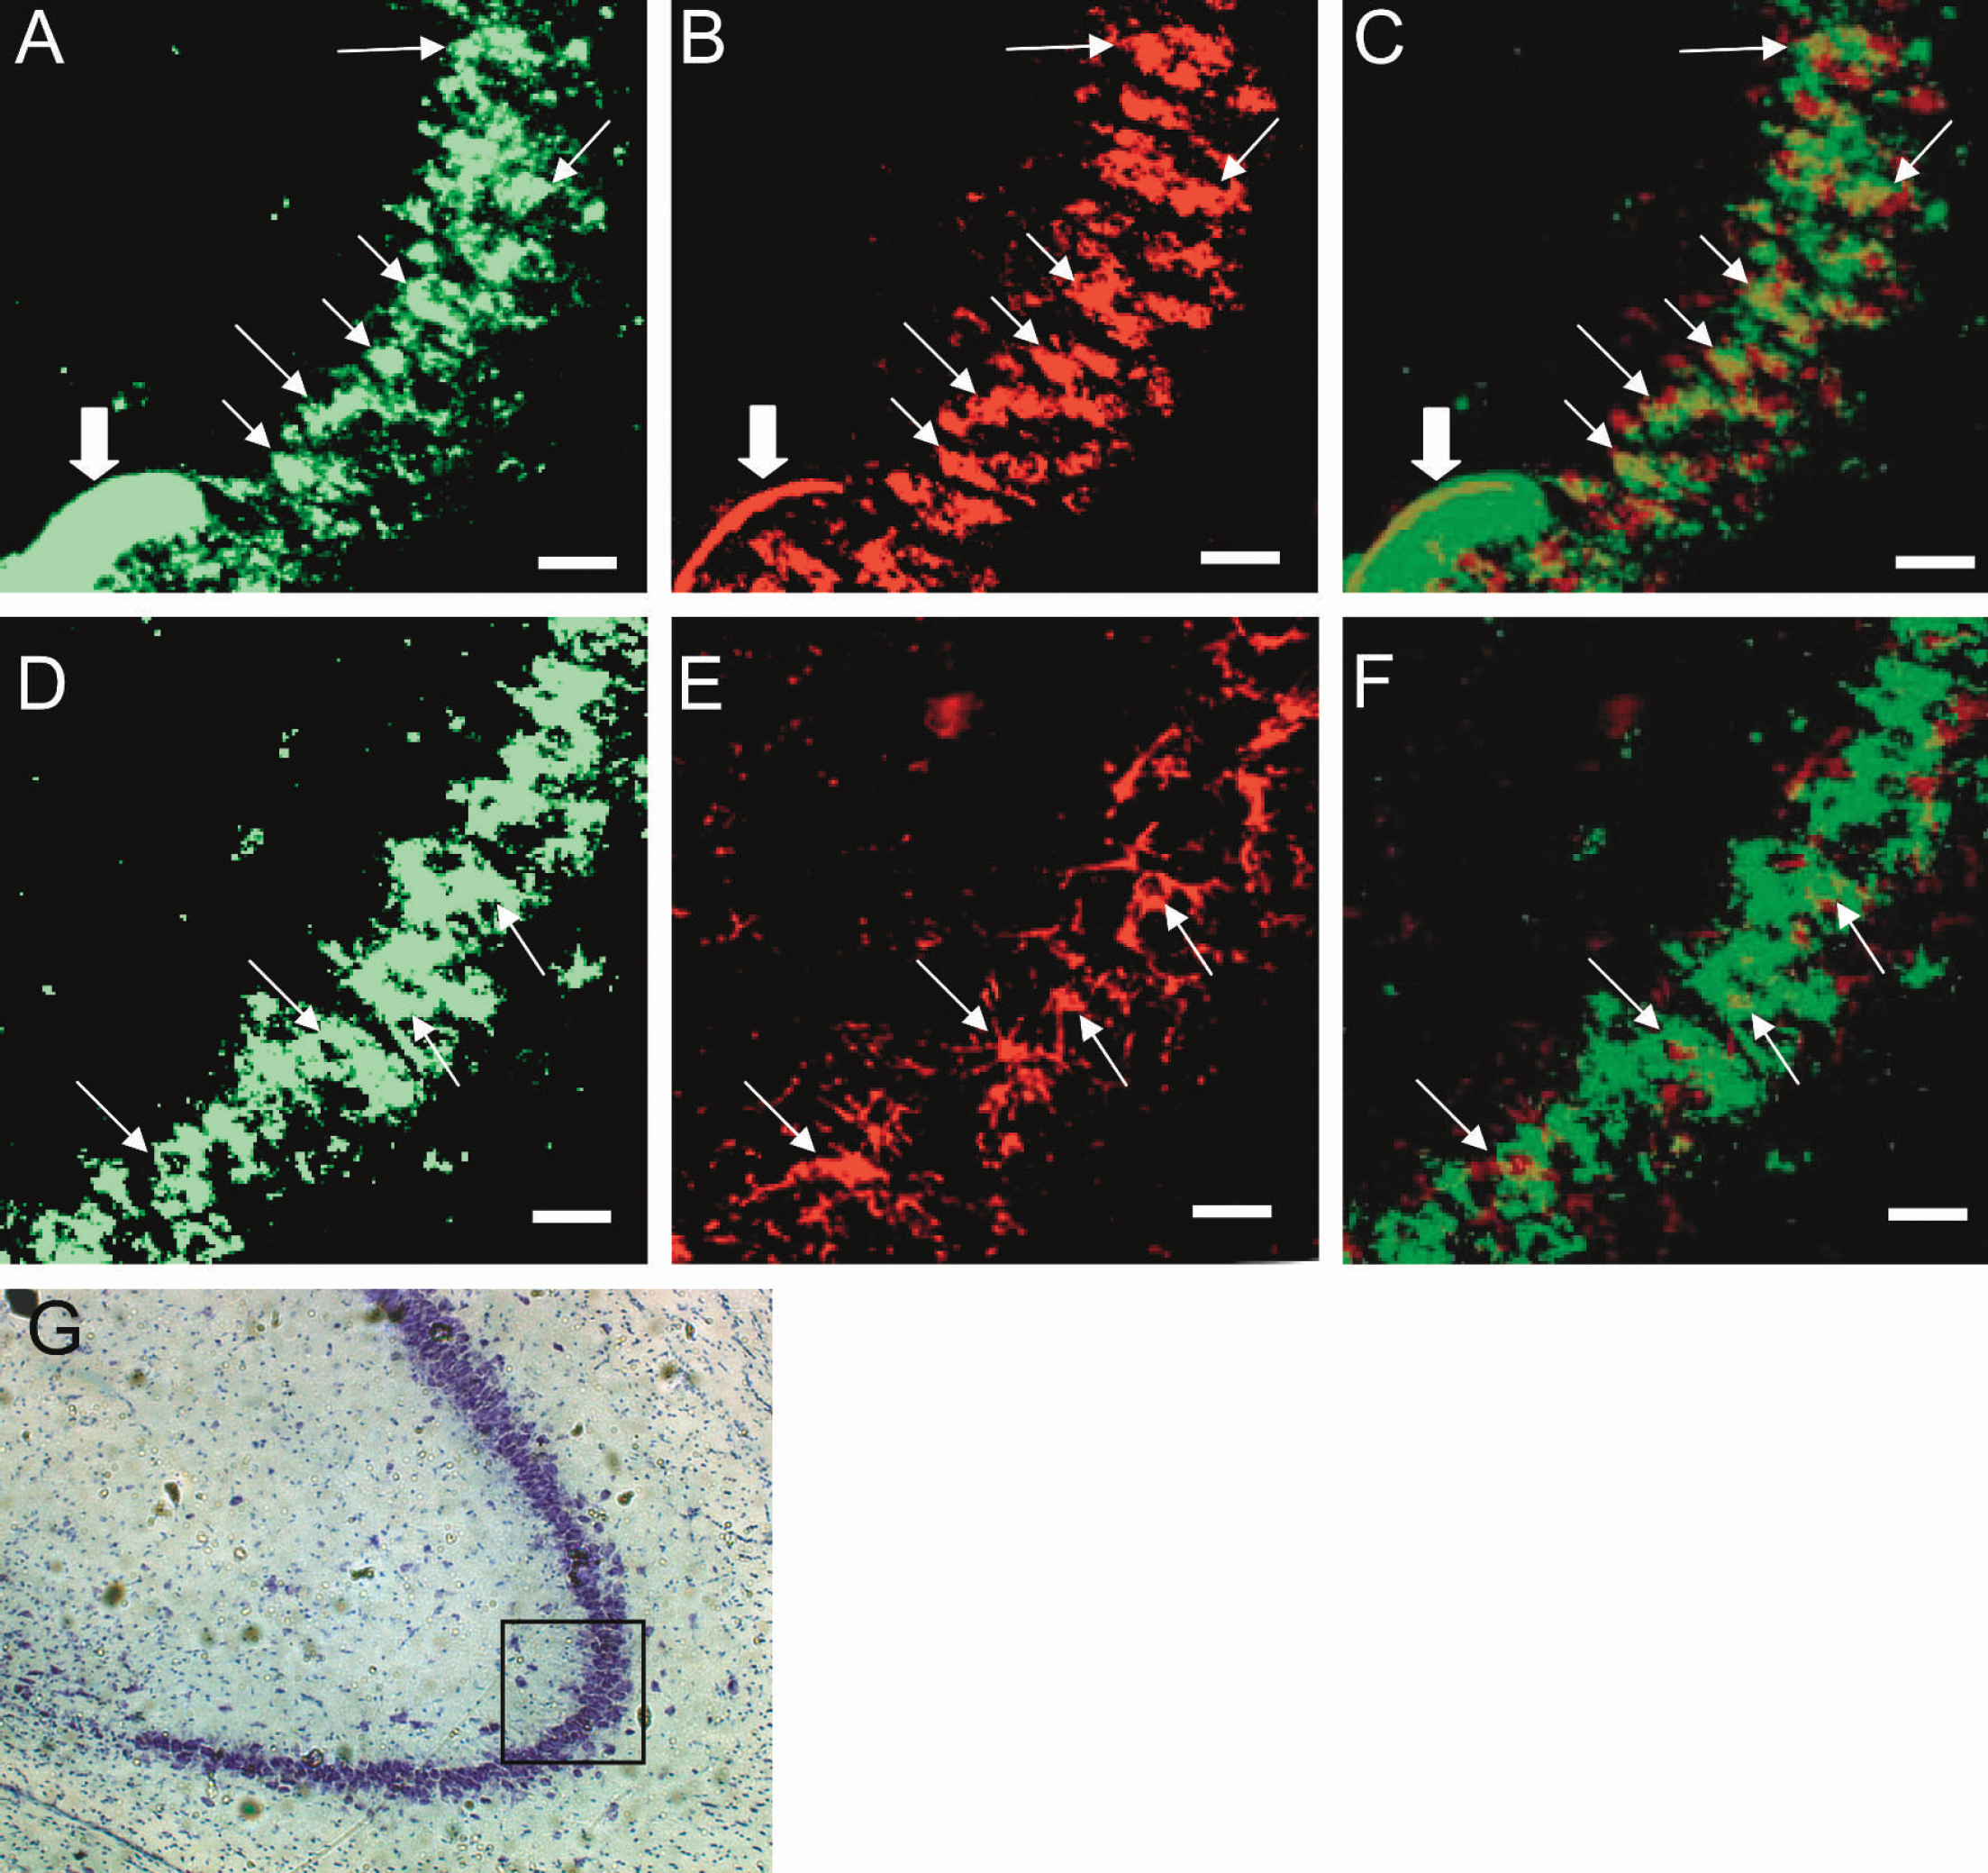
Brain sections at the level of hippocampus. A to F demonstrate fluorescent images at CA3 region of hippocampus. The region of observation is indicated by a square in G (cresyl violet staining).
Panel F in Fig. 4 is a superimposed image of panels D (2-NBDG image) and E (GFAP staining). GFAP-positive astroglia appear to constitute part of the cells with high accumulation of phosphorylated 2-NBDG. These cells shown in yellow (arrow) in panel F, however, are small in number, sparse in distribution, and different in morphology as compared with cells with 2-NBDG accumulation. Minor, if any, involvement of astroglia in overall 2-NBDG accumulation in panel F is distinct compared with the predominant neuronal involvement shown as high agreement of 2-NBDG-accumulated cells and NeuN positive neurons in panel C.
These results clearly demonstrate that neurons mainly take up and phosphorylate glucose in the pyramidal cell layer of hippocampus and that astroglial contribution to overall glucose consumption is minor.
Figure 5 shows coronal sections of the parietal cortex (panels A, B, C, and D) and sagittal sections of the cerebellum (panels E and F). The cells in the cortex showing high 2-NBDG phosphorylation (A) correspond well with NeuN positive neurons (B), whereas GFAP-positive astroglia (C) showed different morphology and different distribution. Superimposed images of 2-NBDG images and immunohistochemical images could not be constructed for these regions because they lacked specific landmarks. Instead, cresyl violet staining of the cerebral cortex, which corresponds to the observed region in panels A, B, and C, is shown in panel D to facilitate cellular identification. Size and distribution of large cells in panel D, which are usually regarded as neurons, resemble those of NeuN positive cells in panel B and most of 2-NBDG accumulated cells in panel A. Small cells in panel D, astroglia, may also be observed in panel A as smaller cells with 2-NBDG accumulation, but definite confirmation was not achieved because of the lack of superimposed images. Similarly, cerebellar cells with 2-NBDG phosphorylation (E) resemble NeuN positive cells (F) in size and distribution. White matter of the cerebellum in E showed low accumulation of 2-NBDG, in good agreement with conventional 2-[14C]deoxyglucose method.
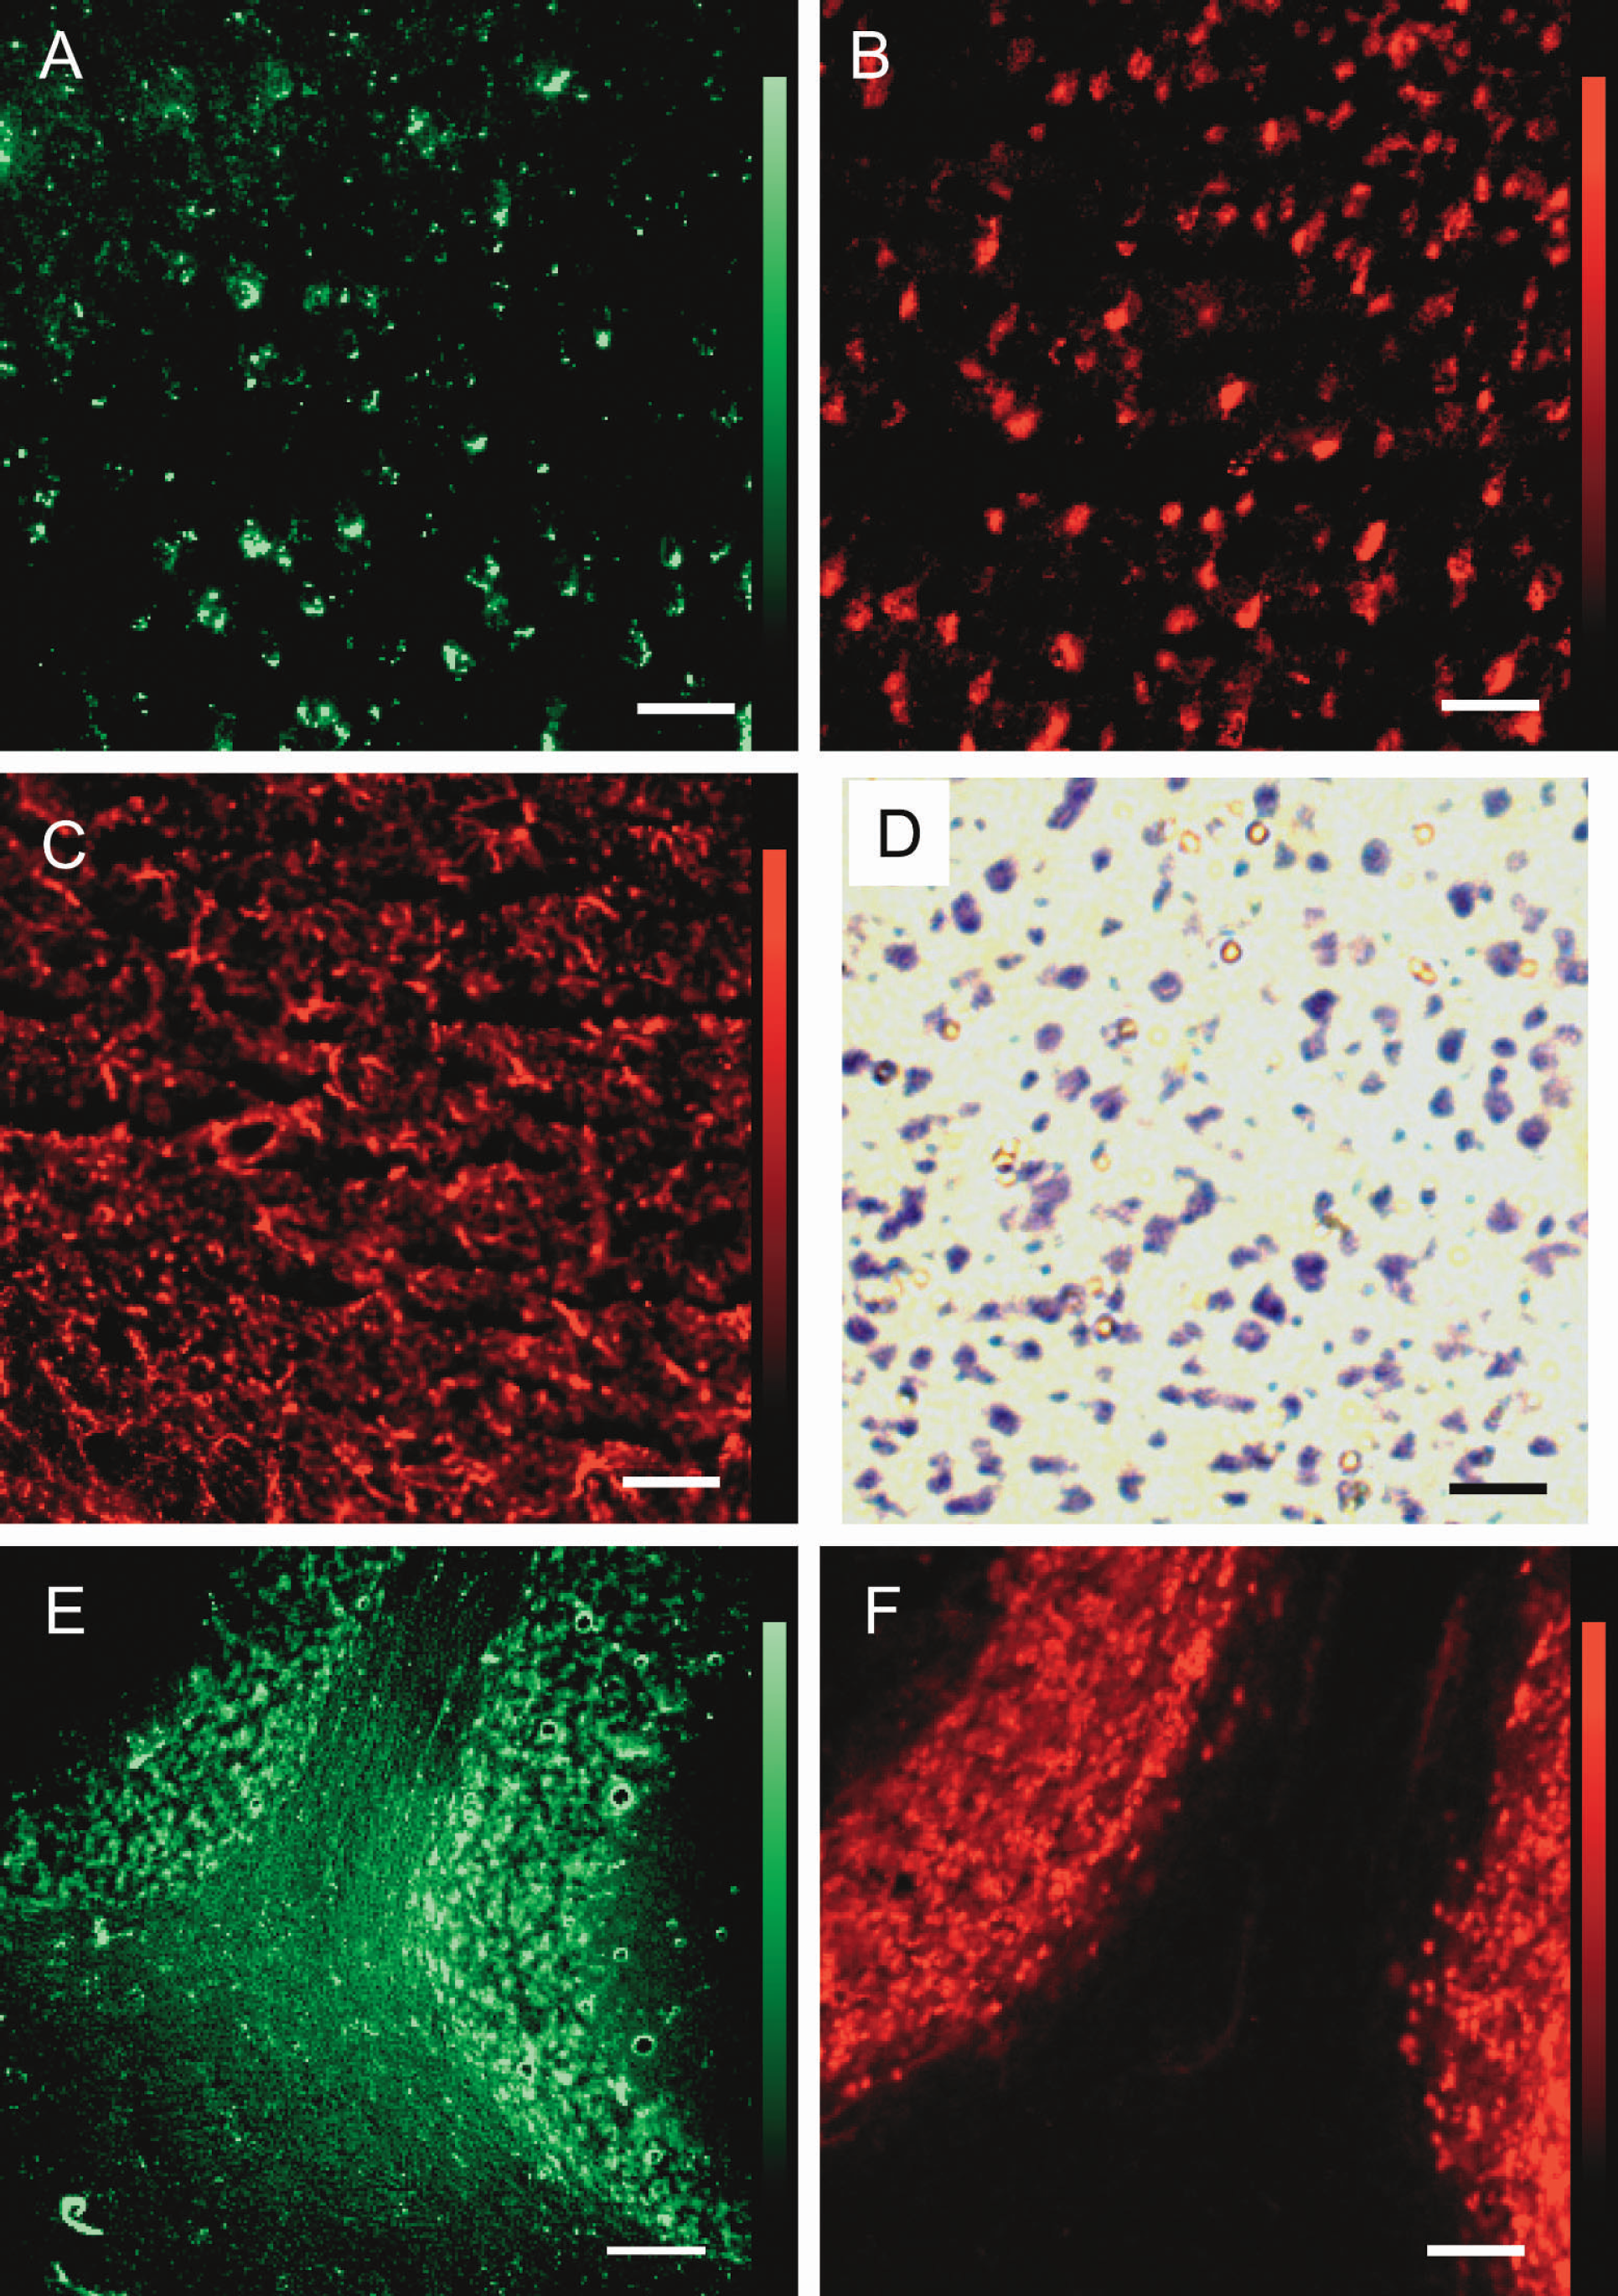
Coronal sections of the parietal cortex (A, B, C, and D) and sagittal sections of the cerebellum (E and F). The cells in the cortex showing high 2-NBDG phosphorylation (A) correspond well with NeuN positive neurons (B), whereas GFAP-positive astroglia (C) show different morphology and different distribution. Size and distribution of large cells in D (cresyl violet staining), regarded as neurons, resemble those of NeuN positive cells (B) and most of 2-NBDG accumulated cells (A). Small cells in D, astroglia, may also be observed in A as smaller cells with 2-NBDG. Similarly, cerebellar cells with 2-NBDG phosphorylation (E) resemble NeuN positive cells (F) in size and distribution. Scale bars = 50 μm (A, B, C, D, and F) and 100 μm (E).
2-NBDG transport across the blood-brain barrier is more limited than that of 2-deoxyglucose, and a 10-fold higher intravenous dose is required to obtain definitive images of 2-NBDG phosphorylation. Therefore, to avoid systemic effects and to obtain more precise images, 2-NBDG was infused into the cisterna magna. Sagittal sections of a cerebellar lobule are shown in Fig. 6. Panel A shows accumulated 2-NBDG, diffusely in the molecular layer and over cell bodies in the Purkinje cell layer and granular cell layer. Immunostaining of the same section for calbindin (panel B) demonstrates Purkinje cells. Panel C, a superimposed image of panels A and B, clearly demonstrates that calbindin positive Purkinje cells (arrow) all contain accumulated 2-NBDG. Magnified images (obtained with 40x objective lens) of the square regions in panels A, B, and C (obtained with 10x objective lens) are shown in panels D, E, and F, respectively. Calbindin positive Purkinje cells with 2-NBDG accumulation are indicated with thick arrows. These results are in vivo evidence that Purkinje cells as well as hippocampal pyramidal neurons utilize glucose as an energy substrate.
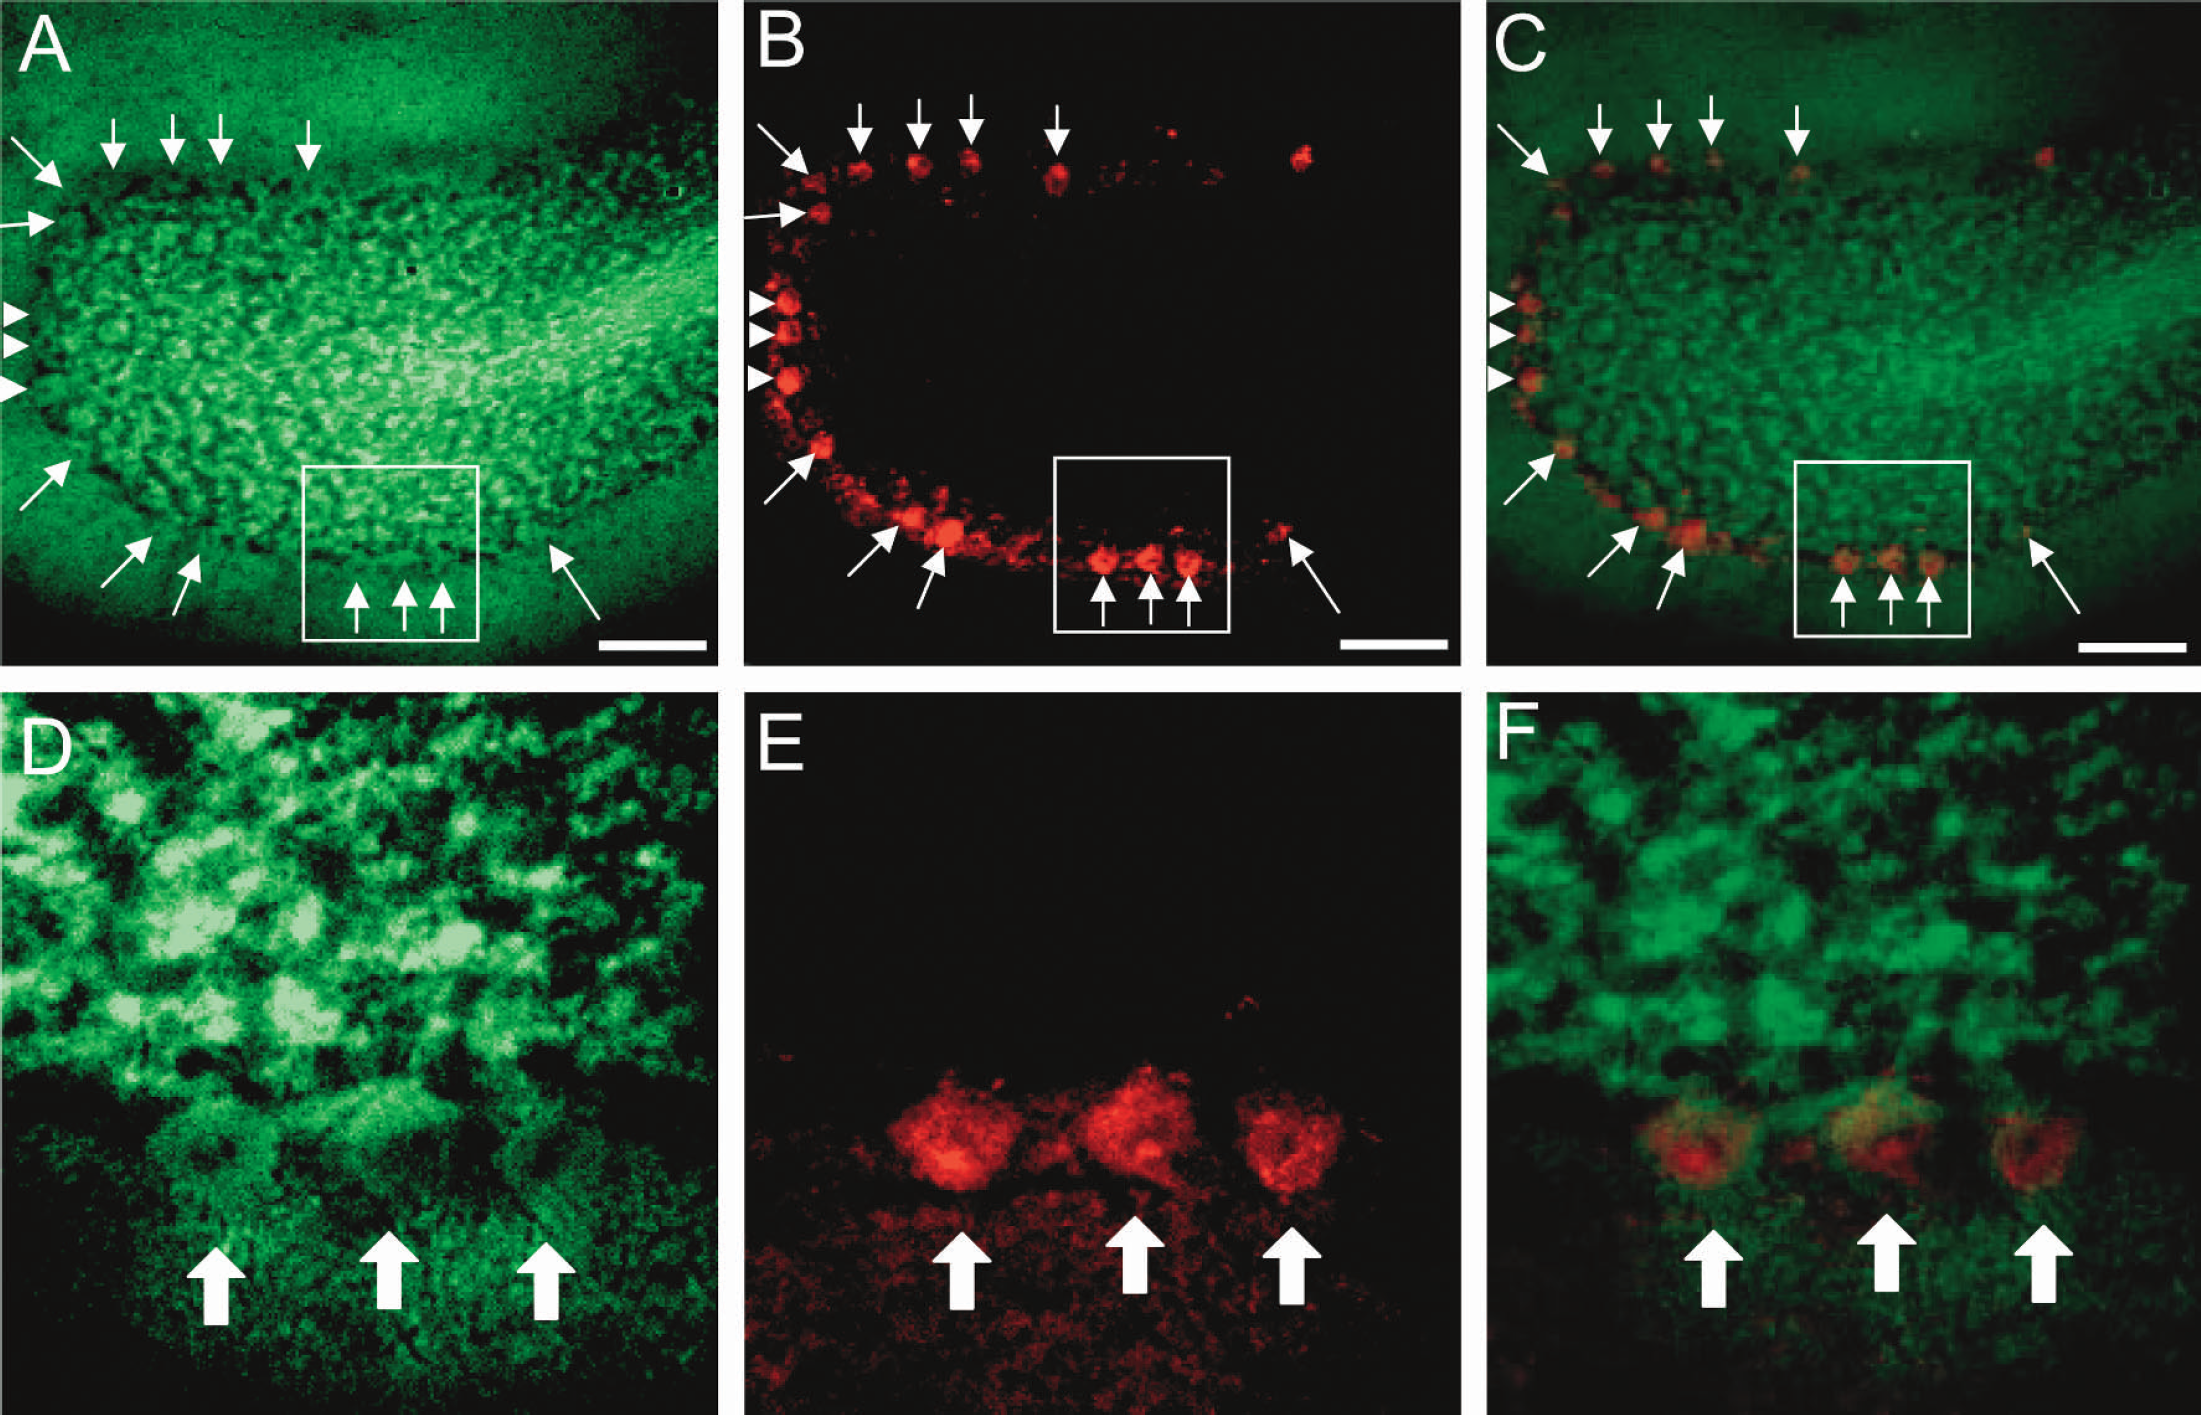
Sagittal sections of a cerebellar lobule.
DISCUSSION
Oxidative metabolism of glucose is normally the almost exclusive source of energy in the brain, and there is considerable evidence of an interaction between energy metabolism in neurons and in astroglia. On the basis primarily of studies with cultured cells, it has been proposed that glycolytic and oxidative pathways of glucose metabolism are compartmentalized between astroglia and neurons, with glycolysis in astroglia to produce lactate, which is then exported to neurons for oxidation. (Magistretti and Pellerin, 1999; Pellerin et al., 1998). The extent of this metabolic partitioning is, however, controversial. Some question the existence of such a separation; some suggest that portioning is present to some extent but neither an absolute requirement nor complete (Itoh et al., 2003a, b ), and some believe it to be essentially complete with glycolytic metabolism of glucose confined to astroglia and stoichiometrically coupled to glutamate/glutamine recycling (Sibson et al., 1998). Although studies with cultured cells indicate that in vitro they exhibit metabolic properties consistent with the proposed partitioning (Itoh et al., 2003a, b ; Magistretti and Pellerin, 1999; Pellerin et al., 1998), the controversy persists because there has not yet been any direct examination of glucose metabolism in neurons and astroglia in vivo. In the present study we have used the fluorescent dye, 2-NBDG, an analogue of deoxyglucose that can be phosphorylated by hexokinase, and demonstrated for the first time to our knowledge that neurons as well as astroglia take up and phosphorylate glucose directly not only in vitro but also in vivo. At least in the hippocampus, cerebral cortex, and cerebellar lobules, glucose consumption was predominant in neurons, although low glucose phosphorylation in astroglia was also suggested. Even though the present study does not offer quantitative information on the extent of lactate utilization compared with glucose utilization in neurons, it is suggested that astroglial supply of lactate to neurons is not primary in overall energy production, based upon these findings. If astrocytes are more glycolytic than oxidative and neurons are dependent more upon lactate than glucose, then astrocytes labeled with phosphorylated 2-NBDG would be readily detectable and neuropil would be highly labeled.
It is widely reported that neurons in vitro consume more glucose than cultured astroglia (Brookes and Yarowsky, 1985; Itoh et al., 2003b; Takahashi et al., 1995). Therefore, we did not compare the glucose phosphorylation rate between neurons and astroglia in vitro with 2-NBDG in the present study. Although it may appear that neurons phosphorylated more glucose (155 unit/20 min) than astroglia (27 unit/20min), depending upon the fluorescent intensity results (graphs in Figs. 1 and 2), the difference in cellularity of the culture and magnification of imaging between the neurons and astroglia made it difficult to compare absolute glucose phosphorylation rate. The main disadvantage of the 2-NBDG is that it can fade in light, whereas radioactivity of 2-[14C]deoxyglucose, which was previously used to measure absolute glucose phosphorylation rate in cultured neurons and astroglia (Itoh et al., 2003b), is quite stable. Therefore, we did not further measure the absolute glucose utilization in the present study with 2-NBDG.
Among the cells with high rates of glucose phosphorylation, we successfully identified NeuN-positive pyramidal neurons in hippocampus and calbindin-positive Purkinje cells in the cerebellum by constructing superimposed images. Even though we obtained quite suggestive data that other neurons in the cerebellum and cerebral cortex also utilize glucose, they were not definitely identified because of technical difficulties. 2-NBDG and its phosphorylated derivative are water-soluble and, therefore, removed during immunostaining procedures. The fluorescent 2-NBDG images and the immunohistochemical images could not, therefore, be obtained simultaneously from the same tissue sections, which, if possible, would have allowed superimposition of the two images and immunochemical identification of cells with high rates of 2-NBDG phosphorylation in all regions of the brain. We, therefore, limited our examination only to neurons in the hippocampus and cerebellum that have sufficiently unique characteristics that they could be readily identified. There are other methodological issues to be considered. It was previously reported that 50 μM 2-[14C]deoxyglucose was a tracer concentration that could be used with cultured brain cells without toxic effects (Gotoh et al., 2000; Takahashi et al., 1995). Under conditions of our assay we found the 2-NBDG phosphorylation rate in astroglia to be relatively linear with respect to 2-NBDG concentration in a range extending up to 90 μM. This linearity indicates that there was no interference with the normal rate of glucose utilization in our assay with 2-NBDG. Furthermore, the rates of 2-NBDG phosphorylation in both neurons and astroglia were also linear with incubation time up to 20 minutes, indicating that we were measuring initial rates. Recently, Loaiza and colleagues (2003) reported that 2-NBDG and its analogue 6-NBDG are useful in assessing glucose transporter activity in astroglia. Compared with the rate of glucose transport, the rate of glucose phosphorylation in the brain is much slower and rate-limiting for glucose metabolism (Sokoloff et al., 1977). This is why it is essential in the assay of the rate of glucose phosphorylation with 2-NBDG to remove by washout any residual fluorescence caused by nonphosphorylated 2-NBDG.
The dose of 2-NBDG required to obtain definitive images of phosphorylation in the brain cells in vivo is approximately 10-fold higher than the dose of 2-[14C]deoxyglucose generally used with the standard 2-[14C]deoxyglucose method. The difference in required dosages probably reflects more limited blood-brain barrier transport of 2-NBDG and/or higher Km or lower Vmax of hexokinase for 2-NBDG than for 2-[14C]deoxyglucose. Pharmacologic doses of 2-deoxyglucose are known to inhibit glucose phosphorylation (Landau et al., 1958) as well as conversion of glucose-6-phosphate to fructose-6- phosphate (Wick et al., 1957), and Horinaka and colleagues (1997) reported that 200 mg/kg (i.e., 1.2 mmol/kg) of 2-deoxyglucose in rats increased cerebral blood flow but without affecting systemic blood pressure, blood gas tensions or pH, and plasma lactate concentrations. The doses of 2-NBDG that we used (2.5 μmol/kg and 25 μmol/kg) are far below the doses of 2-deoxyglucose that have pharmacologic effects. Nevertheless, to obtain more detailed images of 2-NBDG phosphorylation while avoiding systemic side effects, we administered 2-NBDG into the cisterna magna. After 60 minutes of continuous infusion of 2-NBDG, an additional period of 60 minutes was allowed for washout of nonphosphorylated 2-NBDG from the tissues. Although full quantitative analysis of rates of glucose phosphorylation was not achieved with this method, detailed images of the distribution of phosphorylated 2-NBDG in the brain tissues and cells were obtained.
Compared with the autoradiographic 2-[14C]deoxyglucose method, the fluorescent images of 2-NBDG have better spatial resolution but less quantitative information. The fluorescent images can delineate each cell with accumulation of 2-NBDG, but low accumulation of 2-NBDG is difficult to differentiate from the background intensity. Figures 4, 5, and 6 demonstrate cell bodies of neurons with high 2-NBDG phosphorylation, whereas the background surrounding the cell bodies may appear to have no fluorescence, although it should have low intensity. Thus differences in resolution and quantitative information between 2-[14C]deoxyglucose method and 2-NBDG method may have resulted in apparent discrepancy in the obtained images.
It is generally believed that neuronal cell bodies have much lower rates of glucose utilization compared with the dendritic region. Because phosphorylated deoxyglucose should diffuse through cytosol of neurons, it is not surprising that cell bodies as well as dendrites are visualized with 2-NBDG method. It is because of the limitation in spatial resolution that 2-[14C]deoxyglucose method can detect glucose utilization in neither single neurons nor cell bodies in vivo. The resolution of the original method is approximately 200 μm, which does not allow for analysis of the cellular localization of the isotope (Sokoloff et al., 1983). To improve spatial resolution of the 2-[14C]deoxyglucose method, Hökfelt and colleagues (1983) modified the original technique, using [3H]2-deoxyglucose, gluing the sections at −20°C, and applying emulsion with the loop technique. The images obtained with [3H]2-deoxyglucose are in good agreement with those in the present study. They reported that in the hippocampus the cell body layers (pyramidal and granular layers) had high radioactivity with the majority of radioactivity located over cell bodies, whereas the fiber layers exhibited weaker activity. In their study, labeled cells were also observed in layers 2–6 in the cortex. It should be stressed that the highest densities of activity in the gray matter were seen over the cell bodies rather than neuropil in their report as well as in the present study, whereas the conventional 2-deoxyglucose autoradiographs show higher grain density over apparent neuropil, such as the stratum lacunosum moleculare of the hippocampus. Unlike the present study, Hökfelt and colleagues (1983) did not identify the cell types with high [3H]2-deoxyglucose accumulation in any brain regions.
Neuropil surrounding the cell bodies in Fig. 5A did not show high accumulation of 2-NBDG. This finding, however, does not exclude the possibility that dendrites of neurons or processes of astrocytes contained phosphorylated 2-NBDG. On the contrary, in vitro results of the present study demonstrated that phosphorylated 2-NBDG distributes throughout cytoplasm (Figs. 1 and 2). The processes in the neuropil may not be dense enough to show 2-NBDG accumulation on this image.
Cerebrospinal fluid as well as interstitial fluid of the brain physiologically contains glucose of approximately half of the concentration found in the blood. Because no known barrier exists between cerebrospinal fluid and interstitial fluid in the brain, 2-NBDG administered in the cistern can diffuse to interstitial fluid surrounding the neurons. The present study demonstrated that phosphorylated 2-NBDG accumulated at least in some types of neurons, indicating that these neurons took up and phosphorylated glucose in the interstitial fluid. In other words, 2-NBDG was used to trace neuronal glucose uptake from the interstitial fluid and its phosphorylation. Because intracisternal administration of 2-NBDG circumvents astroglia surrounding the brain capillaries, the obtained results provide no information on supply of glucose in the interstitial fluid. The glucose in the interstitial fluid, however, should physiologically be derived from the blood, because neither astroglia nor neurons can produce glucose from any substrates to release into extracellular space (Gotoh et al., 2000). Based upon this widely accepted idea and the present results, it is suggested that neurons utilize glucose supplied from the blood. There remains a possibility that additional glucose may be supplied from the blood through astroglia to neurons without being transferred into interstitial fluid.
6-NBDG, an analogue of 2-NBDG, has been previously used to assess glucose transport in the brain in vivo (Shimada et al., 1994). Because they were concerned that diffusion of 6-NBDG after brain sectioning might blur the fluorescence images, these investigators used a freeze-dry method. In the present study, we thaw-dried the sections very rapidly and found that there was minimal blurring of images, which was at least insufficient to interfere with identification of the cells with high 2-NBDG phosphorylation.
The present study clearly demonstrated that neurons, at least pyramidal neurons in the hippocampus and Purkinje cells in the cerebellum, take up and utilize glucose as an energy substrate. Other neurons in the cerebral cortex and cerebellum as well as astroglia were suggested to utilize glucose, but definite evidence was not obtained in the present study. Additional studies are required to determine the contribution of glucose metabolism to overall energy production compared with lactate utilization in neurons in general.
Footnotes
Acknowledgments:
The authors thank Dr. Louis Sokoloff (NIMH, NIH, U.S.A.) for his critical review of the manuscript and helpful suggestions.