
Abstract
Subarachnoid hemorrhage (SAH) is a devastating form of stroke. Approximately one in four patients develop progressive neurological deterioration and silent infarction referred to as delayed cerebral ischemia (DCI). DCI is a complex, multifactorial secondary brain injury pattern and its pathogenesis is not fully understood. We aimed to study the relationship between cerebral blood flow (CBF) and neuronal activity at both the cortex and in scalp using electroencephalography (EEG) in poor-grade SAH patients undergoing multimodality intracranial neuromonitoring. Twenty patients were included, of whom half had DCI median 4.7 days (interquartile range (IQR): 4.0–5.6) from SAH bleed. The rate of decline in regional cerebral blood flow (rCBF) was significant in both those with and without DCI and occurred between days 4 and 7 post-SAH. The scalp EEG alpha-delta ratio declined early in those with DCI. In the group without DCI, CBF and cortical EEG alpha-delta ratio were correlated (r = 0.53; p < 0.01) and in the group without DCI, inverse neurovascular coupling was observed at CPP < 80 mmHg. We found preliminary evidence that as patients enter the period of highest risk for the development of DCI, the absence of neurovascular coupling may act as a possible pathomechanism in the development of ischemia following SAH.
Keywords
Introduction
Subarachnoid hemorrhage (SAH) is a devastating form of stroke that affects 30,000 individuals in the US each year. 1 Between 3–12 days following the initial hemorrhage, 2 approximately one in every four patients will experience delayed neurological deterioration or silent brain infarction 3 ; on follow-up CT scans, ischemic lesions may be seen in closer to half. 4 Collectively referred to as “delayed cerebral ischemia” (DCI), 5 the development of ischemia or neurological dysfunction after SAH plays a pivotal role in the cognitive, social, emotional, and functional morbidity of survivors. 6
Traditionally thought to be associated with large-vessel vasospasm, DCI is better understood as a complex, multifactorial injury pattern that begins at the point of aneurysmal rupture. Clinicians have begun to recognize that large-vessel vasospasm is a late contributor, and merely the tip of the iceberg in terms of the pathophysiologic changes associated with the post-SAH syndrome. 7 Patchy, microvascular perfusion deficits are thought to create regions of ischemic injury8–11 leading some to suggest that continuous monitoring, including regional cerebral blood flow (rCBF) monitoring, might be an option to detect the development of DCI in select patients. 12 In contrast to blood flow and perfusion imaging techniques, the development of a thermal-diffusion rCBF catheter has made continuous blood flow measurements at bedside possible. While non-invasive near-infrared technology is able to measure continuous cerebral oxygenation, thermal-diffusion rCBF remains the only blood flow monitor that has been correlated directly with xenon-gas computed tomography. 13
Electroencephalography (EEG) has been employed in comatose SAH patients to detect critical changes in brain perfusion, much as in intraoperative monitoring for brain ischemia during vascular surgery. 14 The EEG records post-synaptic potentials generated by the cortex, where neurons are extremely sensitive to ischemia. Slower, delta (1–4 Hz) EEG frequencies are generated by the thalamus and by cells in layers II–VI of the cortex while faster alpha (8–12 Hz) frequencies are generated in layers IV–V. 15 During carotid surgery, decreases in hemispheric blood flow are reflected initially in the loss of faster alpha frequencies followed by the emergence of delta frequencies, finally resulting in the cessation of synaptic activity, or flattening of the EEG.14,16 Studies using EEG to predict DCI have been small,17–20 and an increasing knowledge about neurovascular coupling,21,22 autoregulation, 23 and the post-SAH syndrome 7 have complicated our understanding of this relationship between blood flow and neuronal activity. We studied continuous bedside measures of blood flow and the aggregated neuronal activity reflected in the quantitative EEG signals recorded from both the scalp and directly from the cortex in patients with poor-grade SAH undergoing intracranial neuromonitoring in order to test the hypothesis that development of DCI would be associated with a measureable breakdown of neurovascular coupling.
Materials and methods
Study population
We studied all patients with rCBF monitoring from a cohort of adults (>18 years of age) with aneurysmal SAH with invasive multimodality brain monitoring placed during their admission to the Neurological ICU at New York-Presbyterian’s Columbia University Medical Center between June 2006 and March 2012.24,25 Patients were clinically eligible for monitoring based on our institution’s protocol if they were comatose, defined as a Glasgow Coma Scale (GCS) of ≤ 8, and were both unlikely to regain consciousness within 48 h and had a high probability of surviving for at least 48 h. All data were collected as part of an ongoing, prospective observational study approved by the Columbia University Medical Center Institutional Review Board, according to institutional ethical standards for human research and the principles of the Declaration of Helsinki. In all cases, written informed consent was obtained from either the patient or a legally authorized representative.
Data collection and multimodality monitoring
All clinical data including demographic information and hospital course were collected as part of a prospective observational study of SAH outcomes. 26 DCI was defined as neurological deterioration not due to another cause (such as elevated intracranial pressure or bolus sedation administration) or the presence of ischemia on imaging not related to initial SAH or neurosurgery. Neurological deterioration was defined as any documented new neurological deficit or any decline in the hourly GCS denoted by a decrease in the total GCS from baseline of two or more points lasting for two or more consecutive measurements. Each period of neurological deterioration was assessed for cause and verified via chart review as being related to sedation, intracranial pressure, DCI, subtle clinical change without clear precipitant, or not specified.
Invasive multimodality brain monitoring devices were placed as previously described in detail. 25 Briefly, all monitors were placed at bedside in the ICU using cranial bolts installed via two burr holes as soon as possible following the securing of the aneurysm, usually within 48 h of the bleed. An eight-contact Spencer depth electrode (dEEG; ADTech, Racine, WI) for recording intracranial EEG activity was placed together with the rCBF catheter (ml/100 g/min; Bowman Perfusion Monitor/Hemedex, Cambridge, MA) within the same cranial access site. The Bowman Hemedex thermal-diffusion blood flow monitor sits approximately 3 mm within the brain, usually within the subcortical white matter, sampling rCBF within a region <0.3 ml. 3 Scalp continuous EEG (cEEG) was obtained via a 21-electrode array placed according to the International 10–20 System by certified EEG technologists and recorded using XLTek AC-coupled amplifiers sampled at 200 Hz (Natus Medical Incorporated, Pleasanton, CA). cEEG was post-processed using Persyst Insight (qEEG; Version P11; Persyst, Prescott, AZ). Values obtained included (a) the ratio of the alpha to delta power frequency spectra (ADR), (b) the asymmetry index (ASI), and (c) the alpha variability (AVR) of the relative alpha frequency power band 20 from scalp EEG across the hemisphere containing the depth electrode and (d) the ADR from the depth electrode. See Supplementary Methods for details regarding data collection and qEEG calculation.
Physiologic data preparation and statistical analysis
For all clinical variables, univariate analysis was performed using Fisher’s exact test or Wilcoxon test as appropriate. For physiologic data, univariate analysis was initially performed using Student’s t-test and Cohen’s d statistic (R package “effsize” 27 ). A “large” effect size was considered to be >0.8. 28 EEG variables were correlated with rCBF using Pearson’s correlation coefficient. P-values for univariate statistics were considered significant at the 0.01 level; all estimates were Bonferroni corrected. Scatterplots were generated using R package “hexbin.” 29
As DCI typically evolves over hours to days, minute-by-minute physiologic values were down-sampled to hourly averages. The time course of rCBF is non-linear and therefore we used a generalized additive model with thin plate smoothing regression splines (R package “mgcv” 30 ). The first derivative of the model was then plotted using the method of finite differences 31 with areas of significant changes over time defined at α = 0.01. Based on the results of this analysis, subsequent generalized additive models were created to explain the time course of each physiologic variable. Summed difference contours and regression lines were generated to explore the interaction terms between each physiologic variable and rCBF. Significance for all difference regression line was set at 95% confidence intervals (R package “itsadug” 32 ). All statistical calculations were performed using R, Version 3.1.1. 33 Detailed information regarding physiologic data preparation and statistical analysis are provided in Supplementary Methods and Supplemental Figures 1–3.
Results
Patient characteristics and monitoring data
From June 2006 to March 2012, a total of 493 aneurysmal SAH patients were admitted to the neurological ICU. Of these, 385 did not meet eligibility criteria for invasive multimodality brain monitoring (317 had GCS >8, 33 were predicted to die, 19 were predicted to regain consciousness, and 16 had severe coagulopathy). Of the 108 SAH patients who were eligible, 5 patients did not receive invasive multimodality brain monitoring based on the decision of the surrogate decision maker. Of 103 who underwent invasive multimodality brain monitoring, 21 had rCBF monitoring. One patient with rCBF monitoring did not undergo cEEG monitoring, and was excluded from this analysis.
Demographics and clinical information.
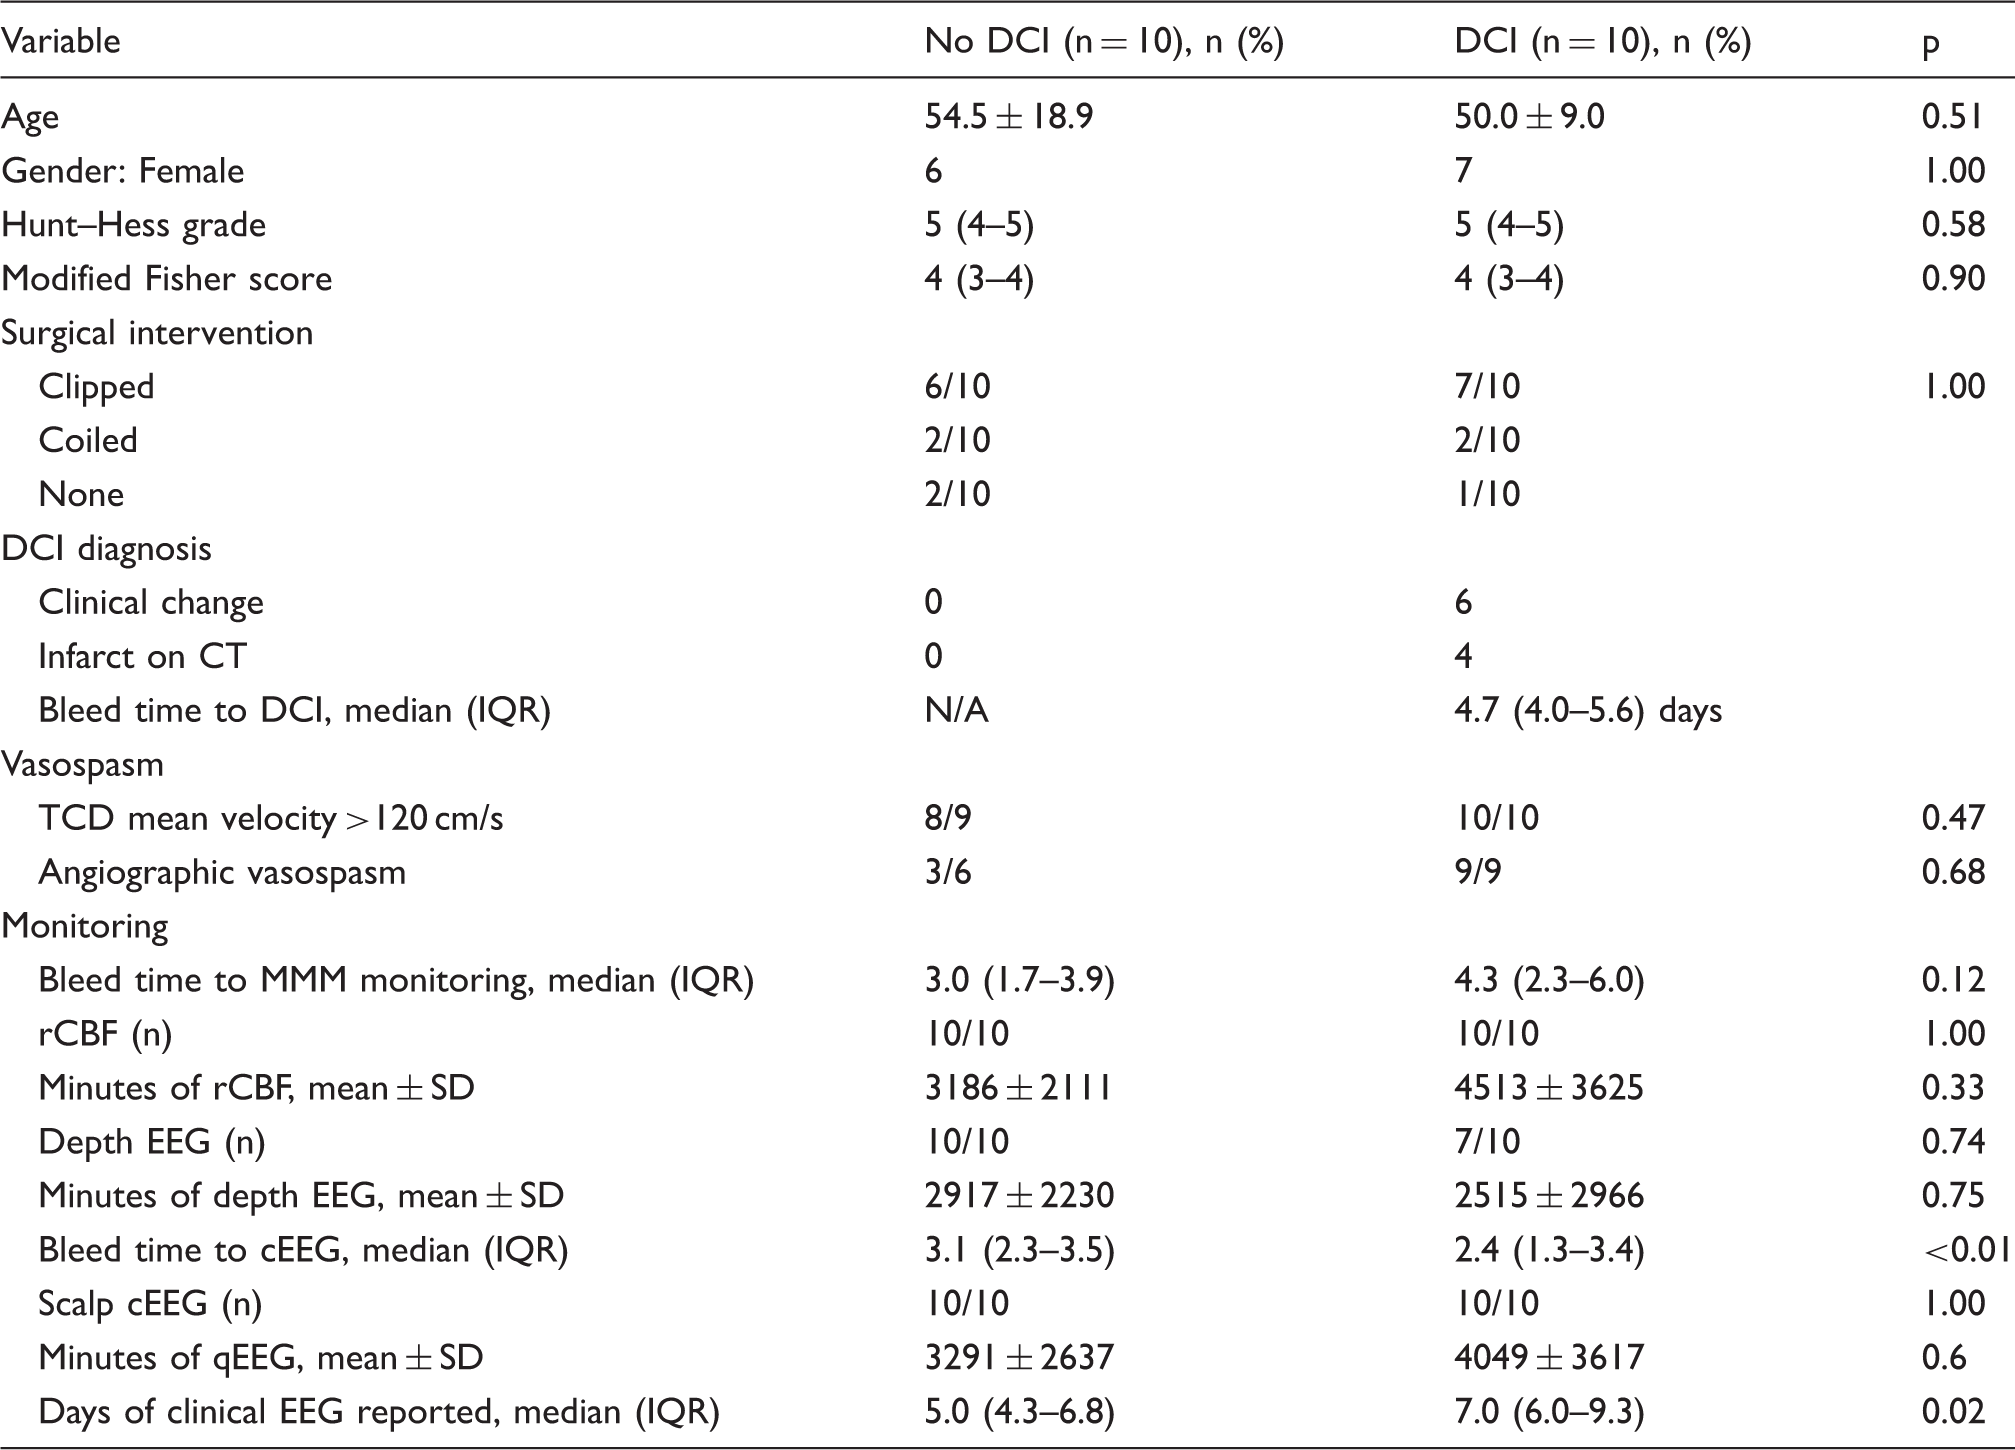
CT: computed tomography; DCI: delayed cerebral ischemia; cEEG: continuous electroencephalography; qEEG: quantitative electroencephalography; IQR: interquartile range; MMM: multimodality monitoring; rCBF: regional cerebral blood flow.
Patient clinical information.
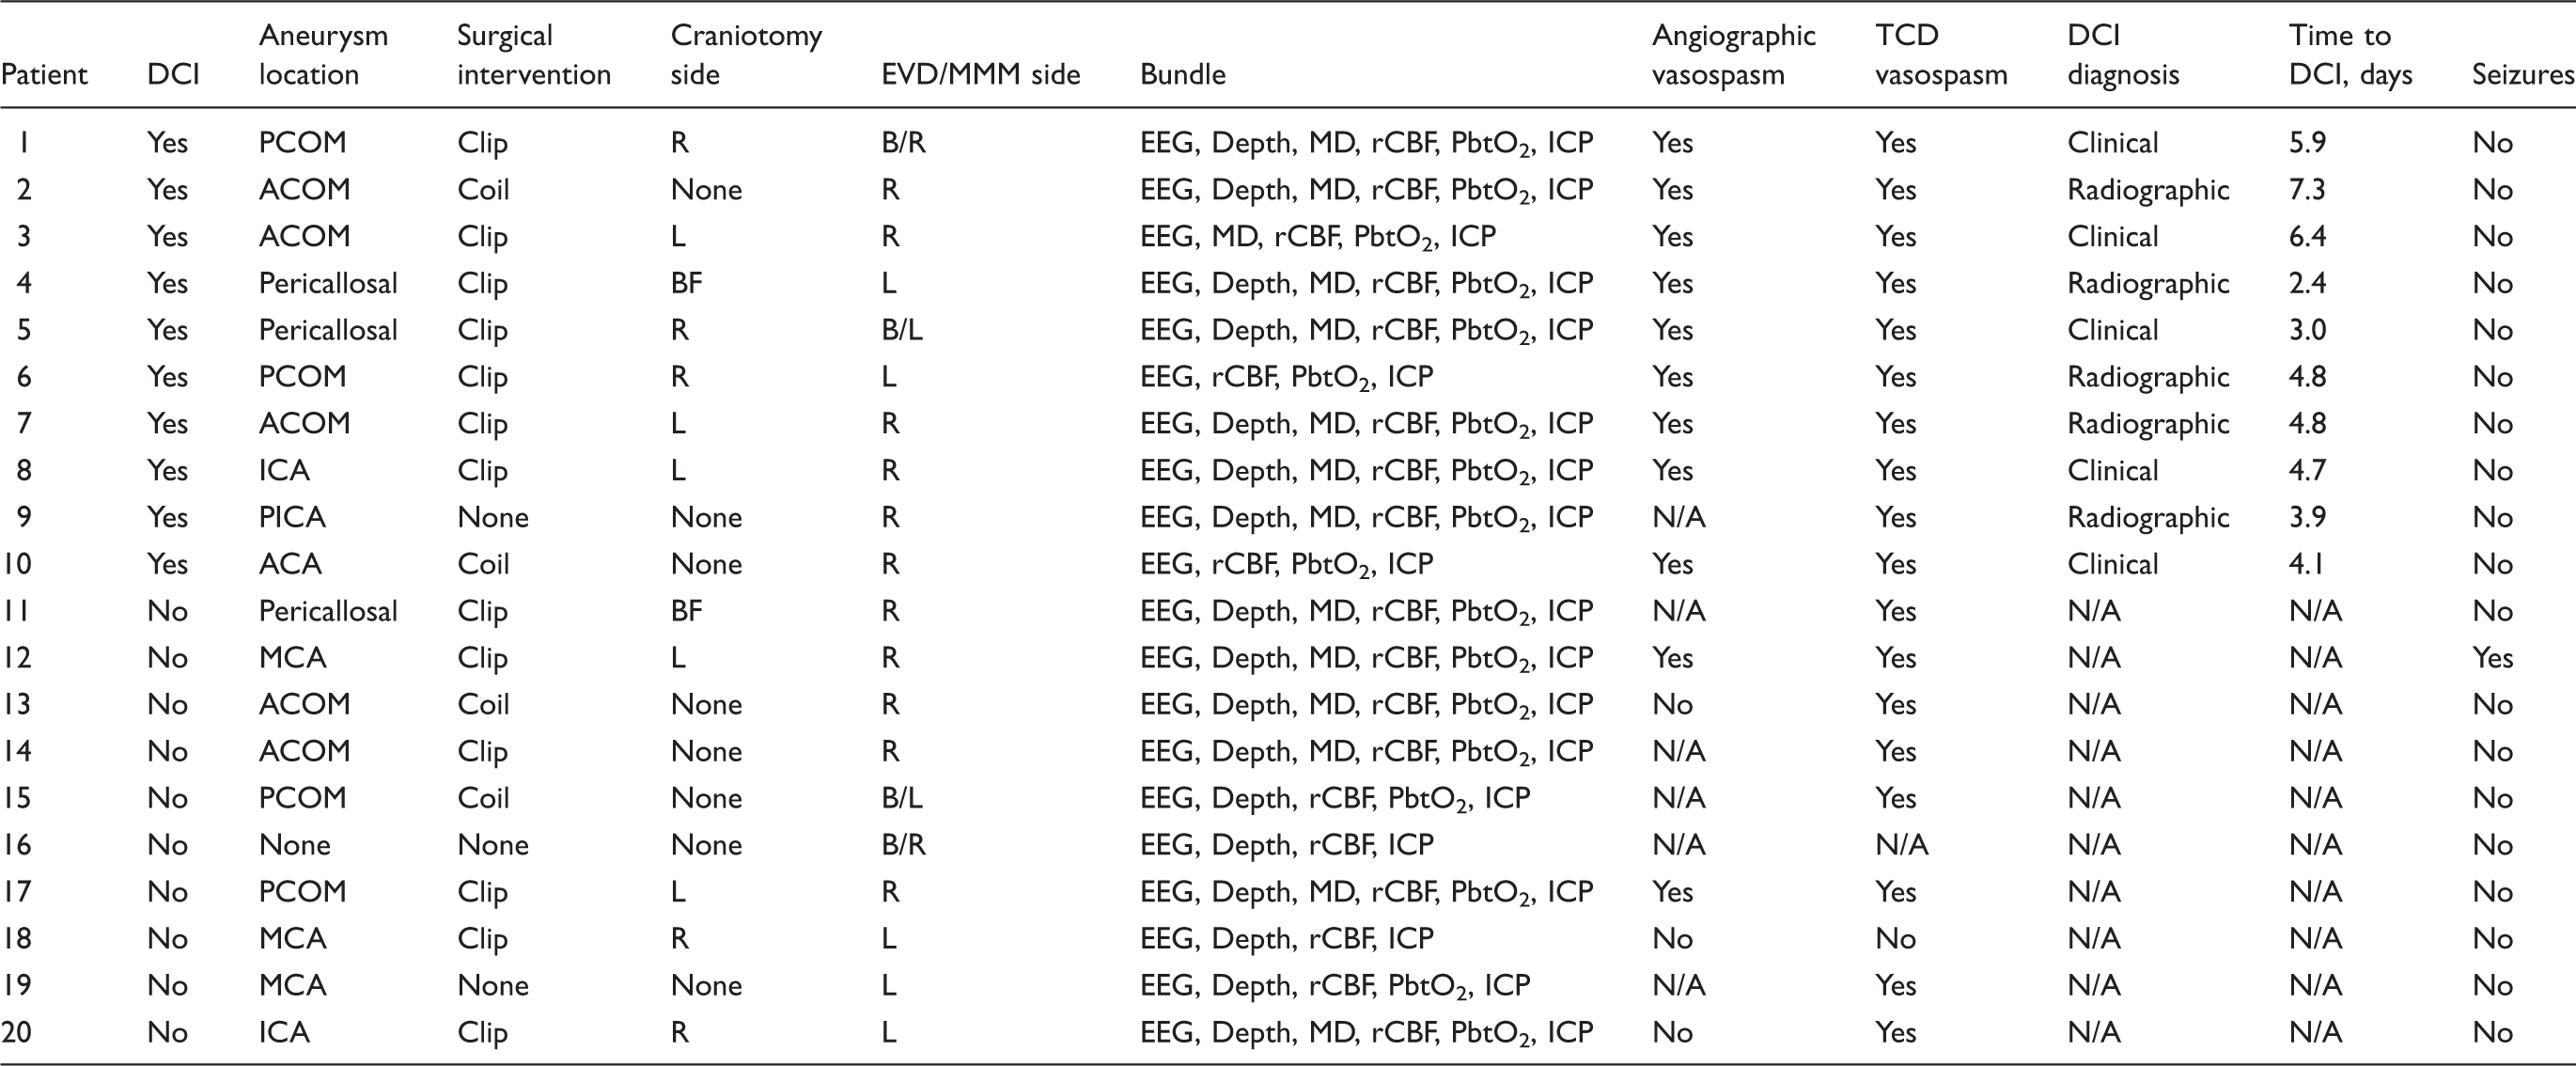
ACA: anterior cerebral artery; ACOM: anterior communicating artery; B: bilateral; BF: bifrontal; DCI: delayed cerebral ischemia; EVD: external ventricular drainage; ICA: internal carotid artery; ICP: intracranial pressure; L: left; MCA: middle cerebral artery; MD: microdialysis; MMM: multimodality monitoring; PbtO2: partial pressure of brain tissue oxygen; PCOM: posterior communicating artery; PICA: posterior inferior cerebellar artery; R: right; rCBF: regional cerebral blood flow; TCD: transcranial dopplers.
Time course of rCBF
The rate of decline in rCBF was significant in both the patients with a clinical diagnosis of DCI and those without a clinical diagnosis of DCI between days 4–7 post-SAH (Figure 1). Prior to day 4 post-SAH, the mean rCBF was lower in those without DCI compared to those with DCI (13.51 ± 14.51 ml/100 g/min vs. 31.78 ± 24.52 ml/100 g/min, p < 0.01, d = −0.98). However, after modeling rCBF over time, the only difference between groups was the timepoint at which the rCBF began to decline (F = 5.16, edf = 8.95, p < 0.01). During this period of time, the mean ICP in patients with and without DCI exhibited statistically small differences (10.9 ± 6.8 mmHg vs. 11.2 ± 7.1 mmHg; p < 0.01 and d = 0.04); the mean CPP was higher in those who developed DCI during this same period (94.7 ± 19.8 mmHg vs. 86.1 ± 17.2 mmHg; p < 0.01 and d = 0.5). CPP, but not ICP, was related to rCBF after controlling for the time-course of both (F = 3.26, edf = 19.04, p < 0.01).
Regional cerebral blood flow declines in both patients with and without delayed cerebral ischemia. (a) Box plot of rCBF (ml/100 g/min) between groups from days 2 and 10 following subarachnoid hemorrhage. Asterisks denote significant between-group differences. (b) Plot of the generalized additive model of the time course of z-normalized rCBF overall (both patients with and without DCI). The areas of red highlight regions in which the slope of the change in the rCBF, as calculated by the first-order derivative of the time-course, is decreased significantly at the α = 0.01 level. The blue highlights regions of significant increase. (c) Plot of the time course of z-normalized rCBF with regions of significant increases or decreases highlighted for patients without DCI and (d) with DCI. Note both groups exhibit a similar region of significant rCBF decline after day 4. rCBF: regional cerebral blood flow; DCI: delayed cerebral ischemia.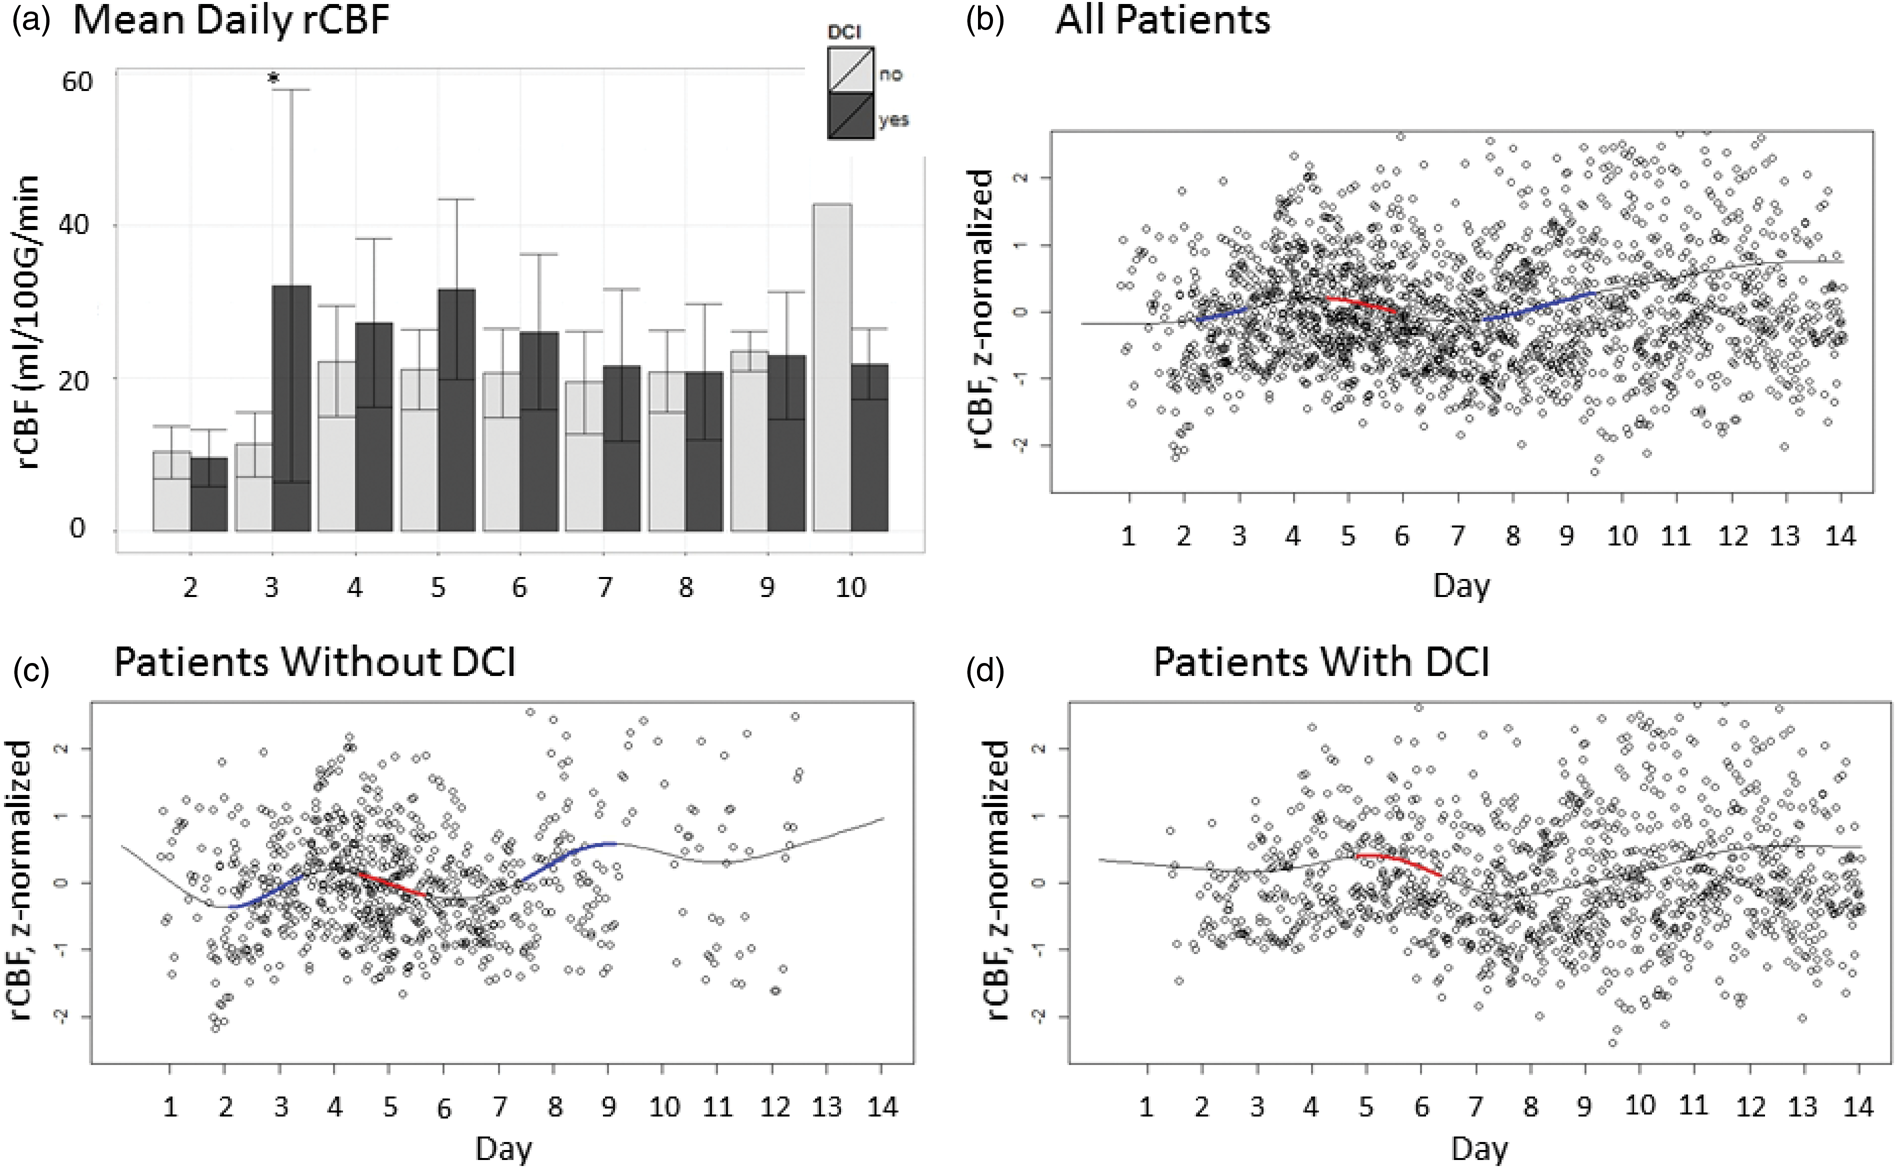
rCBF and scalp EEG: ADR
The mean ADR from the scalp electrodes (sADR) was lower in those with DCI compared to those without DCI in the period prior to day 4 post-SAH (0.25 ± 0.11 vs. 0.41 ± 0.20; p < 0.01, d = 0.97). The sADR decreased significantly between days 2–3 post-SAH in the group with DCI compared to those without DCI (F = 8.48, edf = 9.00, p < 0.01); scalp EEG data were limited prior to day 3 post-SAH in the group without DCI. The sADR and rCBF were significantly correlated on day 3 post-SAH (Figure 2) in both the patients with DCI and those without DCI (r = 0.42, CI 0.22–0.58, p < 0.01 and r = 0.56, CI 0.51–0.59, p < 0.01, respectively).
Early correlation between scalp alpha-delta ratio and regional cerebral blood flow. (a) Box plot of scalp alpha-delta ratio (sADR) between groups from days 2 and 10 following subarachnoid hemorrhage. Asterisks denote significant between-group differences. (b) Scatterplot of the relationship between rCBF (ml/100 g/min) and z-normalized sADR on post-bleed day 3 following subarachnoid hemorrhage. (c) Plot of the generalized additive model of the time course of the z-normalized sADR in patients without DCI and (d) with DCI. In those with DCI, the region highlighted in red represents a period in which the slope of change in the time course if significant at the α = 0.01 level. These figures suggest an early rCBF-dependent decline in the sADR, particularly in the group with DCI. sADR: scalp alpha-delta ratio; rCBF: regional cerebral blood flow.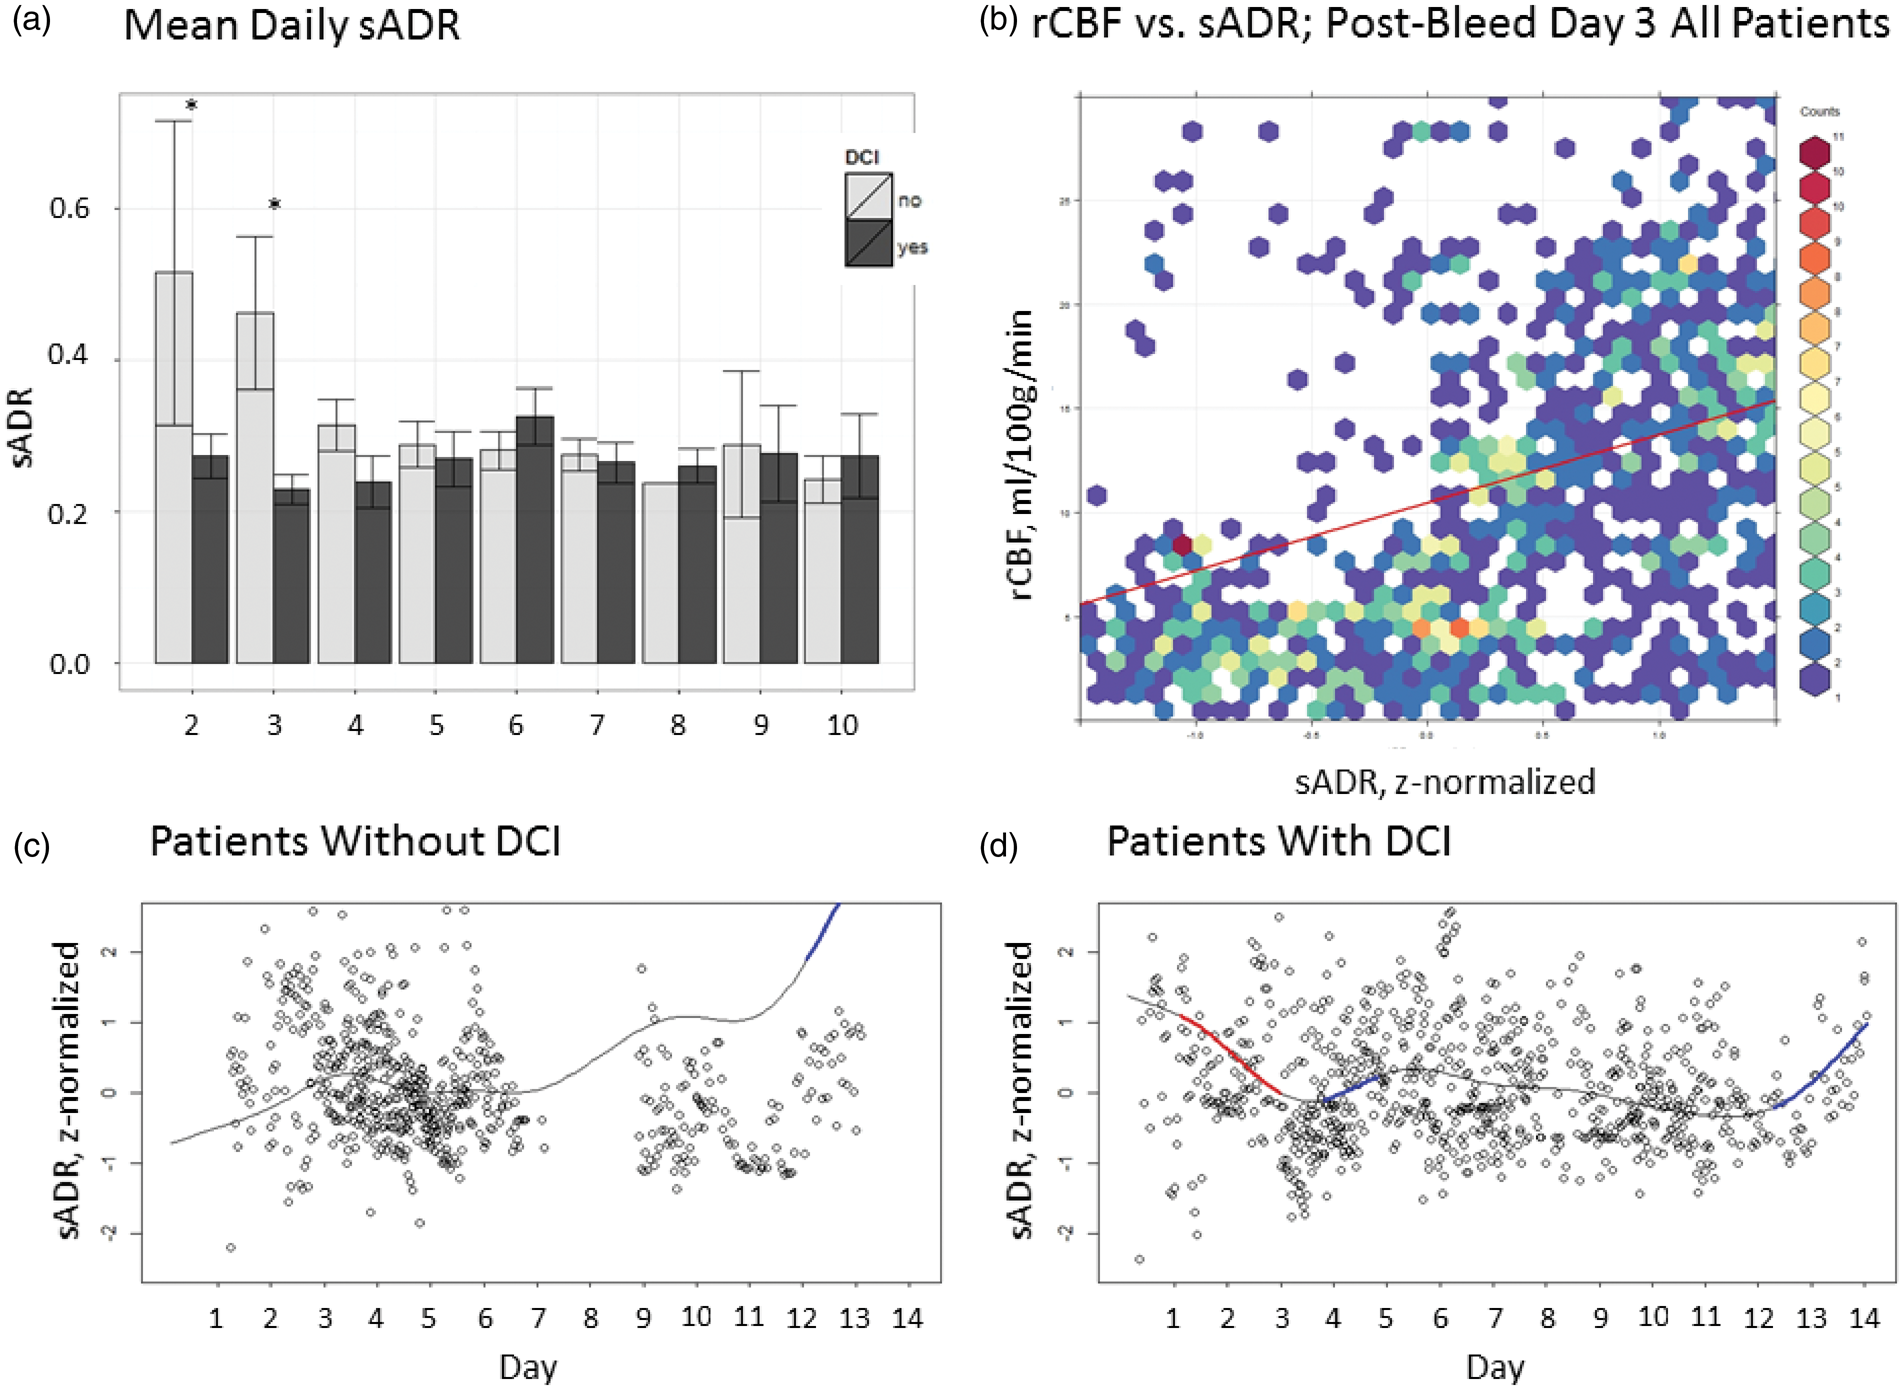
rCBF and scalp EEG: ASI
The mean ASI varied significantly over time between those with and those without DCI (F = 17.64, edf = 8.58, p < 0.01). In DCI patients, ASI increased until day 4 post-SAH; the ASI was higher in those with DCI on day 4 post-SAH (33.94% ± 5.65% vs. 28.08% ± 5.58%; p < 0.01, d = −1.04). In the group without DCI, a significant increase in the ASI was seen between days 3–6 post-SAH, and both groups had similar ASI values at their peak on day 6 post-SAH: 36.07% ± 10.70%. In time-based model, there was a significant interaction between rCBF and ASI (F = 0.62, edf = 3.724, p < 0.01) with lower asymmetry at higher CBF measurements overall (Supplemental Figure 4).
rCBF and scalp EEG: AVR
The AVR was lower between days 4–7 post-SAH in the group without DCI compared to those with DCI (0.32 ± 0.15 vs. 0.45 ± 0.17; p < 0.01, d = −0.81). In those without DCI, the time-course suggested a significant rate of decline in AVR between days 3–5 post-SAH (F = 3.127, edf = 7.10, p < 0.01). However, after day 7 post-SAH, the AVR was lower in the group with DCI compared to those without DCI (0.41 ± 0.15 vs. 0.56 ± 0.18; p < 0.01, d = 0.89; Supplemental Figure 5). In those with DCI, the AVR correlated significantly with rCBF on post-bleed day 3 (r = 0.78, CI 0.69–0.85, p < 0.01), but time-based modeling did not confirm an interaction between the two terms (F = 2.66, edf = 3.04, p = 0.54 for the cohort, p = 0.05 between groups).
rCBF and EEG: Depth electrocorticography
Prior to day 4 post-SAH, the mean ADR from the depth electrode (dADR) was lower in those without DCI compared to those with DCI (4.36 ± 2.55 vs. 7.51 ± 3.12; p < 0.01, d = −1.15). In those without DCI, the dADR rose significantly between days 3–5 post-SAH compared to those with DCI (F = 11.71, edf = 7.67, p < 0.01). In the time-based model, dADR and rCBF were not significantly related across the cohort (F = 2.44, edf = 21.54, p = 0.73); instead, there was a significant difference in the interaction between dADR and rCBF between groups (p < 0.01). In those without DCI, dADR and rCBF were significantly correlated between days 4–7 post-SAH (r = 0.53, CI 0.51–0.54, p < 0.01; Figure 3), peaking on day 4 post-SAH. In contrast, in those with DCI, dADR and rCBF were inversely correlated between days 5–7 post-SAH, with nadir on day 6 post-SAH (r = −0.53, CI – (0.56–0.49), p < 0.01).
Delayed coupling of electrocorticography and regional cerebral blood flow. (a) Scatterplot of the relationship between regional cerebral blood flow (rCBF; ml/100 g/min) and z-normalized depth electrode alpha-delta ratio (dADR) from days 4 to 7 following subarachnoid hemorrhage. In the group with DCI (top), no clear correlation is visualized. In the group without DCI (bottom), there is a correlation between increasing rCBF and increasing dADR (r = 0.50, p < 0.01). (b) Plot of the generalized additive model of the time course of the z-normalized dADR. In those with DCI, there is a brief decrease in the dADR (highlighted in red) just prior to an increase (highlighted in blue) starting on day 5. In contrast, (c) shows the same plot in those without DCI demonstrating an increase in the dADR between days 3–5. (d) In the modeled difference regression line between groups, the interaction between the z-normalized rCBF and dADR is depicted as decreasing during this period, suggesting there is a significant interaction that develops, distinguishing patients without DCI compared to those with DCI peaking on day 4. DCI: delayed cerebral ischemia; dADR: depth electrocorticography alpha-delta ratio; rCBF: regional cerebral blood flow.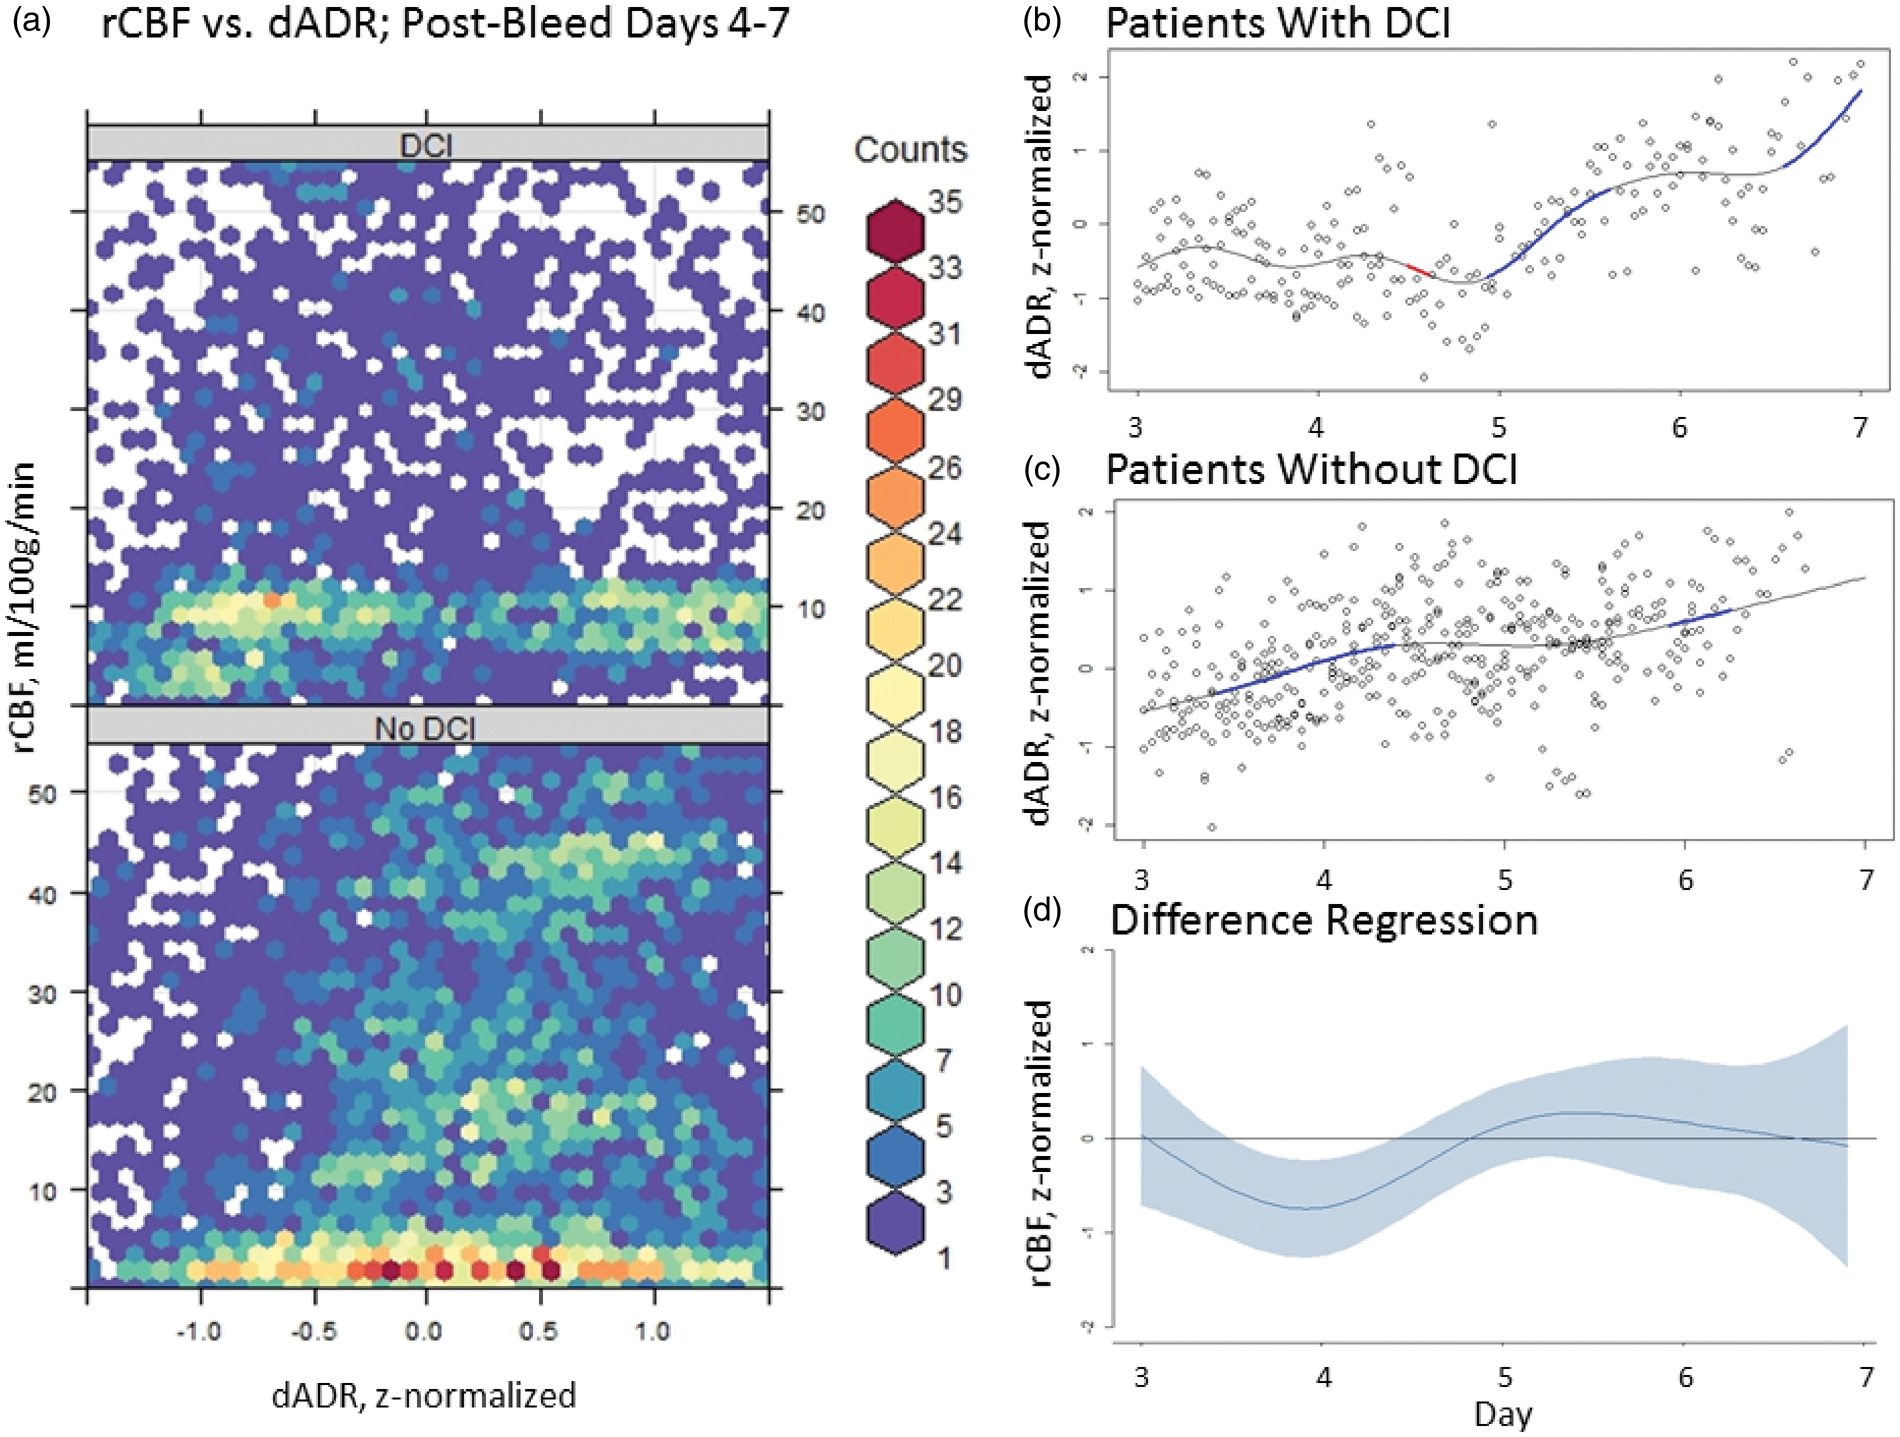
A moving average correlation coefficient incorporating rCBF and dADR, the dADRx, was significantly different between those with DCI and those without (−0.04 ± 0.29 vs. 0.01 ± 0.26, respectively; p = 0.02). When the dADRx was plotted according to cerebral perfusion pressure (CPP), those with DCI exhibited a significant inverse coupling at CPP < 80 mmHg (indicated by a negative correlation coefficient; −0.25 ± 0.30 in those with DCI vs. −0.01 ± 0.26 in those without DCI; p = 0.03). Because of the effect of perfusion pressure on this coupling, pressure reactivity was evaluated using a modified pressure reactivity index (LAx). Although there were no significant differences in either group (−0.04 ± 0.34 in those with DCI vs. 0.05 ± 0.37 in those without DCI; p = 0.06), a typical U-shaped CPP curve was apparent, suggesting an optimal CPP range, only in those without DCI (Supplemental Figure 6).
Discussion
In this study of poor-grade aneurysmal SAH patients, we found evidence that the rCBF declines significantly between days 4–7 post-SAH in both those with and those without a clinical diagnosis of DCI. Our definition of DCI included both clinical deterioration and silent infarction 34 and half in our series developed DCI, likely a result of a highly selected, high-risk population. Confirming prior studies,17,20,35,36 we found that scalp EEG demonstrated an early (prior to day 4 post-SAH), blood-flow dependent decline in the alpha-delta frequency power ratio that was particularly noted in those with DCI. Interestingly, we found that as patients entered the period during which clinical or radiographic evidence of ischemia occurred, those without DCI demonstrated rCBF-coupled regional EEG activity suggestive of preserved neurovascular coupling, which was not present for patients with DCI. These findings implicate the absence of neurovascular coupling as a possible pathomechanism in the development of ischemia following SAH.
rCBF has been measured by PET, Xe-CT, and CTP after SAH.10,13,37–43 We used thermal-diffusion rCBF, which provides a continuous, bedside measure of rCBF, and that has been previously compared to Xe-CT in 14 patients with World Federation of Neurosurgical Societies (WFNS) 3–5 SAH. rCBF measurements within the gray matter had a higher normal range (40–50 ml/100 g/min) compared to white matter (18–25 ml/100 g/min), yet measurements within each tissue correlated well, r = 0.57 (p < 0.01). 13 We found that the rCBF declined significantly in both groups between days 4–6 post-SAH after accounting for individual patient differences in slope and baseline rCBF using a generalized additive model.
A decline in rCBF in patients both with and without DCI has been demonstrated in both thermal-diffusion rCBF and CTP studies after SAH.13,41 In one study of 42 patients, 18 had DCI. The rCBF was noted to be significantly lower only on day 3 prior to the onset of DCI (rCBF 26.3 ml/100 g/min in those with DCI vs. 39.1 in those without, p = 0.02); otherwise the time-course was similar in both groups. In 14 patients undergoing thermal-diffusion rCBF monitoring, the rCBF across patients peaked on day 3 post-SAH at 23 ± 2 ml/100 g/min and then declined in both groups between days 4–9 post-SAH to a nadir of 13.1 ml/100 g/min. Specifically in those without symptomatic large-vessel vasospasm, the rCBF declined to 17 ± 2 ml/100 g/min.
These reductions in rCBF across patients with SAH then likely represent patchy, diffuse processes at the distal arterioles as neither ischemia nor reduced rCBF appear to correspond reliably to the presence or location of large-vessel vasospasm.10,11,37,44 A reduction in rCBF may accompany worsening pre-capillary shunting, as the slowed transit times facilitate increased oxygen extraction. 8 Mean transit times on CTP have been noted to be significantly longer in those with DCI at the time of clinical deterioration compared to those without DCI, although increases in mean transit time paralleled reciprocal decreases in rCBF across all patients. 41 Decreases in rCBF may also be seen as a result of autoregulatory failure in the setting of declining perfusion pressures that result from upstream microvascular spasm and occlusion, constituting a double hit that has been associated with DCI.23,45 Importantly, computational autoregulatory indices such as the PRx may not be reliable in the setting of distal vasospasm associated with autoregulatory failure.46,47 We found that optimum CPP was partially preserved in those without DCI, but did not find an absolute difference in the index of pressure reactivity between groups.
Flow-metabolism coupling is a crucial component in understanding the relationship between EEG with cerebral blood flow (CBF). 48 The neurovascular unit depends on adequate blood flow, intact pressure autoregulation, and close coupling between substrate delivery and metabolic need. 49 Neurovascular coupling is regulated at the pre-capillary smooth muscle cell, thus flow within a 150 µm radius of brain tissue may be affected during normal functional hyperemia. 22 Following SAH, neurovascular coupling breaks down by day 2 post-SAH. 21 Luxury perfusion may abolish the neurovascular response and following focal ischemia, EEG and rCBF may be tied simply to mean hemispheric blood flow. 50 This may explain why early after SAH, we found both that the rCBF was higher in those who developed DCI, and that the sADR corresponded grossly with rCBF across all patients. Prior studies have suggested that sADR declines prior to the onset of DCI. In our study, the sADR declined prior to day 4 post-SAH in the patients who developed DCI at a median of 4.7 days.
Conversely, we found that the dADR correlated with rCBF between days 4–7 post-SAH. Lower initial dADR in those without DCI may have represented metabolic suppression, either iatrogenic or in the context of decreased flow post-SAH, as seen after other forms of diffuse brain injury (e.g. traumatic brain injury 51 ). Metabolic suppression in the setting of normal neurovascular coupling may allow oligemia without relative ischemia, with CBF as low as 8–10 ml/100 g/min reported in one study comparing volatile anesthetics in patients undergoing carotid surgery. 52 The correspondence of cortical activity and subcortical rCBF between days 4–7 post-SAH might be expected for a large region of functionally connected neurovascular units, which could result from capillary shunting. 8 In those with DCI, we found that the dADR was inversely correlated with rCBF between days 5–7 post-SAH, and that this relationship was augmented by lower CPP. This could be reflect a loss of distal arteriolar autoregulatory capacity, as autoregulatory dysfunction peaks between days 5–6.45,46 The emergence of spreading depolarizations (SDs) also peak on day 7 post-SAH, often with an inverse neurovascular response that may be closely linked with dysfunctional autoregulation.53,54 In those with severe SAH at risk for DCI, an inverse coupling response as indicated by a negative moving average correlation coefficient of dADR and rCBF represents a failure of distal autoregulation and therefore loss of normal neurovascular coupling, which would be expected to lead to metabolic crisis and ischemia.
This study is limited in its conclusions based on a small sample size of highly selected and severe SAH patients requiring invasive brain monitoring within a small region of frontal subcortical white matter. Despite this selection bias, we used time-resolute quantitative data generated from the same region within the brain and from electrodes over the same hemisphere. Physiologic data were post-processed, and while noise and artifacts occur regularly in the ICU environment, attempts were made to remove artifacts both visually and computationally. Only raw values were used without imputation because of the significant irregularity in the intervals and quantity of missing data. The time from bleed onset to monitoring varied substantially, which may have impacted detection of changes related to DCI. These factors reduced statistical power and limited analytic techniques such as analysis-of-variance or generalized estimating equations, but provided an analysis of aggregated data consistent with what is generated in the clinical setting, factoring in patient-specific baseline and slope. We used a sampling frequency of 1/60 Hz for both rCBF and quantitative EEG in order to capture time-resolute changes in blood flow, but faster relationships between raw EEG and rCBF may have been obscured. Hourly averages were used to create the generalized additive model, potentially attenuating trend fluctuations over the course of minutes. Finally, the diagnosis of DCI is often subject to issues of inter-rater agreement. The diagnosis for this cohort was made based on adjudication, but DCI that was not documented prior to death or indistinguishable from extensive early injury patterns related to ictus or surgery remain possible confounders. We did not include outcome or post-hospitalization follow-up in part because of the small sample size and high morbidity and mortality associated with poor-grade SAH. Our aim was to explore neurophysiologic relationships that may be evaluated specifically for clinical importance on larger datasets in the future.
To conclude, this study provides preliminary evidence that the distinction between those who develop DCI and those who do not may rest on the ability of the cortex to adapt its neuronal activity to its available blood supply and vice versa. We found that in poor-grade SAH patients, scalp EEG changes occur early and indicate global ischemic injury, and that while delayed ischemia occurs across patients, the clinical diagnosis of DCI occurs in those who develop inverse coupling of their neuronal activity with local rCBF. Further study is needed to understand the flow-metabolism dynamics of this abnormal neurovascular phenomenon, and to develop robust approaches to detect dysfunctional coupling at the individual patient level.
Footnotes
Funding
The author(s) disclosed receipt of the following financial support for the research, authorship, and/or publication of this article: Dr. Albers reports funding through the NIH National Library of Medicine (RO1LM06910); Brandon Foreman receives funding from the Mayfield Education and Research Foundation and consultant fees from SAGE Therapeutics.
Acknowledgements
We thank the nurses, attending physicians, fellows, neurology and neurosurgery residents of the Neuroscience Intensive Care Unit for their overall support for this project.
Declaration of conflicting interests
The author(s) declared no potential conflicts of interest with respect to the research, authorship, and/or publication of this article.
Authors’ contributions
Brandon Foreman: Acquisition of data, analysis and interpretation of data, manuscript draft; David Albers: Analysis and interpretation of data, manuscript review; J Michael Schmidt: Acquisition of data, manuscript review; Cristina Maria Falo: Acquisition of data, manuscript review; Angela Velasquez: Acquisition of data; E Sander Connolly: Acquisition of data, manuscript review; Jan Claassen: Study conception and design, acquisition of data, manuscript review with critical revisions.
References
Supplementary Material
Please find the following supplemental material available below.
For Open Access articles published under a Creative Commons License, all supplemental material carries the same license as the article it is associated with.
For non-Open Access articles published, all supplemental material carries a non-exclusive license, and permission requests for re-use of supplemental material or any part of supplemental material shall be sent directly to the copyright owner as specified in the copyright notice associated with the article.