
Abstract
White matter (WM) disintegration is common in the older population and is associated with vascular cognitive impairment (VCI). This study explored the effects of environmental enrichment (EE) on pathological sequelae in a mouse model of chronic cerebral hypoperfusion induced by bilateral common carotid artery stenosis (BCAS). Male C57BL/6 J mice underwent BCAS or sham surgery. One-week after surgery, mice were exposed to three different degrees of EE; either standard housing conditions (std), limited 3 h exposure to EE per day (3 h) or full-time exposure to EE (full) for 12 weeks. At 13 weeks after surgery, cognitive testing was performed using a three-dimensional 9-arm radial maze. At 16 weeks after surgery, nesting ability was assessed in each mouse immediately before euthanasia. Brains retrieved after perfusion fixation were examined for WM pathology. BCAS caused WM changes, as demonstrated by corpus callosum atrophy and greater WM disintegrity. BCAS also caused impaired nesting ability and cognitive function. These pathological changes and working memory deficits were attenuated, more so by limited rather than full-time exposure to EE regime. Our results suggest that limited exposure to EE delays the onset of WM degeneration. Therefore, the implementation of even limited EE may be beneficial for patients diagnosed with VCI.
Keywords
Introduction
There is currently no cure for vascular dementia (VaD), which is the second most common type of dementia diagnosed amongst the elderly population. 1 Safe and effective interventional strategies, which delay the onset or slow down the progression of cognitive decline, are urgently required. Subcortical ischaemic vascular dementia (SIVD), the most prevalent subtype of VaD, is a common feature of vascular cognitive impairment (VCI).2,3 SIVD is characterised by lacunar infarcts and white matter (WM) lesions 4 and is responsible for VCI in the ageing population. 5 Chronic cerebral hypoperfusion, a major component of SIVD and diffuse WM changes caused by small-vessel disease (SVD), is strongly correlated to VCI and depression, as well as gait disturbance as evident in SIVD patients.6,7 However, little is known about the neuropathological processes that lead to the progression of VCI in SIVD patients. To understand the biological mechanisms that occur in the progression of SVD, animal models of chronic cerebral hypoperfusion have been developed in rats8–12 and gerbils. 13 Our research group has been working at the forefront to establish several novel rodent models of VCI or VaD by assessing the effects of reduced brain perfusion on the dynamics of the cerebral circulation and brain tissue changes.14–19 Remarkably, the bilateral carotid artery stenosis (BCAS) mouse model has been evaluated as one of the most germane rodent models of VaD.20–23
Environmental enrichment (EE) has been suggested as a strategy to improve cognitive impairment in humans and possibly to reverse WM and neuronal damage. There is some evidence to show that physical and cognitive stimulations, which are incorporated in EE and physical exercise training, could enhance synaptic plasticity and attenuate cognitive deficits in rodents24–27 and humans. 28 These studies reported that EE increased brain plasticity, enhanced neurogenesis, and increased synaptogenesis as well as preserved motor and cognitive function. Although several previous studies reported the beneficial effects of EE in rodents and humans, few studies explored the protective effects of differing degrees of EE in VaD. Here, we investigated the effects of different degrees of EE on the pathological sequelae in mice subjected to BCAS, with the aim of assessing the morphology of the WM and cognitive dysfunction as it relates to VCI and VaD. 4
Material and methods
Animals and surgical procedures
Male C57BL/6 J mice (nine weeks old, 23.1 − 25.3 g) were purchased from the Jackson Laboratory, USA. The mice were housed in group cages with a 12 h day and 12 h night cycle (6 am–6 pm, day; 6 pm–6 am, night) and were given access to food and water ad libitum. After one-week acclimatisation, a total of 74 mice were randomly selected for either bilateral common carotid artery stenosis (BCAS, n = 41) or sham (n = 33) surgery. BCAS surgery was performed as described previously. 14 Briefly, mice were anaesthetised by 1.5% isoflurane in oxygen and air. Middle neck incision was made, bilateral common carotid arteries (CCAs) were exposed and isolated from the vagus nerves. Microcoils of inner diameter of 0.18 mm (Sawane Spring, Japan) were applied to the both CCAs. Sham animals were exposed to the same operative procedures as BCAS mice, except for the application of microcoils. Body temperature was monitored and maintained between 36.5℃ and 37.5℃ with the aid of a feedback warming pad and a blanket during the operative procedure. Animals were appropriately identified with coded numbers. All the experiments including behavioural test and data analyses in this study were performed under investigator-blinded conditions. Animals dying during the experimental period before the planned euthanasia at 16 weeks after surgery were excluded from further analyses, other than assessment of survival rate.
All procedures were pre-approved by the Home Office, Secretary of the State, London, UK based upon ASPA: The Animals (Scientific Procedures) Act 1986, UK and performed in accordance with the guidelines stipulated by the ethical committee of Newcastle University and adhering to ARRIVE guidelines. Figure 1 outlines the entire experimental protocol.
Experimental protocol and animal groups. (a) Experimental protocol and (b) six different subgroups of mice in this study.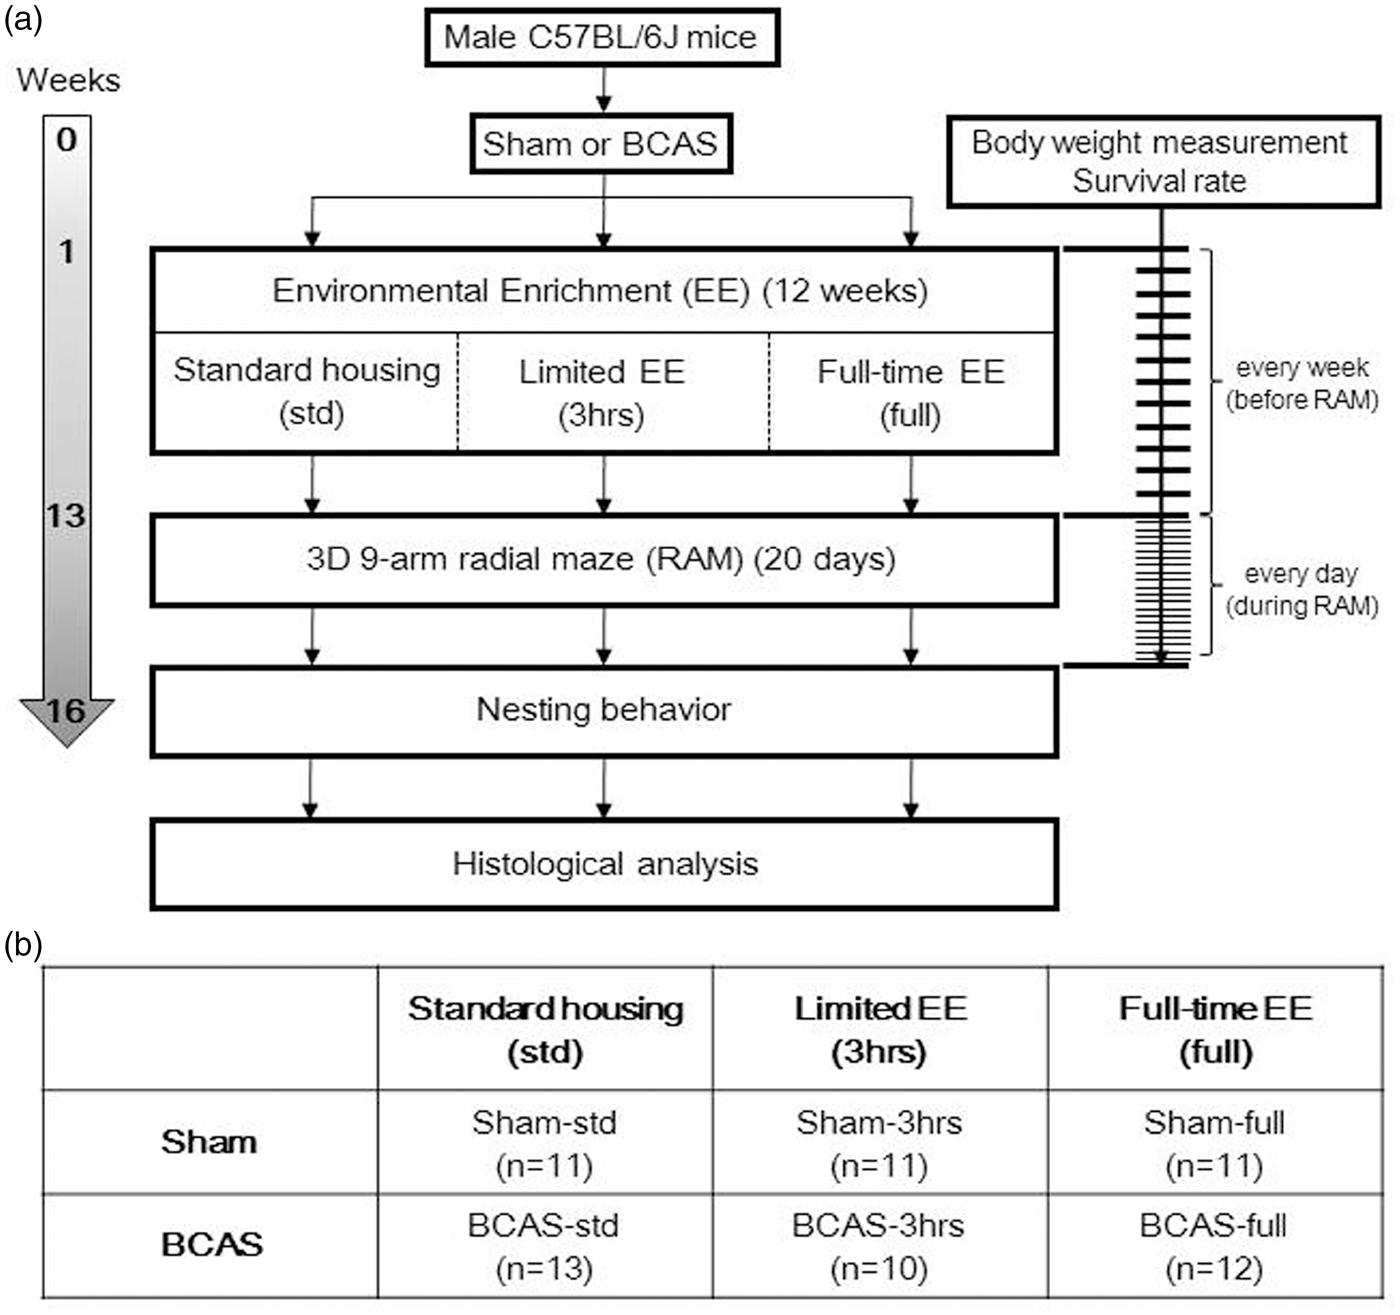
Measurement of body weight and analysis of survival rate
Body weight (BW) of each mouse was determined before surgery and followed up to three times a week as necessary for a period of 12 weeks and prior to cognitive testing (Supplementary Figure 1(a) and (b)). During the cognitive testing period, BW was assessed daily in order to monitor the consistency in weight. Survival rates were determined until 16 weeks after surgery and before euthanasia. These results were expressed as Kaplan–Meier survival curves (Supplementary Figure 1(c) and (d)).
EE paradigm and animal groups
Animals were initially divided into two main groups, sham and BCAS (Figure 1(b)). One week after the surgery, mice were randomly assigned to six subgroups, three per group: three different EE conditions per main group for 12 weeks either standard housing, limited exposure to EE or full-time exposure to EE. Standard housing denotes a normal housing condition with no EE and it incorporated a paper house and shredded tissue. EE cages had extra toys in addition to the standard housing, e.g. running wheels, hanging chains, igloos and a paper tunnel. Limited exposure to EE was performed as described previously. 29 Briefly, for the first four weeks, mice were transferred to the EE cages for 3 h every day in the morning from 9 am to noon. From the fifth week to the 12th week, mice were placed in EE cages for 3 h, 3 days a week. Full-time EE group was exposed to EE every day for 24 h over the entire 12 weeks. Thus, altogether six experimental groups were compared: Sham-std, sham-operated mice with standard housing; Sham-3 h, sham mice with limited exposure to EE: Sham-full, sham-operated mice with full-time exposure to EE; BCAS-std, BCAS-operated mice with standard housing; BCAS-3 h, BCAS-operated mice with limited exposure to EE; BCAS-full, BCAS-operated mice with full-time exposure to EE.
Cognitive testing using an innovative three-dimensional 9-arm radial maze
Cognitive function (mainly working memory) was assessed in each mouse from 13 weeks post BCAS surgery during a period of 20 days, using a novel three-dimensional (3D) 9-arm radial maze (3D-RAM). 30 This was a modified version of the conventional 8-arm radial maze. Behavioural tests were performed in a dimly lit behavioural testing room. The 3D maze (Grey PVC, 5 mm thick) consisted of nine arms connected to bridges (slope part) radiating from a central platform. Each arm (35 cm× 11.2 cm) was attached to a bridge (slope part at 40 degrees, 15.2 cm× 11.2 cm). The surface of the bridge was made of metal mesh, which enabled the mice to maintain grip. A small transparent wall panel (9 cm× 6 cm) was randomly placed at each entrance of a bridge in order to narrow entry, which avoids a continuous sequential entry from one bridge to the next. In order to enter each arm, mice placed in the centre platform and needed to cross a bridge (elevated ramp). 30 At the end of each arm, a small pellet (Dustless Precision Pellets® Rodent, Purified, Bio Serv, USA) was placed in order to entice food-restricted mice to enter the arm. Different colours/shapes of pictures were placed vertically at the end of each arm as visual cues, enabling the mice to distinguish individual arms. The maze was placed at the centre of a behavioural test room affixed during the entire testing period. All of the sessions for each mouse were streamed and recorded using a camcorder (LEGRIA HF R56, Canon), suspended directly over the maze, via a Wi-Fi network to an iPad (Apple Inc., USA), which was sited outside the behavioural test room.
A day before the first session, each mouse was weighed to ascertain BW, and food deprivation was induced to achieve 10% reduction in their BW. Mice were weighed immediately prior to each testing session to ensure their BW was maintained at 90% of baseline level. Mice were randomly tested for 20 consecutive days without prior habituation to the maze.31,32 Mice placed into a transparent plastic beaker (7 cm diameter, 18.5 cm height) were gently introduced on the central platform at the start of each session. The session was terminated when each mouse completed nine arm entries or when 10 min had elapsed. After each session, the mouse was allowed to return to the central platform before removing it from the maze in a similarly gentle manner. Between each session, the maze was cleaned with hypochlorous acid soaked tissue followed by distilled water to remove any traces smells left by urine or faeces.
The number of arm entries, number of arm repeats and number of arm entries before first repeat (NABFR) were recorded. The probability of each pair of “arm entries and arm repeats (top of each cell)” and “arm repeat score (bottom of each cell)” (Figure 7(a)) and probability of each “NABFR (top of each cell)” and “NABFR score (bottom of each cell)” (Figure 7(d)) were then calculated. Arm repeat scores for each pair were defined as the difference in percentage compared to the most probable pair. For example, the most probable arm repeats in nine arm entries can be 3, and its probability is calculated as 41.0%. Arm repeat score of this pair was set as zero (Figure 7(a)). The probability of 1 arm repeat in nine arm entries was theoretically 3.37%. Therefore, the arm repeat score of this pair was calculated as: 41.0 − 3.37 = 37.63%. However, the probability of 5 arm repeats in nine arm entries is 6.0%. In this case, the arm repeat score was calculated as a negative value: 6.0 − 41.0 = − 32.0%, as more than three arm repeats are counted as a negative score. NABFR scores were similarly calculated in the same manner as the arm repeat score. For example, the most probable NABFR is 3 and its probability was calculated as 23.05%. NABFR score of this was set as zero (Figure 7(d)). The probability of NABFR = 5 is theoretically 14.23%. Therefore, the NABFR score of this was calculated as: 23.05 − 14.23 = 8.82 %. On the other hand, the probability of NABFR = 1 is 11.11%. In this case, NABFR score was calculated as a negative value: 11.11 − 23.05 = − 11.93%, as less than 3 NABFR is counted as a negative score. The final scores represent the average of the scores from all sessions.
Nesting behaviour
The NESTLETS™ (Ancare, USA) test was used to assess the nesting ability of mice 33 before BCAS or sham surgery (as baseline) as well as 16 weeks after surgery before euthanasia. Briefly, one NESTLET, composed of a pressed square of cotton material (2 × 2 inches) was placed at one corner of each cage at 4 pm and left there overnight. First, mice shredded the tightly packed cotton material and then arranged it into a nest. Next morning at 10 am, each cage was assessed in terms of the appearance of the nest (NESTLET score), height of the nest (cm) and the percentage NESTLET used (%). Scoring was defined as follows 33 : (1) Nestlet not noticeably touched (more than 90% intact); (2) nestlet partially torn (50–90% remaining intact); (3) nestlet mostly shredded but often no identifiable nest site: less than 50% of the nestlet remains intact, but less than 90% is within a quarter of the cage floor area, i.e. the cotton is not gathered into a nest but is spread around the cage. The material may sometimes be in a broadly defined nest area, but the critical definition is that 50–90% is shredded; (4) an identifiable but flat nest: >90% of the nestlet is torn and the material is gathered into a nest within a quarter of the cage floor area, but the nest is flat, with walls higher than the average mouse BW for less than 50% of its circumference; (5) a (near) perfect nest: more than 90% of the nestlet is torn and the nest is a crater, with walls higher than the average mouse BW for >50% of its circumference.
Histopathological analysis
Mice were anaesthetised by intraperitoneal injection of sodium pentobarbital (50 mg/kg) and perfused transcardially at 20 ml/min with 0.01 M phosphate-buffered saline (PBS), pH 7.4. Brains were removed and divided into two hemispheres. The right or left hemisphere of each brain was randomly assigned for histological analysis and post fixed in 4% paraformaldehyde (PFA) in 0.01 M PBS (pH 7.4) for 48 h. Each hemisphere was cut into five blocks at different coronal levels after fixation: Block OB, coronal level of olfactory bulb (OB); Block 1, coronal level of bregma + 0.5 mm; Block 2, coronal level of bregma −1.0 mm; Block 3, coronal level of bregma − 2.0 mm; Block 4, level of cerebellum and brain stem. Each sub-dissected block was dehydrated and embedded in paraffin to produce 5-µm thick sections for histological staining and analysis.
Volume of the corpus callosum
Luxol-fast blue and cresyl fast violet (LFB + CFV): Klüver-Barrera (KB) stain was used to assess area and volume of the corpus callosum (CC). KB-stained sections obtained from Blocks 1, 2, and 3: coronal level of bregma + 0.5 mm, −1.0 mm and −2.0 mm, respectively, were used so that the whole CC from rostral to caudal segment was analysed. Images of the CC from paramedian to the lateral edge were captured using a bright field microscope (Leitz DIALUX 20, Leica) with a 5× objective lens coupled to a lumenera infinity digital camera (Lumenera Corporation, Canada). The entire CC was also traced using ImageJ software, and the area of CC (mm2) for each block was calculated. To assess the volume, we assumed that each CC area was of similar shape. The areas of the CC were defined as: CC area obtained from block 1 (bregma + 0.5 mm), S1 (mm2); from block 2 (bregma − 1.0 mm), S2 (mm2); from block 3 (bregma − 2.0 mm), S3 (mm2). The volume of the rostral and caudal side of CC were defined as: V1 (mm3), volume of the CC between block 1 and block 2 (distance = 1.5 mm); V2 (mm3), volume of the CC between block 2 and block 3 (distance = 1.0 mm). Using the following formula, each volume was calculated as follows: V1 (mm3) =
WM severity scores
WM severity score was assessed in KB-stained coronal sections obtained from blocks 1, 2, and 3. We analysed all the distinct regions of the WM including the CC, anterior commissure, hippocampal fimbria, internal capsule, optic nerve and optic tract. For analysis of the CC, the images were captured using a bright field microscope (Leitz DIALUX 20, Leica) with a 20 × objective lens coupled to a lumenera infinity digital camera (Lumenera Corporation, Canada). The severity of the WM pathology was graded as follows: Grade 0, normal; Grade 1, disarrangement of the nerve fibres; Grade 2, the formation of marked vacuoles; Grade 3, and the disappearance of myelinated fibres as described previously. 8
Oligodendrocytes
Haematoxylin-stained sections obtained from block 3, coronal level of bregma + 2.0 mm were used for the analysis of total number of oligodendrocytes in the CC. Oligodendrocytes were identified based upon its size and morphology: size of its nucleus around 6-µm, rounding shape with a dense-stained nucleus. 4 The whole CC from paramedian to lateral edge of each section was imaged and analysed. All oligodendrocytes within each image were counted to assess the total number of oligodendrocytes.
Statistical analysis
Data were expressed mean ± SEM. Using IBM SPSS statistics 22 software, non-paired t-test or one-way analysis of variance (ANOVA) followed by post-hoc Tukey’s test were performed for multiple comparison of each group. Mann-Whitney U test or Kruskal-Wallis H Test was performed for non-parametric analysis. Two-way repeated measures ANOVA was performed for assessment of BW change and behavioural data. Log-rank test was performed for Kaplan–Meier survival analysis. P < 0.05 was defined as statistically significant in all analyses.
Results
BW compared with sham animals after BCAS
Pre-operative BWs of each group were: Sham-std, 23.6 ± 0.3 g; Sham-3 h, 23.6 ± 0.5 g; Sham-full, 24.0 ±0.7 g; BCAS-std, 24.6 ± 0.3 g; BCAS-3 h, 24.4 ± 0.6 g; BCAS-full, 24.9 ± 0.4 g, respectively (P > 0.05). At one week after surgery, all BCAS groups had lost some BW compared with the pre-operative value and began to recover until 13 weeks post-operation. However, weight gain in all BCAS groups was slower compared with sham animals at each indicated time points (P < 0.01) (Supplementary Figure 1(a) and (b)), although the amount of food intake after surgery was not different between the sham and BCAS animals (data not shown). There were no significant differences in BW at any time point between sham and BCAS subgroups (Supplementary Figure 1(b)). However, limited exposure to EE (BCAS-3 h) tended to gain more BW compared to other BCAS subgroups, especially from seven weeks after surgery.
BCAS animals tended to survive less compared to sham animals
All sham-operated mice (n = 33) survived until 16 weeks after surgery (Supplementary Figure 1(c)). However, the survival rate of the BCAS mice was 85.4% (35 of original 41 mice) at 16 weeks after surgery (Kaplan–Meier survival analysis, log-rank P = 0.01) (Supplementary Figure 1(c)). The survival rates of the BCAS mice were as follows: BCAS-std 92.9% (13 of original 14), BCAS-3 h 91.0% (10 of 11); BCAS-full 75% (12 of 16) (Supplementary Figure 1(d)). There were no significant differences between BCAS groups by Kaplan–Meier survival analysis. However, BCAS-full showed the lowest survival rate during 16 weeks observation period post-surgery. The causes of death in the BCAS group were: cerebral haemorrhage (n = 1), severe enterocolitis (n = 1), kidney anomaly (n = 1), acute renal failure due to dehydration (n = 3). The final number of survivors in each group was Sham-std, n = 11; Sham-3 h, n = 11; Sham-full, n = 11; BCAS-std, n = 13, BCAS-3 h, n = 10; BCAS-full, n = 12 (Figure 1(b)).
Limited versus full-time exposure to EE and CC atrophy
The CC volume in each group was calculated to assess atrophy. Compared with all the sham animals (Figure 2(b) to (d)), BCAS-std and BCAS-full subgroups showed significantly smaller volumes of CC. This was apparent in the rostral as well as caudal segments and the total volume of the CC. The BCAS-3 h subgroup showed significantly larger volumes of CC compared with BCAS-std subgroups (*P < 0.05).
Volume of the corpus callosum (CC) (a) (A to F), LFB + CFV stained sections from block 3 (coronal level of bregma − 2.0 mm) in each group. a(A), sham-std; a (B), sham-3 h; a (C), sham-full; a (D), BCAS-std; a (E), BCAS-3 h; a (F), BCAS-full. Scale bar represents 200 µm. Arrows indicate the peripheral edge of the CC. (b to d), Histograms showing CC volume of different levels from rostral (b), caudal side (c) as well as total CC volume (d). All BCAS-std and BCAS-full subgroups showed smaller CC volume compared with all sham subgroups (P < 0.01) (b to d). BCAS-3 h showed larger total CC volume compared with BCAS-std (**P < 0.01) (c) (*P < 0.05) (d). Lack of differences were apparent between BCAS-std and BCAS-full (b to d) or between sham-std and BCAS-3 h (b to d). There were no differences between the sham subgroups (b to d).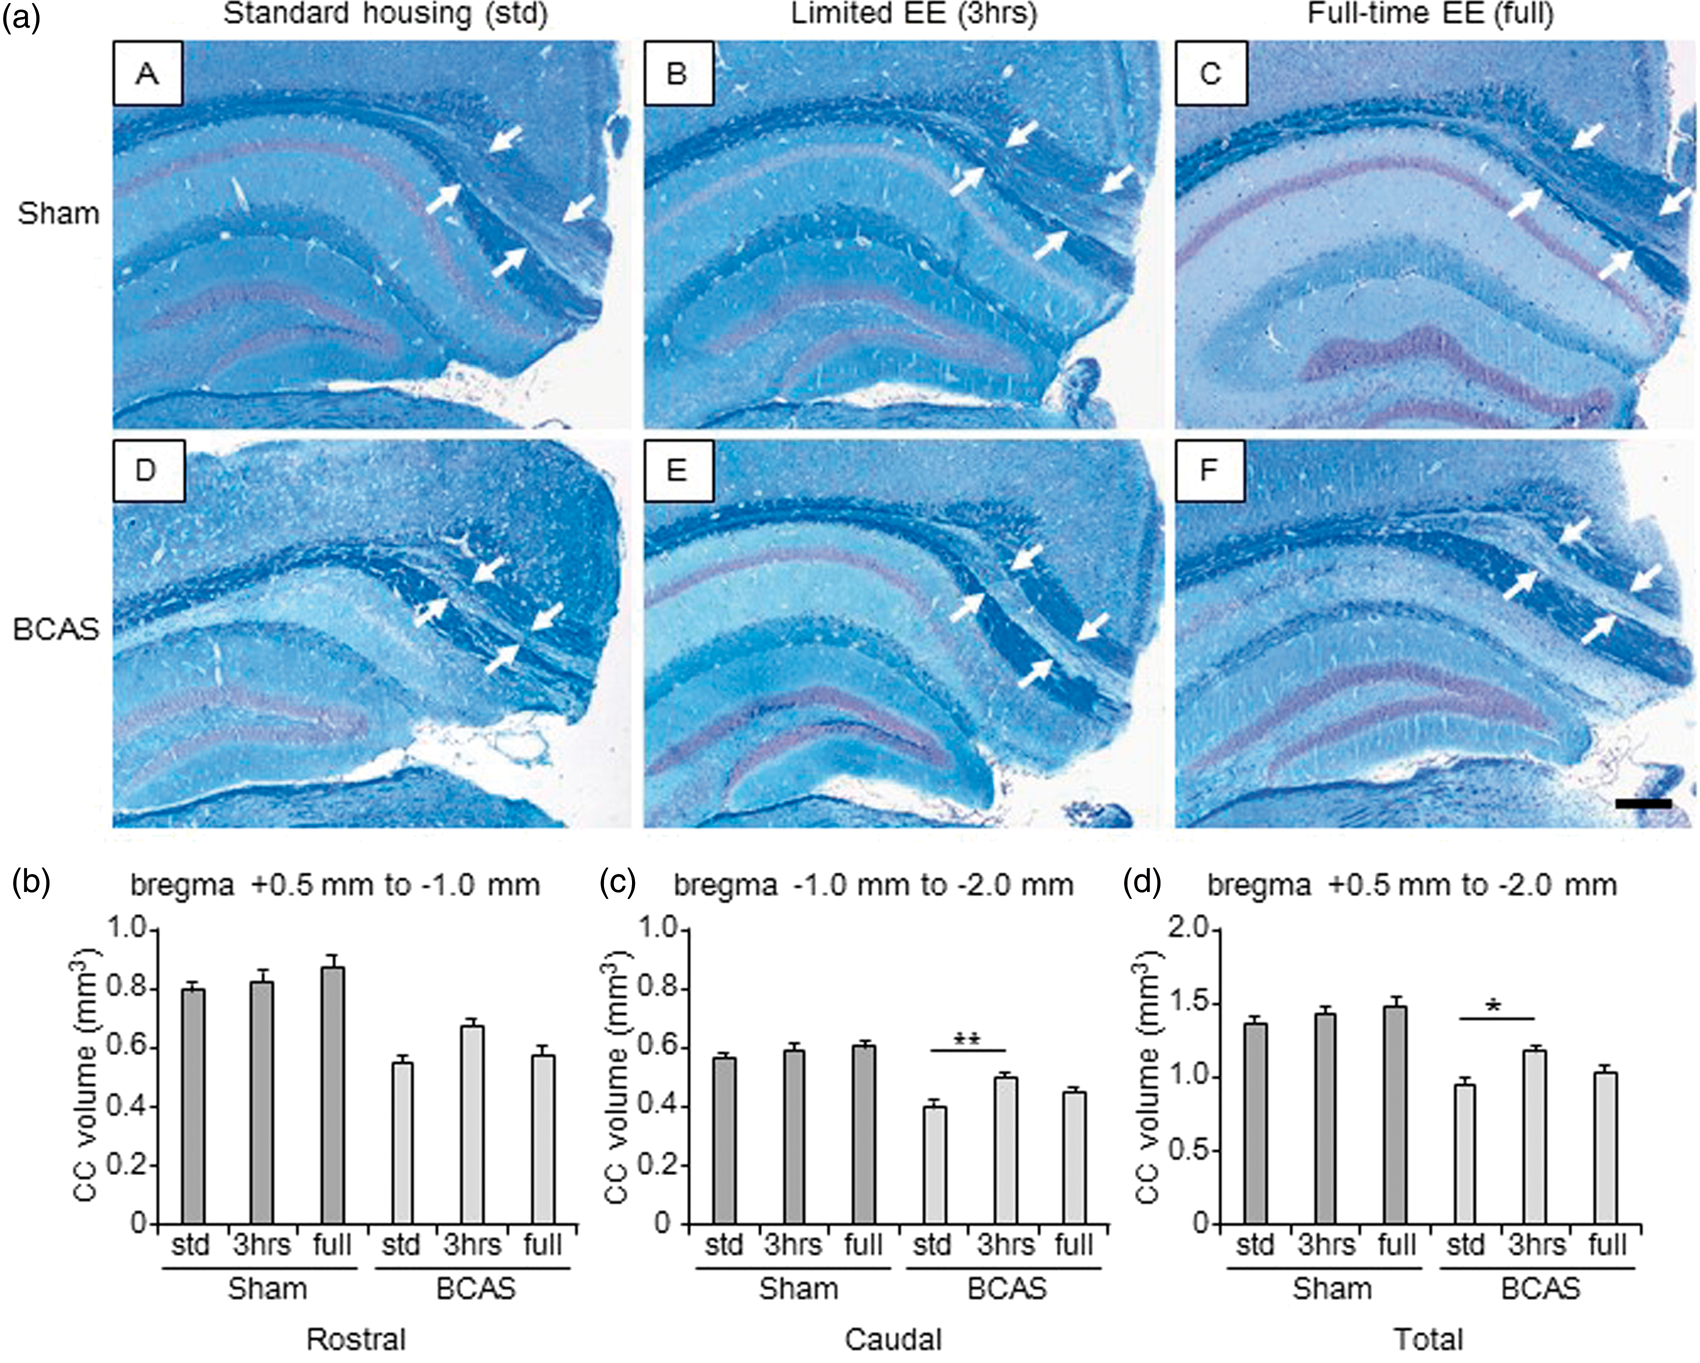
Limited versus full-time exposure to EE on WM integrity
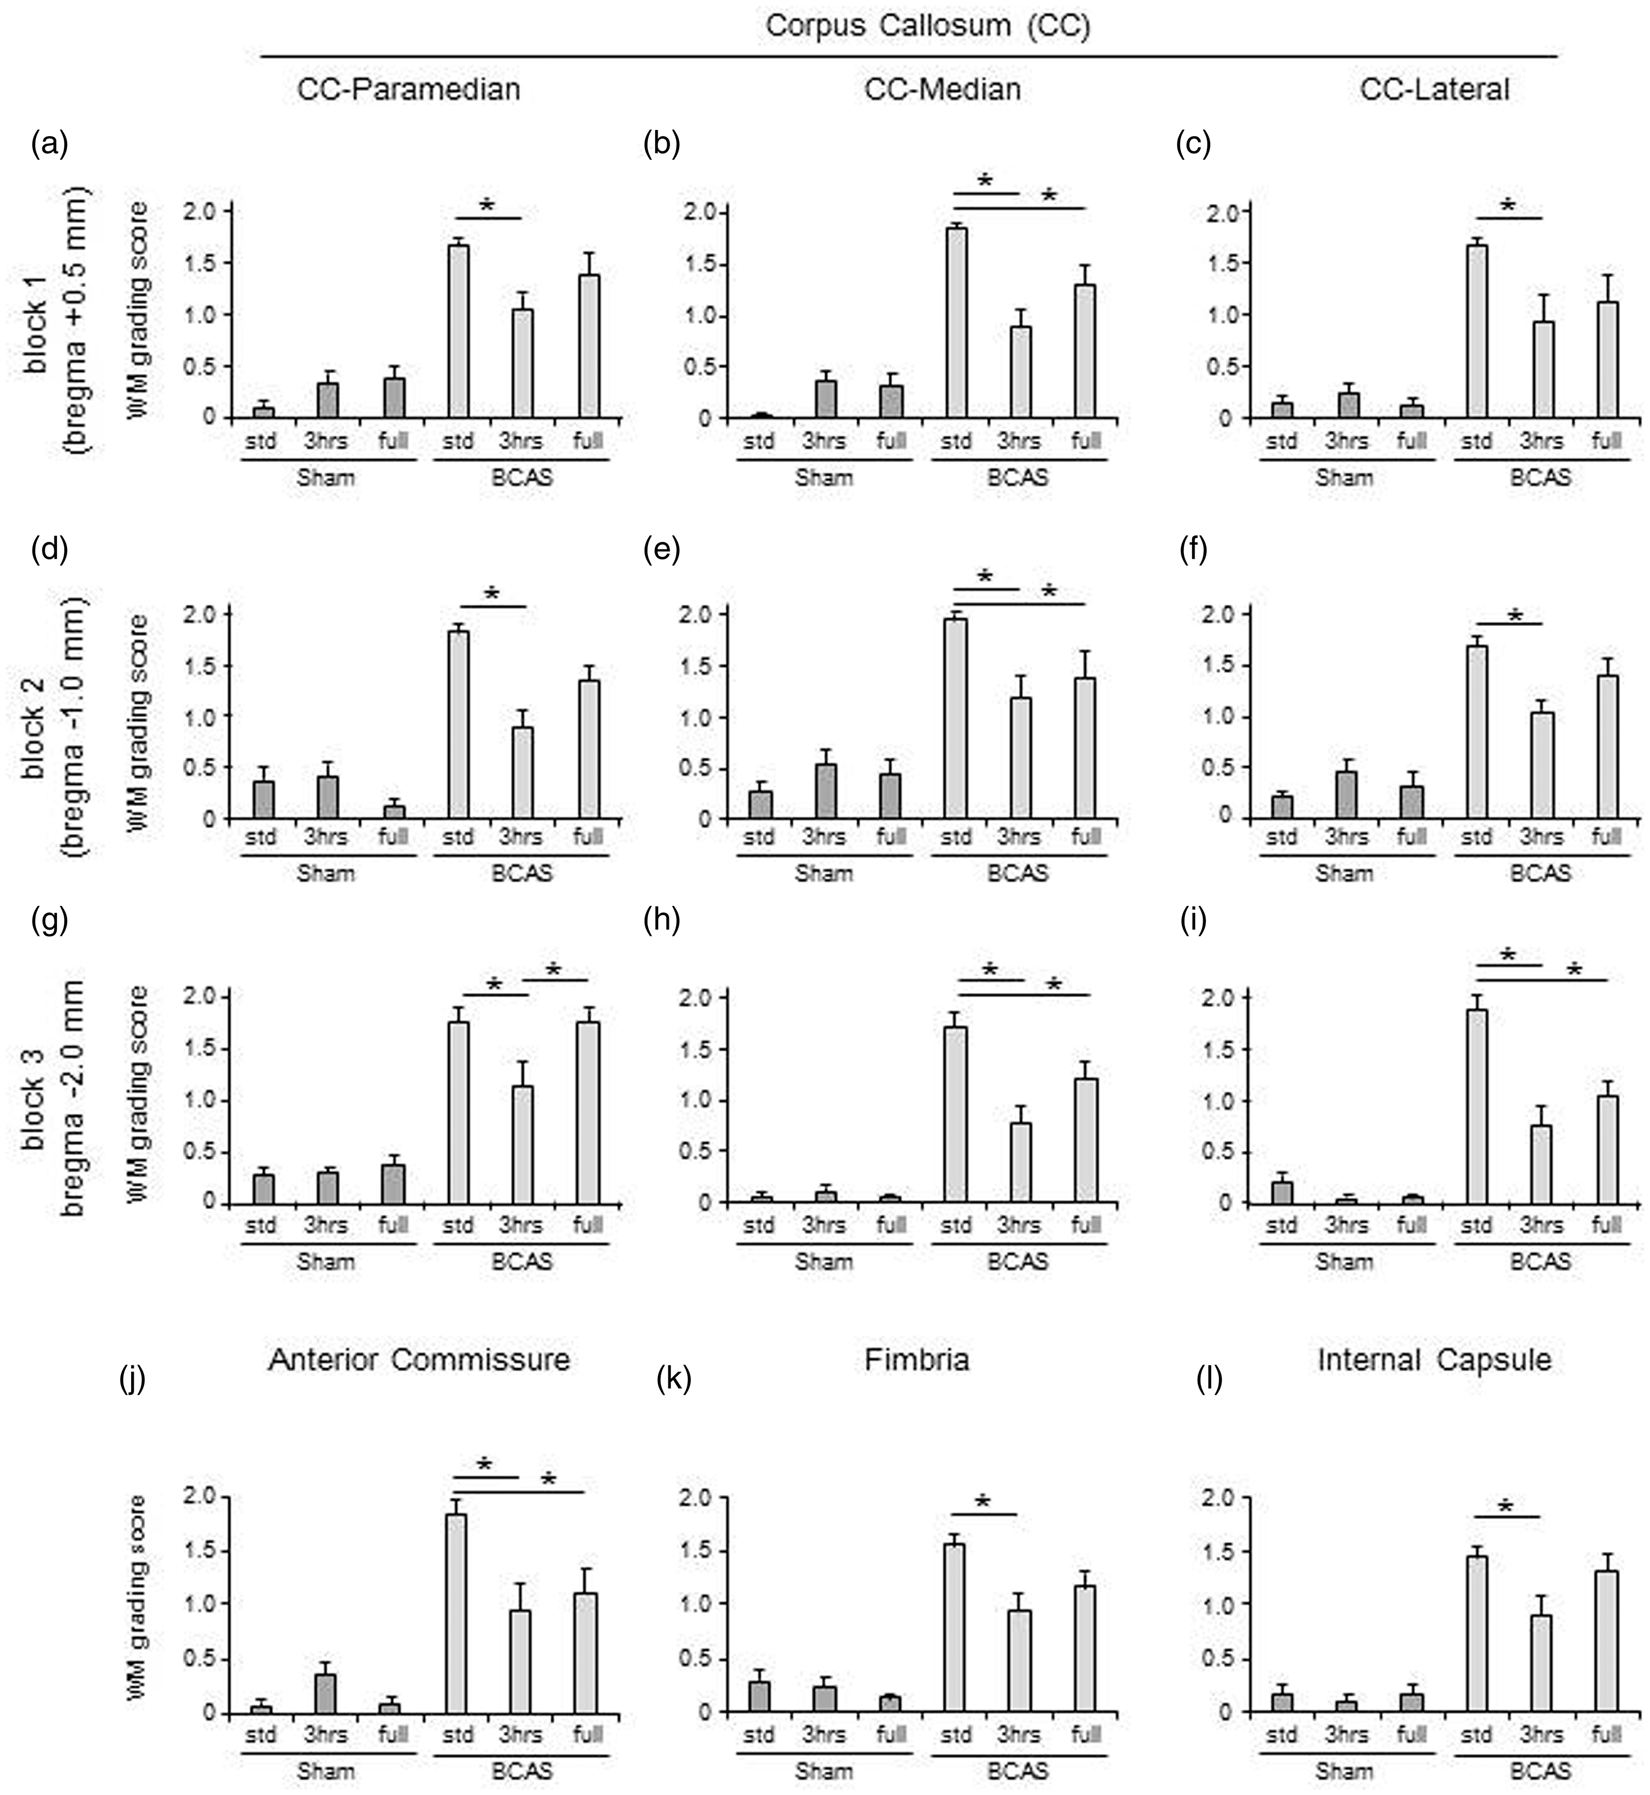
BCAS resulted in higher WM severity scores compared with sham animals. In the paramedian area of the CC (Figure 3(a) (A to F)), BCAS-3 h mice showed reduced WM score (preserved WM integrity) compared to BCAS-std at all coronal levels comprising blocks 1, 2 and 3 at coronal levels relative to bregma + 0.5 mm, −1.0 mm and −2.0 mm, respectively (*P < 0.05) (Figure 4(a), (d) and (g)). In the most caudal part, BCAS-3 h mice also had reduced WM severity score compared to BCAS-full (*P < 0.05) (Figure 4(g)). In turn, BCAS-full mice had more preserved WM integrity compared to BCAS-std (*P < 0.05) (Figure 4(h) and (i)). In both the median (Figure 3(b) (A to F)) and lateral (Figure 3(c) (A to F)) regions of the CC, BCAS-3 h and BCAS-full subgroups exhibited reduced WM scores compared to BCAS-std at all coronal levels (*P < 0.05) (Figure 4(b), (e), (h), (c), (f) and (i)). There was also a reduction in the WM score of the anterior commissure of BCAS-3 h and BCAS-full animals compared to BCAS-std (*P < 0.05) (Figure 4(j)). Similarly, there was less WM damage in the hippocampal fimbria and internal capsule in the BCAS-3 h animals compared to BCAS-std (*P < 0.05) (Figure 4(k) and (l)). In the optic nerve and optic tract, BCAS subgroups showed greater WM scores compared to sham subgroups.
LFB + CFV stained corpus callosum: (a) LFB + CFV stained paramedian part of the CC in each group. a(A), sham-std; a(B), sham-3 h; a(C), sham-full; a(D), BCAS-std; a(E), BCAS-3 h; a(F), BCAS-full. Scale bar represents 50 µm. (b) LFB + CFV stained median part of the CC in each group. b(A), sham-std; b(B), sham-3 h; b(C), sham-full; b(D), BCAS-std; b(E), BCAS-3 h; b(F), BCAS-full. Scale bar represents 50 µm. (c) LFB + CFV stained lateral part of the CC in each group. c(A), sham-std; c(B), sham-3 h; c(C), sham-full; c(D), BCAS-std; c(E), BCAS-3 h; c(F), BCAS-full. Scale bar represents 50 µm. White matter (WM) severity score in WM. (a to i) Histograms showing WM severity score in the paramedian (a, d and g), median (b, e and h) and lateral (c, f and i) side of corpus callosum (CC) of all different coronal levels. (j to l) Histograms showing WM severity score in the anterior commissure (j), hippocampal fimbria (k) and internal capsule (l). In all of these WM, BCAS plus limited exposure to EE (BCAS-3 h) subgroup showed lower WM scores (preserved WM integrity) compared with BCAS-std (*P < 0.05) (a-i) and BCAS-full (*P < 0.05) (g). BCAS-full also attenuated WM damage compared with BCAS-std (*P < 0.05) (b, e, h, i and j) especially in the caudal part of the CC (*P < 0.05) (g, h and i).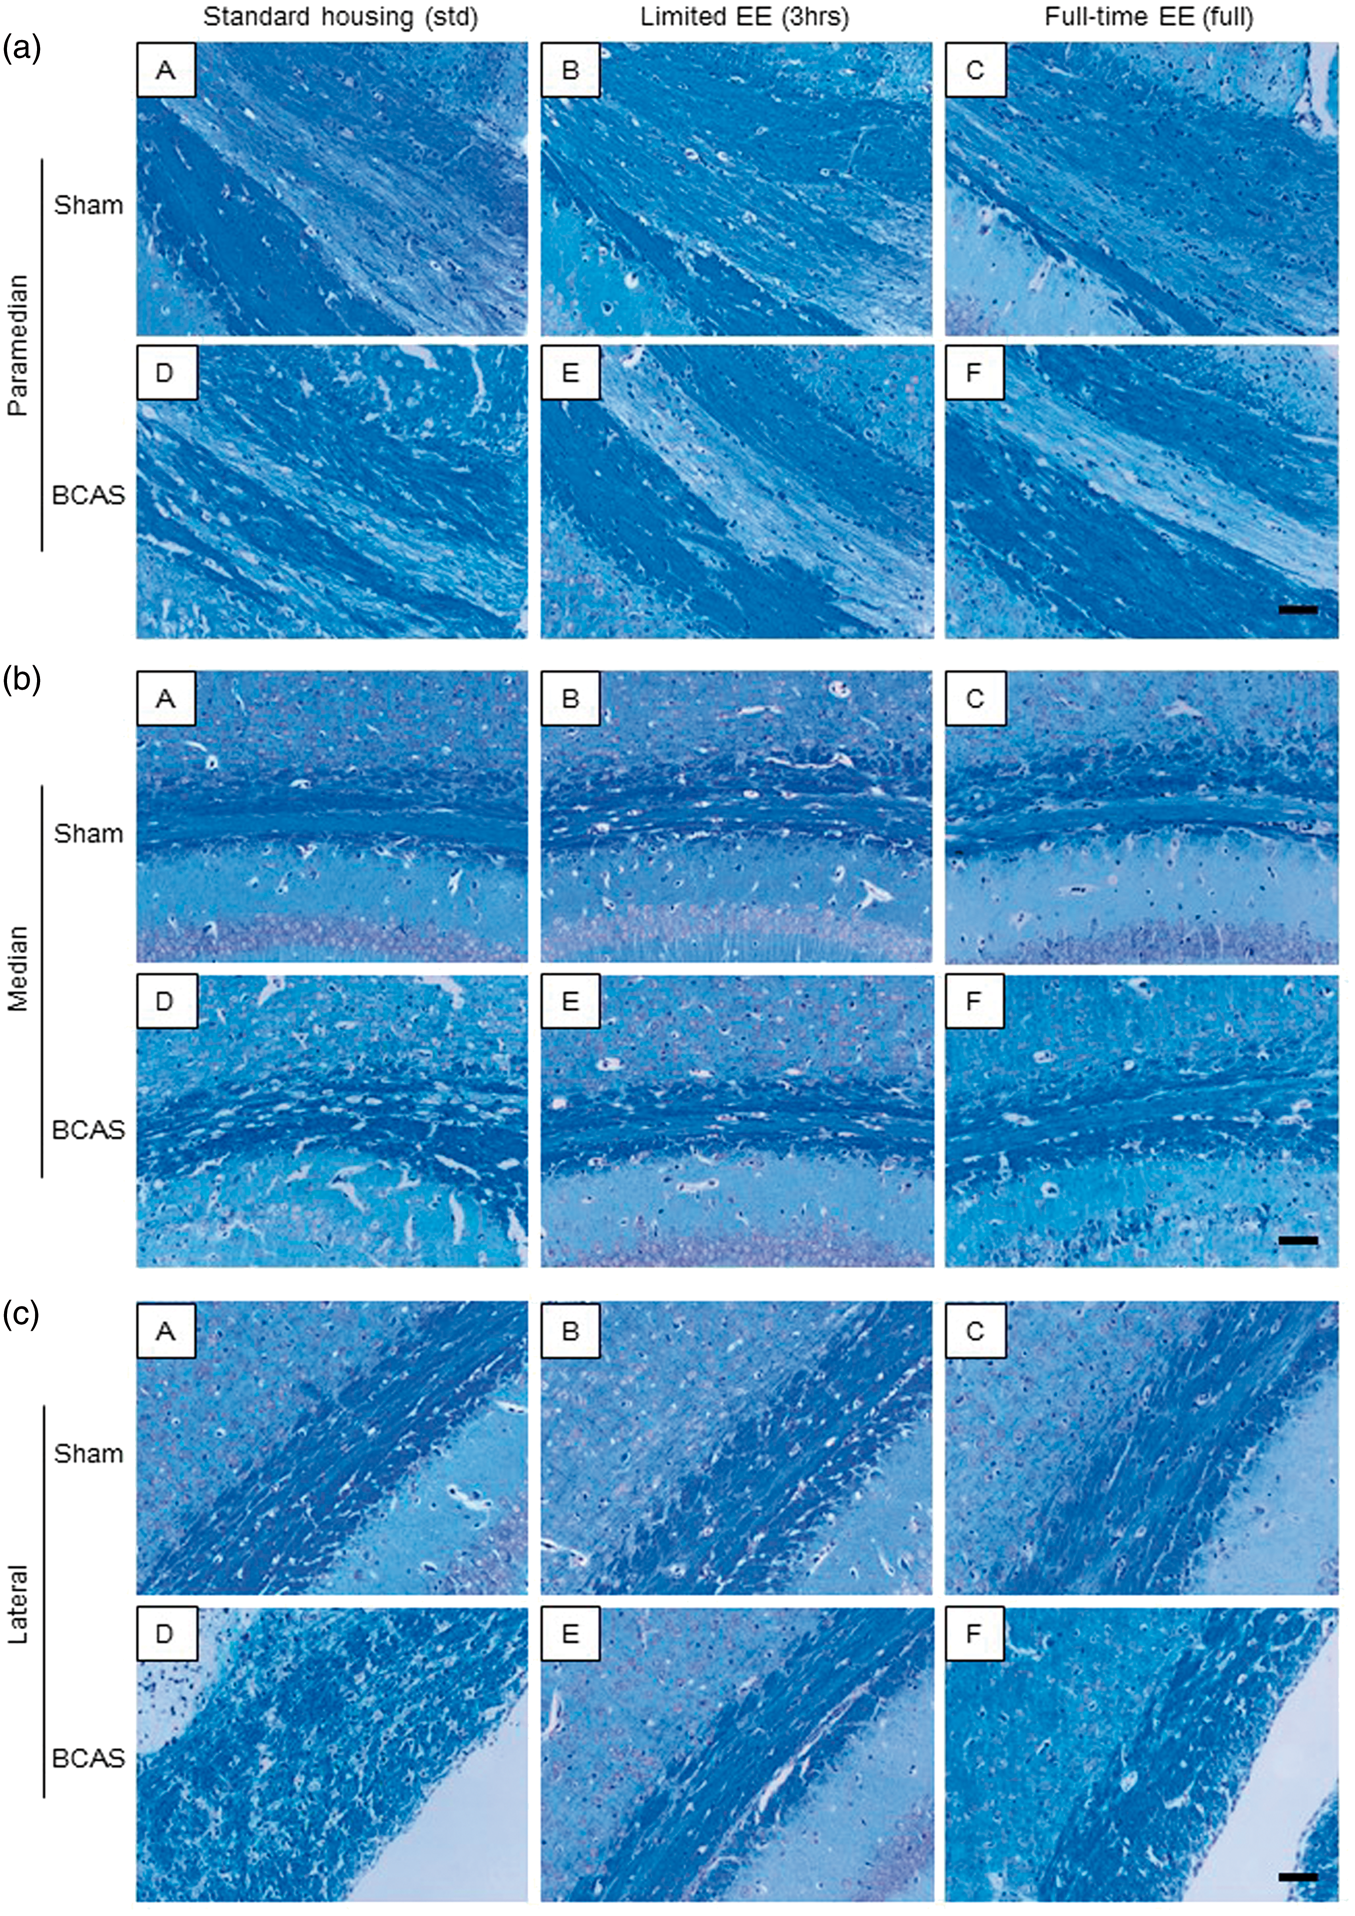
Status of oligodendrocytes during limited versus full-time exposure to EE
All sham subgroups showed normal alignment and appearance of oligodendrocytes in the caudal segment of the CC (Figure 5(a) (A to C)). On the other hand, BCAS-std mice had lower numbers and disrupted cells (Figure 5(a) (D)). EE, especially BCAS-3 h, preserved the number and alignment of oligodendrocytes (Figure 5(a) (E)). The total number of oligodendrocytes in the entire caudal segment was greater in BCAS-3 h mice compared with BCAS-std and BCAS-full subgroups (P < 0.01) (Figure 5(b)). BCAS-full also showed increased number of cells compared with BCAS-std (P < 0.05) (Figure 5(b)).
Total number of oligodendrocytes in the corpus callosum (CC). (a) (A-F), Representative images of haematoxylin-stained corpus callosum (CC) in each group. a(A), sham-std; a(B), sham-3 h; a(C), sham-full; a(D), BCAS-std; a(E), BCAS-3 h; a(F), BCAS-full. Scale bar represents 25 µm. (b) Histogram showing total number of oligodendrocytes in the entire CC. BCAS-3 h showed increased number of oligodendrocytes in the entire CC compared with BCAS-std and BCAS-full (both **P < 0.01). BCAS-full showed increased number of oligodendrocytes compared with BCAS-std (*P < 0.05).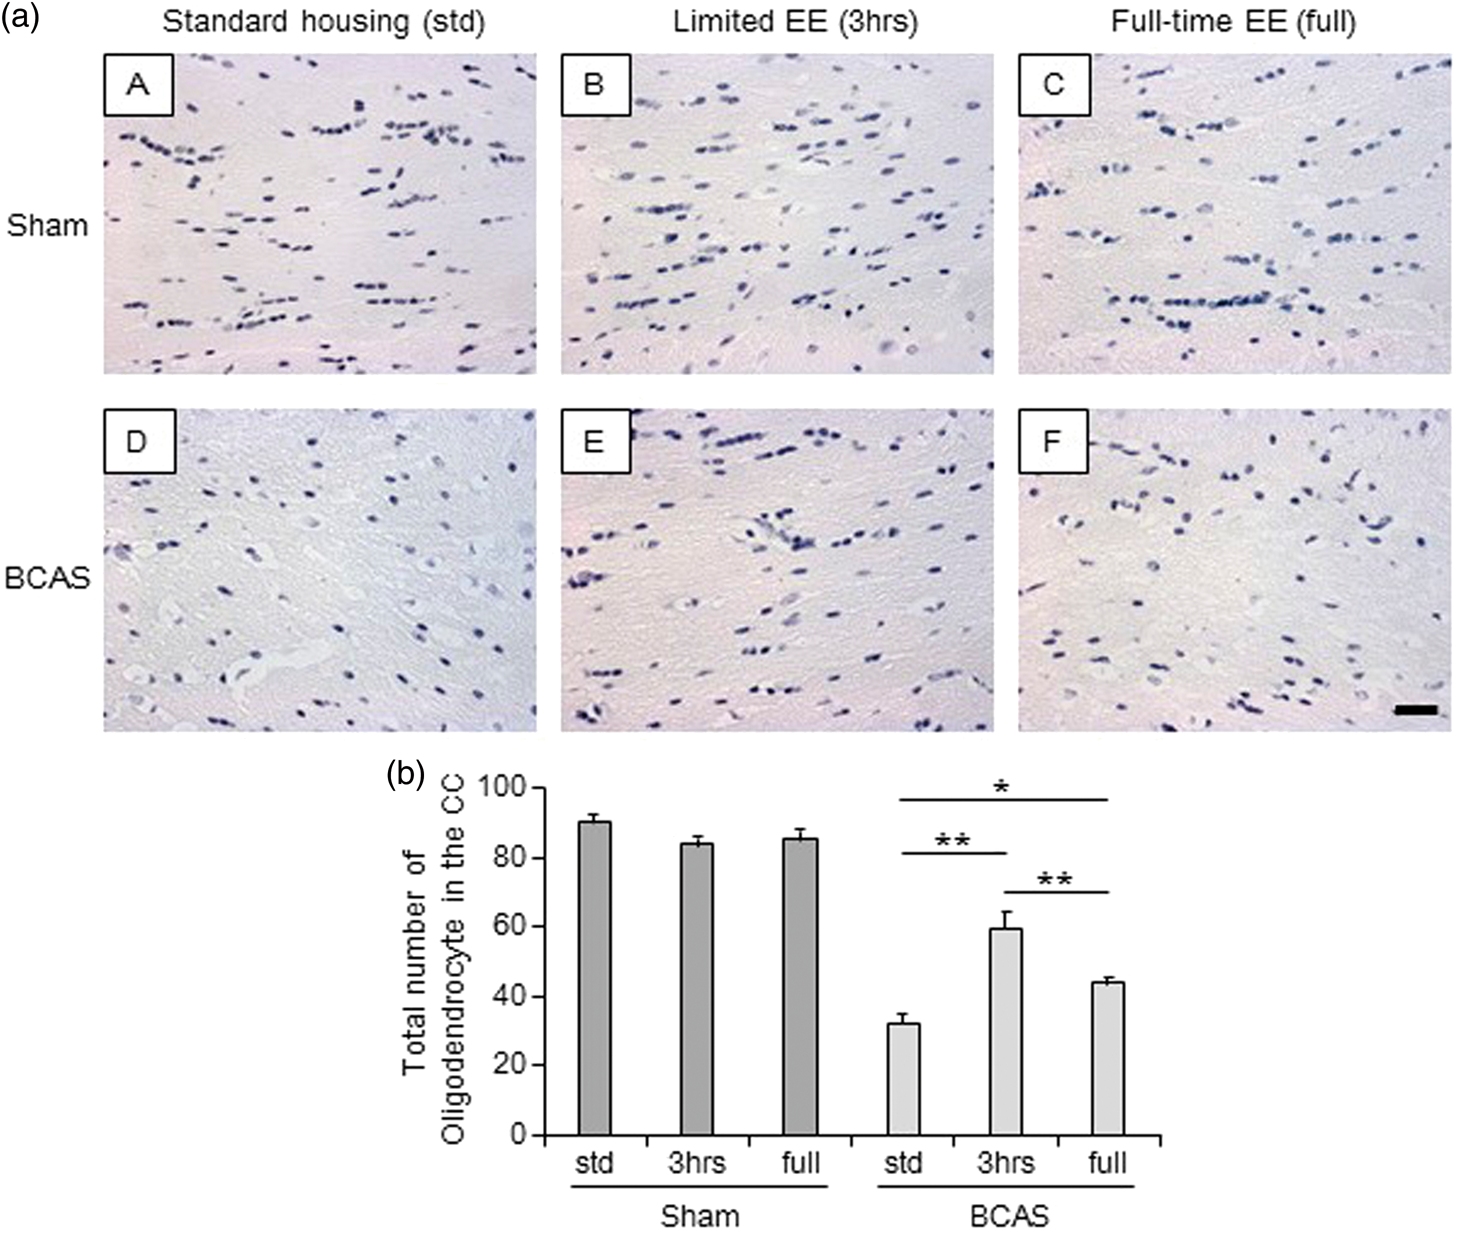
Impaired nesting ability induced by BCAS was reversed by EE
Sham subgroups had almost the same level of nesting ability (Nestlet score) compared with preoperative baseline level at 16 weeks after surgery. However, BCAS-std subgroup exhibited lower Nestlet scores (impaired nesting ability) compared to baseline level (*P < 0.05). EE reversed impaired the nesting ability, and limited exposure to EE (BCAS-3 h) tended to improve the nesting ability compared with BCAS-std and BCAS-full subgroups (Figure 6(c)). BCAS plus EE subgroups made higher nests and used more Nestlet to make nests compared with BCAS-std (data not shown).
Assessment of nesting ability (a) and (b)(A-F), Representative images of nest created from the Nestlet in each group. (a) A nest seen before surgery (baseline); (b)(A-F), nests seen at 16 weeks post-operation. b(A), sham-std; b(B), sham-3 h; b(C), shamfull; b(D), BCAS-std; b(E), BCAS-3 h; b(F), BCAS-full. (c) Boxplot showing Nestlet score at baseline level and post operation in each group. BCAS-std subgroup had impaired nesting ability compared to baseline level (*P < 0.05). EE reversed impaired nesting ability induced by BCAS, especially by limited EE (BCAS-3 h) (c).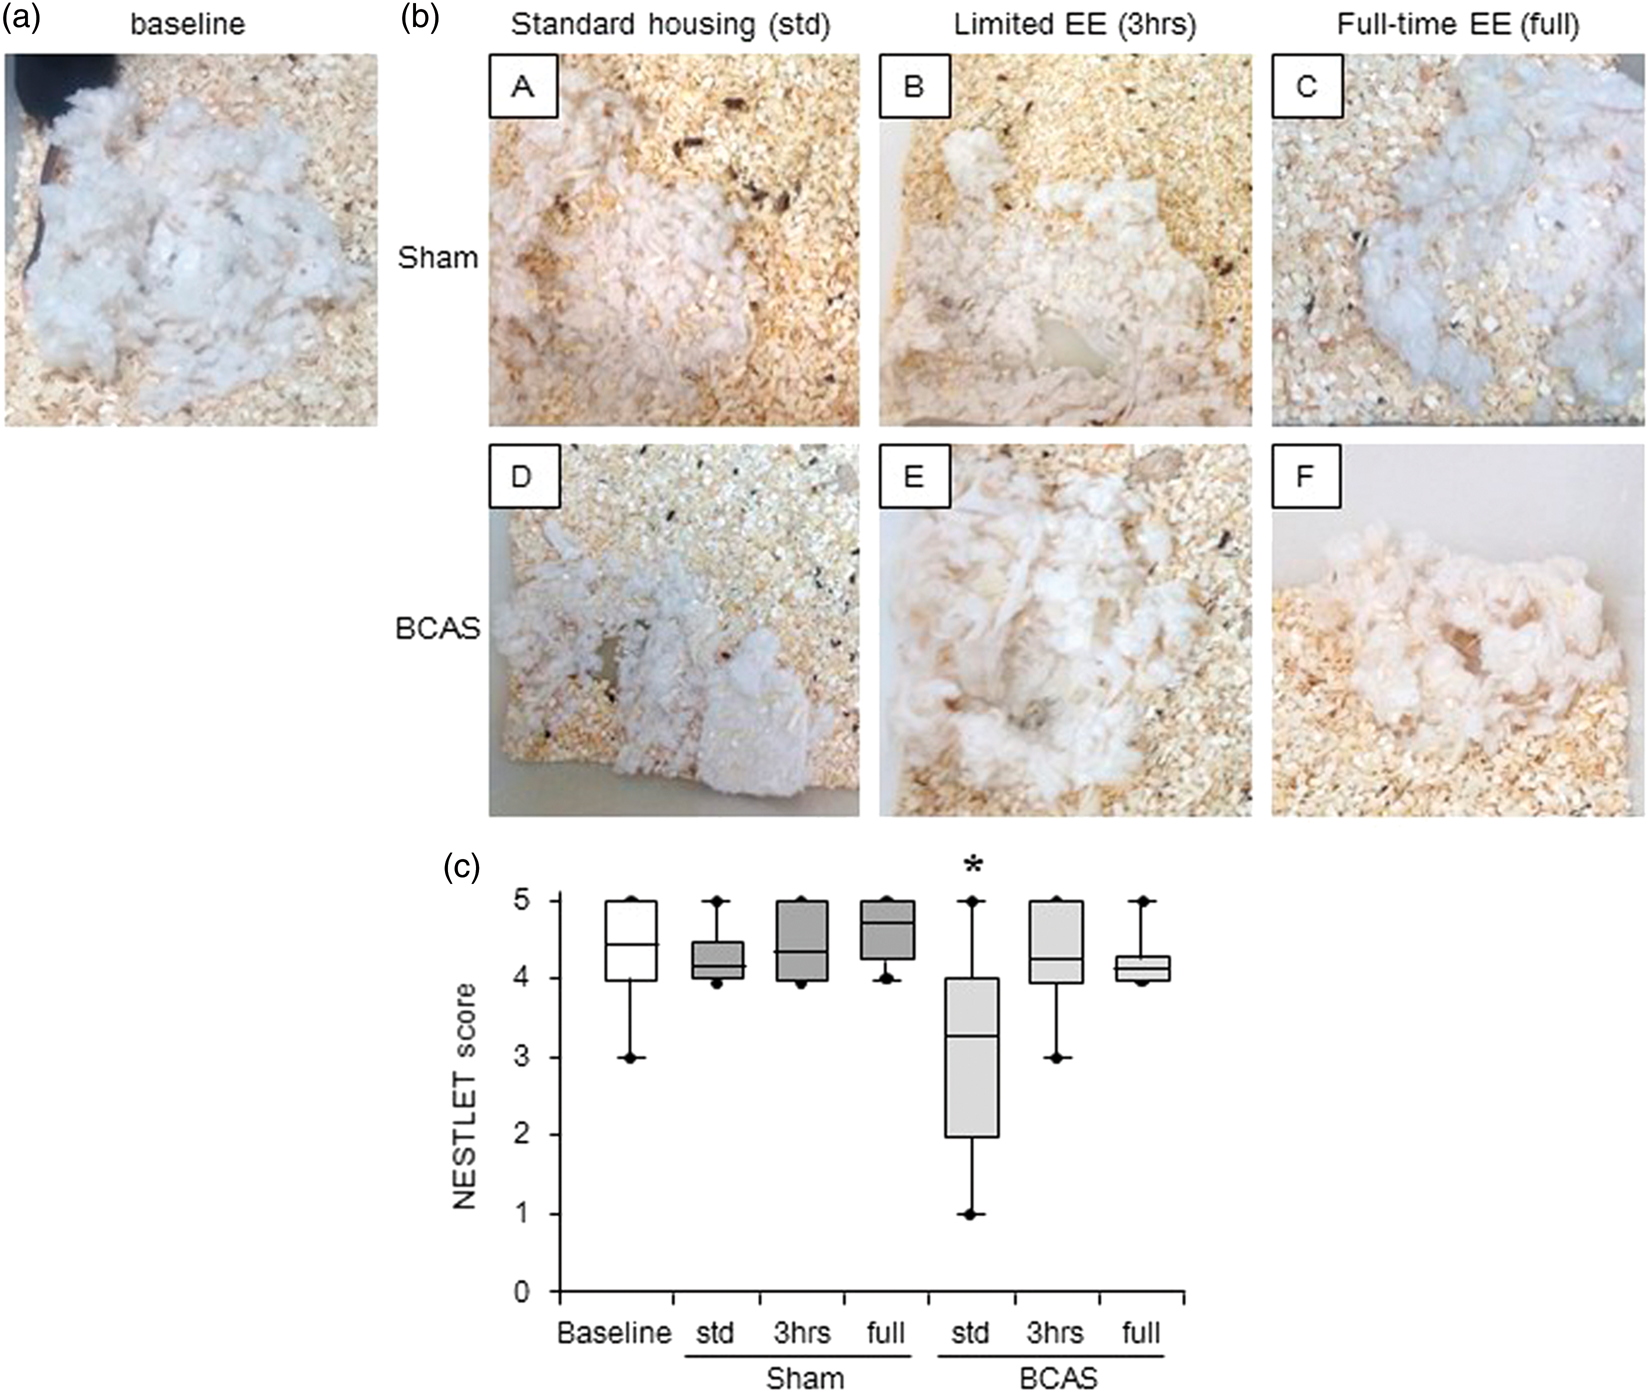
Impaired working memory partially reversed by EE
Working memory was significantly impaired in BCAS compared to sham animals.
Arm repeat scores
Average arm repeat scores in sessions 1–10, sessions 11–20 and sessions 1–20, all showed significantly lower scores in BCAS compared to sham animals (P < 0.05 in sessions 1–10; P < 0.01 in sessions 11–20 and sessions 1–20) (Figure 7(b)). Sham group dramatically improved arm repeat score by 47.4% in sessions 11–20 compared to sessions 1–10, whereas BCAS group reduced score by 6.6% (Figure 7(b)). All the sham animals improved arm repeat scores (average 49%) in sessions 11–20 compared to sessions 1–10. The BCAS-3 h mice improved their score by 37.3%, whereas BCAS-std only improved by 13.0% and BCAS-full even reduced the average score by 45.7% (Figure 7(c)). For the arm repeat score averaged from sessions 1–20, the BCAS-3 h subgroup showed the highest mean score between BCAS subgroups, followed by BCAS-full and BCAS-std. In sessions 11–20 and sessions 1–20, the BCAS-3 h mice showed no differences compared to sham-std. In sessions 11–20, BCAS-3 h also showed no significant change in lower arm repeat scores compared with those on sham-3 h (P = 0.08).
Cognitive function assessed in the 9-arm radial maze: (a) Table showing probability of each pair of “arm entries and arm repeats (top of each cell)” and “arm repeat score (bottom of each cell)”. Pairs of N/A did not occur in this experiment. (b and c) Histograms showing arm repeat score of all sham and all BCAS (b) and score of each subgroup (c). (b), Average arm repeat scores of all BCAS in sessions 1–10, sessions 11–20 and sessions 1–20 were lower compared with sham (*P < 0.05 vs. sham; †P < 0.01 vs. sham; ‡P < 0.01 vs. sham). Sham group had dramatically increased arm repeat scores, by average 47.4% in sessions 11–20 compared to sessions 1–10. BCAS group reduced their score by 6.6%. (c) All sham subgroups had increased arm repeat score (average 49%) in sessions 11–20 compared to sessions 1–10. Limited exposure to EE (BCAS-3 h) increased their score by 37.3%. BCAS-std only increased by 13.0% and BCAS-full reduced the score by 45.7%. Limited exposure to EE (BCAS-3 h) subgroup showed the best score between BCAS subgroups. (d) Table showing probability of each “number of arm entries before first repeat, NABFR (top of each cell)” and “NABFR score (bottom of each cell)”. (e and f) Graphs showing number of arm entries before first repeat (NABFR) in all sham and all BCAS (e) as well as NABFR of each subgroups (f). Every consecutive five sessions were averaged. (e) All sham completed more arm entries before first repeat, compared with all BCAS (P < 0.01). (f) Between BCAS subgroup, BCAS-3 h tends to complete more arm entries, especially in sessions 1–5 as well as sessions 11–15. (g and h) Histograms showing NABFR score of all sham and all BCAS (g) and subgroups (h). Average NABFR scores for all BCAS in sessions 1–10, sessions 11–20 and all sessions 1–20 were lower compared with all sham animals (**P < 0.01 vs. sham; †P < 0.01 vs. sham; ‡P < 0.01 vs. sham) (g) and limited exposure to EE (BCAS-3 h) subgroup showed the best NABFR score between BCAS subgroups (h).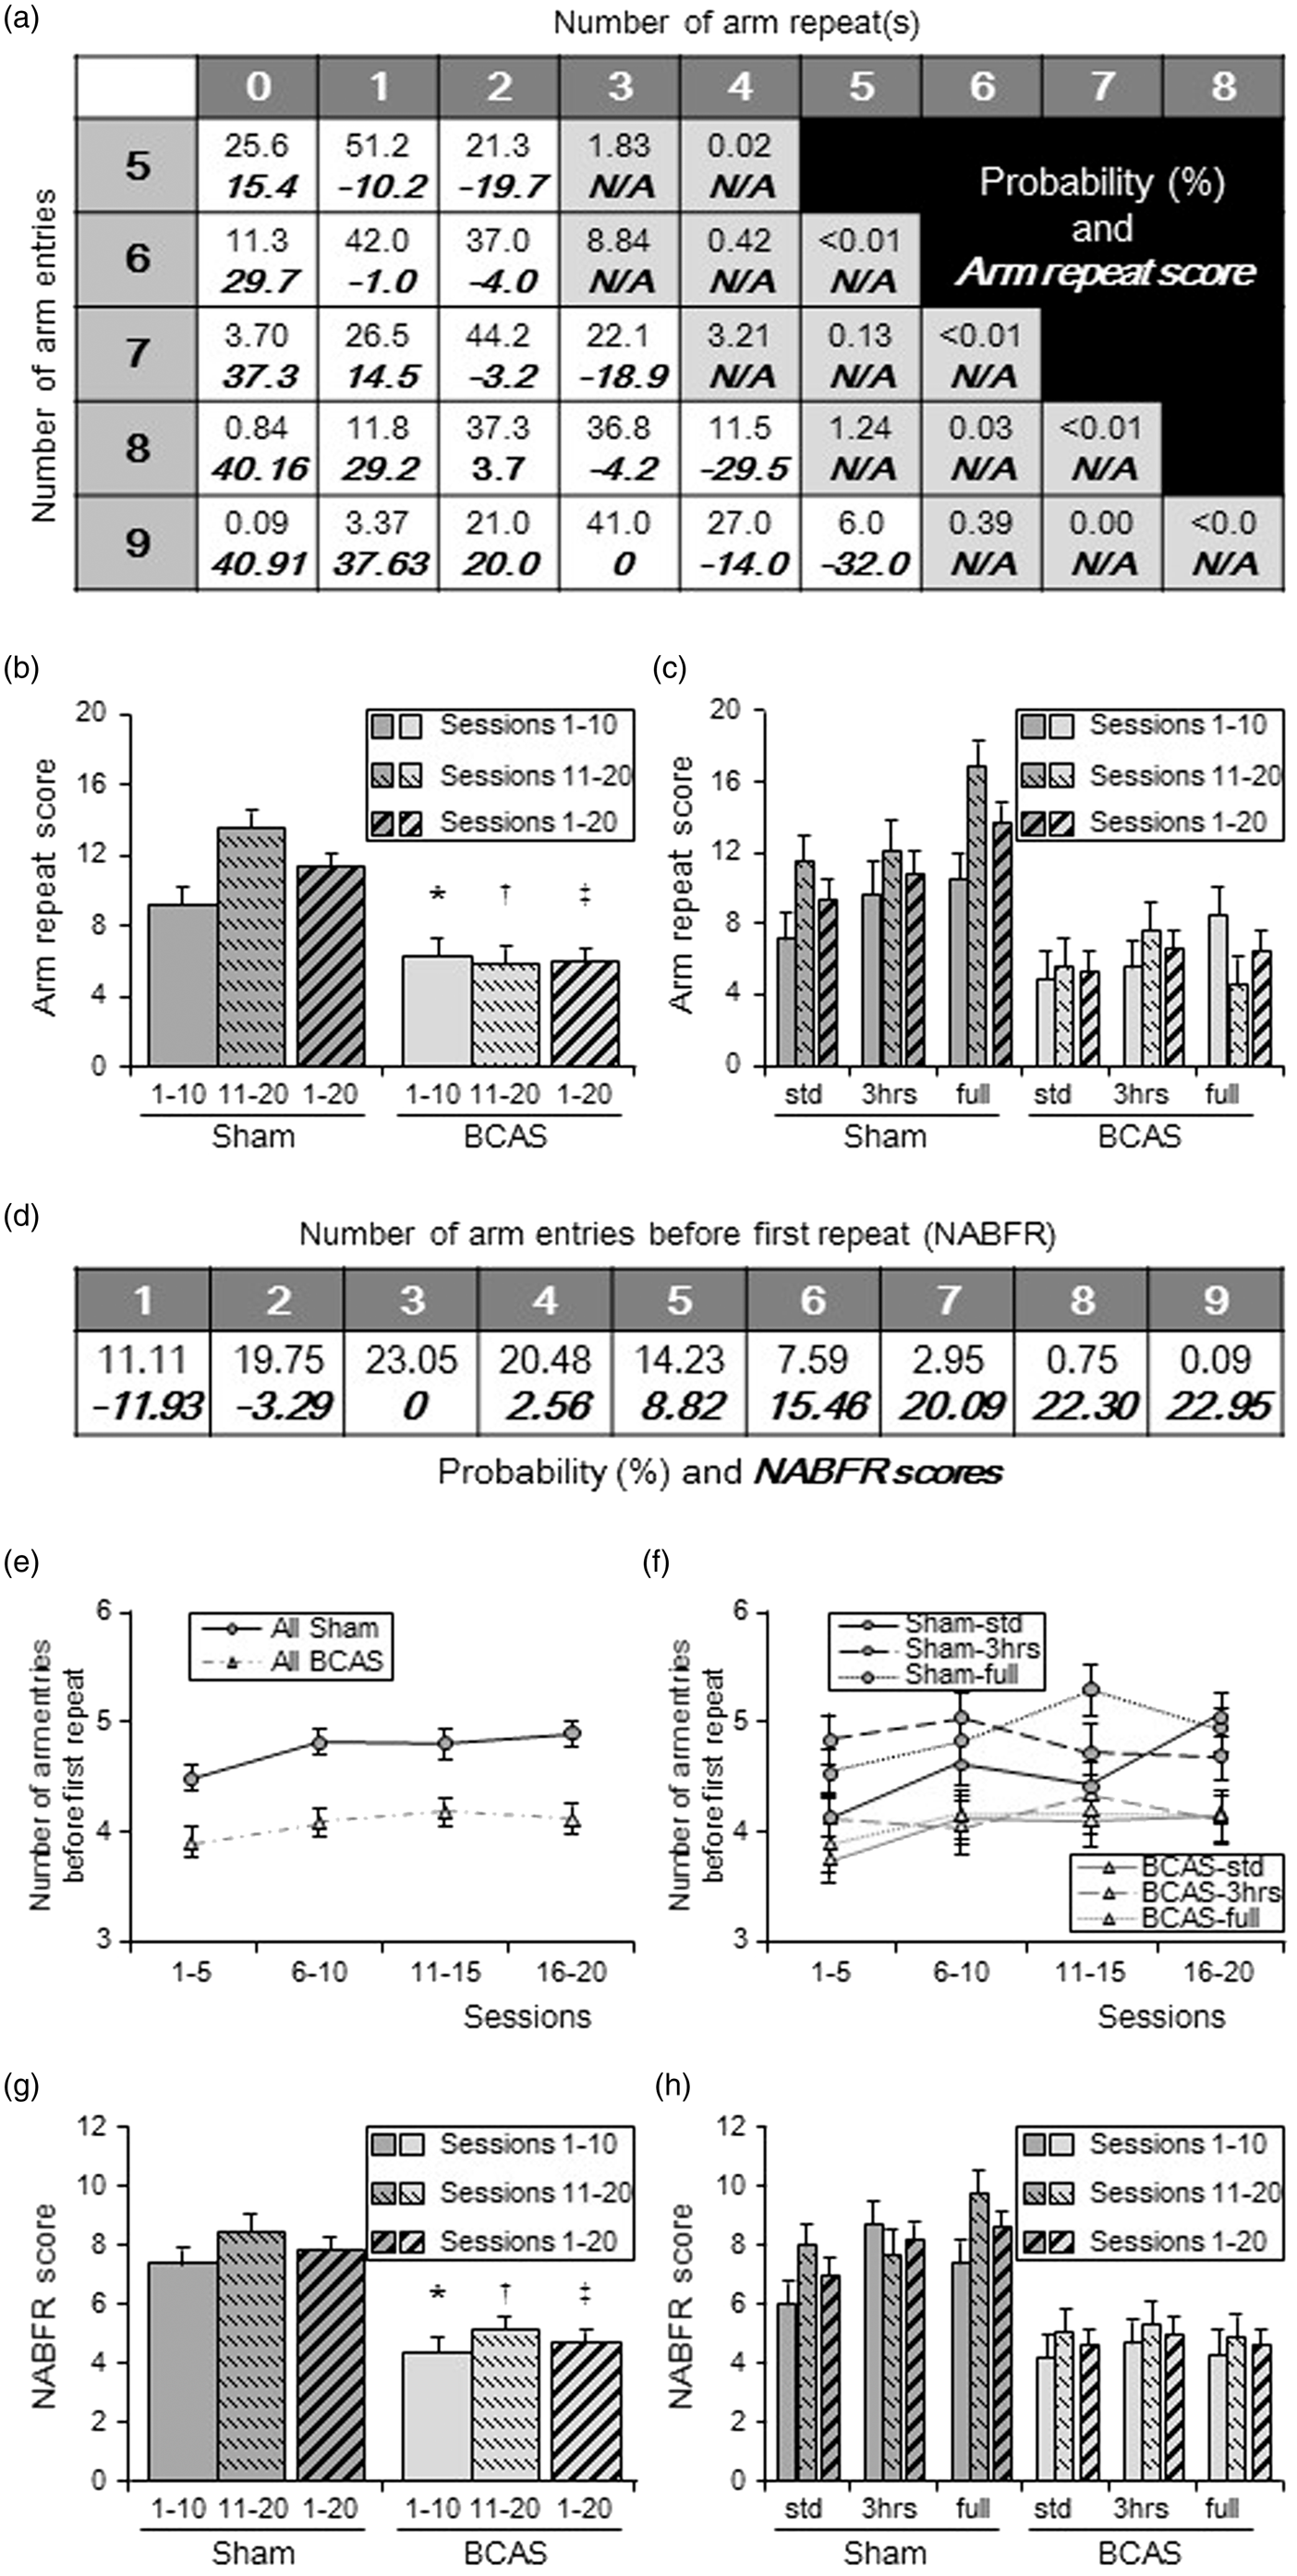
NABFR scores
The NABFR was lower in BCAS mice compared to the sham (P < 0.01) (Figure 7(e)). All sham subgroups also completed more arm entries before first repeat compared with all BCAS subgroups. Between BCAS subgroups, the BCAS-3 h mice subgroup completed more arm entries before first repeat, in sessions 1–5 and 11–15 (Figure 7(f)). The BCAS animals also showed lower NABFR scores compared with sham in sessions 1–10, 11–20 and 1–20, (P < 0.01) (Figure 7(g)). The NABFR scores averaged from sessions 1–20, were highest for the BCAS-3 h mice followed by BCAS-full and BCAS-std (Figure 7(h)). BCAS-3 h mice also showed a trend towards lower scores compared with sham-3 h in sessions 11–20 (P = 0.06).
Discussion
Our findings in this study suggest beneficial effects of limited EE against WM changes after chronic BCAS as related to the features of VCI and VaD. We found that BCAS caused: (1) WM damage demonstrated by CC atrophy as well as WM disintegration and loss of oligodendrocytes; (2) impaired the nesting ability as well as the cognitive function. These unfavourable changes were attenuated by (EE intervention, by limited exposure to EE rather than full-time exposure to EE.
Few previous studies reported overall BW change after long-term BCAS. We found BCAS animals did not gain weight compared to sham, despite the lack of differences in the amount of food consumption between BCAS and sham animals. The reduced trailing effects on BW in the BCAS mice may be explained by systemic metabolic changes. Overall survival rate after surgery was significantly lower in BCAS compared to sham animals. This is compatible with previous reports indicating that survival rates after BCAS was about 80%.14,34 However, in our study, an overall four-month survival rate after BCAS was >90% in BCAS-std and BCAS-3 h subgroups. We also suggest the higher mortality in the BCAS-full subgroup could be explained by dehydration and acute renal failure possibly due to the increased physical activity promoted by the full-time exposure to EE. Although EE exposes the animals to a number of different features including physical exercise and social interaction, we noted the average number of wheel rotations in BCAS-full subgroup was 5-fold greater compared with BCAS-3 h, sham-3 h and sham-full subgroups (data not shown). Limited exposure to EE could have also initiated and activated the fronto-subcortical circuits more often when the animals experienced limited exposure to EE every time. Repeated activation of fronto-subcortical circuits could enhance the cognitive function and prevent cognitive decline after BCAS.
It has been reported that nesting is important for heat conservation, reproduction and shelter and shown to relate to brain lesions, pharmacological agents and genetic mutations. 33 We found that BCAS caused impaired nesting ability, and it was attenuated by EE, which is a new finding in the BCAS mouse model. BCAS plus limited exposure to EE mice tended to make better nests compared to other BCAS subgroups. These results suggest that EE after chronic cerebral hypoperfusion could protect changes in different cognitive domains or could attenuate mild undetectable sensory-motor deficit involved in the nesting ability.
Previous reports suggest that BCAS causes impaired working memory.15,35,36 These studies used the conventional 8-arm radial maze or the Y-maze. We utilised an innovative 3D 9-arm radial arm maze for the assessment of cognitive function, which is a modified version of the conventional radial arm maze and designed for assessing working memory. 31 This maze allowed us to measure more indices compared with the conventional 8-arm radial arm and Y-mazes.32,37 The arm repeat scores allowed us to assess probability as well as number of arm repeats. The NABFR scores allowed us to detect differences in cognitive function of each group with greater sensitivity. We found that all BCAS showed significantly lower arm repeat scores and NABFR scores compared with the sham animals, suggesting that BCAS impaired working memory. This is consistent with the heterogeneity observed in VaD and normally ageing individuals. We also found that limited exposure to EE ameliorated cognitive decline after BCAS. The average arm repeat score and NABFR score in sessions 11–20, BCAS plus limited exposure to EE subgroup (BCAS-3 h) showed no significant difference compared with sham subgroups. This result suggests that moderate, rather than full-time exposure to EE could be an effective intervention against impaired working memory as evident in VCI. 3 Overall, our observations are consistent with previous evidence indicating that EE elicits beneficial effects on neuronal plasticity and cognitive functioning in rats, 26 mice27,38–40 and humans.27,38–40 However, the underlying neurophysiological mechanisms of EE remains poorly understood. It is proposed that the structural and biomechanical changes in the WM induced by EE, is due to the upregulation of genetic expressions associated with neurogenesis, synaptic plasticity, neuroprotection and intact memory function. 41
Carotid artery stenosis is an important risk factor for cerebral WM disease42,43 and relates to WM damage and cognitive dysfunction44–46 apparent in SIVD. 14 We propose that chronic cerebral hypoperfusion in mice or rats 47 leads to reduced CBF. Thus, we noted that all BCAS subgroups showed thickened carotid arterial wall and prolonged reduction of CBF as evident by laser speckled flowmetry at 16 weeks after surgery. 48 This suggested that compensatory mechanisms such as collateral flow, were not able to prevent CBF reduction due to severely stenosed carotid arteries but the reduced CBF in turn facilitated damage in the deep WM, particularly affecting the cellular structure including oligodendrocytes in the CC.14,34–36 However, the WM pathology is indicative of overall subcortical damage and neuronal disconnectivity between cerebral cortices that result in cognitive and motor deficits observed in SIVD.4,45,46,49 As BCAS-std and BCAS-full mice both showed more severe WM damage, i.e. CC atrophy than in the BCAS-3 h subgroup, this suggests that continuous but moderate levels of EE is more beneficial for sustaining WM integrity than no enrichment or full-time exposure to EE.
WM in the aged mouse is vulnerable to prolonged cerebral hypoperfusion and hypoxic stress and loses its ability to recruit cyclic AMP response element-binding protein (CREB)-mediated oligodendrogenesis for responding to WM injury and stress. 50 In our study, limited exposure to EE significantly attenuated WM pathology and preserved oligodendrocytes, suggesting that EE can restore WM integrity and result in better cognitive function, possibly via CREB-mediated oligodendrogenesis. The assessment of CREB-mediated oligodendrogenesis in the WM could enable elucidation of the mechanisms of limited exposure to EE against WM damage.
There are some limitations in our study. First, we assessed cognitive function and brain histological changes at one time point, 16 weeks after surgery before euthanasia. Physiological and histological data obtained from more time points would be useful for greater understanding of the pathological mechanisms as well as effects of EE in BCAS. Secondly, we set limited exposure to EE regime as 3 h a day. Testing other durations of exposure to EE, such as shorter than 3 hours or longer than 3 hours could more precisely elucidate the effects of limited EE against BCAS. Thirdly, as VCI or VaD also involves changes in the medial temporal lobe, 51 we have not presented data on the status of the hippocampus along with our present findings. This requires an in depth labour intensive analysis, which is currently in progress. Finally, we deem that further analysis of the fibre tracts of the CC would allow us to identify the nature of the damage in specific fronto-subcortical circuits that are affected after long-term cerebral hypoperfusion.
Conclusions
In summary, long-term chronic cerebral hypoperfusion induced by BCAS produced similar neuropathological changes to those seen in VaD indicative of the relevance of the model. This study also demonstrated that limited exposure to EE protects the WM and elicits a beneficial effect on oligodendrocyte loss after chronic cerebral hypoperfusion-induced vascular injury. Although further experimental studies are needed, moderate EE appears a safe and effective future interventional strategy for cerebrovascular diseases, especially for patients with VCI.
Footnotes
Funding
The author(s) disclosed receipt of the following financial support for the research, authorship, and/or publication of this article: Our study was supported by a grant (ARUK PG2013-22) from Alzheimer’s Research UK. Y.H. was supported by SENSHIN Medical Research Foundation, Osaka, Japan and The Great Britain Sasakawa Foundation, London, UK.
Acknowledgements
We specially thank Neil Hamilton and Sandra Hogg for excellent technical assistance with respect to the daily care of mice and animal husbandry. We thank Mary Johnson and Lynn Ramsey (Newcastle University) for excellent technical assistance in processing brain tissue.
Declaration of conflicting interests
The author(s) declared no potential conflicts of interest with respect to the research, authorship and/or publication of this article.
Author’s contributions
YH, LC, MH, WS and JS performed or contributed to different aspects of the experiments in the study. YH wrote the first draft of the manuscript. AC, DL, AE, AO, MI, KH and RNK contributed to critically revising the manuscript for important intellectual content, and all approved the final version of the manuscript for submission.
References
Supplementary Material
Please find the following supplemental material available below.
For Open Access articles published under a Creative Commons License, all supplemental material carries the same license as the article it is associated with.
For non-Open Access articles published, all supplemental material carries a non-exclusive license, and permission requests for re-use of supplemental material or any part of supplemental material shall be sent directly to the copyright owner as specified in the copyright notice associated with the article.