
Abstract
Capillary flow patterns are highly heterogeneous in the resting brain. During hyperemia, capillary transit-time heterogeneity (CTH) decreases, in proportion to blood's mean transit time (MTT) in passive, compliant microvascular networks. Previously, we found that functional activation reduces the CTH:MTT ratio, suggesting that additional homogenization takes place through active neurocapillary coupling mechanisms. Here, we examine changes in the CTH:MTT ratio during hypercapnic hyperemia in anesthetized mice (C57Bl/6NTac), expecting that homogenization is smaller than during functional hyperemia. We used an indicator-dilution technique and multiple capillary scans by two-photon microscopy to estimate CTH and MTT. During hypercapnia, MTT and CTH decreased as derived from indicator-dilution between artery and vein, as well as between arterioles and venules. The CTH:MTT ratio, however, increased. The same tendency was observed in the estimates from capillary scans. The parallel reductions of MTT and CTH are consistent with previous data. We speculate that the relative increase in CTH compared to MTT during hypercapnia represents either or both capillary constrictions and blood passage through functional thoroughfare channels. Intriguingly, hemodynamic responses to hypercapnia declined with cortical depth, opposite previous reports of hemodynamic responses to functional activation. Our findings support the role of CTH in cerebral flow-metabolism coupling during hyperemia.
Keywords
Introduction
Brain function relies on a constant supply of oxygen and nutrients, and neurovascular coupling mechanisms are now known to adjust arteriolar diameters—and thereby cerebral blood flow (CBF)—to meet the metabolic demand of the brain tissue.1,2 The extraction of oxygen from blood is inherently inefficient at short capillary transit times, and the oxygen extraction fraction (OEF) therefore decreases during hyperemia in normal brain, giving rise to the so-called blood-oxygen-level-dependent (BOLD) effect. The efficacy of microvascular oxygen extraction was recently shown to depend on capillary transit-time heterogeneity (CTH)3,4: Capillary flows are highly heterogeneous in the resting brain,1,5 and homogenization of capillary transit-times is therefore critical to limit functional shunting of oxygenated blood through the microvasculature as the blood mean transit time (MTT) decreases during hyperemia. 3
The topology and morphology of the cerebral microvasculature facilitates efficient oxygen extraction during hyperemia: Vascular anatomical modeling suggests that CTH falls in proportion to MTT in passive, compliant microvascular networks. 6 We recently found evidence of transit time homogenization beyond that of a passive mechanism in the somatosensory cortex of anesthetized mice: The CTH:MTT ratio, referred to as the transit-time coefficient of variation (CoV) decreased during electrical forepaw stimulation in mice, 7 supporting the existence of active, neurocapillary coupling mechanisms that facilitates capillary flow homogenization—and thereby efficient oxygen extraction—during functional activation. 3 The existence of such mechanisms is further supported by recent findings that (i) capillary flows homogenize before blood flow increases 8 and that (ii) capillary pericytes dilate prior to upstream smooth muscle cells, both in relation to functional activation in anesthetized mice. 9
In this study, we examine whether hyperemia without functional activation causes MTT and CTH to co-vary without parallel reductions in CoV, as one would expect in passive, compliant microvascular networks. Hypercapnia is known to cause vasodilation and homogenization of red blood cells (RBC) distribution in the capillary bed.10,11 We therefore used our previously developed two-photon microscopy (TPM) based methods to quantify changes in MTT and CTH 7 during hypercapnia, expecting to find little or no difference in CoV between normocapnic and hypercapnic states.
Materials and methods
Animal preparation
All procedures were conducted according to the regulations set by the Danish Ministry of Justice and Animal Protection Committees, with the Danish Animal Experiments Inspectorate Permit 2012-15-2934-00231 and reported according the ARRIVE criteria. Experiments were performed in adult male C57Bl/6NTac mice (13–15 weeks old), weighing between 24 and 30 g (mean = 26.29 ± 2.06 g). Mice were purchased from Taconic Bioscience, Inc. and were housed and kept on a 12-h light:dark cycle with free access to food and water until the day of the experiment.
During the surgical procedure, mice were anesthetized with isofluorane (2% in 30% oxygen for induction, and 1.75% for subsequent maintenance of anesthesia during surgery). A homeothermic path was used to keep the body temperature at 37 ℃, controlled via feedback from a rectal thermometer (HB 101/2, Harvard Apparatus, Holliston, MA, USA). A catheter was placed in the tail vein for maintenance of anesthesia during the TPM (see below). Catheters were also placed in the femoral artery to monitor mean arterial pressure (MAP) and heart rate (HR) using a BP-1 system (WPI, Inc., Sarasota, FL, USA) and extract blood samples for arterial blood gas analysis (ABL90 Flex, Radiometer Medical ApS, Brønshøj, DK), and in the femoral vein to allow administration of fluorescent dye. After tracheotomy and tracheal intubation, mice were mechanically ventilated with a SAR-830/AP ventilator (CWE, Inc., Ardmore, PA, USA) and end-tidal CO2 (eTCO2) was monitored by a micro-capnograph (Microcapstar, CWE, Inc., Ardmore, PA, USA) connected to the ventilator tube. Hydration was maintained by subcutaneous injections of 50-µL glucose 5% (w/v) every hour.
The mouse's skull was glued to a metal holding bar, which was attached to a custom-made head holder to minimize tissue motion during the TPM scan. The dura was punctured over the cisterna magna and cerebrospinal fluid (CSF) drained in order to avoid brain herniation. A cranial window of ∼3 mm2 in diameter was drilled through the right parietal bone. Then, the dura mater was removed and the cranial window was filled with a mixture of 1.5% agarose (Sigma–Aldrich, St. Louis, MI, USA) and artificial CSF (aCSF, DiacleanShop, Castrop-Rauxel, Germany), covered with a glass coverslip (5 mm diameter), and secured with cyanoacrylate adhesive and dental acrylic. After placing the mouse under the TPM, isofluorane administration was reduced to 1.5%, and alpha-chloralose infusion (50 mg/kg/h) initiated through the tail vein catheter. Isofluorane was slowly decreased to 0% over the following 10 min, and anesthesia was then maintained by alpha-chloralose infusion throughout the study. The mouse received pancuronium i.p. 0.4 mg/kg/h to reduce spontaneous respiration, and ventilated with 30% O2 in medical air. The experiment included measurements during normocapnia and hypercapnia, the latter induced by adding 5% CO2 to the inhaled air mixture. Blood gases were sampled before TPM examinations were initiated, and before and after the induction of hypercapnia. Base-deficit was managed by i.v. bicarbonate bolus injections (HCO3 + NaCl 0.9%, 75 mg/mL), when the deficit fell below 6 mmol/L.
Two-photon microscopy
Imaging was performed using a Praire Ultima-IV In Vivo Laser Scanning Microscope (Bruker Corporation, Billerica, MA, USA). We used a 10 × (0.30 numerical aperture—NA, 3.3 mm working distance—WD) water immersion objective (Olympus) for bolus tracking with a pixel resolution of 1.16–2.32 µm per pixel (1×–2×), depending on the optical zoom. A 20 × (1.0 NA 2.0 mm WD) water immersion objective (Olympus) was used for single capillary scans, with a pixel resolution between 0.19 and 0.23 µm per pixel, depending on the optical zoom used (5×–6×). To image the brain vasculature we used a 0.5% Texas-red solution (70,000 MW, 5 mg/mL in 0.9% NaCl, t1/2 25 min, Thermo Fisher Scientific), injected through the femoral venous catheter (mean volume: 138.57 ± 8.64 µL). The fluorescent dye was excited at 1100 nm by pumping an Optical Parametric Oscillator (OPO) with a Ti:Sa laser at 810 nm (Chameleon, Coherent Inc., Santa Clara, CA, USA). An OPO allows higher penetration in tissue, higher resolution, reduction of photobleaching and phototoxiticy during TPM scan.
12
The OPO allowed us to perform single capillary scans using less fluorescent dye, reaching cortical depths between 100 and 300 µm. Emission was detected by a GaAsP photo multiplier (PMT, Hamamatsu, H7422-40) using a 660/40 nm-emission filter. The TPM scan lasted between 1 and 1.5 h. Four kinds of acquisitions were performed:
(1) Pial vessel diameter: Pial vessels were scanned for 15 min after the inspired fraction of carbon dioxide (FiCO2) was increased to 5%. A scan path was prescribed over a zoomed area (1.5×–2×) of the field-of-view (FOV; 512 × 512 pixels; mean size: 0.89 ±0.22 µm2) selected for dye bolus tracking, prior to FiCO2 increase. The path was ascribed with the free-hand option of the microscope and we carefully selected the area to include arterial and venous vessels, placing the scan-line perpendicular to the vessel axis. An initial line-scan session was performed as baseline reference, and once the inhalation of 5% CO2 was initiated; line-scans sessions were repeated after 1, 2, 4, 6, 8, 10, 12, and 15 min to monitor diameter transition with CO2 over time. (2) Dye bolus tracking: Estimates of MTT and CTH were performed as previously reported.
7
Briefly, after identifying the shadows from the pial vessels by NADH auto-fluorescence (740 nm excitation) in a FOV of 1.19 mm2 (512 × 512 pixels), a first bolus was injected for the identification of arterial and venous vessels (20 s spiral scan, 6.25 frames per second, 512 × 512 pixel matrix, 1.6 µs dwell time per pixel). A scan path was then defined to intersect pial vessels of the upper cortex layer, using the TPM's free-hand option (PraireView, Bruker Corporation, Billerica, MA, USA). Lines were defined to cross the largest artery and vein within the FOV, as well as arterioles and venules. Then, repeated line-scans were performed (∼5.5 ms per line-scan path, dwell-time per pixel 1.6 µs) for a total scan time of 60 s. A 30 µL bolus of Texas-red dextran was injected at a rate of 60 µL/s, using a syringe infusion pump (GenieTouch, Kent-Scientific, Torrington, CT, USA), fifteen seconds after the commencement of the TPM scan. Bolus passage measurements were repeated two times in each physiological state (normocapnic/hyperapnia). (3) Capillary line-scans: Single capillary scans were interleaved between normocapnic and hypercapnic bolus imaging sessions. Two scan paths were prescribed in each capillary, one along the axis for red blood cells velocities (RBCv) estimations; and a transversal scan for cell flux (RBC flux) and diameter assessment. Capillaries were randomly selected within the FOV imaged during the bolus passage, down to a depth of 300 µm in depth. Scans were performed over 1–3 selected capillaries within a FOV sized 0.12 and 0.10 mm2 depending in the optical zoom performed (5 × or 6×), using a line-scan period of 1–4 ms. We aimed to scan at least 10 capillaries for each physiological condition in each animal. (4) Angiograms: An angiogram was acquired after the two boluses during each physiological state to visualize pial vascular topology. The region scanned was the same as the bolus tracking scans with a FOV of 1.19 µm2 (512 × 512 pixels) The angiograms consisted in 200–250 µm z-stacks, with 5 µm steps (optimal z-resolution: 10.41 µm).
Image analysis
Diameter estimations
Pial vessel diameter was estimated from line-scans obtained before and during the induction of hypercapnia, as previously described. 7 Briefly, the vessel diameters were estimated as the full-width at half-maximum (FWHM) values of the line profiles, assuming that the vessel intersects define their full diameters. The effect of hypercapnia on the vessel diameter was quantified as relative changes in the vessel diameter (rDiam), using the baseline scan (normocapnia) as reference. The arterial and venous networks were divided by quintiles and the effect of hypercapnia after 15 min was evaluated in each subpopulation, using the baseline scan as reference.
Bolus passage analyses
We estimated MTT, CTH, and CoV by modeling the transport function from a bolus tracking injection as previously described. 7 We identified the primary inputs and outputs within each FOV scanned. Each FOV scanned had at least one main pial artery or feeding artery and one main draining vein. In cases with more than one main artery (d > 30 µm) and/or vein (d > 60 µm), the selection of the arterial input (AIF) and venous output functions (VOF) was based on their diameter (determined by vessel segmentation) and the time-to-peak (TTP) of their concentration–time-curve (CTC). The AIF was chosen as the CTC of the large-diameter vessel, which was first to enhance after bolus injection, whereas the VOF was identified as the CTC of the large vein, which was last to enhance. We then identified diving arterioles (10 < d < 30 µm) and ascending venules (10 < d < 60 µm). From these, we selected the input arterioles based on vessel TTP and paired them with venules that appeared anatomically connected through the capillary bed based on the 10 × angiograms. We analyzed the dye transport between paired vessels at the following levels of the microcirculation: S1: artery to vein, S2: artery to venule, S3: arteriole to venule, and S4: arteriole to vein.
We modeled the passage of a fluorescent dye from arterial to venous network in terms of a vascular transport function, which describes the relative amount of dye emerging at the venous vessel as a function of time after an idealized, instantaneous bolus injection into the arterial vessel. The transport function was modeled by a gamma probability density function with two-shape parameters α and β and a scaling factor, f. Other approaches include second-order-plus-dead-time approach,
13
but we chose the gamma distribution for its widespread use in physiological models of vascular transport, and to ensure solutions without un-physiological fluctuations. Moreover, MTT is conveniently estimated as the mean (αβ) and CTH as the standard deviation (
Capillary kinetics estimation
We estimated the RBCv, RBC flux, and capillary diameter from the axial and transversal single capillary scans as previously described. 7 Velocity was calculated using the Radon transformation algorithm, 14 within time intervals of 150 ms of the scanned vessel, displacing our starting point by 40 ms for every iteration. Intervals with low signal to noise ratio (SNR) (<5) were identified and the velocity estimate was assigned the mean of the previous and next points with SNR >5. RBC flux was estimated by analyzing the intensity variations that occur in the cross-section scan of each capillary, derived from 150 ms time intervals within the transversal line-scans. Capillary diameters were estimated from cross-sectional scan, analyzing only the maximum intensity from the plasma, avoiding the noise produced by the cell's shadows. Vessels with an inner diameter ≥10 µm were considered arterioles or venues and thus ignored for further analysis. In some cases, poor image quality caused our post-processing software to return unrealistically high values. Therefore, capillaries were excluded from further analysis if they revealed extreme RBCv or RBC flux (±3 SD from the mean). We also made independent estimates of MTT, CTH, and CoV during each physiological state, based on the RBCv and RBC flux measurements, as previously described. 7
Post hoc analysis
In order to evaluate the change in oxygen availability during hypercapnia, we related our estimates of MTT and CTH, as derived from all segments, to predictions of the cerebral metabolic rate of oxygen (CMRO2) and the oxygen extraction fraction (OEF) based on Jespersen & Østergaard's model, 3 as described earlier. 7 For this calculation, we assumed a fixed tissue tension equal to 25 mmHg for normocapnia as in our earlier work performed. 7 For hypercapnia, we predicted CMRO2 based on a tissue oxygen of 30 mmHg as in our earlier study, 3 and 34 mmHg as extrapolated from TPM measurements of intravascular oxygen tension during normocapnia and hypercapnia. 15 Accordingly, we calculated the maximum relative intravascular oxygen tension change in the venular network from normocapnia to hypercapnia as observed in Figure 3(a) of reference 3 (≈36%, corresponding to 34 mmHg). The arterial oxygen concentration C A was estimated from the hemoglobin (Hb) measured by the blood gas analyses before and after the induction of hypercapnia.
Statistical analysis
We used R (R Core Team, 2012) for statistical analysis. MAP, HR, BR, and eTCO2 were analyzed for each bolus scan constructing a linear mixed model (LMM) with the physiological variables as predictor (dependent), the physiological status (normocapnia/hypercapnia) as fixed effect, and subjects as random effect (two bolus per subject and per status).
The changes in blood gases between normocapnia and hypercapnia were analyzed with a paired t-test. The effect of hypercapnia in pial vessel diameter was analyzed between the first (normocapnia, time 0) and the last scan (hypercapnia, time 15 min) by a paired t-test, in each of the vessel networks. To estimate the time when the significant increase of diameter was reached in each network, a linear mixed model (LMM) was constructed for the relative change of diameter as predictor, time as fixed effect and subjects as a random effect. The analysis of the bolus tracking estimates was performed constructing a LMM with the hemodynamic parameters as dependent variables and the physiological status (normocapnia/hypercapnia) as fixed effect, with intercepts for subject as random effect. Each model was constructed for each segment (S1–S4). The effect of hypercapnia on capillary kinetics was analyzed constructing LMM, assigning the hemodynamic parameter as dependent variable and status as fixed factor and subjects as random effect. A simple linear regression was calculated to predict RBCv, RBC flux, and diameter changes during hypercapnia based on cortical depth. The results are expressed as the mean ± SEM.
Results
Systemic physiological parameters
Six mice underwent bolus-tracking to evaluate the effect of hypercapnia on cerebral hemodynamics. Inhalation of 5% CO2 induced moderate to severe hypercapnia, reducing pH from 7.39 ± 0.04 to 7.16 ± 0.06 and increasing pCO2 from 36.88 ± 5.08 to 66.30 mmHg ±11.02 mmHg. The inhalation of 5% of CO2 did not result in significant changes in MAP. HR decreased significantly after the induction of hypercapnia (p < 0.001, supplementary material Table s1 and Figure s1). The total duration of the experiments during which TPM was acquired was between 1 and 1.5 h.
Pial diameter
The inhalation of 5% of CO2 produced the expected dilation through the pial vasculature (Figure 1). After the induction of hypercapnia, the diameter of arteries and arterioles increased by 21.15 ± 3.75% (N = 14 vessels, p < 0.001, confidence interval (CI): 13.40–29.61) and 27.71 ± 3.55% (N = 32 vessels, p < 0.001, CI: 20.47–34.95), respectively. Veins and venules showed a smaller but still significant increase in relative diameter after 15 min of hypercapnia of 2.07 ± 0.57% (N =14, p = 0.003, CI: 0.83–3.31) and 4.89 ± 0.84% (N = 52, p < 0.001, CI: 3.19–6.58), respectively (Table s2). After dividing the arterial and venous network by quintiles, we observed that most of the subpopulations in each network had a similar increase in the inner diameter after 15 min of hypercapnia, see Figure 1.
Vessel diameter was estimated using the cross-sectional segment of each pial vessel. (a) A scan path was ascribed over a zoomed area of the field-of-view. (b) Representation of the line scanned by time and length in micrometers. (c) The vessel diameters were estimated as the full-width at half-maximum (FWHM) values of the line profiles, assuming that the vessel intersects define their full diameters. In the arterial network, a significant increase in inner diameter was observed after 2 min of 5% CO2 inhalation (d: arteries; g: arterioles). The response in veins (e) and venules (h) were delayed by 4 and 8 min after initiation of the CO2 inhalation, respectively. The mean relative change (rDiam) in the inner diameter after 15 min of the inhalation of CO2 is expressed in each plot. After dividing the arterial (f) and venous (i) network into quintiles, most of the subpopulations in each network had a similar increase in the inner diameter after 15 min of hypercapnia *p < 0.05, ***p < 0.001, error bars = SEM. Scale bar = 200 µm.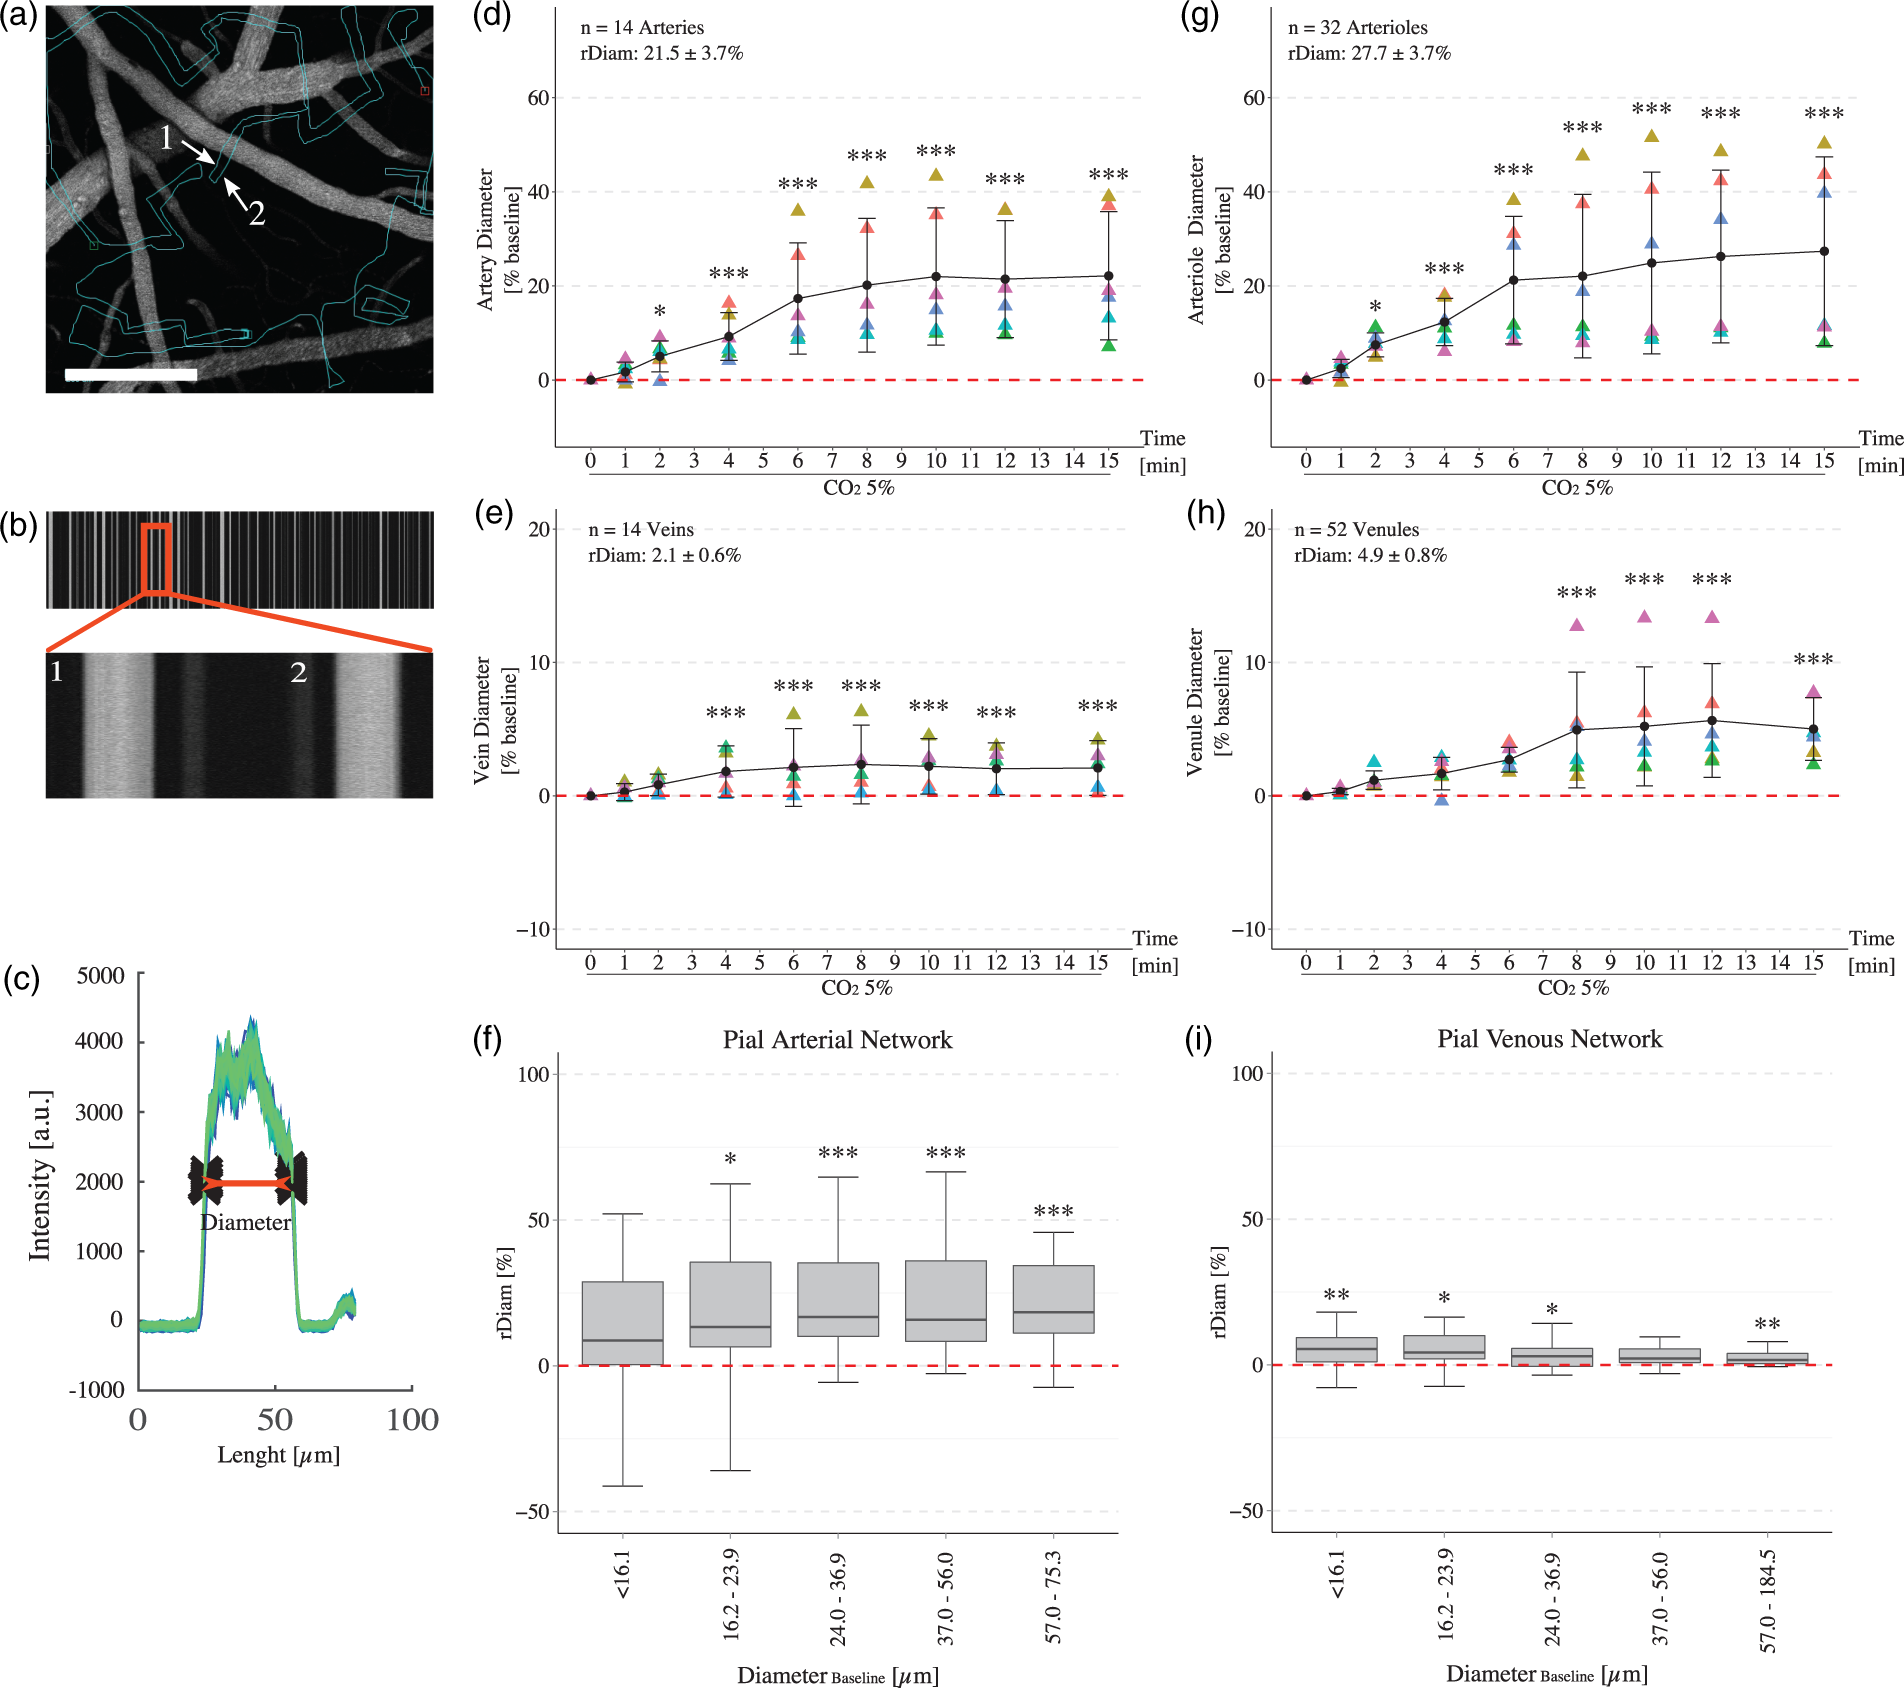
Bolus tracking measurements
Pial vasculature hemodynamics as measured by bolus tracking imaging during normocapnia and hypercapnia (n = 6).
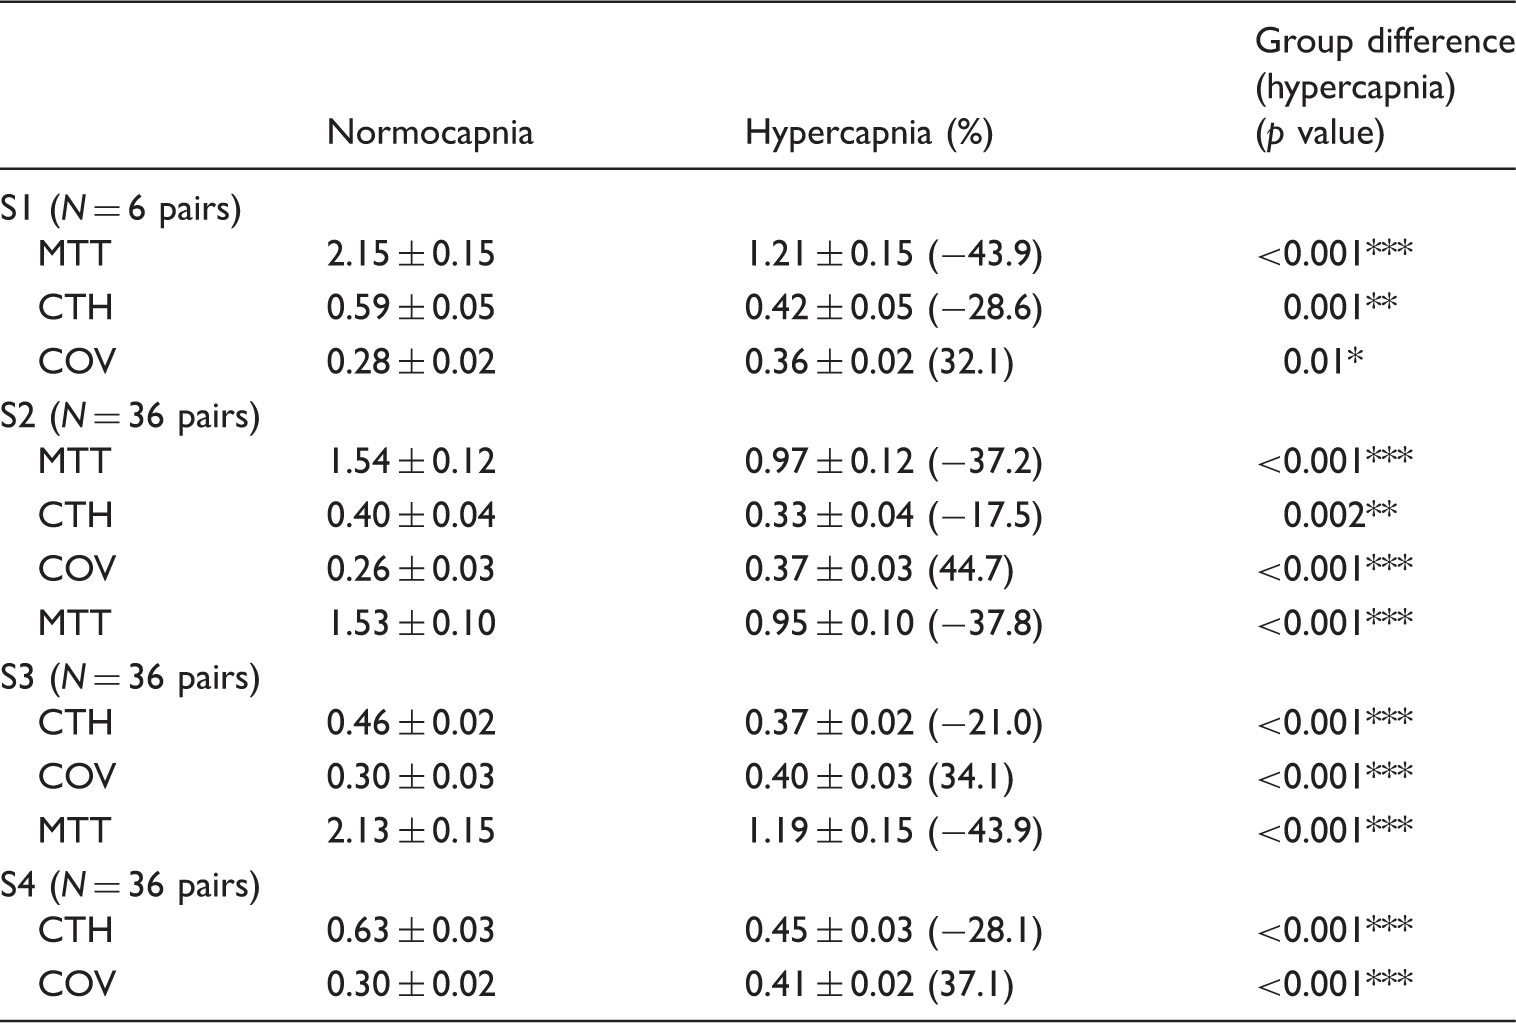
Note: The segments were assembled by pairs of the vessels selected (S1–S4).
*p < 0.05, **p < 0.01, ***p < 0.001.
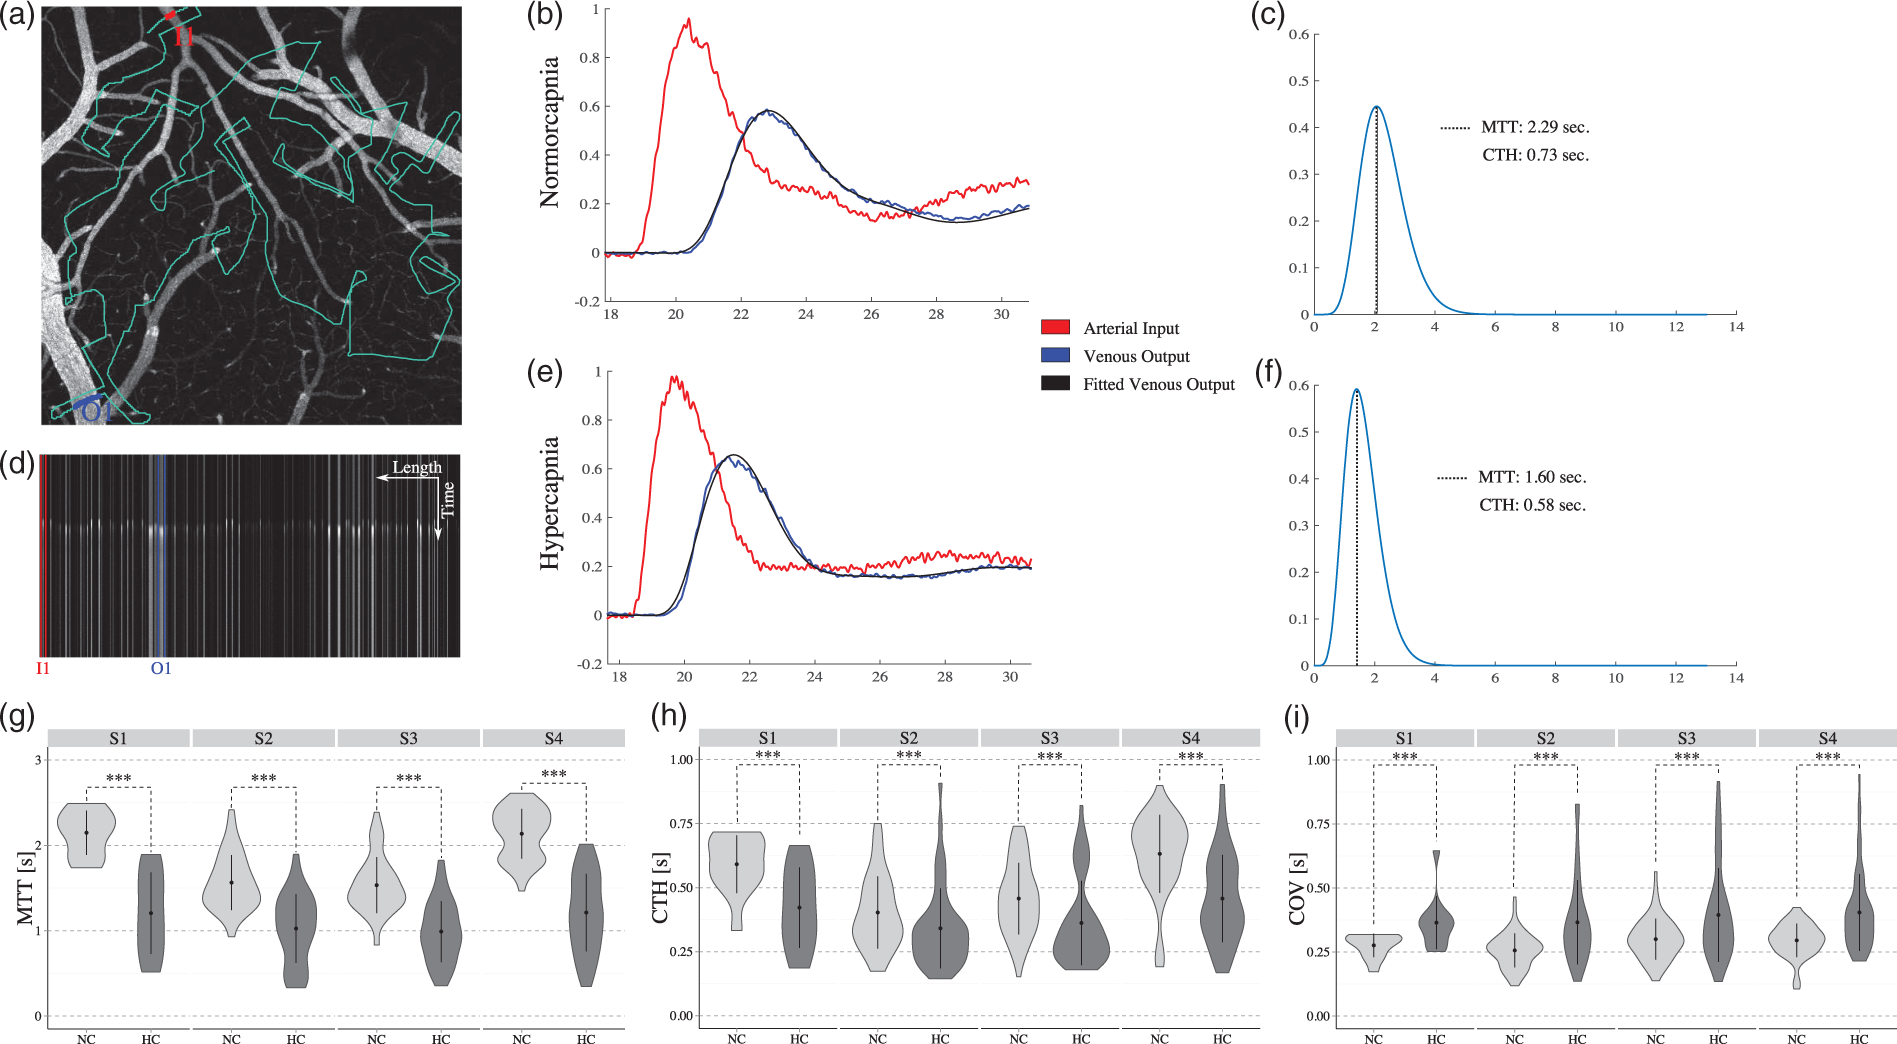
(a, d) Identification of AIF and VOF by 20 s spiral-scan at 6.5 fps (512 × 512 pixels, dwell time per pixel = 1.6 ms). AIF and VOF intensity curves for the estimation of MTT and CTH by modeling the transport function from a bolus tracking injection during normocapnia (b, c) and hypercapnia (e, f). Violin plot of MTT (g), CTH (h), and CoV (i) estimates from bolus tracking measurements through all the vascular segments during normocapnia (NC) and hypercapnia (HC). S1: artery–vein; S2: artery–venule; S3: arteriole–venules; S4: arteriole–vein. *p < 0.05, **p < 0.01, ***p < 0.001, error bars = SD.
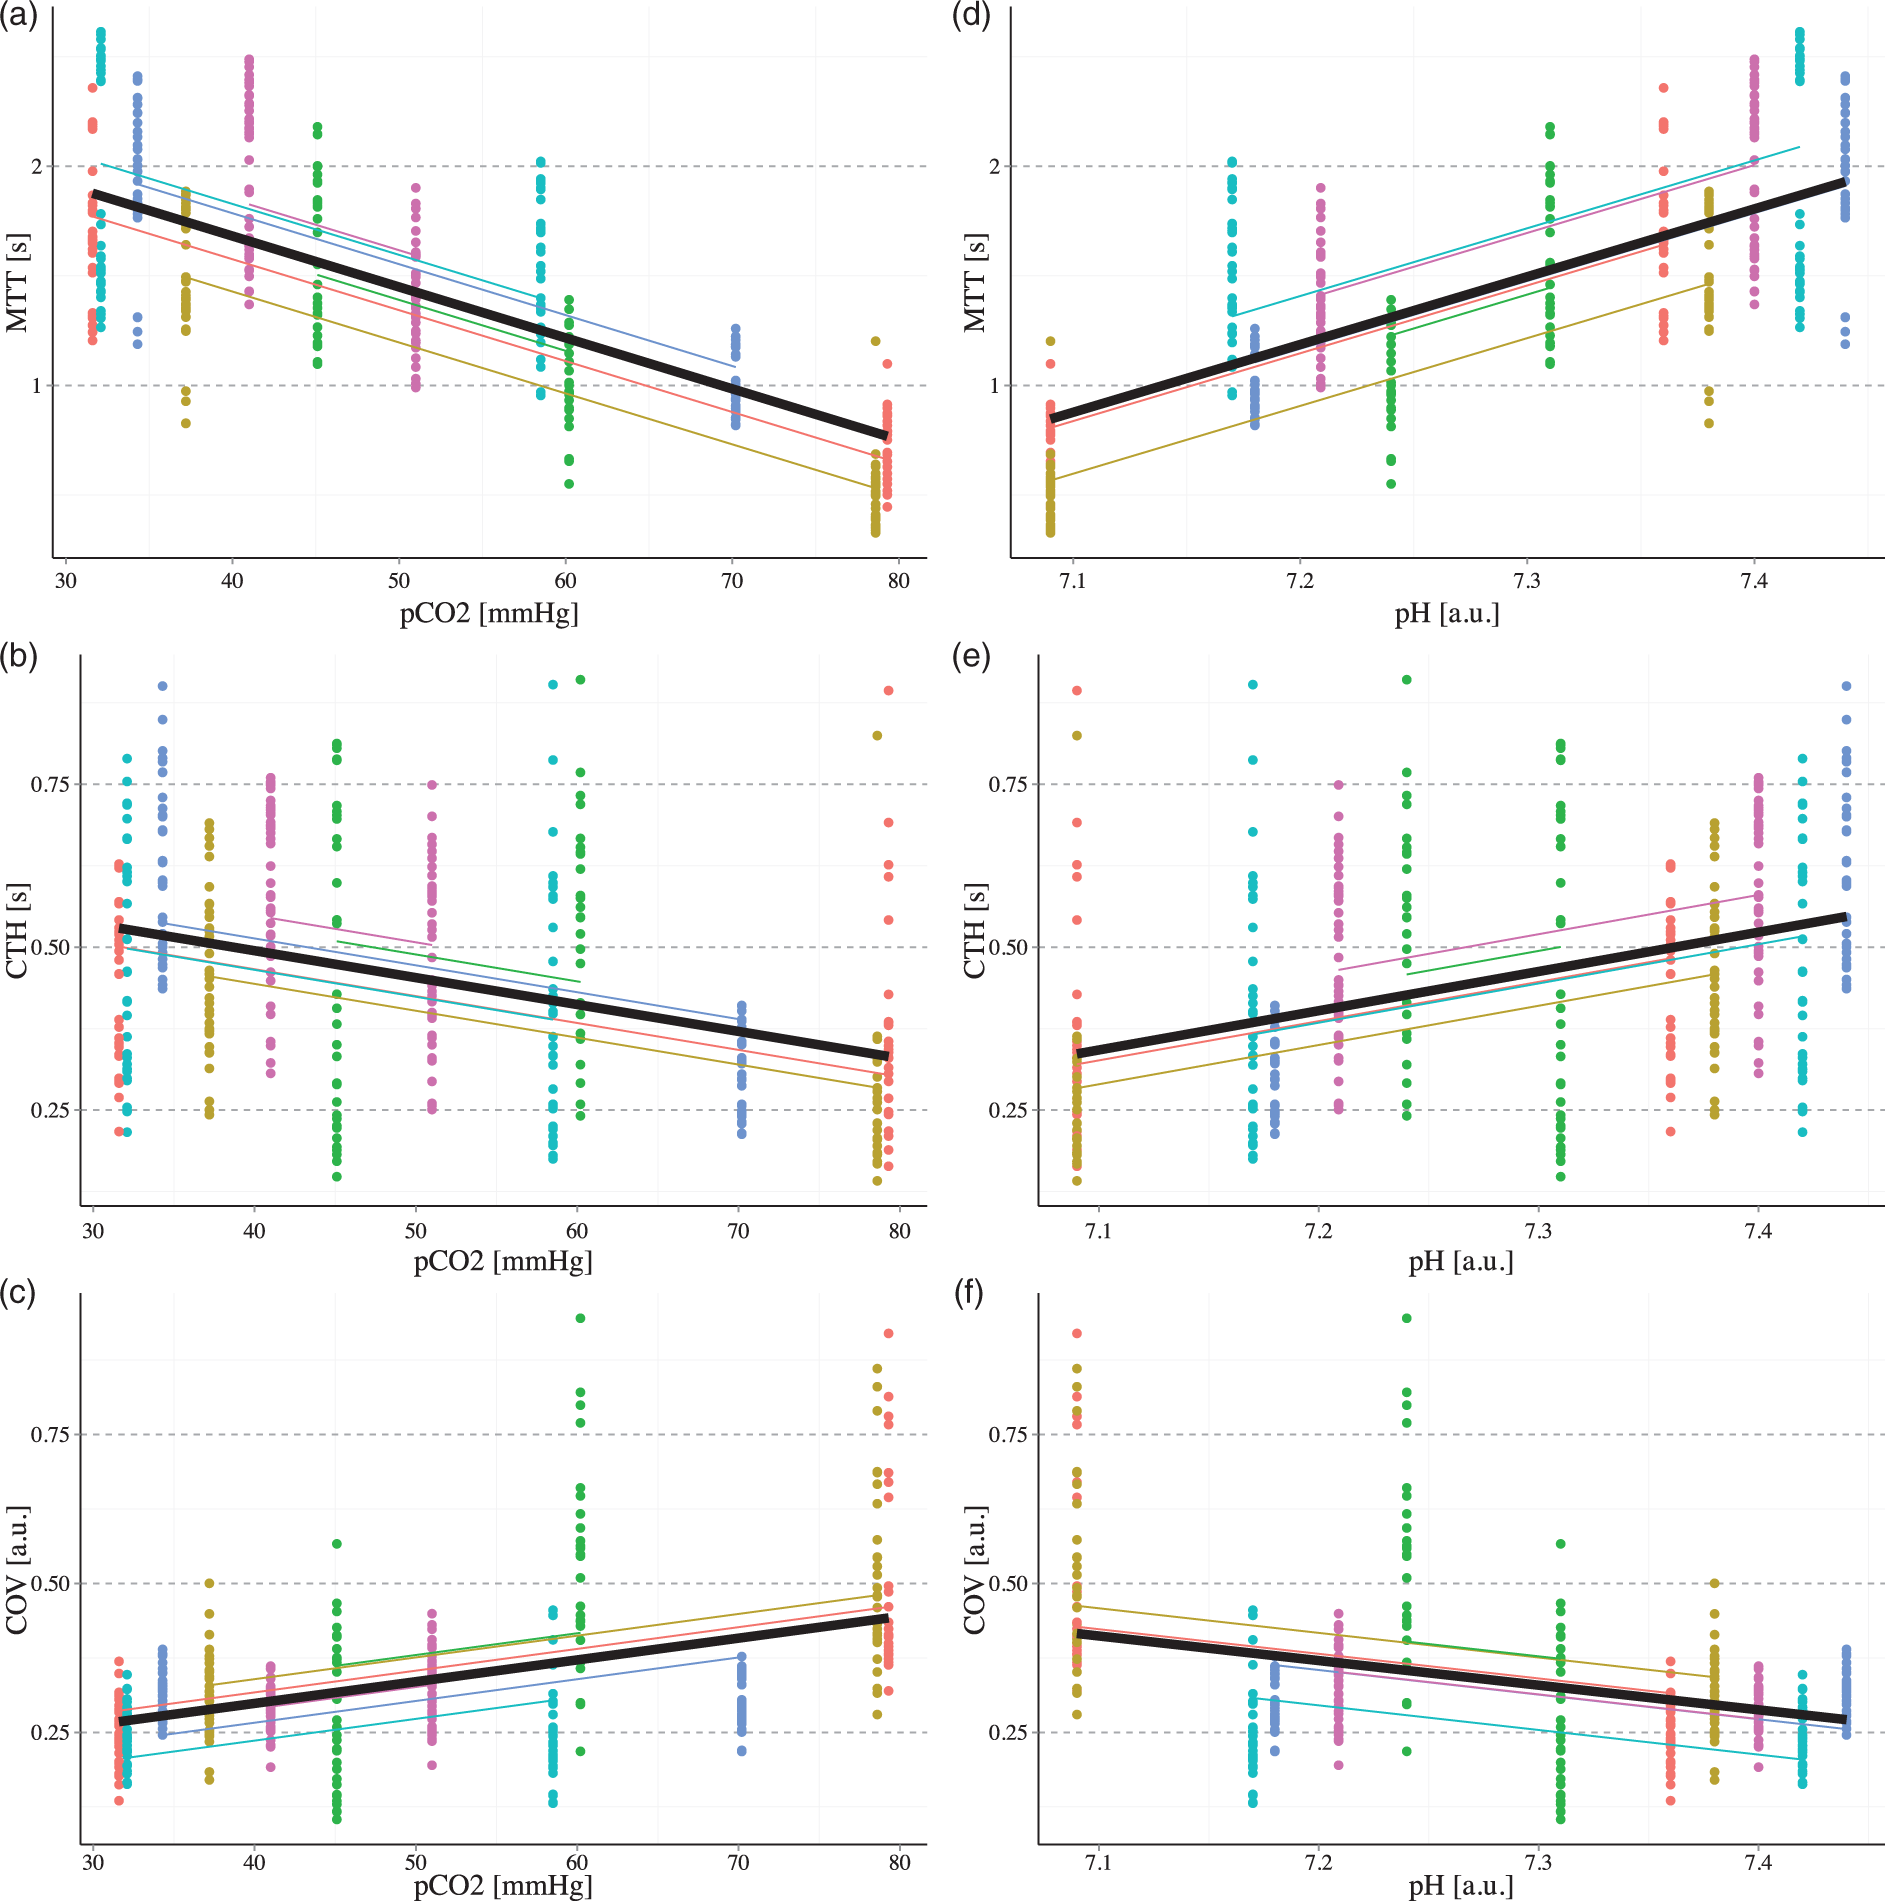
Scatter plot describing the predictions for each animal (color slope) and the mean (black slope) for MTT, CTH, and CoV as a function of pCO2 (a–c) and pH (d–f). Each point represents transits from artery/arteriole to vein/venule and the corresponding parameter estimates for these pairs as obtained from the bolus tracking measurement.
The post hoc analysis showed that oxygen availability was largely unaltered or even reduced during the hypercapnic hyperemia, due to the parallel changes in CTH and tissue oxygen tension (Table 3 and supplementary material Figure s3). Thus, predicted CMRO2 decreased by 10.0% in S3 for an assumed tissue oxygen tension of 34 mmHg and increased by 4.4% for an assumed oxygen tension of 30 mmHg, respectively.
Red blood cells hemodynamics
Estimations of capillary kinetics during normocapnia and hypercapnia as estimated from single capillary scans.
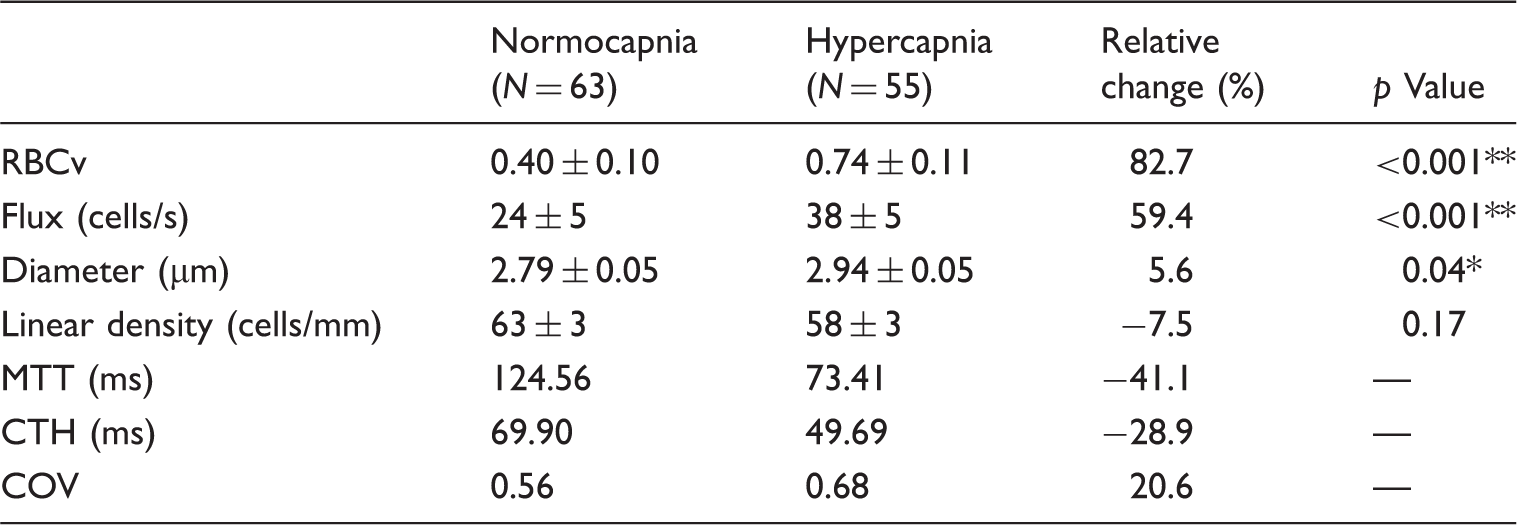
Note: Estimations of MTT, CTH, and CoV were performed in both states among the capillaries scanned in each group, setting a fix length of 48 µm. MTT: mean transit time; CTH: capillary transit-time heterogeneity; CoV: coefficient of variance; RBCv: red blood cells velocity.
*p < 0.05, **p < 0.01, ***p < 0.001.
Estimates of CMRO2 and OEF based on CTH and MTT measurement by bolus tracking during normocapnia and hypercapnia.
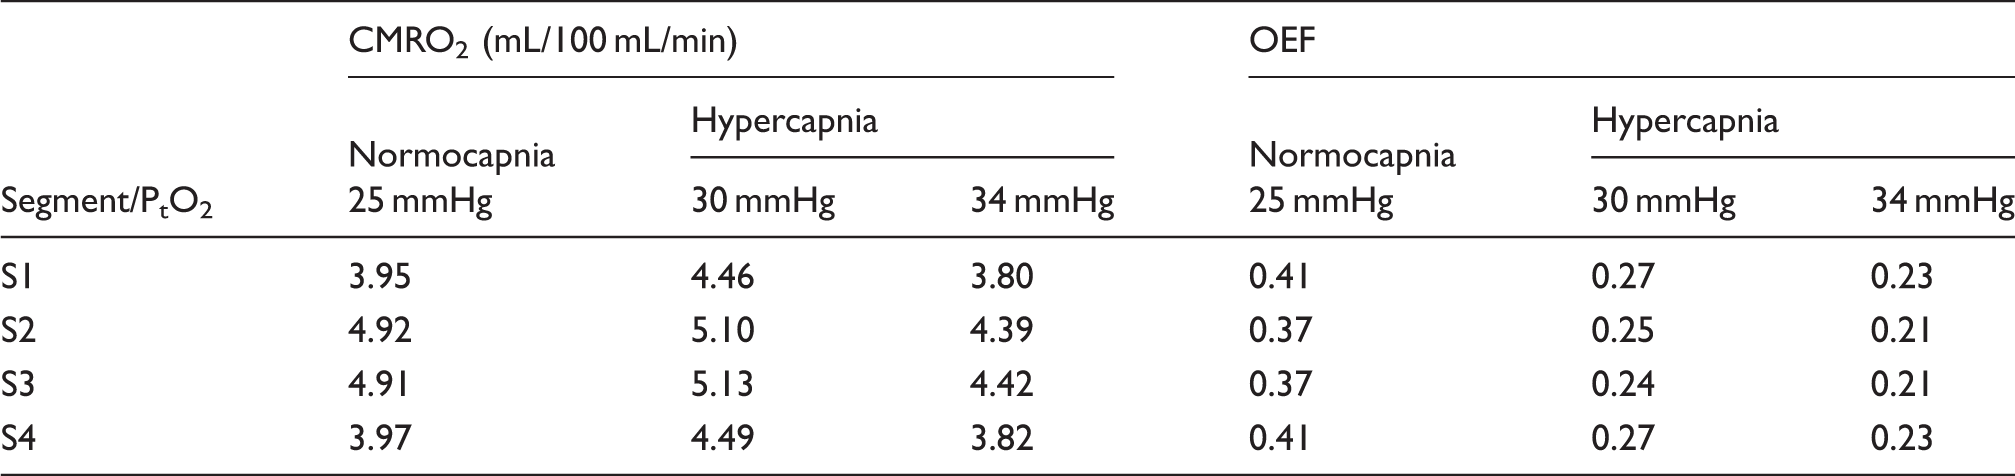
Note: Estimations of CMRO2 and OEF during normocapnia (C A = 21.42 mL/100 mL) were performed assuming a tissue oxygen tension of 25 mmHg. During hypercapnia (C A = 20.74 mL/100 mL), tissue oxygen tensions of 30 and 34 mmHg were assumed based in the literature to illustrate the sensitivity of the estimates to the choice of tissue oxygen tension.
We aimed at acquiring measurements from identical capillaries during both states, but interleaving the capillary scans between normocapnic and hypercapnic bolus tracking required changing the objective for every TPM scan mode. This made it difficult to identify the same capillary during both states. However, we successfully scanned 57 capillaries in both states through the six animals, and calculated the relative change of each parameter. We discarded two capillaries due to extreme changes in RBCv and RBC flux (more than 3 SD), which we ascribed to artifacts. We observed that lower baseline-flux capillaries saw greater RBC-flux increase than those with higher baseline flux (N = 55, p = 0.028, Figure 4). Out of the 55 paired capillary recordings, 17 capillaries showed a significant reduction of their inner diameter during hypercapnia, averaging 7.1%. In those capillaries that dilated during hypercapnia (n = 38), the mean increase was 14.8%. A similar effect was observed in RBC flux, where 14 capillaries showed a decrease of 18.7%.
(a) Reference 2-D image of two capillaries scanned during normocapnia and hypercapnia, respectively. The lines prescribed to perform the line-scan image passed through the vessel along its axis (red) for RBCv estimations and perpendicular (blue) to the vessel axis for RBC flux and diameter calculations. Distributions of RBCv (b, c) and RBC flux (e, f) during baseline and hypercapnia of the capillaries scanned in both states (n = 55). (d, g) Relative change (Δx/x) in RBCv and RBC flux, as a function of average baseline, induced by hypercapnia. RBC flux showed a correlation between the relative change during hypercapnia and the resting flux (p = 0.028). (h–j) Deeper layers showed a smaller relative change in RBCv ([slope] ≈ 0.79% µm−1, p = 0.02) and rDiam increase ([slope] ≈ 0.17% µm−1, p = 0.002). A similar tendency was observed for rFlux ([slope] ≈ 0.80% µm−1, p = 0.06). (k–m) The paired capillaries were analyzed with respect to diameter and no significant difference between capillary sizes was observed in the response to hypercapnia. *p < 0.05, **p < 0.01, ***p < 0.001. Error bars = SD. Scale bar = 20 µm.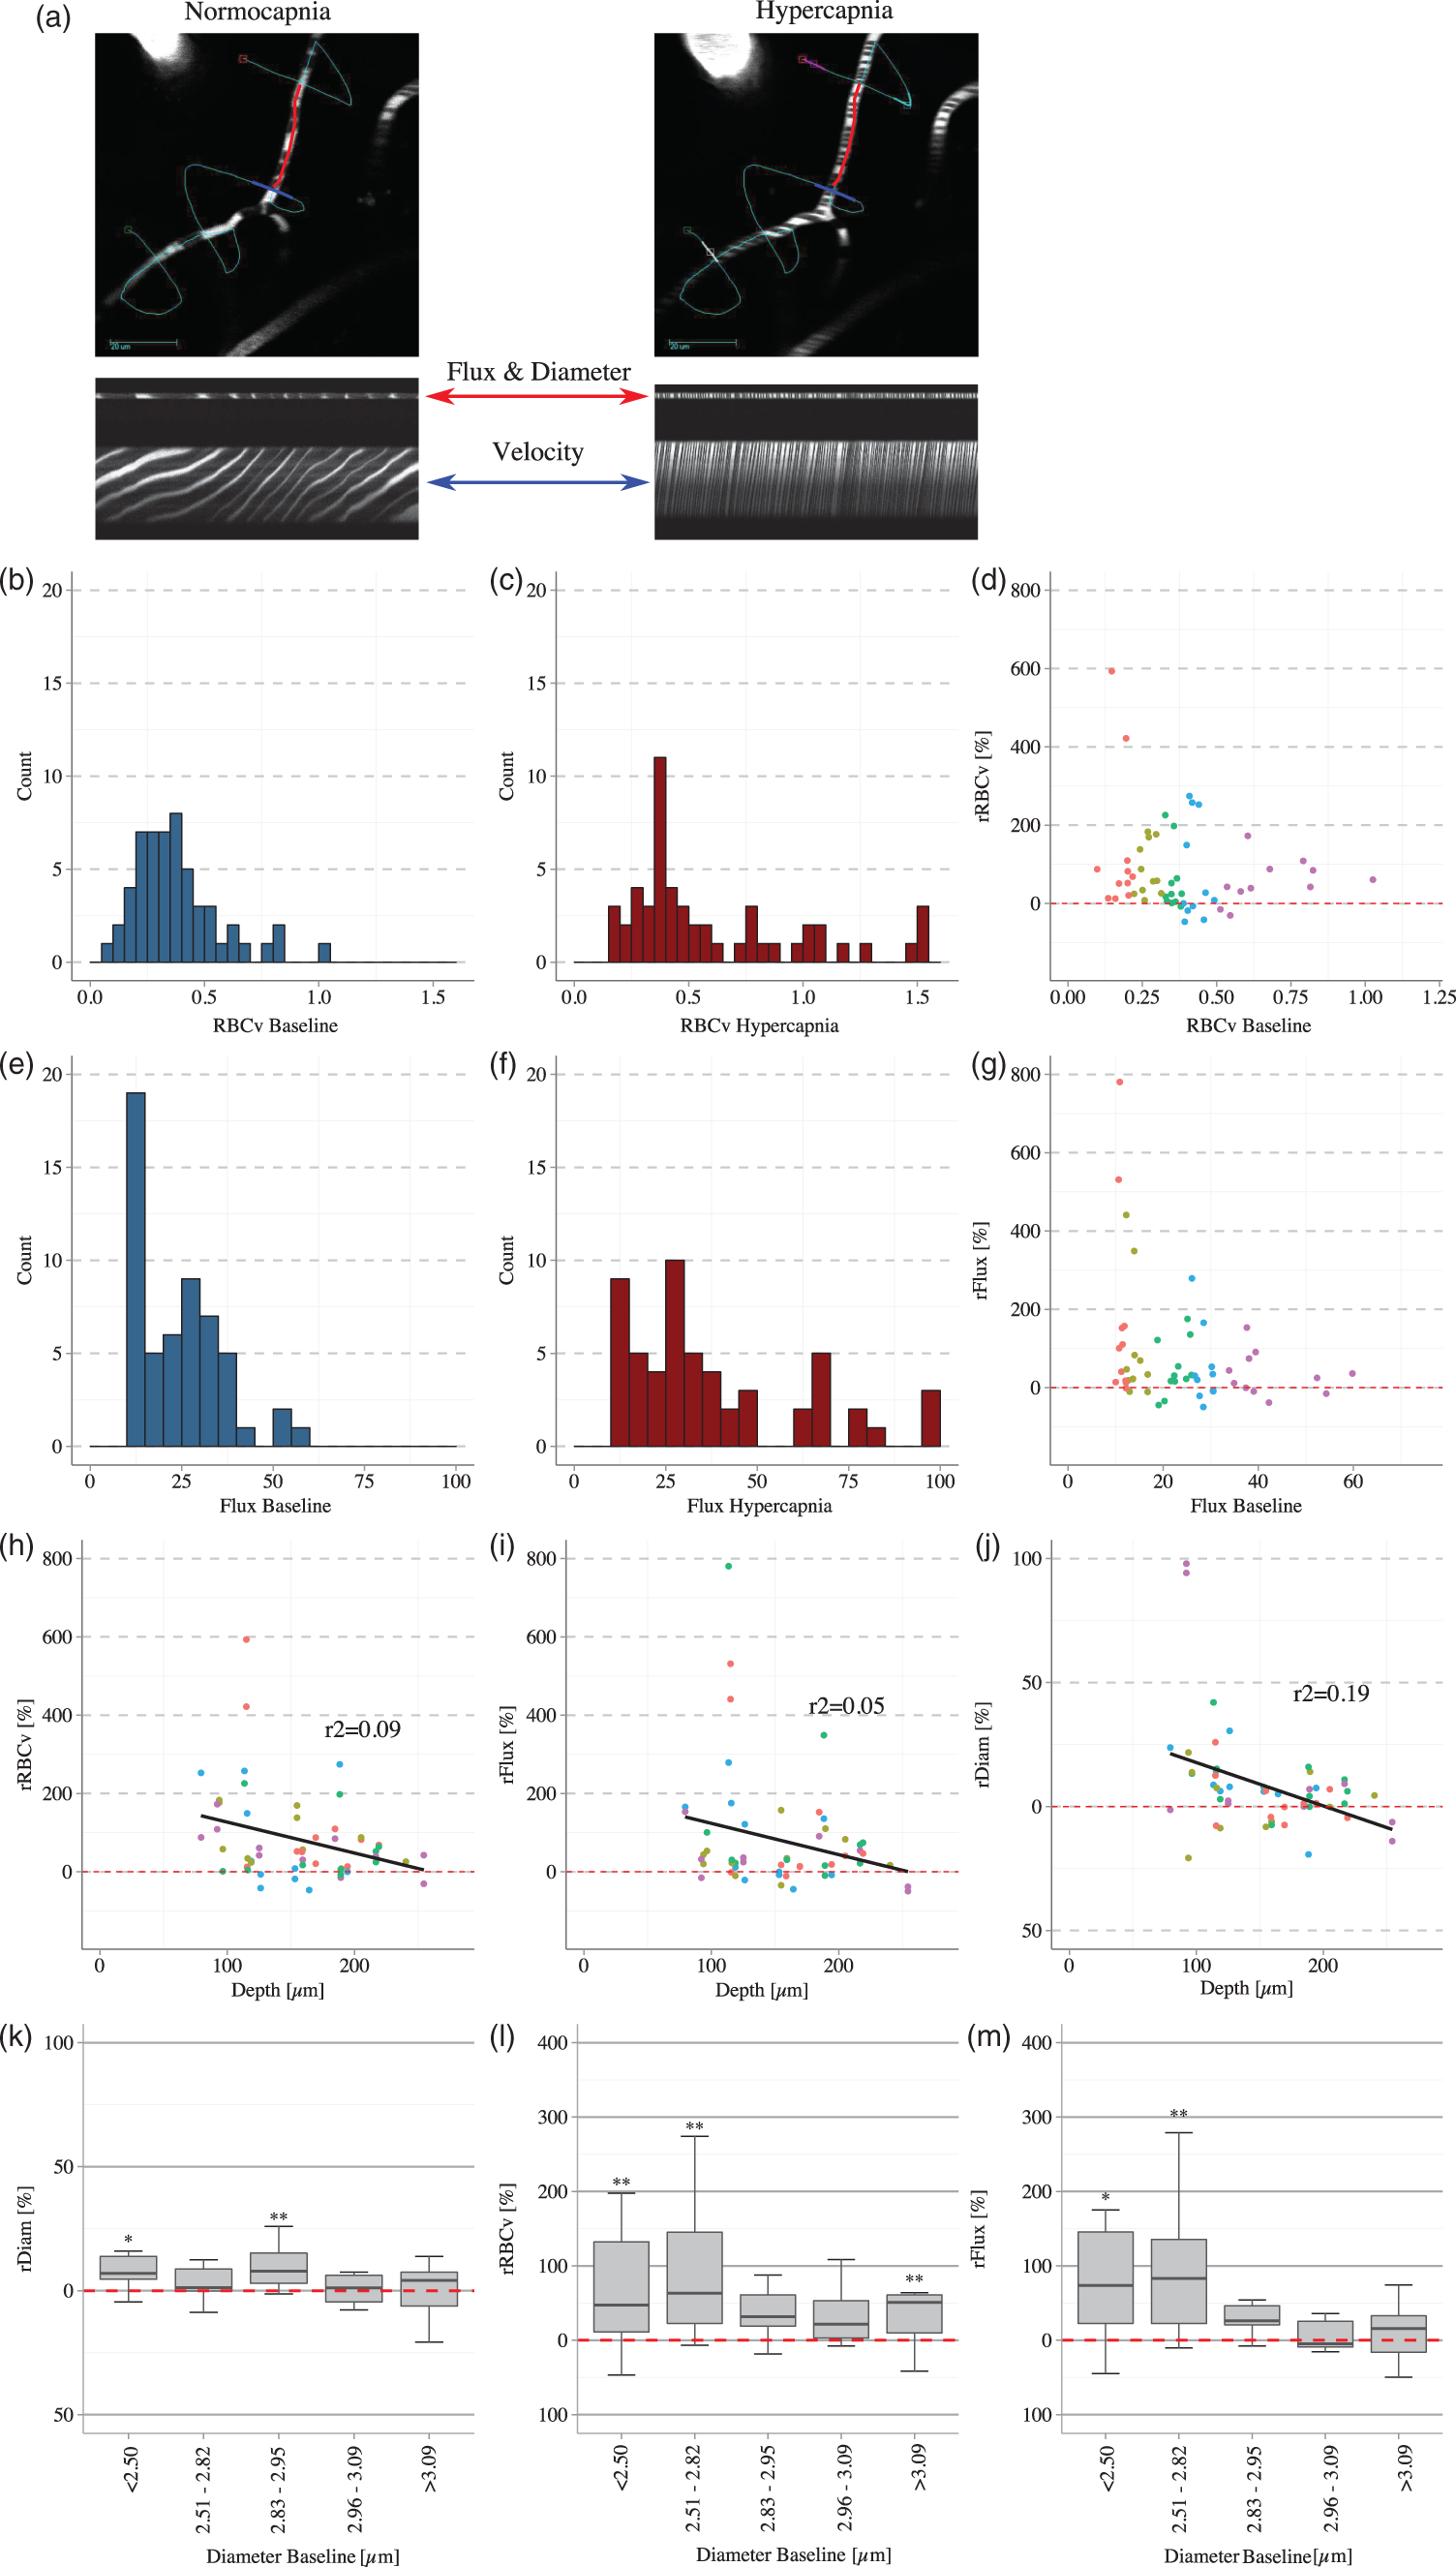
We observed a significant dependence of rRBCv (p = 0.02) and capillary rDiam (p = 0.002) on cortical depth. Under hypercapnia, deeper regions showed a slightly lower rRBCv ([slope] ≈ 0.79% µm−1) and rDiam increase ([slope] ≈ 0.17% µm−1). A similar tendency was observed for rFlux ([slope] ≈ 0.80% µm−1, p = 0.06). The largest changes in diameter, RBCv and Flux were observed in the smallest capillaries (see Figure 4).
Blood flow, MTT, and CTH estimations from capillary RBC kinetics
Hypercapnia caused an overall 83% increase in RBC velocity and a 59% increase in flux (Table 2). Based on individual capillary RBCv and flux measurements, we estimated segment MTT, segment CTH, and segment CoV as previously described,4,7 assuming a mean segment length of 48 µm, which was the mean length of the capillary segments scanned. Consistent with our bolus tracking results, hypercapnia reduced segment MTT and segment CTH by 41.1% and 28.9%, respectively, resulting in a CoV increase of 20.6% during the hypercapnic condition (Table 2).
Discussion
In this study, we analyzed the effect of hypercapnia on microvessel diameters and RBC kinetics in mouse brain cortex using TPM, and used both a bolus-tracking indicator dilution method and single capillary scans to estimate MTT, CTH, and CoV as previously described. 7
Our analyses showed consistent vasodilations and hyperemia in response to hypercapnia, and plasma MTT and CTH both decreased during hypercapnia as expected. The decrease in MTT was larger than that showed in previous observations during mild hypercapnia, 16 possibly indicating that MTT and CTH changes depend on the magnitude of change in pCO2 and pH (Figure 3). Our findings of parallel MTT and CTH reductions in hypercapnia are consistent with earlier calculations3,4 which were based on literature data. 11 Unlike our previous findings in functional hyperemia, the CTH:MTT ratio CoV increased, during hypercapnia. Accordingly, capillary flow patterns homogenized less than one would expect in a passive, compliant microvascular network during hypercapnia, rendering oxygen extraction less efficient during the accompanying hyperemia.
Capillary pericytes have recently emerged as a key effector cell in neurovascular function, 9 but the effects of CO2 and pH on cerebral pericyte tone remains poorly understood. In vitro studies of retinal pericytes, however, suggest that pericyte constriction and relaxation is highly regulated by tissue oxygen tension and lactate levels, 17 as well as nitric oxide (NO) 18 and extracellular pH. 19 These properties have led to the hypothesis that pericytes tend to dilate when oxygen tension is low and lactate concentrations high, but constrict when oxygen tension is high and lactate concentrations either low or normal, thereby dynamically redirecting RBCs to capillaries with the highest metabolic needs. The extreme hyperemia and accompanying increase in tissue oxygen tension during hypercapnia could therefore lead to sporadic capillary constrictions on one hand, while creating a need for blood to pass quickly from the arteriolar to the venular circulation (“shunt flow”), on the other. Accordingly, we observed that 37% of the paired capillaries (n = 55 capillaries) showed a reduction in the inner vessel diameter, and 25% in RBC. Both of these changes in microvascular hemodynamics would tend to increase CTH relative to MTT, and hence to cause CoV to increase. CoV changes indeed correlated strongly with the level of hypercapnia throughout all vascular segments as shown in Figure 3. In support of “shunt flow,” earlier studies have reported the existence of vascular bypasses, so-called thoroughfare channels (TFC). These have been observed in humans at the superficial and deep cortical layers, as well as periventricular regions. 20 TFC are also thought to exist in murine models, supported by the identification of a small number high speed microvessels that lack autoregulation. 21 The existence of TFC is also supported by the observation of oxygen advection from arterioles to venules during steady state and its increase during hypercapnia, as demonstrated by direct intravascular pO2 measurements by TPM. 15 In our data, the outliers showing an increase in CTH showed in Figure 2 might represent TFC or segments connected to it. However, our low-resolution angiograms did not allow us to address the presence of TFC in our study.
Hypercapnic hyperemia increases tissue oxygen tension. 15 To calculate the contour plots of oxygen availability (CMRO2) for measured MTT and CTH values, we therefore had to choose literature oxygen tension values for the hypercapnic and normocapnic condition, respectively.15,22 The arterial concentration of oxygen was adjusted for each physiological state based on small changes in hemoglobin concentration. We ascribe the reduction of hemoglobin and hematocrit to repeated blood sampling for blood gas analyses. Our predictions suggest that oxygen availability changes little during hypercapnic conditions (Table 3). Paradoxically, flow-metabolism coupling may thus be preserved during hypercapnia despite the parallel increase in CBF. During normocapnia, our CMRO2 predictions in S3 (4.27 mL/100 mL/min or 1.77 µmol/g/min) were similar to those observed in rats using 17O MR spectroscopy, which reported CMRO2 values of 1.51 ± 0.0623 and 2.26 ± 0.18 µmol/g/min, 24 respectively. Moreover, our OEF predictions for normocapnia and hypercapnia were similar to those reported using direct measurements of intravascular oxygen tension with TPM. 15
Analyzing the single capillary scans, as the mean of all subjects (N = 6), we observed that hypercapnia produced a robust increase in RBCv (82.7%) and RBC flux (59.4%), which is consistent with previous measurements performed with TPM.11,25 Furthermore, we observed that capillaries with lower RBC flux during steady state display large increases in flux during hypercapnia, whereas high flux capillaries display relatively more modest increases during hypercapnia, consistent with a homogenization of fluxes (Figure 4). This has been observed previously at higher sampling scale using optical coherence tomography (OCT), in an experiment showing that the distribution of RBC flux homogenizes during hypercapnic conditions. 26 Interestingly, absolute and relative changes in single capillary estimates during hypercapnia were similar to the bolus tracking measurements, suggesting that even with the possible difference between plasma and cells transits times, both co-vary during a robust increase in CBF (Table 2). This is in contrast to our previous measurements showing that during functional activation, the relative change in plasma MTT and CTH, and the estimates from single capillary scans were not similar. Also, we observed that the changes in MTT, CTH, and CoV reflected layer-specific changes and we related this behavior to the different metabolic demands during functional activation. 7 The co-variation of the relative changes in plasma and erythrocytes during hypercapnia observed in this study represents a “global” dilation from the upper vasculature down to capillary bed. Further studies with larger sample volume might elucidate the possible difference of plasma and cells transit times, as well as the response to different protocols to disturb the brain hemodynamics. We observed a depth dependency of capillary hemodynamics during hypercapnia. Relative changes in RBC velocity and flux, and in inner capillary diameter, were smaller at deeper cortical layers. This is in contrast to recent observations that have shown the opposite effect for RBC flux during hypercapnia, with deeper capillaries showing a greater flux increase. 26 A similar depth dependency was observed in our previous report during functional activation, as expected for cortical regions with higher metabolic demand such as layer IV. 7 Moreover, it has been shown that during functional activation, there is a gradual delay in the capillary dilation with a decrease in the cortical depth. 27 If flow-metabolism coupling is indeed preserved during hypercapnia, and the resulting “un-physiologic” CBF increases thus threatens the efficient extraction of oxygen to meet the metabolic needs of the tissue, then hypercapnia-induced flow increases would be expected to be limited according to a “ceiling” determined by local resting metabolism. Accordingly, intrinsic flow-metabolism coupling mechanism would attenuate hypercapnia-induced flow increases more in cortical layers with high metabolic demands (deeper layers) than in more superficial layers. The same flow-metabolism coupling mechanisms would, however, be expected to display the opposite depth-dependence of hemodynamic responses during functional activation, in that the increase in metabolic needs is now higher in deeper layers. Our conclusions are limited by the small number of capillaries scanned per mouse, especially in deep cortical layers. This hypothesis should therefore be explored further in future studies.
Limitations to our study
The changes in brain physiology in response to hypercapnia in our study were slow, taking many minutes to peak. Previous studies have shown that these changes are relatively fast with more sustained increase in CBF. 28 In our experimental setup, the induction of hypercapnia may have been slow due to CO2 delivery that required manual gas flow adjustments. The use of gas mixers could improve future studies by allowing fast and accurate changes in the inspired fraction of CO2.
The resting state hemodynamic indices obtained in this study differed from those obtained earlier by the same methods. 7 We believe this difference is related to the difference in choice of anesthetics. In our hands, the combination of isoflurane, hypercapnia, and mechanical ventilation reduced MAP during hypercapnia state (results not shown). Hypotension is known to cause a redistribution of microvascular flows in rodents. 29 Although it would have been desirable to use an anesthesia protocol similar to that of our initial study 7 for comparison and consistency, we therefore chose alpha-chloralose rather than isoflurane in this study. This approach allowed us to avoid hyperventilation-related reductions in both HR and blood pH 30 by using mechanical ventilation and tight physiological monitoring.
Our CMRO2 predictions are based on CTH and MTT and the assumption of a steady state with fixed tissue oxygen tension. Thus, the CTH:MTT ratio (CoV) or changes therein alone do not permit to infer CMRO2 information. For these predictions, we also assumed a p50 of 26 mmHg for both physiological states in order to highlight the effect of changes in MTT and CTH for different PtO2 values. Hypercapnia-related changes in pH affect p50 and thereby the oxygen–hemoglobin dissociation curve—the so-called Bohr-effect. 31 In our case, hypercapnia would tend to increase p50, shifting the dissociation curve to the right. This shift is expected to increase OEF and tissue oxygen tension slightly compared to our estimates. In future studies of physiological phenomena during which pH changes (hypercapnia, ischemia), p50 could be adjusted accordingly to infer tissue oxygenation.
Isoflurane has been shown to cause pial vasodilation, 32 which may account for the shorter resting MTT and CTH values found in our previous study of isoflurane-anesthetized mice. Assuming that cerebral hemodynamics remain coupled to metabolic demands during anesthesia, this difference suggests that resting cortical CMRO2 is lower during alpha-chloralose anesthesia than during isoflurane anesthesia (Table 3). We have not been able to identify reports of CMRO2 in alpha chloralose anesthetized mice, but 17O MR spectroscopy measurements in alpha chloralose anesthetized rats have reported CMRO2 values of 1.51 ± 0.0623 and 2.26 ± 0.18 µmol/g/min, 24 respectively, consistent with our predictions (Table 3). Recent studies using similar methods in isoflurane anesthetized mice have reported CMRO2 values of 2.6 ± 0.433 and 2.7 ±0.4 µmol/g/min, 34 consistent with our earlier predictions. 7 While alpha-chloralose anesthesia may result in lower resting brain metabolism as compared with isoflurane, more comparative studies within species and animal strains are needed to evaluate the difference in brain metabolism produced by these anesthetics.
Our experimental design was optimized to achieve normoxic hypercapnia in all animals. In one animal, however, PaO2 increased during the study, possibly due to incomplete muscle relaxation and sporadic breathing. This animal showed an unexpected CTH increase during hypercapnia and a smaller increase in arterial and arteriole diameter during the induction of hypercapnia compared to the other observations (supplementary material Figure s1). It has been shown that hypoxia and hyperoxia modulate cerebral hemodynamics in steady state35–38 and during episodes of increased metabolic demands. 39 Thus, hyperoxia is accompanied by reduced CBF, 37 tissue oxygen tension, 35 and pial diameter 36 during steady state, suggesting that neurovascular coupling partly serves to avoid excessive oxygenation. Indeed, a recent human study measuring arrival time and CBF by arterial-spin labeling in healthy subjects during hyperoxic hypercapnia, reported reduced MTT (bolus arrival) and CBF compared to normoxic hypercapnia. 40 We speculate that the observed increase of CTH may reflect capillary constrictions and increases flow through TFC to avoid the exposure of tissue to high oxygen levels. Further studies are needed to study the origin of such CTH increases, and their role in tissue oxygen homeostasis.
In our study, the RBC flux increase was not paralleled by a similar increase in capillary diameter during hypercapnia. We believe this is a result of the way in which capillary diameter was estimated. Recently, it has been shown that capillary diameter changes occur at the location of the pericyte body on the capillary wall. 9 Therefore, capillary diameter estimates may have been underestimated due to our inability to identify the location of these cells during scan prescription. Moreover, single capillary scans at deep cortical layers were limited due to the wavelength and fluorescent dye used as well as the volume injected that might have affect the estimations of the capillary hemodynamic parameter. The usage of fluorescent dye with longer excitation wavelength can help to scan at deeper layers with low amount of dye. Volumetric scans can also be performed using OCT.
Footnotes
Funding
The author(s) disclosed receipt of the following financial support for the research, authorship, and/or publication of this article: This study was supported by the Danish Ministry of Science, Innovation, and Education (MINDLab; EGJ, LØ, KM, PMR), the Danish National Research Foundation (CFIN; LØ, HA, KM), and the VELUX Foundation (ARCADIA; EGJ, LØ, PMR).
Acknowledgements
The authors would like to thank Jonghwan Lee, Nina K. Iversen, and Sava Sakadzic for fruitful discussions for the elaboration of the present study.
Declaration of conflicting interests
The author(s) declared no potential conflicts of interest with respect to the research, authorship, and/or publication of this article.
Authors' contributions
EGJ designed the study and performed all in vivo experiments. He contributed to data analysis and interpretation, and wrote the first draft of the manuscript. HA developed and performed the post-hoc analysis and contributed to the interpretation and discussion of the study. PMR developed software for data post-processing of single capillary scans and contributed to the interpretation and discussion of the study. IKM developed the software for data post-processing of the indicator-dilution technique and contributed to data interpretation and discussion. KM developed the vascular model approach and oversaw statistical analysis. LØ developed the study concept and contributed to data interpretation. All authors revised the manuscript for important intellectual content and approved the final version on the manuscript.
References
Supplementary Material
Please find the following supplemental material available below.
For Open Access articles published under a Creative Commons License, all supplemental material carries the same license as the article it is associated with.
For non-Open Access articles published, all supplemental material carries a non-exclusive license, and permission requests for re-use of supplemental material or any part of supplemental material shall be sent directly to the copyright owner as specified in the copyright notice associated with the article.