
Abstract
Functional hyperemia reduces oxygen extraction efficacy unless counteracted by a reduction of capillary transit-time heterogeneity of blood. We adapted a bolus tracking approach to capillary transit-time heterogeneity estimation for two-photon microscopy and then quantified changes in plasma mean transit time and capillary transit-time heterogeneity during forepaw stimulation in anesthetized mice (C57BL/6NTac). In addition, we analyzed transit time coefficient of variance = capillary transit-time heterogeneity/mean transit time, which we expect to remain constant in passive, compliant microvascular networks. Electrical forepaw stimulation reduced, both mean transit time (11.3% ± 1.3%) and capillary transit-time heterogeneity (24.1% ± 3.3%), consistent with earlier literature and model predictions. We observed a coefficient of variance reduction (14.3% ± 3.5%) during functional activation, especially for the arteriolar-to-venular passage. Such coefficient of variance reduction during functional activation suggests homogenization of capillary flows beyond that expected as a passive response to increased blood flow by other stimuli. This finding is consistent with an active neurocapillary coupling mechanism, for example via pericyte dilation. Mean transit time and capillary transit-time heterogeneity reductions were consistent with the relative change inferred from capillary hemodynamics (cell velocity and flux). Our findings support the important role of capillary transit-time heterogeneity in flow-metabolism coupling during functional activation.
Keywords
Introduction
Neurovascular coupling mechanisms adjust cerebral blood flow (CBF) during brain activation.1,2 While the resulting functional hyperemia increases the supply of oxygen and nutrients to the tissue, the relative increase in CBF exceed that of the cerebral metabolic rate of oxygen, CMRO2.3,4 This phenomenon gives rise to a lower deoxyhemoglobin concentration in tissue during functional activation, and hence the blood oxygenation level dependent (BOLD) contrast used in functional brain mapping.5,6 In this article, we address whether this disproportionate increase in CBF is accompanied by a similar relative increase in oxygen availability and hence represents a departure from flow-metabolism coupling.
Biophysically, the oxygen extraction fraction (OEF) tends to fall as CBF increases, and the disproportionate increase in CBF during functional activation may partly serve to compensate for this inefficacy. Parallel to the increase in CBF, however, slowly perfused capillaries become more rapidly perfused, and it has been speculated that this phenomenon, functional recruitment, may facilitate the transport of solutes across the blood-brain barrier by increasing the effective vessel surface area available for substrate exchange. 1 Homogenization of capillary flow patterns was recently shown to counteract the inherent reduction in OEF as CBF increases,2,7,8 which is likely an intrinsic property of passive microvascular networks.3,4,9 Indeed, incorporation of realistic changes in capillary transit-time heterogeneity (CTH) during functional hyperemia provides superior fits to dynamic CBF and blood oxygenation changes in rat brain during functional activation.5,6,9 Furthermore, preliminary results in humans show that both CBF and CTH must be known to explain OEF in patients with cerebrovascular disease.1,10
Microvascular transit time characteristics have previously been modeled from perfusion weighted imaging (PWI) data, acquired during the passage of an intravascular contrast agent by computerized tomography (CT) or magnetic resonance imaging (MRI).11,12 Based on the contrast agent concentration-time curve (CTC) in each imaging voxel, maps that characterize tissue perfusion can be generated by correcting each imaging voxel’s CTC for the shape of the arterial input function (AIF), so-called deconvolution. 13 Conveniently, the AIF can be extracted automatically from arterial CTCs. 14 Using such AIFs and realistic, flexible models of vascular tracer retention, transit time characteristics can also be estimated from each voxel's CTC. 12 Importantly, this approach allows reliable estimation of both CTH and mean transit time (MTT) in each voxel based at the characteristic signal-to-noise ratio of clinical PWI. 15
Bolus tracking techniques have previously been used to estimate MTT in the microvasculature, based on high spatial resolution two-photon microscopy (TPM) data acquired during the passage of a fluorescent dye.16–18 In those studies, MTT was estimated from the time difference between the arterial CTC and the venous CTC (referred to as the venous output function (VOF)) during hypercapnia 16 and functional activation. 17 As an alternative approach, time to peak (TTP) was determined across the vasculature by fitting vessel’s CTC to a second-order-plus-dead-time model (SOPDT). 18
In this study, we adapted the TPM bolus tracking technique to allow estimation of MTT and CTH. In doing so, we used the methodology previously developed for MRI-based PWI 12 and modified them to describe vascular transport rather than the tissue retention, with the fluorescent dye. With this technique, we examined whether CTH changed during functional activation, in support of the notion that this parameter plays a role in flow-metabolism coupling. Having observed in previous modeling studies that CTH and MTT tend to vary in parallel, in simplistic passive microvascular networks, 9 we expected to observe that CTH decreases in proportion to MTT during functional activation. We paid special attention to their ratio, coefficient of variance (CoV), and whether decreases or not during functional activation, suggesting homogenization beyond a passive effect of the functional hyperemia. We wanted to examine whether our bolus tracking results were consistent with the estimates of MTT and CTH from capillary red blood cells velocities (RBCv) and flux (RBC flux) across the brain cortex, as previously described by Jespersen and Østergaard. 7
Materials and methods
Subjects and preparation
Animal breeding, housing, and all procedures were conducted within the regulations set by the Danish Ministry of Justice and Animal Protection Committees, with the Danish Animal Experiments Inspectorate Permit 2012-15-2934-00231 and reported according to the ARRIVE criteria. In vivo experiments were performed in adult male C57Bl/6 mice (13–15 weeks old), weighing between 25 and 28 g (mean = 26.66 g). Mice were purchased from Taconic Bioscience, Inc. All mice were housed and kept on a 12-h light:dark cycle with ad libitum access to food and water.
To image the cortical microvasculature, mice were anesthetized with isoflurane (2% in 30% oxygen for induction, and 1.5–1.75% for subsequent anesthesia during surgery). We kept body temperature at 37℃ using a homeothermic pad (HB 101/2, Harvard Apparatus, Holliston, MA, USA) controlled via feedback from a rectal thermometer. Arterial and venous catheters were placed in the femoral vessels. Through these, we monitored mean arterial pressure (MAP) and hearth rate (HR) using a BP-1 system (WPI Inc., Sarasota, FL, USA), extracted arterial blood samples for blood gas analysis (ABL90 Flex, Radiometer Medical ApS, Brønshøj, DK), and administered fluorescent dye intravenously. After tracheotomy, mice were mechanically ventilated using a SAR-830/AP ventilator (CWE Inc., Ardmore, PA, USA). End-tidal CO2 (ETCO2) was monitored by a micro-capnograph (Microcapstar, CWE Inc., Ardmore, PA, USA) connected to the ventilation tube. Hydration was maintained with intraperitoneal or subcutaneous injections of 0.05 ml dextrose 5% (w/v) every hour. Base-deficit was adjusted with an I.V. administration of bicarbonate solution (HCO3 + NaCl 0.9%, 75 mg/ml), when deficit was below −6 mmol/L. To evaluate any effect of repetitive dye injections on blood gases, we compared arterial blood samples taken before and after the bolus injections.
A metal holding bar was glued to the mouse’s left frontal bone to immobilize its head during imaging. A cranial window of ∼3 mm in diameter was drilled through the right parietal bone, 1.5-mm media-lateral and −0.5 mm anterior-posterior to bregma, corresponding to the location of the forepaw region of the forepaw somatosensory cortex (S1FP). Before opening the skull, the dura was punctured over the cisterna magna to allow drainage of cerebrospinal fluid (CSF) to avoid brain herniation. Before removing the dura mater covering the cortex, somatosensory evoked potentials (SEP) were recorded during electrical stimulation (2 mA square 300 µs pulses at 3 Hz for 30 s) using a silver ball electrode to verify the location of S1FP. Afterwards, the cranial window was filled with a mixture of 1.5% agarose (Sigma-Aldrich, St. Louis, MI, USA) and artificial CSF (aCSF, DiacleanShop, Castrop-Rauxel, Germany), covered with a glass coverslip (5-mm diameter), and secured with cyanoacrylate adhesive and dental acrylic. After placing the mouse under the TPM, isoflurane was reduced to 1.2–1.4%, and FiO2 to 25%. The field-of-view (FOV) to be scanned in each subject was defined as the one with the largest positive wave (P1) of the SEP (data not shown).
Two-photon microscopy
TPM was performed using a Praire Ultima-IV In Vivo Laser Scanning Microscope (Brucker Corporation, Billerica, MA, USA). A 10X (0.30 NA, 3.3 mm WD) water immersion objective (Olympus) was used for bolus passage acquisition, on a FOV of ∼1.18 mm2 (512 × 512 pixels), with x-y resolution of 0.68 µm and 10.41 µm in depth. To visualize capillaries, we used a 20X (1.0 NA 2.0 mm WD) water immersion objective (Olympus), with x-y resolution of 0.21 µm and 0.81 µm in depth. Fluorescent emission was detected by a GaAsP-PMT (Hamamatsu, H7422-40) using a 660/40 nm-emission filter to optimize signal to noise ratio (SNR) while imaging capillaries in the deeper layers of the brain cortex (∼450 µm). The first bolus was performed with a PMT-GaAsP gain of 700 V, while gain was reduced by 2% for subsequent bolus injections to avoid signal saturation.
Dye bolus injection
To estimate MTT and CTH, we adapted an established method to image the transit time of a dye bolus through the cortical vasculature.
16
Prior to dye injection, we identified the depth to be scanned by NADH auto-fluorescence, as previously described (774 nm excitation wavelength).
19
After identifying the shadows originating from pial vessels, a 30 µL bolus of 0.5% Texas-red dextran solution (70,000 MW, 5 mg/mL in 0.9% NaCl, t½ ∼25 min, Thermo Fisher Scientific), was injected at a rate of 60 µL/s using a syringe infusion pump (GenieTouch, Kent-Scientific, Torrington, CT, USA) while performing a 20 s spiral-scan at 6.25 fps within a single plane (512 × 512 pixels, dwell time per pixel = 1.2 µs). This sequence allowed us to differentiate arteries and veins based on the timing of dye arrival (see Figure 1).
Estimations of MTT and CTH by bolus tracking. (a) Identification of AIF and VOF by 20 s spiral-scan at ∼6.5 fps (512 × 512 pixels, dwell time per pixel = 1.2 µs). (b) After reposition of the FOV, the selection of the line to scan was made arbitrarily taking into account the biggest artery and the biggest vein within the FOV. Also arterioles and venules were scanned. (c) Representation of the line scanned by time and length in micrometers. (d) AIF and VOF intensity curves (red and blue on (b) and (c)). A 9-s curve-matching region was selected for all subjects, all curves were called to the post-bolus baseline of the AIF curve. (e) Fitting process for deconvolution. Deconvolution was performed in a recursive manner by curve fitting using an expectation-maximization algorithm while minimizing free energy. (f) We parameterize the probability transport function of capillary transit times h(t) by a gamma variate with parameters α and β (MTT = αβ, CTH = 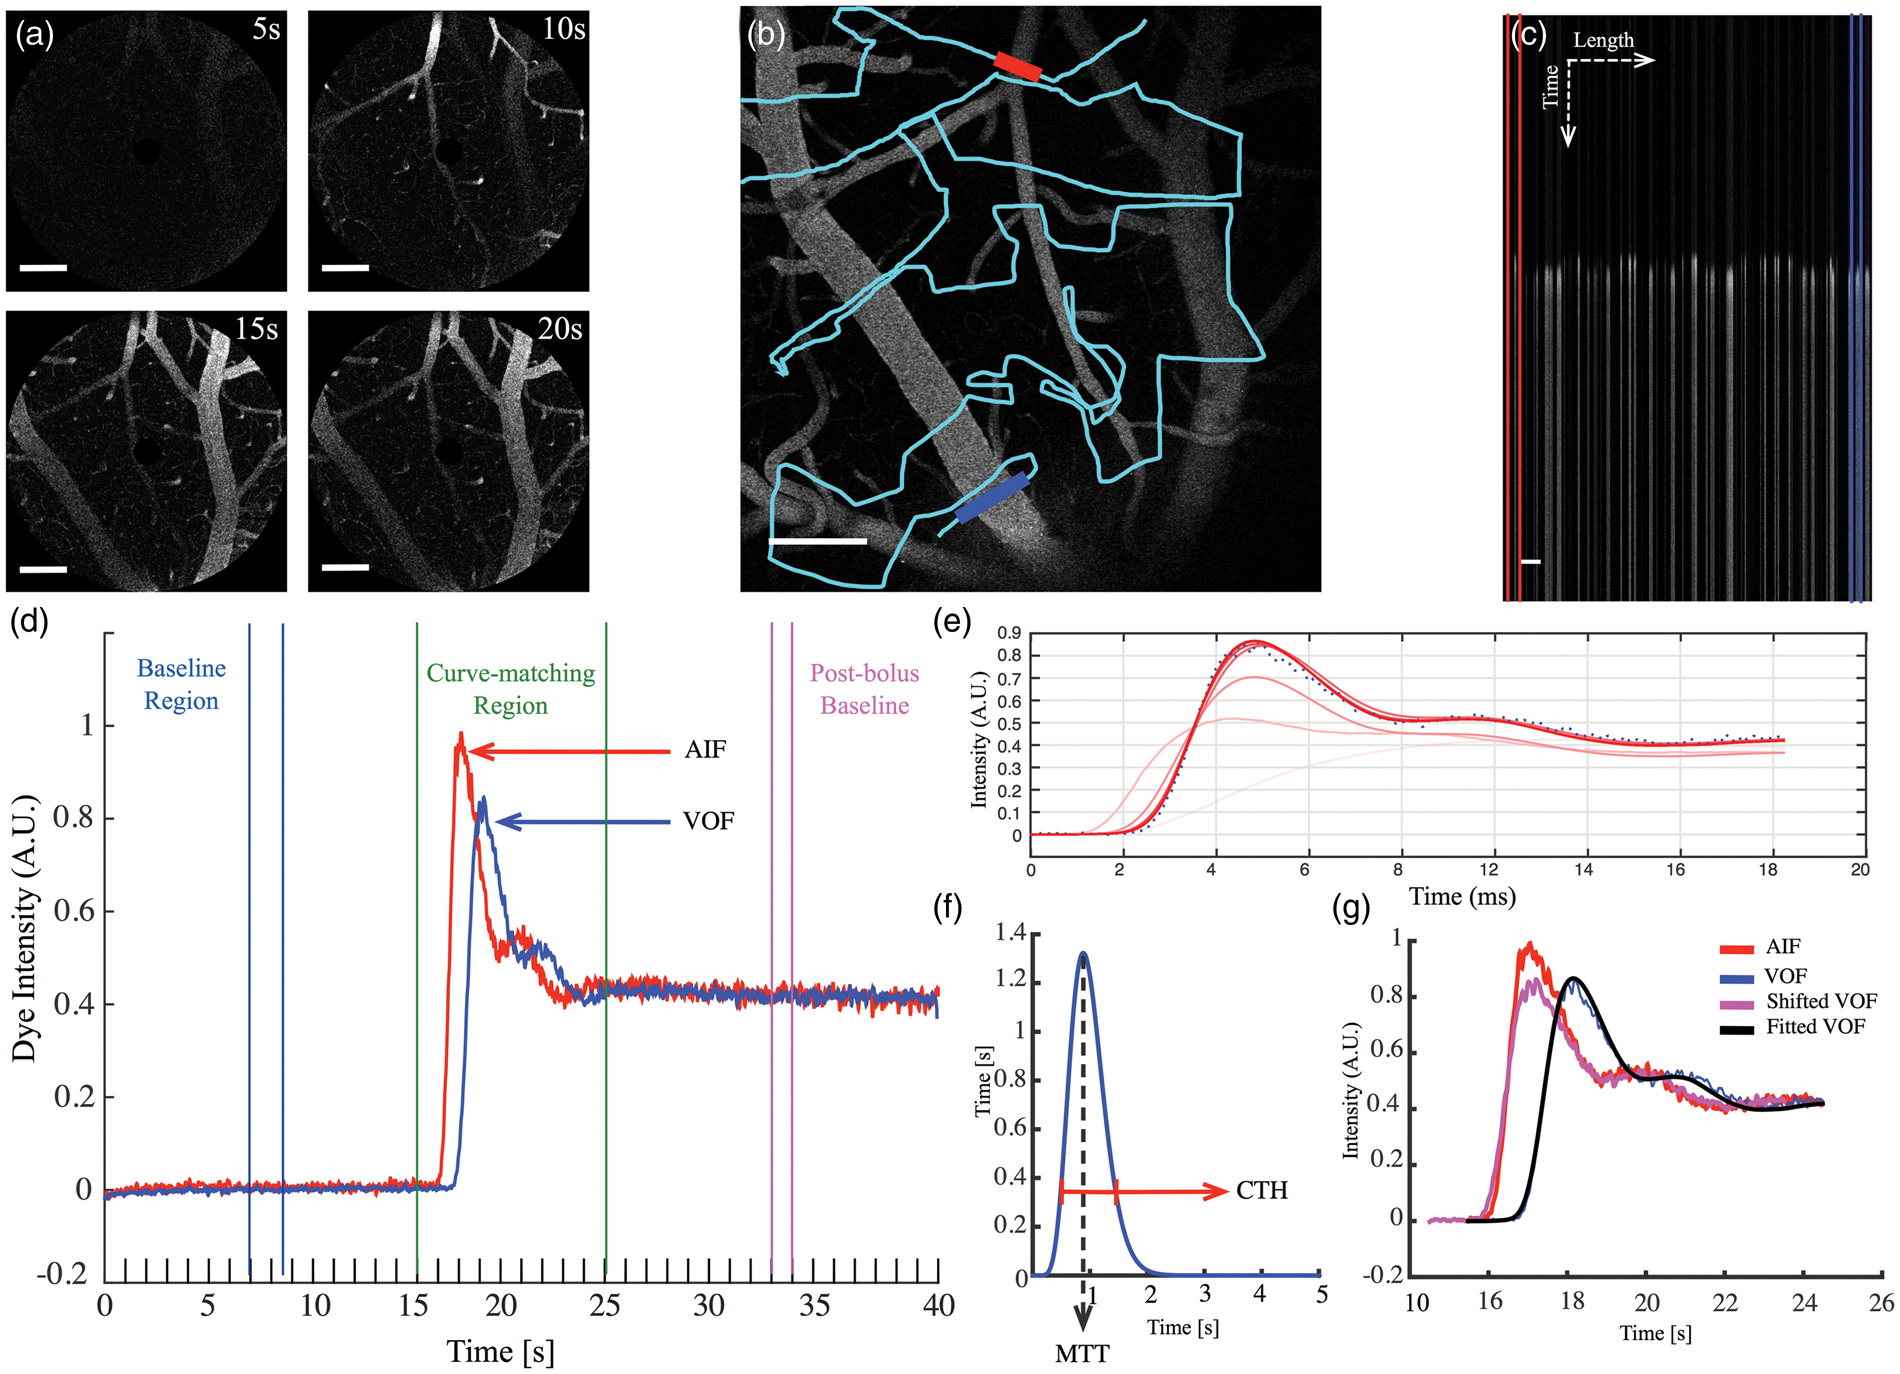
After identification of vessels within the FOV, a scan path was defined through the pial vessels of the upper cortex layer, using the TPMs free-hand drawing option (PraireView, Brucker Corporation, Billerica MA, USA). Lines were defined to cross the largest artery and vein within the FOV, as well as arterioles and venules. The scan path was defined to intersect each vessel multiple times to avoid possible out-of-focus samples (Figure 1(b)). Then, repeated line-scans were performed (∼6.7 ms per line-scan path, dwell-time per pixel 1.2 µs) for a total scan time of 40 s. Bolus passage measurements were repeated six times in each animal: Three times during steady state conditions and three times during forepaw stimulation, interleaving each condition.
To obtain an angiogram implying the anatomical relation of the vessels, a z-stack was acquired on a FOV of 1.18 µm2 (10X Objective), from the pial surface down to a depth of 200 µm.
Forepaw stimulation
The stimulus consisted of a block of 30 s electrical stimulation. Each stimulus was 2 mA in amplitude, lasted 300 µs, and was delivered to the contralateral forepaw at 3 Hz. The forepaw stimulation was synchronized to start 10 s after the initial line-scan, and the dye bolus was injected 15 s after commencement of the scan, i.e. 5 s after the start of forepaw stimulation.
RBC velocity measurements
After the bolus tracking trials, capillaries were scanned to assess RBCv and RBC flux. During the scanning time, we defined capillaries as those vessels showing single cell passage (cells’ shadows) within the vessel lumen. Vessels with very low flux (one or two cell passages) were also taken into account to evaluate their effect on perfusion given by functional activation. Two scan paths were performed in each capillary, along the axis for RBCv estimations; and a transversal scan for RBC flux and diameter assessment (Supplementary Figure. 1a). Capillaries were randomly selected within the FOV of the previously scanned area by bolus passage, and the axial and transversal scans were performed over 1–6 selected capillaries with the line-scan period of 1–7 ms. To observe any differences in capillary hemodynamics among cortical layers, micro-vessels were selected over the depth range of 70–450 µm. We did not randomize the order in which capillaries were recorded at different depth.
Image analysis
Diameter estimations
Line profiles of dye concentrations from the line scan data were created as illustrated in Figure 1(c). The vessel diameters (d) were estimated as the full-width at half-maximum (FWHM) values of the line profiles as described earlier, 20 assuming that the vessel intersects define their full diameters (Supplementary Figure. 1e). The vessel area (a) was estimated from the diameter calculation, even though the scanning path sometimes crossed a vessel more than once, only one sample was randomly selected for diameter estimation. The effect of forepaw stimulation on vessel diameter was quantified as relative changes in the microvessel diameter (−Δd/d) and area (−Δa/a).
Vessel segmentation for bolus passage analyses
To identify the primary inputs and outputs within each FOV, we segmented vessels according to their diameter and the time-to-peak (TTP) of their concentration-time-curve (CTC). The arterial input function (AIF) was the CTC of the brain-feeding artery with large diameter, which was first to enhance (i.e. had shortest TTP), whereas the venous output function (VOF) was identified as the CTC of the large vein, which was last to enhance (i.e. longest TTP). We then identified diving arterioles (d < 35 µm) with CTCs that peaked late on the arterial network, and ascending venules (d < 60 µm) with CTCs that peaked early on the venous network relative to the dye passage (Figure 2(a)). From these, we selected pairs of vessels that appeared anatomically connected through the capillary bed based on the z-stack scans. Using these four vessels types, we analyzed dye transport between the following levels of the microcirculation: S1: artery to vein, S2: artery to venule, S3: arteriole to venule, and S4: arteriole to vein (Figure 2(b)).
(a) Time courses obtained from each vessel indicated in the reference image of Line-Scans (black square) show the difference in onsets TTP between different blood vessels. Vessels were segmented according to their diameter and the TTP of their CTC. (b) Schematic drawing of the microcirculation, displaying the networks evaluated by bolus tracking. The AIF was selected among the brain-feeding arteries, as the vessel with largest diameter and the first to enhance (dark red), whereas the venous output function (blue) was identified as the largest vein, last to enhance within the venous group. Also arteriole (orange) and venule (light blue), anatomically related were identified and selected. (c) Estimations made of MTT, CTH, and CoV from dye bolus passage. Segments were assembled by pairs of the vessels selected (S1–S4). *p = 0.05, **p = 0.001, ***p < 0.001.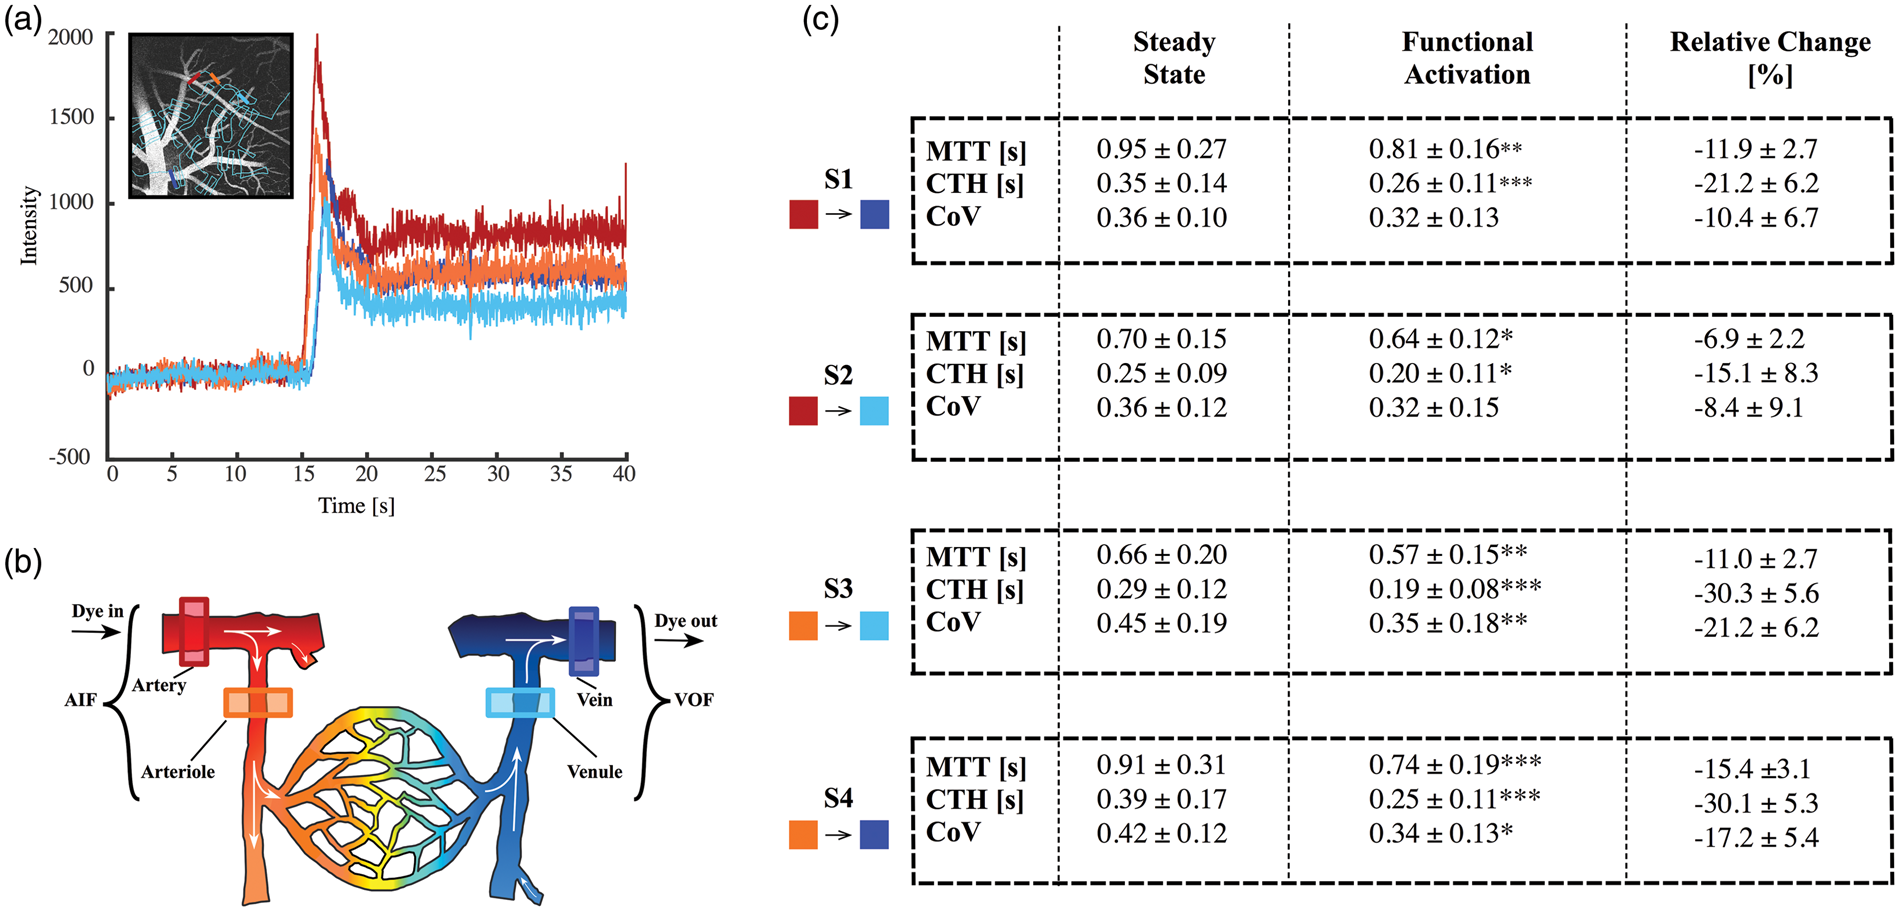
Line-scans were used to create signal-intensity time curves for each vessel (Figure 1(c) and (d)). The pre-bolus signal intensity was identified for each vessel and this baseline signal was subtracted to create curves proportional to the dye concentration (CTCs). Afterward, all curves were scaled to the post-bolus level of the AIF to correct for differences in signal intensity due to signal travelling from vessels of varying depth (Figure 1(d)). The passage of fluorescent dye from arterial to venous vessels can be modeled in terms of a vascular transport function. This function describes the relative amount of dye emerging at the venous vessel as a function of time after an idealized, instantaneous bolus injection into the arterial vessel.
Analogous to the approach used when fitting the residue function based on the tracer retention observed by DSC-MRI, the transport function is obtained by deconvolution of the VOF with the AIF.
15
The transport function was modeled by a gamma cumulative distribution with two parameters
Capillary hemodynamic estimations
RBCv were calculated based on the Radon transformation algorithm. 21 From the capillary axial line-scan, we estimated the mean RBCv within time intervals of 150 ms, displacing our starting point by 40 ms for every iteration. During velocity estimation, a SNR threshold was applied to reduce noise artifacts in the time intervals. The intervals with SNR < 5 were identified and the velocity estimation was interpolated between the last and next point with SNR > 521 (Supplementary Figure. 1b).
Flux was estimated by analyzing the intensity variations that occur in the cross-section scan of each capillary (Supplementary Figure. 1c). As in velocity estimation, average intensity profiles were derived from 150-ms time intervals within the transversal line-scans. Low and high contrast indicate presence and absence of RBCs, respectively, and we used cluster analysis to determine the presence as they pass through the capillary scanned (Supplementary material, section I). For the purposes of this study, capillaries were excluded from further analysis if they revealed stalled blood cells in any of the experimental conditions (baseline, stimulation, or post-stimulation), as this might be the result from mechanical damage to the capillary during the experimental procedures. Also, our post-processing software returned unrealistically high values in cases of poor image quality. We therefore discarded capillaries with a linear density (LD) higher than 400 cells/mm from further analysis, keeping in mind that this represents an unrealistic high cell/plasma ration for an erythrocyte thickness of approximately 2 µm.
The capillary diameter was also estimated from cross-sectional scans by the same method to that for pial vessels. In this case, we used the intensity classification as performed in pial diameter estimations, to disregard time intervals with presence of RBCs; hence, maximum intensity from the plasma was only taken into account, with average estimations every 150 ms. Any vessel showing an inner diameter ≥ 10 µm was considered an arteriole or venule and thus ignored for further analysis (Supplementary Figure. 1d).
Estimations of capillary RBCv and RBC flux were averaged for each second. Then, to evaluate the effect of the functional activation on capillary hemodynamics and to allow the comparison with the bolus tracking measurements, the data were averaged over the 20 s in baseline conditions, 10 s during stimulation (second 25–45 of the scan duration), which coincides with the bolus injection, and the last 10 s after the end of the stimulus. The later average was performed to evaluate the time needed for RBCv and RBC flux to return to their baseline values.
Post hoc analysis
We related our estimates of MTT and CTH to oxygen availability by determining the corresponding predictions of CMRO2 and OEF based on Jespersen and Østergaard’s model. 7 Model assumptions are summarized in the supplementary material (Section II-A)
Based on the RBCv and RBC flux measurements, and assuming that capillary flow paths are of equal length, we made independent estimates of relative changes in MTT and CTH from baseline to stimulation. See the supplementary material (section II-B) for more details about the computation of these quantities.
Statistical analysis
We used R (R Core Team, 2012) for statistical analysis. Physiological data were analyzed using paired t-test (blood gases) and ANOVA. We used the lme4 package for linear mixed-effect model estimates. The hemodynamic parameters (e.g. MTT, CTH) and their relative changes (−Δx/x), as well as the stimulus condition, were treated as fixed effects. As random effects, we had intercepts for subjects, due to repetitive measurements. If necessary, the models were adjusted for physiology variability, by adding the parameter as a fixed effect. The p-values were obtained by likelihood ratio tests of the model with the effect in question against the model without the effect in question. A generalized linear mixed model (GLMM) using a penalized quasi-likelihood estimator (GLM-PQL) was constructed to evaluate possible effect of changes in physiological variables, and to analyze the differences between segments (bolus passage) and different depths scanned (capillary hemodynamics) in baseline conditions. The difference of the different response by depths was performed with a paired t-test. The results are expressed as the mean ± SE.
Results
Nine male mice were examined using the bolus-tracking technique and line-scans for capillary hemodynamic estimations. Data from one mouse were discarded from perfusion imaging analysis due to an acquisition error that led to out-of-focus images.
After seven boluses (∼210 µl), we observed a small but significant reduction of pH by 0.021 units (t-test, CI: 0.04–0.0007, p = 0.038), this change was driven by reductions in HCO 3 by −1.47 mmol/L (CI: −2.31 to −2.64, p = 0.0018). The metabolic acidosis suggests an effect of the repetitive dye injections. No significant changes were observed in pCO2 and pO2 (Supplementary material Table S1).
We did not find any statistical differences in MAP, HR, and ETCO2 among the animals during the steady state conditions (ANOVA, p > 0.05). Electrical stimulation did not have any significant effect on MAP, HR, and ETCO2 (GLM-PQL, p > 0.05).
Vessel diameter changes caused by stimulation
Across the arterial network, during steady state conditions the mean arterial and arteriolar diameter was 48.86 ± 10.91 µm and 24.20 ± 6.36 µm, respectively. Overall the arterial network, the diameter increased by 4.21% ± 1.10% during electrical stimulation (n = 51, χ2(1) = 13.52, p < 0.001). This corresponds to an increase of 10.77% ± 3.96% in the cross-sectional area (χ2(1) = 7.14, p = 0.007). In arteries (>50 µm), the increase in diameter was 3.30% ± 1.01 (χ2(1) = 9.39, p = 0.002), corresponding to a 7.08% ± 2.20% increase in the cross-sectional area (χ2(1) = 9.09, p = 0.002). In arterioles, the diameter increase was 4.65% ± 1.65 (χ2(1) = 7.41 p = 0.006), corresponding to a 12.78% ± 6.22% increase in the cross-sectional area (χ2(1) = 4.09, p = 0.04). During baseline condition, the mean vein diameter was 95.23 ± 33.63 µm (SD), whereas venules showed a diameter of 33.95 ± 14.20 µm (SD). We detected no significant changes in the venous and venular diameters (Supplementary material Figure. 2).
MTT and CTH by bolus passage
A total of 192 measurements were performed, 24 on each vascular segment, during steady state and forepaw stimulation. The mean depth were the bolus-tracking scans were performed was 96.8 ± 22.2 µm (SD), from the selected 0-position in the z-axis.
Averaged across all segments, functional activation reduced MTT from 0.81 ± 0.27 to 0.69 ± 0.18 s (χ2(1) = 18.18, p < 0.001) and CTH from 0.32 ± 0.14 to 0.23 ± 0.11 s (χ2(1) = 34.98, p < 0.001). These reductions were significant across all segments for both MTT and CTH (Figure 2(c), table). We examined whether these “global” MTT and CTH changes within the unit scanned, were dominated by any specific vascular segments, but did not find any significant differences in the absolute MTT and CTH changes among segments (p > 0.05). However, when testing the relative change (Δx/x), we observed decreases in both MTT and CTH throughout all the segments in every subject during electrical stimulation. Reductions in CTH were notably larger compared with MTT, particularly in the segments S3 ( − 30.3 ± 5.6%, p = 0.011) and S4 ( − 30.1 ± 5.3%, p = 0.022), i.e. the segments that include arterioles. Interestingly, these segments were the only to show statistically significant reductions in CoV during activation, from 0.45 ± 0.19 to 0.35 ± 0.18 (χ2(1) = 7.13, p = 0.007) for S3 and from 0.42 ± 0.12 to 0.34 ± 0.13 (χ2(1) = 5.5122, p = 0.01) for S4 (Figures 2 and 3).
Relationship between MTT and CTH as quantified by the standard deviation of the dye transport function in each segment. The pairs of MTT:CTH represents each subject (colors) and the effect of functional activation (arrow direction), depicting the effect of neuronal activation through all segments, as independent systems. We can observe that the effect of functional activation had a more pronounced effect in CTH compared with MTT, on those segments that included arterioles (S3 and S4).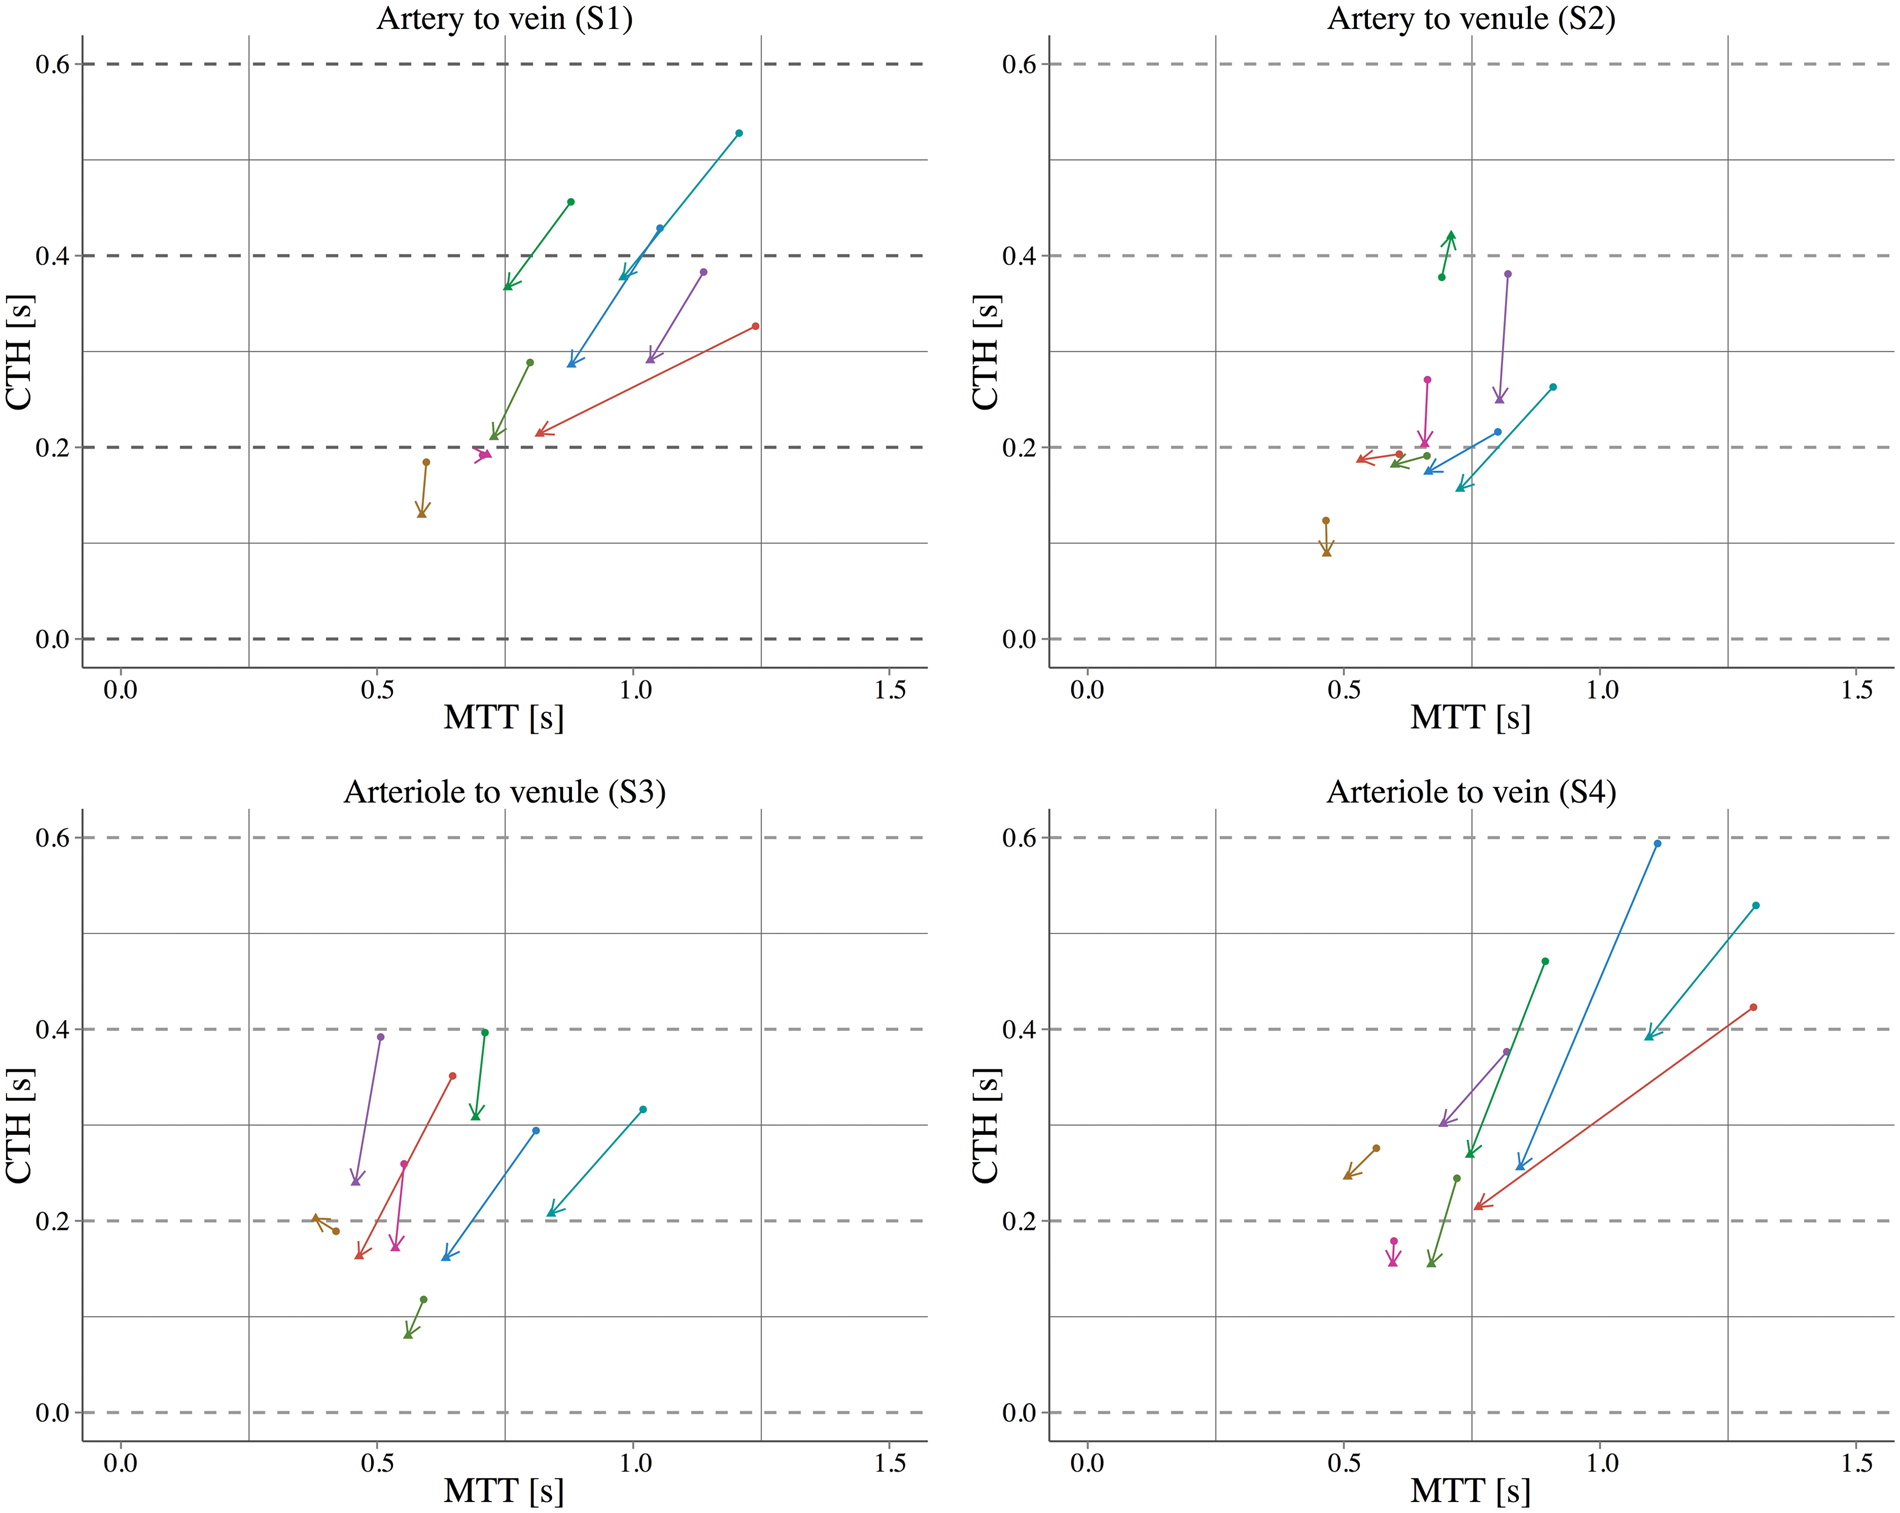
We did not find any significant effect of cumulative dye volume on our steady state MTT, CTH, or CoV values, or in the stimulus-induced changes in these parameters, suggesting that a saturation effect did not jeopardize our repeated measurements.
In our post hoc analysis, we inserted the MTT and CTH estimates from the “capillary bed” (S3) into the model by Jespersen and Østergaard. The model predicted CMRO2 to increase from 6.58 to 7.12 ml/100 ml/min (ΔCMRO2 = 8.27%) during forepaw stimulation while OEF fell from 0.24 to 0.23 (ΔOEF = − 6.01%).
Figure 4 shows all pairs of CTH and MTT measured across segments during the steady state (filled dot) and functional activation (triangle), with the corresponding estimations of OEF and CMRO2.
(a) Contour plots show the estimated OEF (a) and CMRO2 (b) for a given MTT and CTH of each segment.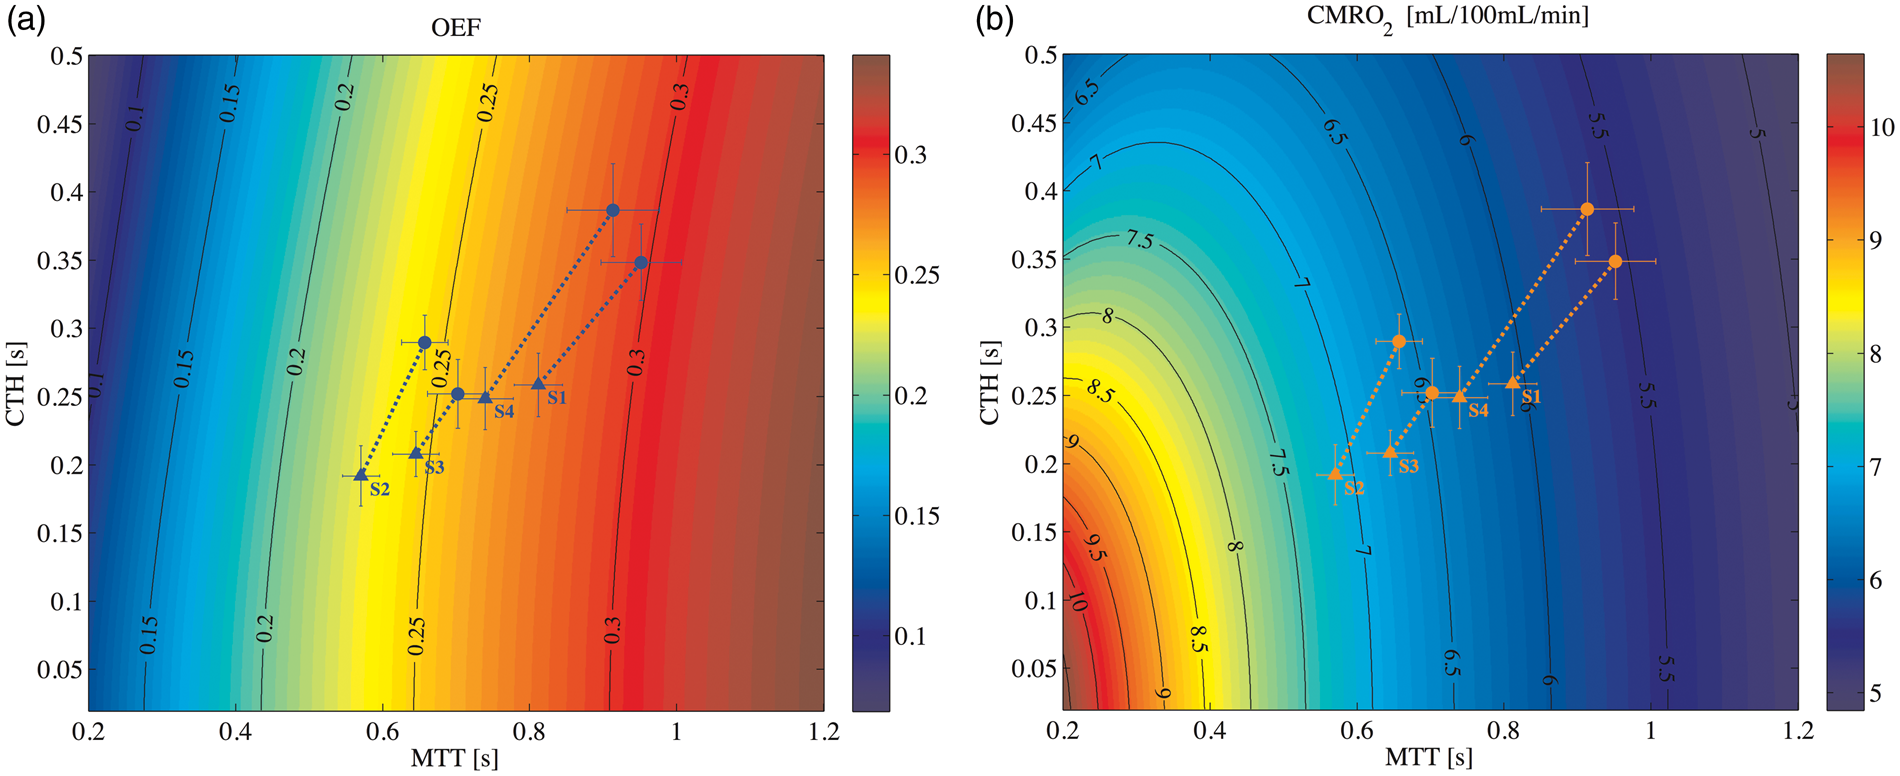
Red blood cells hemodynamics
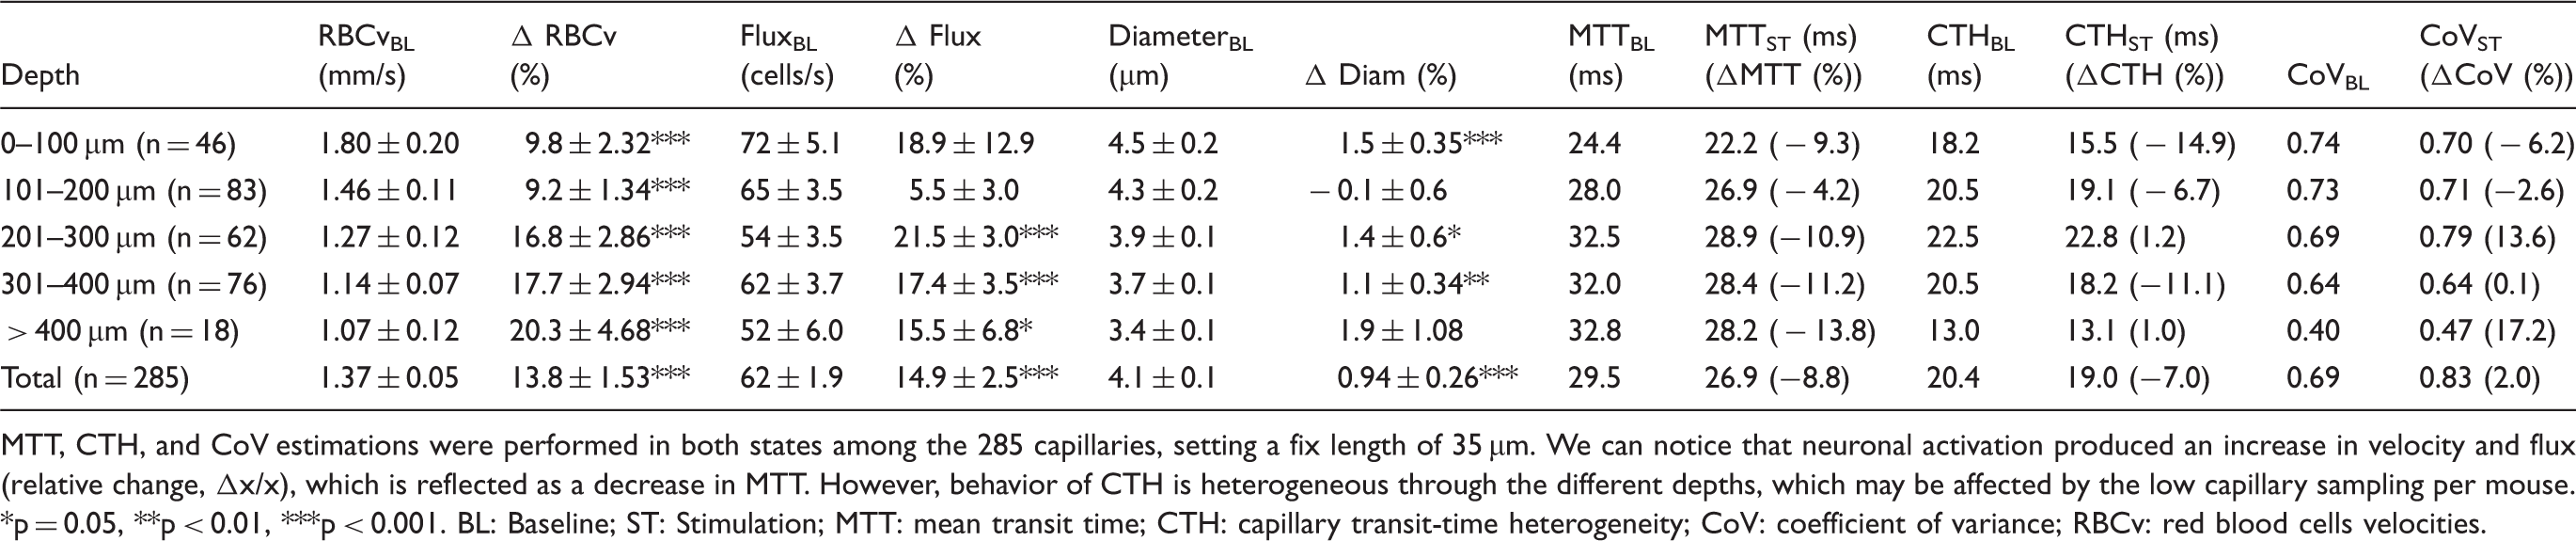
We scanned 328 capillaries through the brain cortex (depth 85–445 µm) of the eight animals. We discarded 33 capillaries due to stalled flux and 10 capillaries due to cell density higher than 400 cells/mm (Final N = 285). During steady state conditions capillaries showed a mean RBCv of 1.37 ± 0.05 mm/s, RBC flux 62 ± 1.9 cells/s and an inner capillary diameter of 4.0 ± 0.1 µm. This represented a LD (RBCv / RBC flux) of 53 ± 1.3 cells/mm. Electrical stimulation caused significant relative increases in RBCv and RBC flux (p < 0.001) in all animals (Supplementary material Figures. 4 and 5). The distributions of RBCv and RBC flux during baseline and stimulation are described in Figure 5. Functional activation produced a relative increase in RBCv of 13.8% ± 1.2% (χ2(1) = 122.31, p < 0.001), and RBC flux similarly increased by 14.9% ± 2.5% (χ2(1) = 33.27, p < 0.001). The LD did not change significantly. The capillary diameter showed a mean relative small increase of 0.94% ± 0.26% (χ2(1) = 13.08, p < 0.001) (Table 1). Relative changes in RBCv and RBC flux were linearly correlated with changes in capillary diameter during functional activation (p = 0.001 and p < 0.001, respectively). Figure 5(e) and (f) shows the stimulation-induced changes in RBCv and RBC flux, respectively, as functions of their baseline values. We note a tendency for low-baseline-speed capillaries to show higher increase on RBCv by electrical stimulation (p = 0.001), and for low-baseline-flux capillaries to show larger stimulation-induced increases (χ2(4) = 24.93, p < 0.001).
(a–d) Distributions of RBCv and RBC flux during baseline and functional activation are described. (e,f) Stimulation-induced effect on RBCv and RBC flux, as a function of average baseline. A tendency can be observed for low speed capillaries to show higher increase on RBCv by electrical stimulation; whereas flux show a correlation between the stimulation-induced change and the resting RBC flux (p < 0.001). Estimations of capillary kinetics during steady state and functional activation. MTT, CTH, and CoV estimations were performed in both states among the 285 capillaries, setting a fix length of 35 µm. We can notice that neuronal activation produced an increase in velocity and flux (relative change, Δx/x), which is reflected as a decrease in MTT. However, behavior of CTH is heterogeneous through the different depths, which may be affected by the low capillary sampling per mouse. p = 0.05, **p < 0.01, ***p < 0.001. BL: Baseline; ST: Stimulation; MTT: mean transit time; CTH: capillary transit-time heterogeneity; CoV: coefficient of variance; RBCv: red blood cells velocities.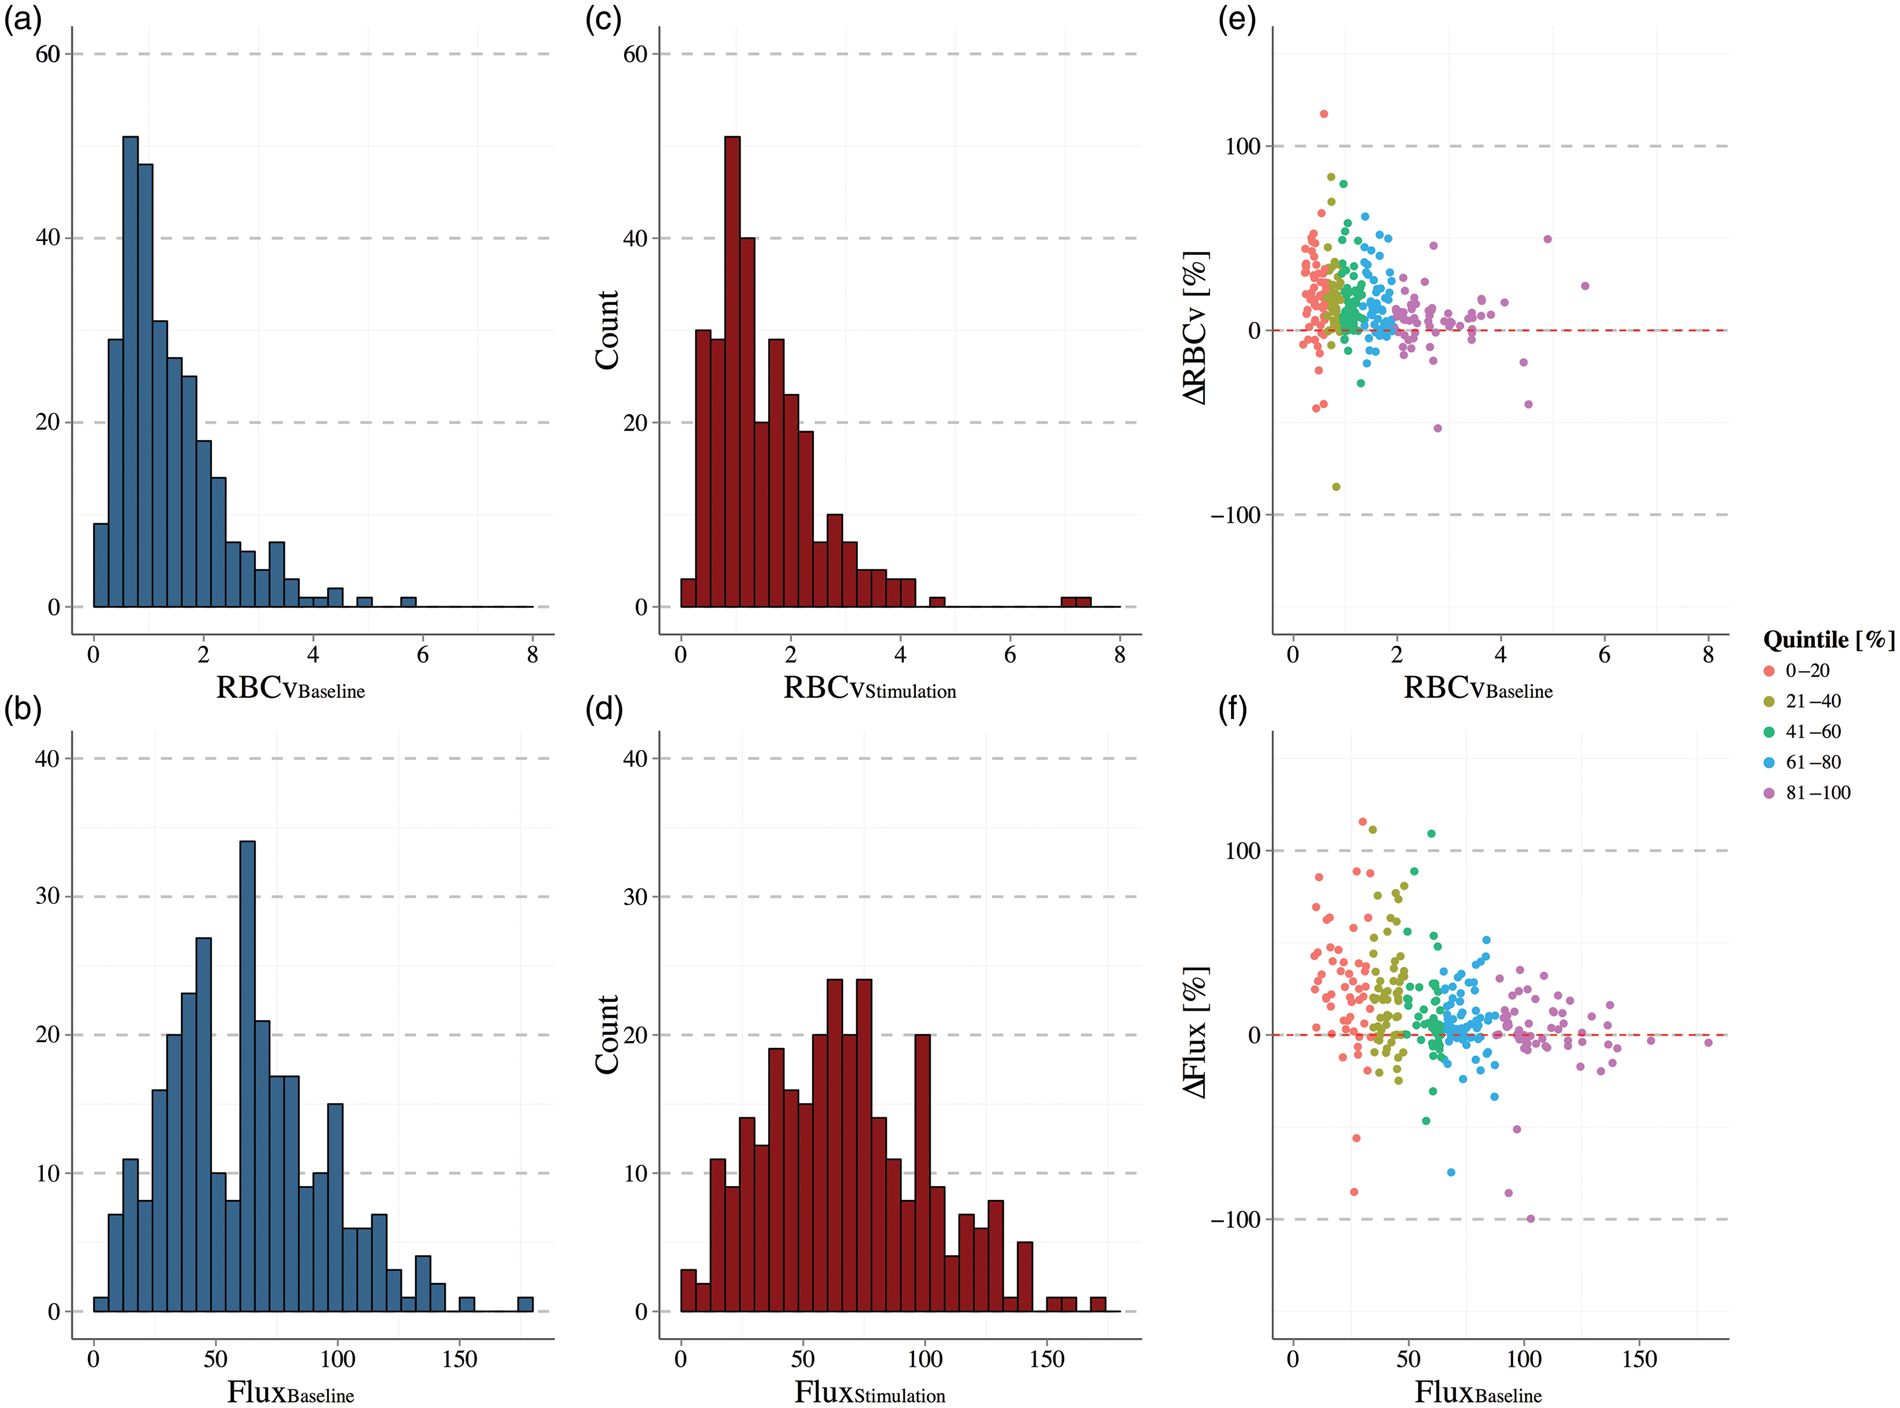
Out of 285 capillaries measured in this study, 45 capillaries showed no significant changes in RBCv, whereas 84 capillaries showed no significant change in flux during functional activation.
Capillary kinetics as a function of cortical depth
In resting mouse cortex, RBCv showed a reduction of 0.20 ± 0.04 mm/s for every 100 µm on cortex depth (χ2(1) = 20.07, p < 0.001), whereas the flux showed a decrease of 3.4 ± 1.5 cells/s every 100 µm (χ2(1) = 4.77 p = 0.003) (Figure 6(a) and (b)). After adjusting our model for changes in MAP, the tendency in the depth profile of RBCv remained valid (p < 0.001), but that of the flux did not, probably due to the lack of randomization during the experiment (Table 1).
Whisker plot representing the difference of RBCv (a) and RBC flux (b) through the different depth regions scanned on steady state condition. (c) Relative change (%) of RBCv and RBC flux (d) produced by functional activation through different cortex regions. The p-values were calculated by GLMM-PQL for comparisons between regions, and only comparisons with p < 0.05 are shown.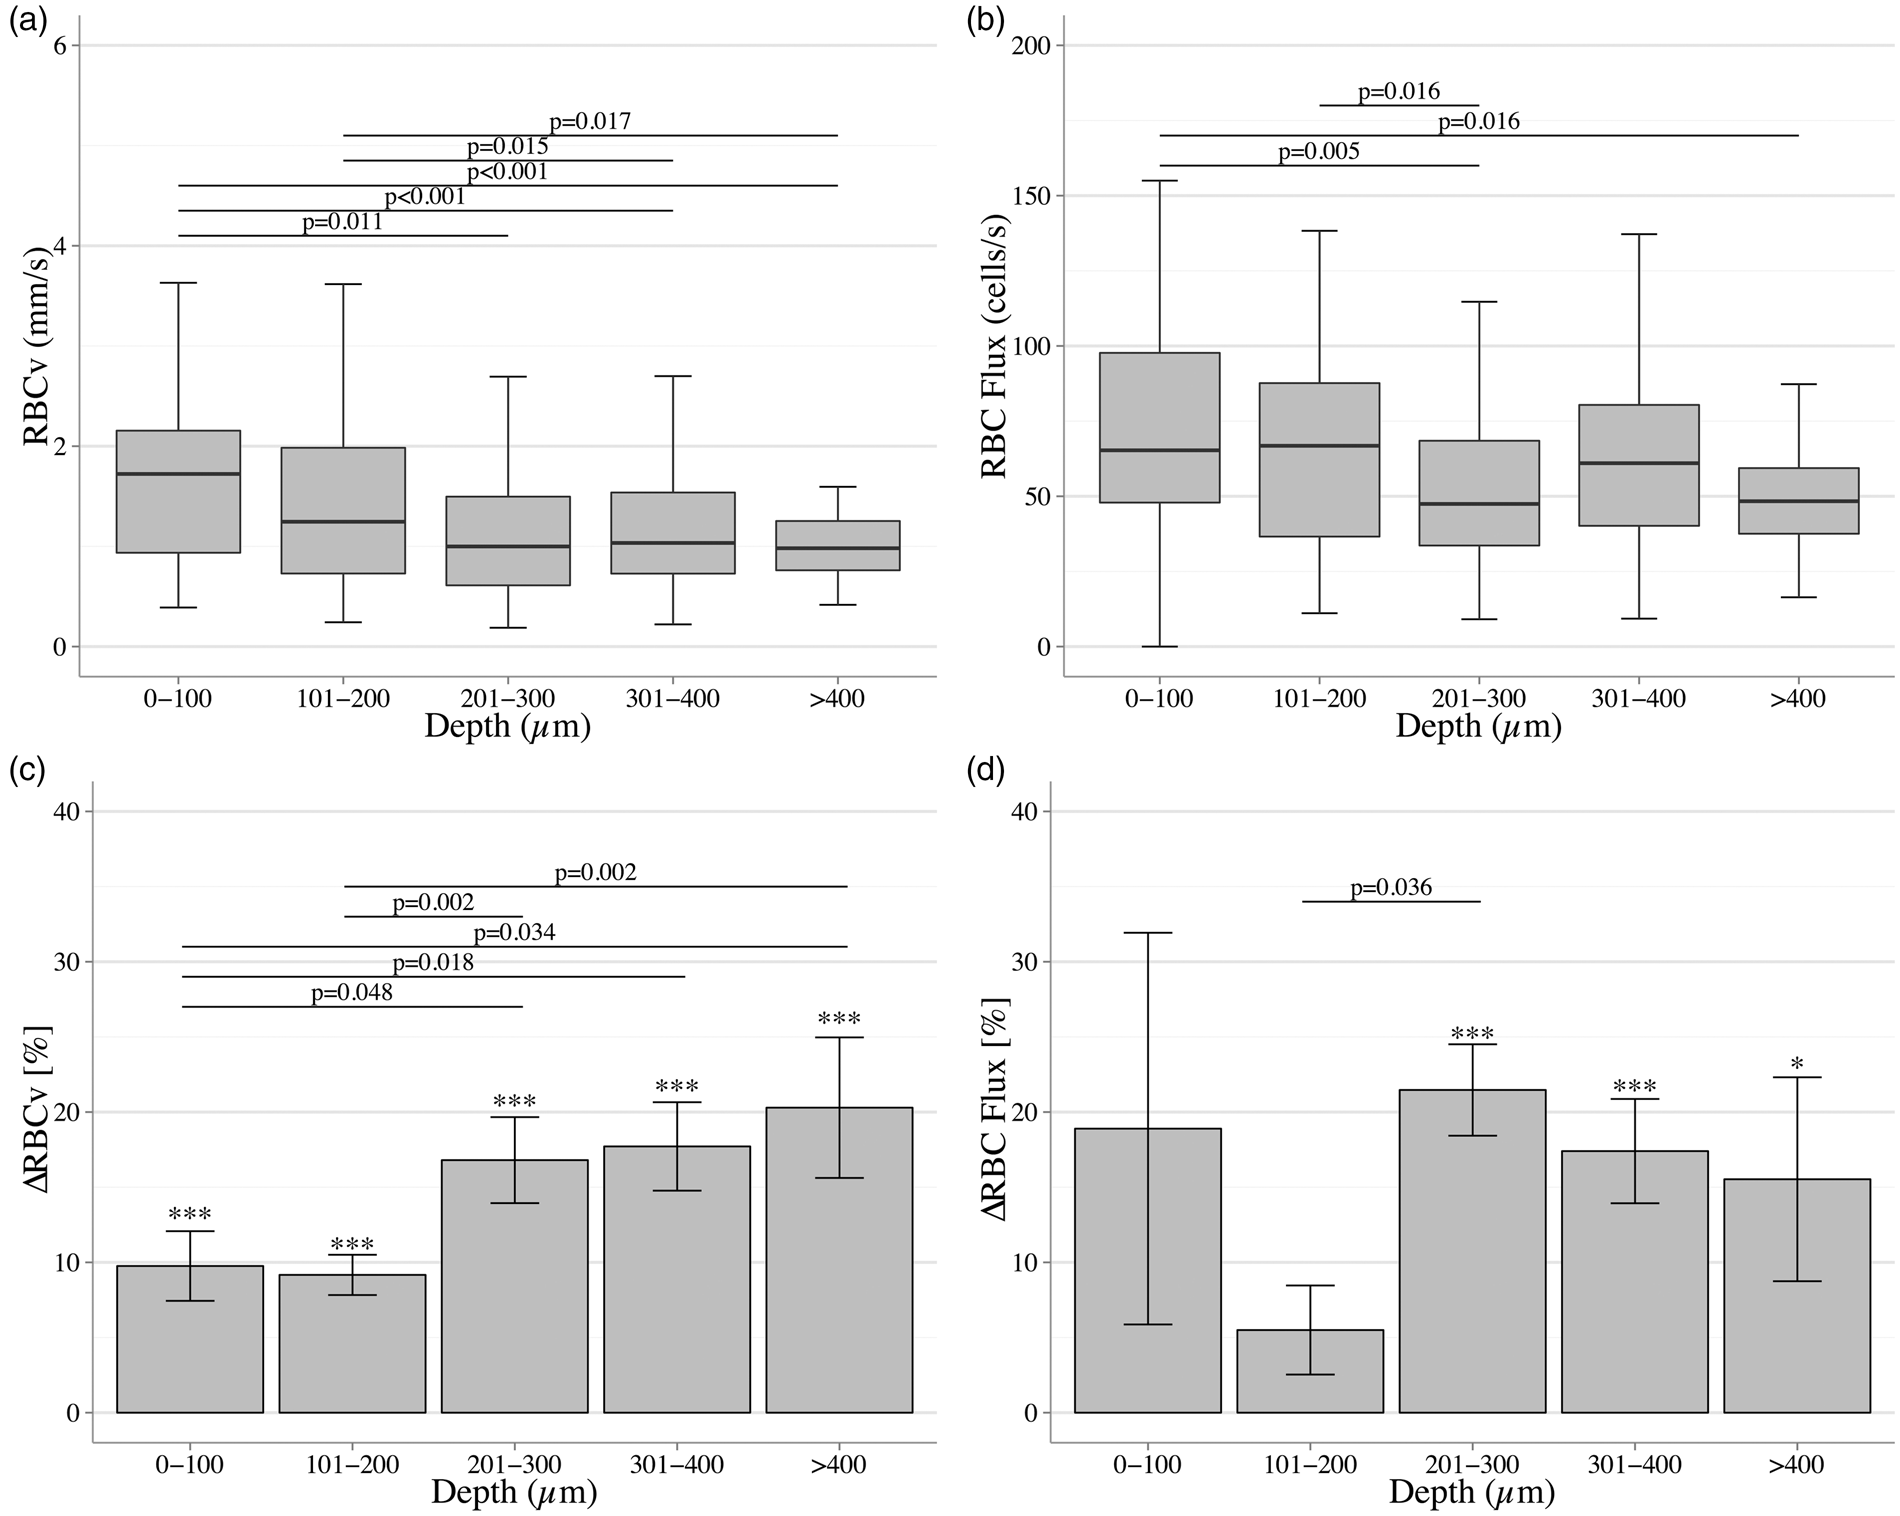
Under forepaw stimulation, the relative changes in RBCv differed among cortical depths (p = 0.009). After grouping our data in 100 µm blocks, functional activation did not reveal any significant change in RBC flux above 200 µm (0–100 µm, n = 46, p = 0.15 and 101–200, n = 83, p = 0.07). Pairwise comparisons of the relative change made by functional activation on RBCv and RBC flux showed significant differences between superficial regions and deeper cortex regions, depicted in Figure 6(c) and (d).
MTT and CTH estimations from capillary RBC kinetics
Estimations of MTT and CTH were performed with the given RBCv and RBC flux for each capillary, both during baseline and stimulation (n = 284). Functional activation reduced the estimated MTT and CTH by on average, 8.8% and 7.00%, respectively.
MTT and CTH estimates by layers are described in Table 1. Note that the largest changes in MTT occur deeper than 200 µm, reaching its highest change below 400 µm in depth (n = 18, ΔMTT = − 13.8%). Reductions in CTH were observed across most, not all depths. Notably, the most superficial layer (0–100 µm) showed a larger relative decreases on CTH than did MTT (n = 44, ΔCTH = − 14.9%), giving rise to a reduction in CoV of 6.2% (Figure 4).
Discussion
We analyzed the effect of functional activation on hemodynamics in the mouse brain cortex, using a modified version of the bolus tracking method previously described for TPM, 16 and applying an approach developed for DSC-MRI for image analysis. 15 Our method extends earlier studies by Stefanovic/Hutchinson 16 using a similar technique by including parameters of the recent extension of the classic flow-diffusion equation, taking CTH into account as an important determinant of tissue oxygenation.
Overall, forepaw stimulation caused reductions both in MTT and CTH, consistent with previous analysis of literature data. 7 In fact, modeling studies predict CTH to change in proportion to MTT in passive, compliant micro-vascular networks, 9 so that their ratio, remains constant. We observed significant reductions in MTT and CTH in all segments in our bolus-tracking analysis, but CoV, was not equal among all segments. Changes in CoV may characterize the “isolated,” active changes in capillary flow patterns that affect oxygen extraction. In our data, functional activation only produced significant CoV reductions on S3 and S4. This result suggests that flow-related homogenization beyond the one expected in a passive, compliant micro-vascular network, can be attributed to the segments between the arteriole and venous vessels. Pre-capillary sphincters 22 and/or pericytes were recently shown to relax in response to functional activation. 23 They may provide an active mechanism for regulation capillary flow patterns. Thus, we speculate that our findings of CoV reductions may reflect active neurocapillary coupling mechanisms that are active during cortical activation. By inserting our MTT and CTH estimates into the Jespersen–Østergaard model, we were able to predict an increase in relative change in CMRO2. This supports the idea that MTT and CTH together afford a more efficient oxygen extraction and metabolism, rather than an insolated increase on CBF (MTT reductions) thereby maintaining the flow-metabolism coupling.
In our data, the relative change in arteriolar diameter estimates due to functional activation was lower than previously shown in awake mice (4.6% vs. 7.3%). 24 A possible explanation may be the application of isoflurane as anesthetic agent and the concentration used in our experiment (1.2–1.4%). We found isoflurane to be an easy-to-manage anesthetic drug, without negative effects of accumulation of injectable anesthetic agents. Isoflurane is widely used, allows an easy control of the anesthesia level, and its effect on the neurovascular coupling is relatively well studied.25,26 Isoflurane has an important effect in brain hemodynamics during steady state 26 and functional activation. 25 This, in fact, can be related also to our reduced change in diameters by functional activation. Previous data showed that neurovascular coupling appears to be preserved different anesthetic regimes. 26 Whether different anesthetic regimes have the same effect on MTT and CTH remains to be elucidated.
We estimated MTT and CTH from single capillary scans to examine whether the bolus tracking estimates were consistent with capillary kinetics in different depths of the brain cortex. The two methods differ fundamentally in that one summarizes the kinetics of oxygen-carrying erythrocytes directly, whereas the other characterizes plasma kinetics. Therefore, the bolus tracking method cannot assess changes in capillary hematocrit that may affect the capillary resistance, and in turn influence the bolus tracking estimates. On the contrary, single capillary analysis can take into account hematocrit changes during functional activation: To obtain the fraction of erythrocytes with a given transit time, we weighed each capillary transit time by its RBC flux, obtained as the product of LD and RBCv. Given the limited changes in capillary diameter, changes in LD take into account any changes in hematocrit in individual capillaries. Functional activation did not produce a significant change in LD, which suggests that hematocrit did not change during stimulation, supporting previous reports. 27
Over the entire capillary unit or angiome, CTH co-varied with MTT as in the bolus tracking estimations, seemingly securing a more efficient oxygen extraction to the tissue. However, substantial differences can be noticed on the relative change of both estimates. Also, CoV showed slight increase, mainly driven by the limited reduction of CTH.
The hemodynamic estimates obtained from bolus tracking analysis pertain to the transport of dye and plasma through the cortical microcirculation (angiome) that somehow connects to the feeding and draining vessels we examined. We note that the corresponding tissue volume may exceed the size of the cortical area activated by our stimulation regime. Also, the bolus tracking analysis is insensitive to the depth and location at which dye dispersion occurs. We therefore chose to compare bolus estimates of MTT and CTH to the average of MTT and CTH obtained from single capillary RBC kinetics obtained across all cortical depths. When averaged across cortical depths, CTH and MTT estimates by capillary analysis both decreased during functional activation, consistent with our bolus tracking estimates. While MTT decreased consistently in all cortical depths during activation, CTH showed no significant changes at 201–300 µm and beyond 400 µm (1.2% and 1.0%, respectively). These depth specific changes in MTT and CTH estimates may reflect layer-specific changes in metabolic demands during functional activation. Indeed, recent studies supports the idea that CMRO2 is not spatially uniform through the cortical layers, and that neurovascular coupling mechanisms are also layer dependent. 28 These findings would suggest large CTH and reductions beyond 400 µm where we failed to detect changes in CTH. We only scanned a limited number of capillaries in cortical tissue deeper than 400 µm (N = 18), and note that a larger sample of capillaries may be needed to fully characterize capillary flow patterns in deeper layers during functional activation.
The measurement of blood plasma transit time is an established technique for imaging blood flow in human brain, both in MRI and CT.13,29 These techniques have relatively lower temporal and spatial resolutions compared with TPM, compelling to sample a voxel of ∼3 mm3 that might include thousands of capillaries within different vascular units. We think that the most informative segment to address for MTT and CTH estimations is the one comprising the closest part to the capillary bed (S3). However, by relating the other segments to the model of Jespersen and Østergaard, we sought to mimic to the estimations made by MRI and CT perfusion imaging, which embrace more than one cortical unit or angiome.
Bolus tracking has been previously employed in conjunction with TPM.16,17,30 In our adapted version of the bolus passage technique, we achieved higher temporal resolution by choosing free-hand linear-scans rather than time-series (t-series), which allowed us to record a higher number of data points in AIF and VOF. By using this technique, a concentration of dye per unit time is recorded, reducing the effect of vessel motion or constriction to the estimations. Our estimations of MTT during resting state were 0.81 ± 0.27 s, much faster than 1.6 ± 0.3 to 2.8 ± 0.2 s, as shown previously.16–18,30 This distinction might result from potential differences between species, as most of the previous measurements were performed in rats. 31 However, we need to note that previous data showed no difference in capillary hemodynamics between species. 32 Also, as mentioned above, we need to consider the anesthesia protocol selected.
Estimations of MTT by previous studies, using a similar approach by TPM, showed that functional activation produced a MTT reduction of 20 ± 8% by using the TTP delay without vessel segmentation, 17 and 16.2 ± 2% in ∼92% of the vessels segment by using a SOPDT model. 18 In the later study, a reduction of ∼25% on transit time dispersion was observed. Our reduction of 11.31% of MTT by using the adjusted DSC-MRI method is comparable with those previously published. Moreover, the observed 24.15% reduction of CTH is comparable with the above-mentioned reduction on transit time dispersion. 18 It might be important to keep in mind that our estimations of MTT and previous estimations by other studies used different timings for the bolus injection, suggesting the possibility of variations on MTT due to different stimulus durations. Also, after showing a departure from a linear relationship between MTT and CTH during functional activation, a speculation can allude to the post-stimulus variation of both parameters may depend on the stimulation protocol.
Previously, capillary hemodynamics have been measured by various optical imaging techniques and with different paradigms,17,33 which showed increased RBC flux during functional activation17,33 along with an increase in the capillary diameter,17,23 consequently increasing the tissue oxygen tension. 34 In contrast to earlier studies, 17 we found a significant correlation between basal RBC flux and stimulation-induced changes in RBC flux. Our findings showed that low baseline flux had a more pronounced relative change following functional activation (p < 0.001). Even when we observed the same tendency in RBCv, it was not significant. However, our conclusion may be limited by the reductions in MAP toward the end of each experiment and the lack of randomization of the depth scanning order. Our results could suggest that RBCv occurs without capillary dilation, during functional activation. Capillary dilation is thought to occur at the location of the pericyte bodies. 23 We could not visualize pericyte bodies; therefore, our measurements of the capillary diameter changes may have been underestimated.
Our analysis of capillary hemodynamics by depth represents a way to elucidate the different neurovascular effects of functional activation across different cortex layers, since it has been suggested that blood flow patterns are more related to laminar changes, rather than functional columns. 35 We consider that our small but significant increase in the capillary diameter might be related to the location of the effector cells (pericytes), and the lack of visual identification, as previously reported. 23
Our results show that RBCv changes are smaller at the most superficial layers. It is important to mention that our results show that RBC flux did not increased significantly by neuronal activation in the region from 0 to 200 µm. The most pronounced changes were observed beyond depths of 200 µm for both RBCv and RBC flux, corresponding to layer II–III, 36 suggesting a possible redistribution to deeper layers during functional activation. Another possible interpretation is that superficial capillaries could represent pre-venule capillaries 37 filled mainly by plasma rather than erythrocytes, and that the flux in these vessels is in fact returning from deeper layers. Our data also showed that the increase in RBC flux was higher in the outer cortex (depths < 400 µm). This might be explained by the lower sampling of reliable RBCv and RBC flux estimations, due to the imaging depth limit of our TPM and the high standard error (Figure 6(c) and (d)). Consistent with previous TPM measurements,17,33 we did not observe any changes in LD during functional activation. However, this seems to be resolved by higher volumetric measurements using OCT, 38 as it has been reported that RBC changes are small with prominent undershoots in surface microvasculature, and larger but with less prominent undershoot in deeper layers.
Limitations of this study
As a limitation to our model-based CMRO2 and OEF estimates, we note that we assumed, rather than measure, a fixed oxygen tension, and that our model failed to take the effects of tissue oxygen consumption into account. 8 The selection of the input and output was performed according to their anatomical relation in the angiogram. The transport function derived by our analysis may therefore be affected by dye entering the microvasculature through other vessels.
We studied the transport function of a plasma dye, and our hemodynamic variables therefore apply to plasma rather than red blood cells. A decrease in plasma heterogeneity is beneficial not only for oxygen extraction but also for glucose diffusion. 39 Although the difference between plasma and erythrocyte transit times have been modeled 40 and estimated (∼25%), 18 reliable data are needed to evaluate the possible dissociation between plasma and erythrocytes transit times. 41
Conclusion
In this study, we present a method that uses bolus tracking by TPM to estimate MTT and CTH. MTT and CTH decreased during functional activation, in agreement with earlier observations.5,6,9 Combined with the Jespersen and Østergaard model, our results suggest that CTH indeed co-vary with MTT to maintain efficient oxygen extraction in the brain. The decrease in CoV during neuronal activation suggests that CTH is reduced by an active mechanism, particularly between arterioles and venules.
Footnotes
Funding
The author(s) disclosed receipt of the following financial support for the research, authorship, and/or publication of this article:
This study was supported by the Danish Ministry of Science, Innovation, and Education (MINDLab; EGJ, LØ, SNJ, SFE, KM, NKI), the Danish Council for Independent Research’s Sapere Aude Program (NKI), the Danish National Research Foundation (CFIN; LØ, SNJ, MA, KM), and the VELUX Foundation (ARCADIA; EGJ, LØ).
Acknowledgments
The authors wish to thank Sebastian Frische, Mark J. West, and Morten S. Jensen for fruitful discussions.
Declaration of conflicting interests
The author(s) declared no potential conflicts of interest with respect to the research, authorship, and/or publication of this article.
Authors’ contributions
EGJ designed the study and performed all in vivo experiments. He contributed to data analysis and interpretation, and wrote the first draft of the manuscript. JC contributed to the study design and to the development of software for data post-processing. IKM, PMR, and MM developed software for data post-processing and performed part of the data analysis. HA and SNJ developed theoretical models for data interpretation and performed the post hoc analysis. KM developed the vascular model approach and oversaw statistical analysis. NKI contributed to the design of animal studies. JL and SS contributed to the study design and to the interpretation of data. LØ developed the study concept and contributed to data interpretation. All authors revised the manuscript for important intellectual content and approved the final version on the manuscript.
References
Supplementary Material
Please find the following supplemental material available below.
For Open Access articles published under a Creative Commons License, all supplemental material carries the same license as the article it is associated with.
For non-Open Access articles published, all supplemental material carries a non-exclusive license, and permission requests for re-use of supplemental material or any part of supplemental material shall be sent directly to the copyright owner as specified in the copyright notice associated with the article.