
Abstract
Cerebral ischemia causes widespread capillary no-flow in animal studies. The extent of microvascular impairment in human stroke, however, is unclear. We examined how acute intra-voxel transit time characteristics and subsequent recanalization affect tissue outcome on follow-up MRI in a historic cohort of 126 acute ischemic stroke patients. Based on perfusion-weighted MRI data, we characterized voxel-wise transit times in terms of their mean transit time (MTT), standard deviation (capillary transit time heterogeneity – CTH), and the CTH:MTT ratio (relative transit time heterogeneity), which is expected to remain constant during changes in perfusion pressure in a microvasculature consisting of passive, compliant vessels. To aid data interpretation, we also developed a computational model that relates graded microvascular failure to changes in these parameters. In perfusion–diffusion mismatch tissue, prolonged mean transit time (>5 seconds) and very low cerebral blood flow (≤6 mL/100 mL/min) was associated with high risk of infarction, largely independent of recanalization status. In the remaining mismatch region, low relative transit time heterogeneity predicted subsequent infarction if recanalization was not achieved. Our model suggested that transit time homogenization represents capillary no-flow. Consistent with this notion, low relative transit time heterogeneity values were associated with lower cerebral blood volume. We speculate that low RTH may represent a novel biomarker of penumbral microvascular failure.
Keywords
Introduction
Optimal management of acute ischemic stroke requires an in-depth knowledge of the hemodynamic, metabolic, and cellular events which ultimately lead to infarction. In contrast to the tremendous success of recanalization therapies in recent years, 1 the clinical impact of neuroprotective strategies remains disappointing.2,3 Impaired microvascular perfusion has long been suspected to affect the spatiotemporal evolution of tissue damage during an ischemic stroke. 4 Indeed, cerebral capillaries constrict during the first hours of ischemia,5–7 accompanied by erythrocyte clogging,8,9 thrombocyte and fibrin aggregation, and formation of microthrombi.7,10,11 Accordingly, during ischemia, areas of capillary “no-flow” have been observed in rats,12–14 mice,7,15,16 gerbils, 17 rabbits, 18 non-human primates, 19 and even humans. 20 Furthermore, experimental studies show more severe capillary no-flow with (i) more severe CBF reduction,13,21 (ii) prolonged duration of ischemia beyond ∼1 h,12,21 and (iii) in the presence of baseline neurovascular impairments, including diabetes22,23 and hypertension. 21 Also, in models of ischemia followed by reperfusion, some capillary no-flow persists, referred to as the no-reflow phenomenon.7,15,24
Importantly, capillary no-flow can reduce oxygen availability in penumbral tissue in several ways. First, capillary no-flow can be so severe that blood flow is attenuated by the increase in microvascular resistance. Meanwhile, any degree of capillary no-flow causes a proportionate reduction in the capillary surface area available for oxygen exchange within the tissue. 25 Second, diameter reductions in perfused capillaries may be so severe that they only permit the passage of plasma,5,7 with only very limited content of (physically dissolved) oxygen. Meanwhile, accompanying pressure changes may cause the redistribution of capillary flows to a heterogeneous perfusion pattern with poor oxygen extraction capability, so-called ‘functional shunting’.26,27
Current diagnostic approaches to assess cerebral hemodynamics in acute stroke, such as perfusion-weighted magnetic resonance imaging (PW-MRI) and computerized tomography (PW-CT), rely on the temporal dynamics of image intensity changes. These are observed in individual image voxels following the intravenous bolus injection of plasma-borne contrast agents, to arrive at parametric images of cerebral blood volume (CBV), blood flow (CBF), and their ratio, the mean transit time (MTT). Microvascular patency only affects these parameters in cases where plasma, and thereby MRI or CT contrast media, fails to reach large proportions of the microvasculature within an image voxel. Accordingly, these perfusion indices reflect blood supply and the vascular volume perfused by plasma, but not the microvascular distribution of blood, which might reveal hemodynamic phenomena that affect the availability of oxygen in tissue. Perhaps, or as a consequence hereof, traditional hemodynamic indices have often failed to differentiate between tissue with benign oligaemia as opposed to ‘true’ penumbral tissue – that is, tissue which progress to infarction, if recanalization fails.28–30
Our group has developed models to study the relation between microvascular distribution of blood flow and the extraction of oxygen, in order to quantify the effects of ‘functional shunting’.31–33 Recently, we have also developed methods to robustly estimate intra-voxel transit time characteristics, including their mean (MTT) and standard deviation (capillary transit time heterogeneity – CTH) by PW-MRI, and evaluated their effects on oxygen extraction efficacy in humans.32,34,35 Importantly, while our models and methods can relate capillary flow and flow heterogeneity to net oxygen extraction, they require that contrast media retention in brain tissue reflects capillary blood only. The dynamic images recorded as part of PW-MRI and PW-CT in acute stroke, however, are sensitive to the contrast media in all blood vessels within a voxel, whether they are small arteries, capillaries, or veins. The distribution of intra-voxel transit times derived from our methods, therefore, does not directly reflect the capillary distribution of plasma and erythrocytes. To fully appreciate how progressive capillary constrictions, and eventually capillary occlusions, might appear on our perfusion maps; we therefore developed a simple computational model of graded microvascular failure to aid the interpretation of our results in terms of their metabolic significance.
Both measurements and simulations show that the standard deviation of blood transit times through normal (that is, passive and compliant) anatomical microvascular networks tends to change in proportion to the mean blood transit time.36,37 As a consequence, CTH, our indicator of the microvascular distribution of blood, would be expected to increase in proportion to MTT in response to a reduction in perfusion pressure during an acute ischemic stroke. Such a ‘passive’ increase in CTH would therefore reflect the primary reduction in blood supply, rather than the subsequent changes in capillary patency or blood rheology across the microcirculation. To distinguish the effects of hypoperfusion and deteriorating microvascular hemodynamics, we introduced the relative heterogeneity of transit times (RTH), i.e. the CTH:MTT ratio. In statistical terms, this parameter represents the coefficient of variation. We then examined whether the acute value of these hemodynamic indices predicted subsequent infarction in a large acute stroke patient cohort. The primary outcome for our analysis of patient data was voxel-wise risk of infarction according to 24-h recanalization status. By comparing these risk estimates with our model findings, we sought to identify microvascular biomarkers that might be of prognostic value in the management of acute ischemic stroke. Finally, we discuss these findings in terms of the putative relation between microvascular hemodynamics and metabolic derangement.
Materials and methods
Patients
Adult patients were included from the European multicenter database, I-Know, and a regional database, the Aarhus Perconditioning Study.38,39 In the I-Know database, all patients who presented within 6 h of symptom onset with acute, anterior circulation, non-lacunar, ischemic stroke with a NIHSS score ≥4 were included. In the Perconditioning study, all ischemic stroke patients eligible for i.v. thrombolysis treatment were included and randomized to receive treatment of four 5-min cycles of induced remote ischemia during transportation. In both studies, acute MRI was performed before i.v. thrombolysis. The I-Know and Aarhus preconditioning studies conformed with the Helsinki Declaration, the rules laid out by the Council of Europe Convention on Human rights and Biomedicine, Directive 95/46/EC of the European Parliament and of the Council of 24 October 1995 on the protection of individuals with regard to the processing of personal data and on the free movement of such data, and with the legislation and regulations in Denmark, Germany, France, and Spain, respectively. The studies were approved by the Aarhus, Hamburg, Lyon, and Girona hospitals respective regional ethics committees, and carried out after informed consent from the patients. For this study, only patients with large vessel occlusion on acute imaging and at least 20 mL of hypoperfused tissue were included (see below).
Computational model of graded microvascular failure
To ‘translate’ between our imaging findings on one hand, and changes in capillary patency such as those reported in the animal literature, on the other, we generated an intuitive computational model comprising of 10 capillaries of equal length organized in parallel (Figure 1). A feeding arteriole and a draining venule were placed in serial connection with the capillary network. We assumed laminar flow of a Newtonian fluid, and calculated perfusion parameters according to Hagen–Poiseuille equation. Then, assuming that oxygen exchange is limited to the capillary bed, we calculated capillary-wise oxygen extraction according to the flow-diffusion equation
25
– see Figure 1 for details on parameters and formula. Based on this model, we determined the perfusion parameters one would observe, and the corresponding metabolic changes, for an image voxel in this case comprising of 23% (of the total blood volume) arterioles, 46% capillaries, and 31% venules, at baseline. Importantly, while these percentage values are close to those observed in experimental studies, the model was not designed to represent an accurate characterization of the complex cerebral microcirculation.
40
Furthermore, only relative changes to hemodynamic parameters are reported. We then emulated the effects of an ischemic stroke on the microvasculature by introducing gradual (i) reduction of perfusion pressure, (ii) capillary constriction, and (iii) capillary occlusions, in three consecutive phases.
41
Computational model – design. Schematic representation of our computational model. Ten capillaries of equal length (L = lc) were organized in parallel. Radii (rC) ranged linearly between 0.08lc and 0.1lc at the beginning of the simulation, and between 0.065lc and 0.1lc after introduction of capillary constrictions. A feeding arteriole (rA = 0.13lc, LA = 2lc) and a draining venule (rV = 0.15lc, LV = 2lc) were placed in series with the capillary network. We assumed laminar flow of a non-compressible Newtonian fluid with dynamic viscosity µ, and calculated perfusion parameters according to Hagen–Poiseuilles equation (1). Here, R is resistance, r is radius, ΔP is the pressure drop over a vessel-segment, and f is flow. Then, the transit times (tt) for all vessels were calculated according to the central volume theorem (2).
41
Hemodynamic parameters were calculated for the entire system (arteriole + capillaries + venule), representing the vessels found within an imaging voxel. To calculate oxygen availability, we assumed that oxygen exchange is limited to the capillary bed. Here, capillary-wise oxygen extraction was calculated according to the flow-diffusion equation (3),
25
where k is the exchange rate constant. We assumed that tissue oxygen tension was zero, and ignored the effects of cooperative oxygen binding.
32
Having taken the effects of flow heterogeneity into account by summing over capillaries, we obtained the net oxygen extraction fraction (OEF) and the corresponding metabolic rate of oxygen (CMRO2) (4), where CA is the arterial oxygen concentration (fixed at 100%). Because hemodynamic outcomes are presented in a normalized fashion, only relative lengths matter, and lc was thus chosen arbitrarily to be 1. The remaining variables only appear in the dimensionless combination 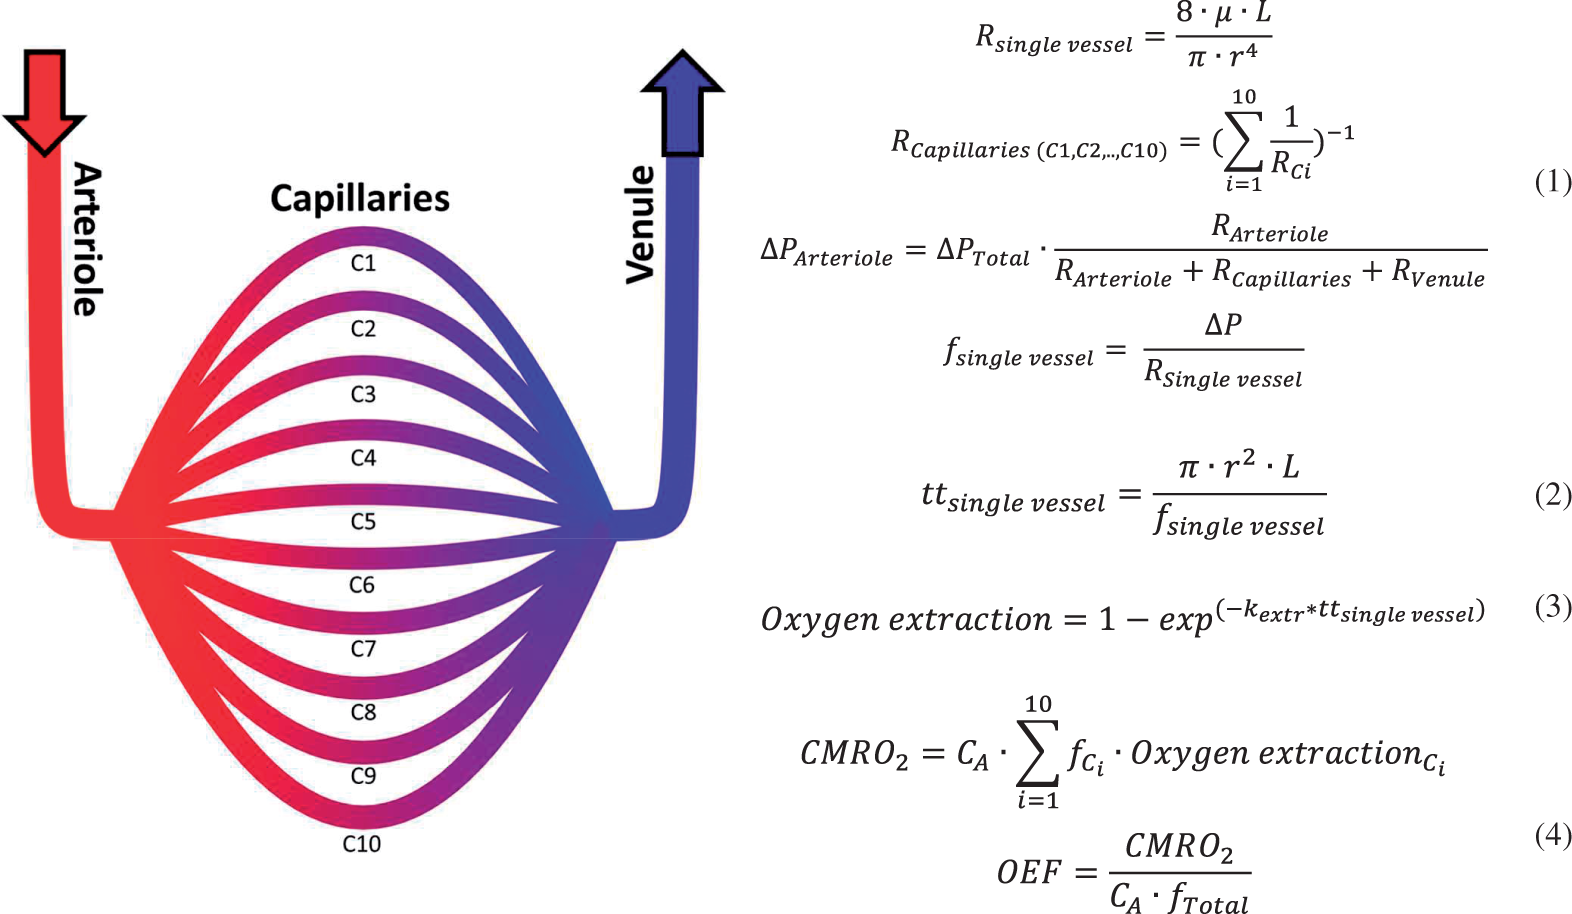
MRI protocol and post-processing
All patients underwent a comprehensive acute MRI protocol on admission, including diffusion-weighed imaging (DWI), T2 fluid-attenuated inversion recovery (T2-FLAIR), and perfusion-weighed imaging (PWI) using gradient echo, echo planar imaging (echo time 30–50 ms, repetition time 1500 ms, gadolinium contrast dose 0.1 mmol/kg body weight at 5 mL/s injection rate; voxel sizes 5–23 mm3). Additionally, an angiogram was obtained by time-of-flight imaging at admission and after 24 h. Follow-up MRI was acquired at one month, median (IQR) = 35 days (25–49), to assess final infarct based on T2-FLAIR images.38,42 Motion correction was performed using SPM8 (Wellcome Trust Centre for Neuroimaging, UCL, UK) running MATLAB (MathWorks Inc, Natick, MA, 2015a). Arterial input functions (AIFs) were determined semi-automatically from voxels in the territory of the contralateral middle cerebral artery.
43
Perfusion maps were calculated by approximating the voxel-wise transit time distribution to a gamma distribution in order to characterize the retention of tracer.
35
In turn, the gamma distribution is characterized solely by a shaping parameter (α) and a scaling parameter (β), and can be characterized in terms of its mean
Region of interest
DWI lesions, if present, were manually outlined by experienced readers, who had access to apparent diffusion coefficient (ADC) and T2FLAIR images to assure that lesions represented acute diffusion restriction. Perfusion lesions were manually outlined on time-to-peak maps to include all potentially hypoperfused voxels in the analysis. The region of interest (ROI) was then defined as the mismatch between time-to-peak and diffusion lesion masks – and referred to as tissue-at-risk below. Outcome was defined for each voxel according to the final infarct lesion as manually outlined on follow-up T2-FLAIR images. Perfusion and diffusion lesions were drawn by one rater. Follow-up lesions were drawn independently by four raters, and voxels accepted into the follow-up lesion if two or more raters included it. 45
Statistical analysis
Patients were grouped according to recanalization status at 24 h on the Thrombolysis in Myocardial Ischemia (TIMI) scale (TIMI ≤ 1 not recanalized, TIMI > 1 recanalized). 46 Parametric variables were compared using the Student’s t-test, while non-parametric variables were compared using the Mann–Whitney U test. Ratio comparison was performed using a χ2 test. All voxel-based plots and analyses were balanced according to subject-wise voxel sizes. Perfusion variables were normalized to contralateral NAWM to allow composite voxel-wise analyses of outcome measures across all patients. 47 We performed this analysis by multiple regression, using a linear model to examine correlations and a logistic model to determine risk of infarction. To enable comparison of effect size between coefficients, perfusion variables were furthermore standardized by subtraction of their mean and division with their standard deviation, before introduction to the models. All analyses were performed using MATLAB.
Results
Patient characteristics
Patient demographics, stroke characteristics, and outcomes.
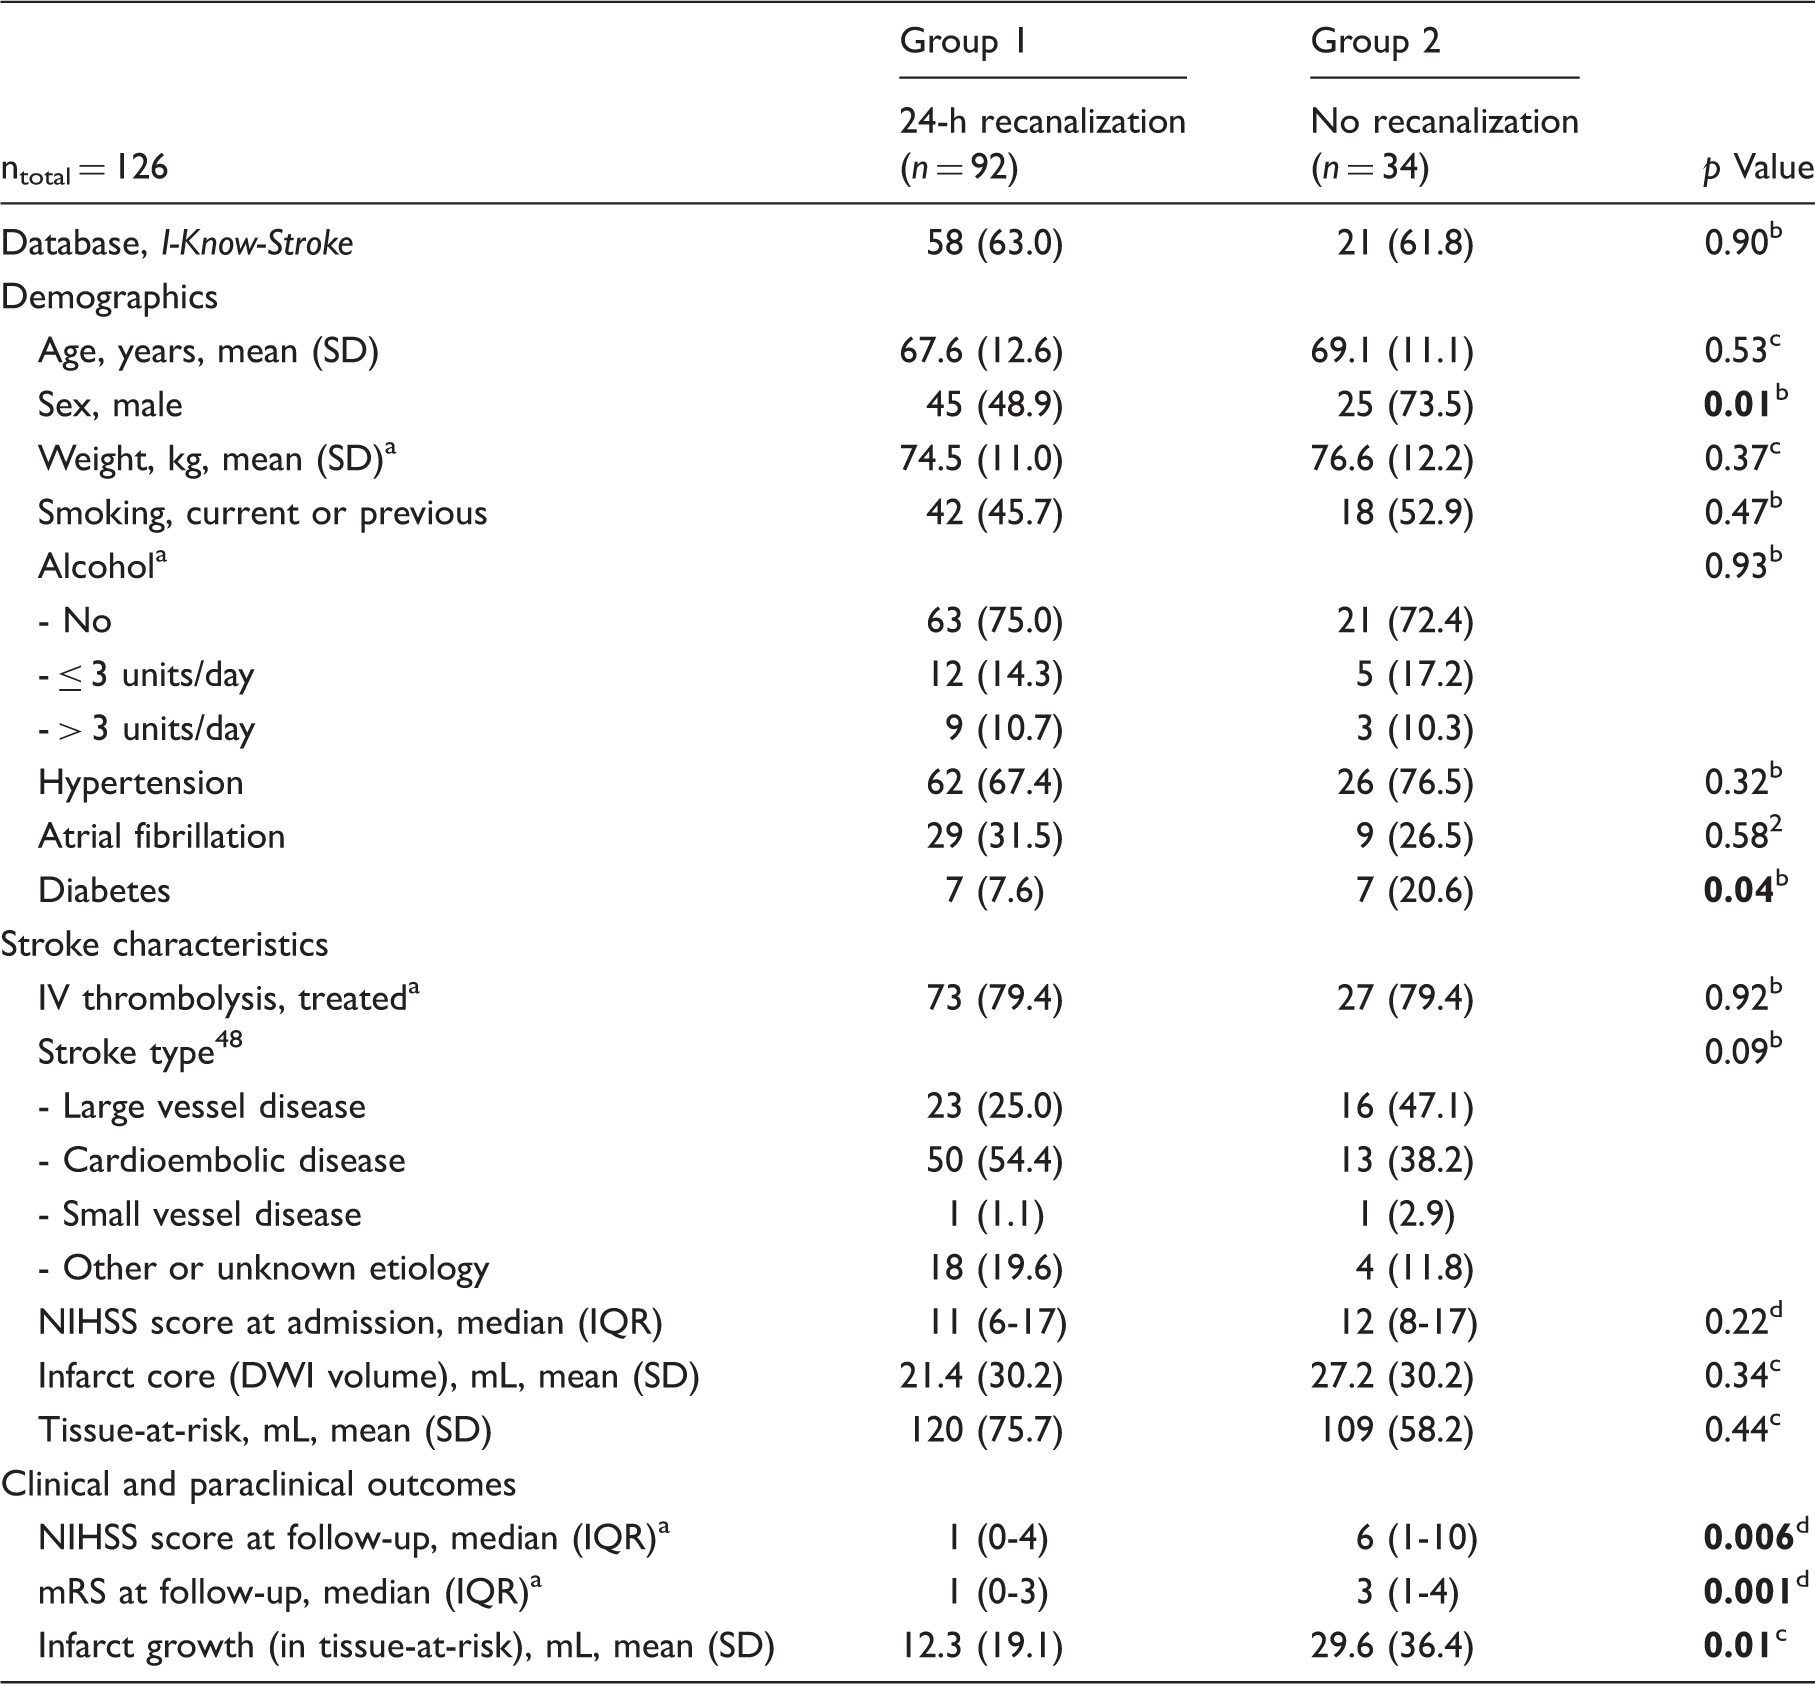
Note: Values are total (%) unless stated otherwise. P values smaller than 0.05 are highlighted in bold.
Missing information (weight: n = 14; alcohol: n = 13; IV Thrombolysis n = 1; NIHSS at follow-up: n = 13; mRS at follow-up: n = 6).
Chi-square test.
Student’s t-test.
Mann–Whitney U test.
Computational model of graded microvascular failure
Graded microvascular failure resulted in characteristic hemodynamic changes in the three phases shown in Figure 2. In Phase 1, as perfusion pressure drops, CBF decreases in a linear fashion. As a result, net oxygen availability (CMRO2) also decreases. Note that oxygen extraction is inherently more efficient for longer capillary transit times, limiting the drop in CMRO2. Consistent with earlier modelling results by Rasmussen et al. for passive, compliant vascular networks, no RTH changes are observed, as CTH increases in proportion to MTT.
37
In Phase 2, where capillary constrictions are gradually introduced across the capillary bed, both CTH and RTH increase, with a slight parallel reduction in OEF. This relation between CTH and OEF is in agreement with models in all-open capillary beds.32,33 Since only slight changes of capillary radii are introduced, vascular resistance only increases by ∼3% (not shown), with a correspondingly small reduction of CBF. In Phase 3, as more severely affected capillaries become occluded, the observed CTH and RTH now decrease. This leads to increased, but largely non-nutritive, flow in the capillaries that remain open, corresponding to a reduced capillary transit time. While some ‘physiological shunting’ was introduced during Phase 2, net oxygen extraction becomes severely limited in Phase 3 as capillaries are occluded. Accordingly, CMRO2 decreases at a much faster rate than CBF.
Computational model – resulting hemodynamic parameters. (a–c) Computational model of 10 capillaries organized in parallel and sorted according to flow. In all columns, circle sizes indicate relative vessel sizes. Size differences between individual capillaries are exaggerated to allow visual detection. Along the X-axis, we introduced hemodynamic disturbances in a graded fashion: In Phase 1 (leftmost column), we reduced the perfusion pressure to simulate the onset of a stroke (gradual, 50% reduction). Through the remaining experiment, the perfusion pressure is stationary. In Phase 2 (middle column), we constricted the smaller vessels (capillaries) to introduce more heterogeneous microscopic flows (capillary radii ranged linearly from 0.08lc to 0.1lc (top-to-bottom) at the beginning of phase 2, and between 0.065lc and 0.1lc after introduction of capillary constrictions). In Phase 3 (rightmost column), we occluded the most constricted capillaries one-by-one to simulate onset of capillary no-flow (Capillary occlusions). (a) Capillary-wise, normalized flow, (b) oxygen extraction for each capillary, (c) resulting hemodynamic measures. MTT, CTH, and RTH are normalized to simulate an RTH of 1 (CTH equal to MTT) at the beginning of the simulation, and relative changes of these variables are hence comparable. All other variables are normalized to their individual maximum value during the simulation. MTT represents the total transit time of the system, while MTTC and MTTA+V represent the mean transit time present in the capillary segment or the arteriolar/venular segment, respectively. Between observations 1 and 2, we reduced the perfusion pressure by 50%, while capillary constrictions lead to a 74% RTH increase. In the same interval, CBF decreased by 52%, whereas CMRO2 only decreased by 30% (owing to prolonged capillary transit times, and thereby better oxygen extraction). Conversely, between observations 2 and 3, no changes in perfusion pressure were introduced. The step-wise onset of capillary occlusions, however, led to extreme homogenization of both CTH and RTH. Interestingly, this led to a limited CBF reduction of only 13%, whereas CMRO2 fell by 49%. This disparity between changes in CBF and CMRO2 is caused by a drastic reduction in OEF as blood flow is forced through the remaining open capillaries, giving rise to poor oxygen extraction efficacy. At the last observation, CMRO2 was reduced by an additional 60%, whereas CBF only fell by 29%.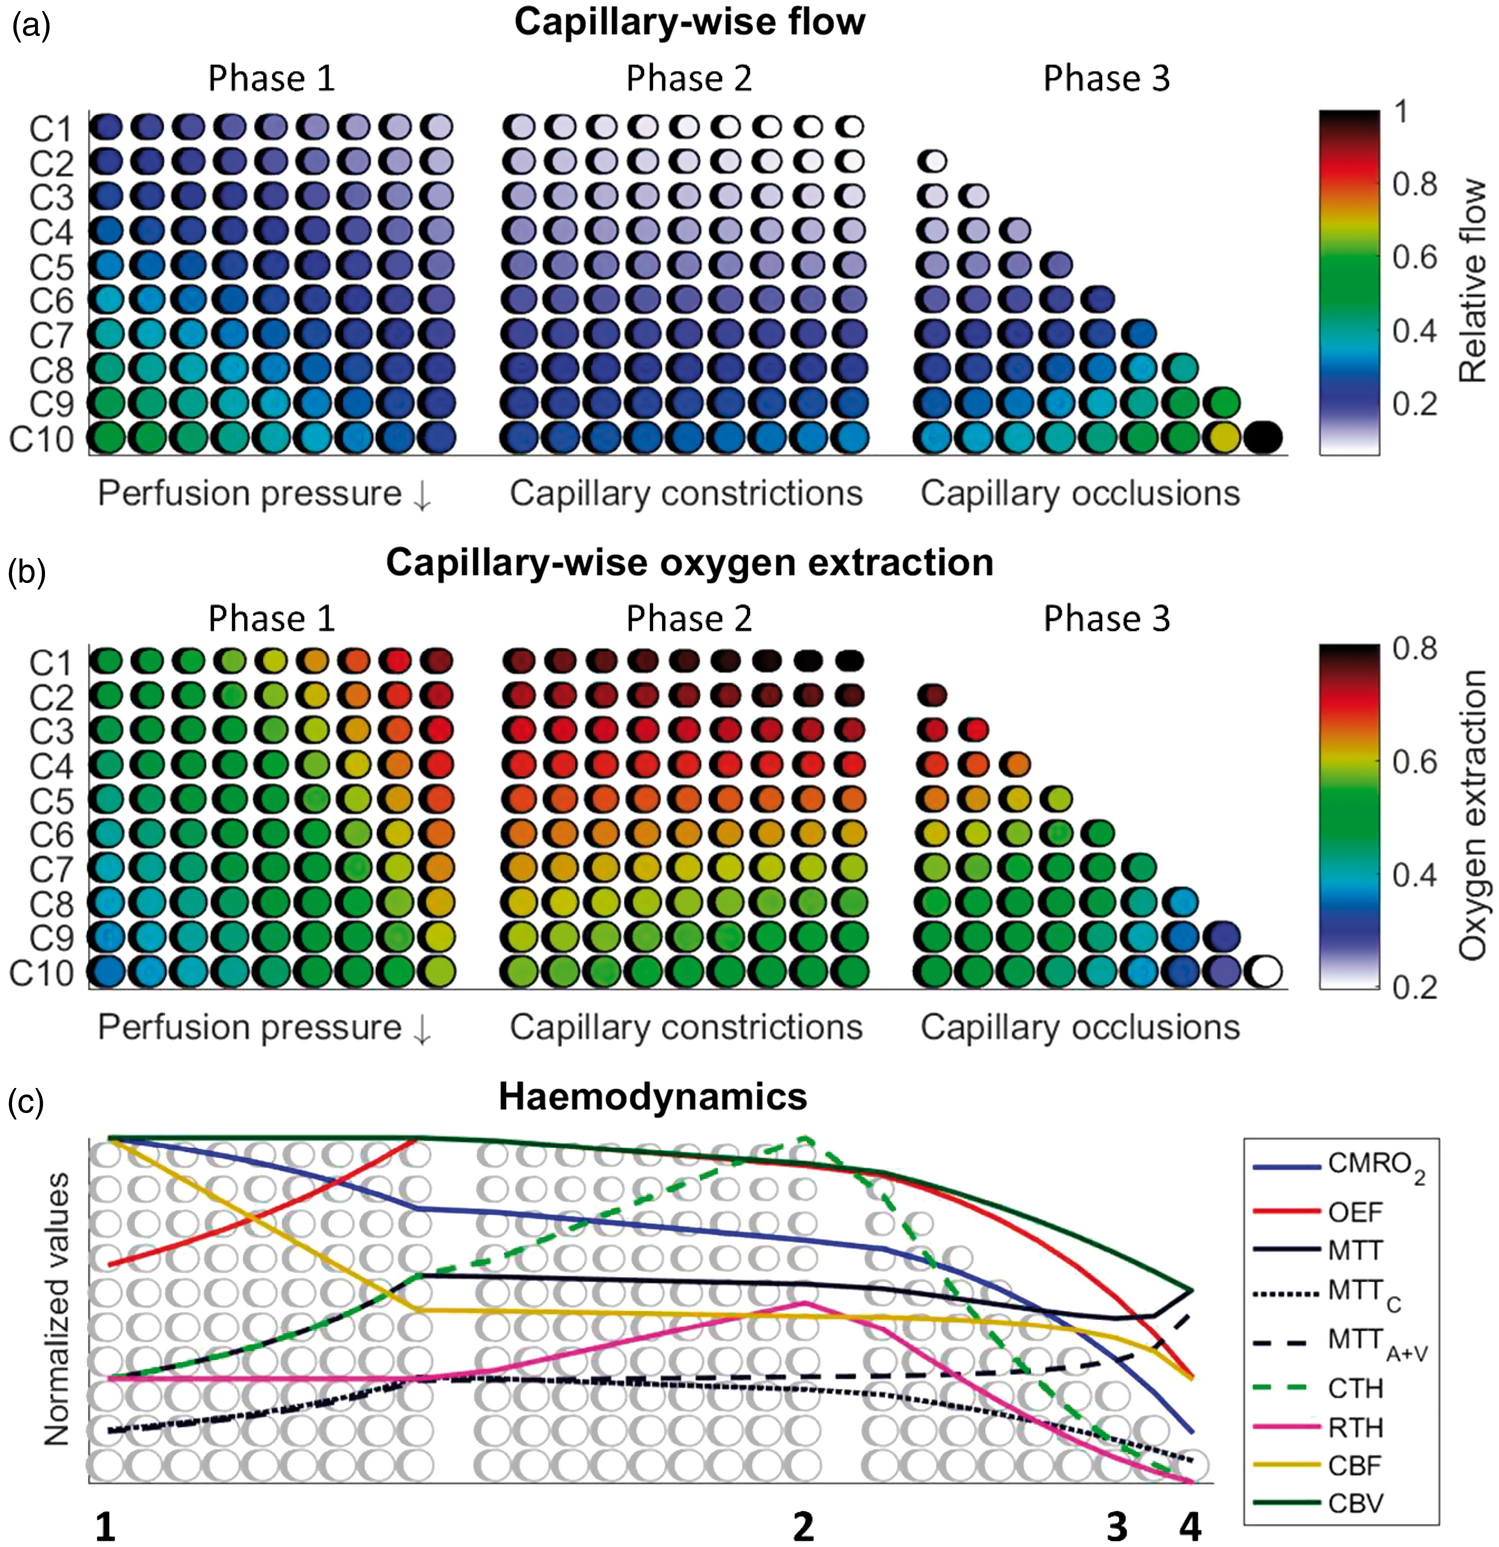
Voxel-wise investigation
MTT and CTH were highly correlated (r2 = 0.85), consistent with the behaviour of a microvasculature with passive, compliant vessels.
37
Deviations from the ‘passive’ increase of CTH with MTT were less dependent on perfusion pressure, as indicated by the weak correlation of RTH with MTT (r2 = 0.21), see Figure 3. For a given MTT value, low CTH values were associated with high risk of infarction, particularly if recanalization was not achieved – compare Figure 3(a) and 3(b). Figure 3(c) and (d) show the voxel-wise infarction rate as a function of RTH and MTT without and with recanalization, respectively. In Figure 4, two, albeit extreme, cases of persistent large vessel occlusion with markedly different outcomes illustrate the potential detrimental effects of low RTH in the absence of recanalization.
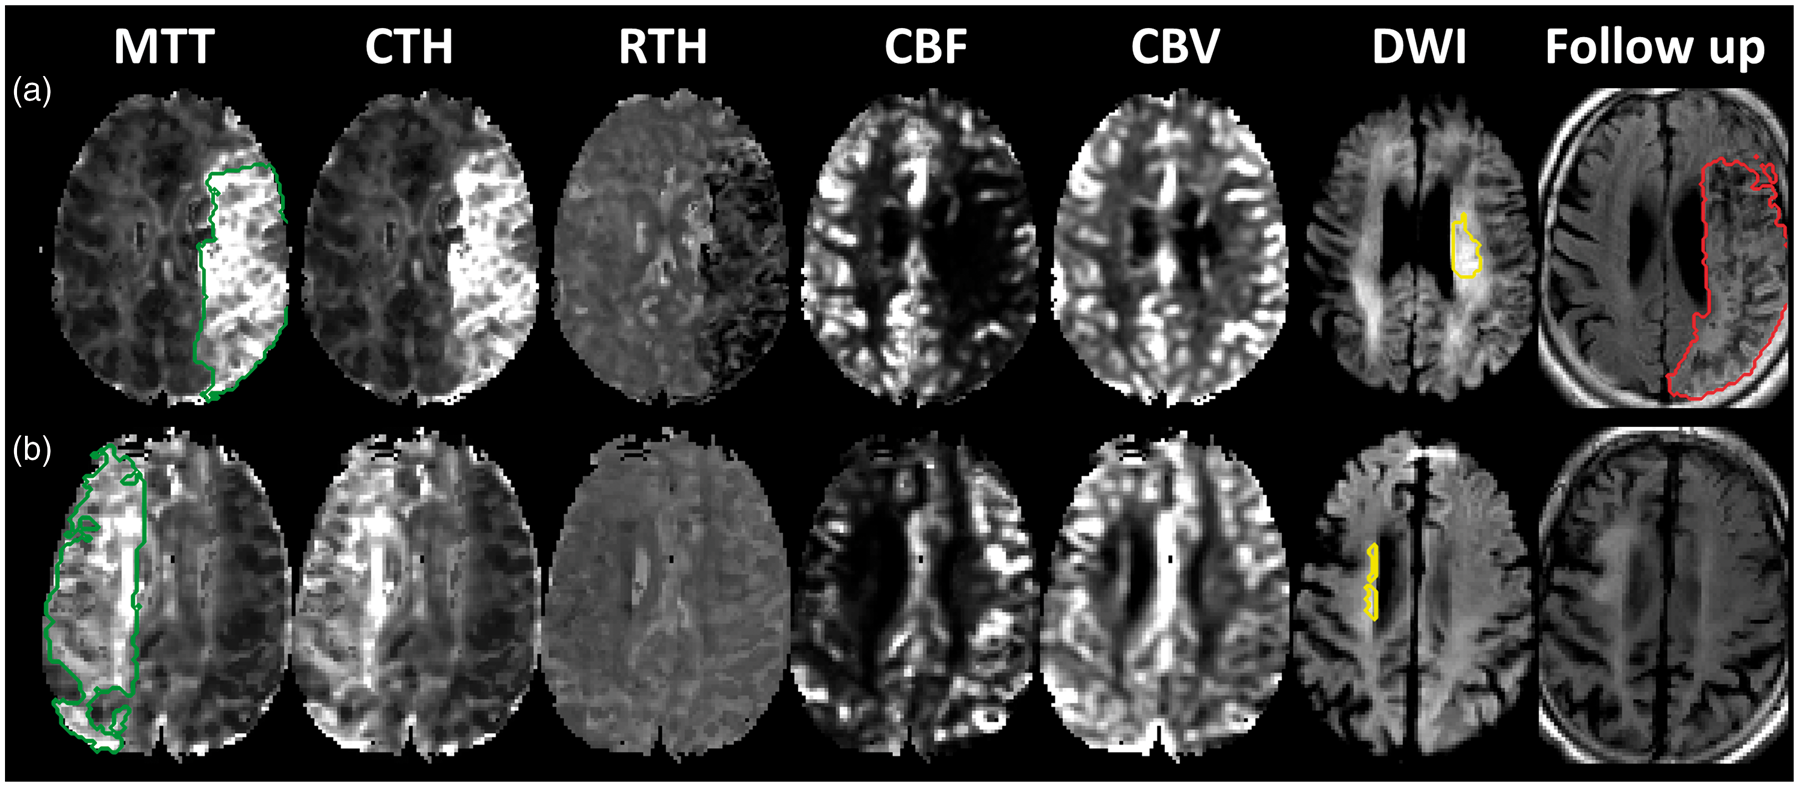
Voxel-wise infarction rate depending on MTT, CTH, and RTH. Plots of infarction ratios (as surface colors) as a function of MTT and CTH for mismatch tissue in which recanalization was not achieved at 24 h (Panel A) and in which recanalization was achieved (Panel B), respectively. Panels C and D show the corresponding plots as functions of MTT and RTH. The heights of the surface plots indicate the relative proportion of tissue with a given combination of these parameters. For tissue with MTT ≤5 s, only a very small proportion went on to infarct at follow-up (recanalization: 7.3%; no recanalization: 14%). Patient cases. The figure shows parametric maps for two patients who presented with middle cerebral artery occlusion, none of which recanalized at 24 h. Acute perfusion lesions (green) and diffusion lesions (yellow) and follow-up T2FLAIR lesions (red) are delineated on the MTT, DWI and follow-up T2FLAIR maps, respectively. A close correlation between MTT and CTH maps is readily observed; however, the RTH maps reveal low values in the tissue at risk of patient A, whereas the RTH map is inconspicuous in patient B. Both patients present impaired CBF in the penumbra, while CBV, particularly corresponding to the cortical, leptomeningeal anastomoses, is elevated compared to the contralateral region. Conversely, CBV is low in the diffusion lesions. No infarct growth was observed in patient B, whereas the entire TTP-lesion infarcted in patient A. The dynamic range shown for the perfusion maps are: MTT and CTH 0–15 s; RTH 0.6–2; CBF 0–60 mL/100 mL/min; CBV 0–8 mL/100 mL.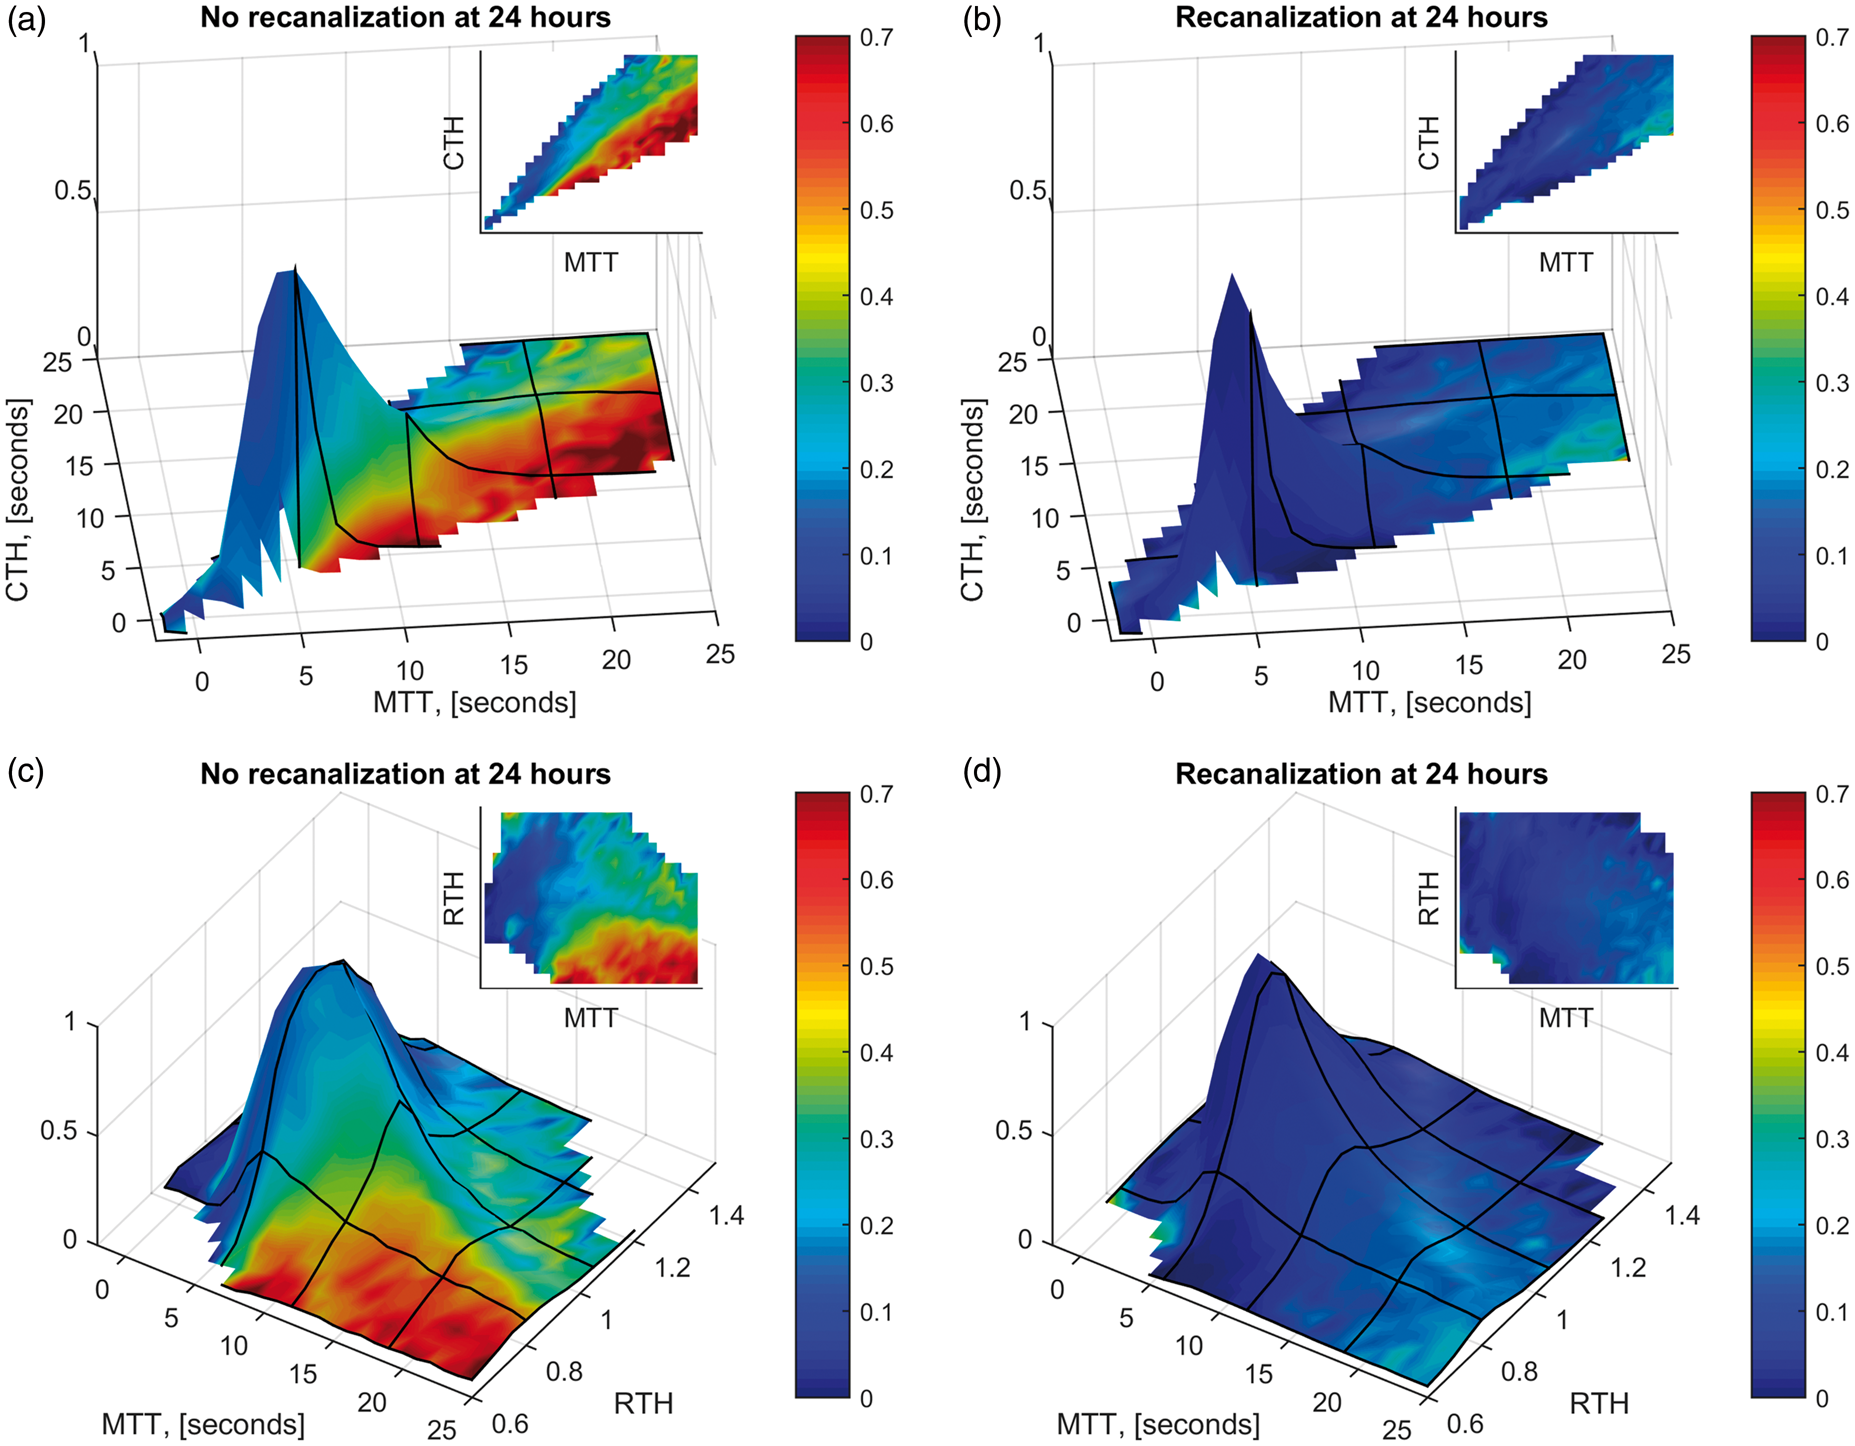
Infarct risk
In 25% of the manually delineated, perfusion-diffusion mismatch lesions, MTT values were at or below 5 s. These voxels displayed very low risk of infarction (Figure 3) and normal CBF levels (see Figure 5(b) below). These voxels were not included in the following analyses.
Relation between RTH, CBF and CBV. Surface plots of mean voxel CBV (Panel A) and CBF (Panel B), indicated as surface colors, as a function of MTT and RTH. The height of the surface plots indicate the relative proportion of tissue with a given combination of these parameters. Note that CBV is generally elevated in the tissue-at-risk, corresponding to an average value of 8.0 mL blood/100 mL, or ∼3 times that of normal appearing white matter.
44
Additionally, mean CBV was higher in tissue with prolonged MTT (> 5 vs. ≤ 5 seconds): 8.3 vs. 6.9 mL/100 mL. Mean CBF was 43 mL/100 mL/min in tissue with MTT ≤5 s vs. 21 mL/100 mL/min in tissue with prolonged MTT.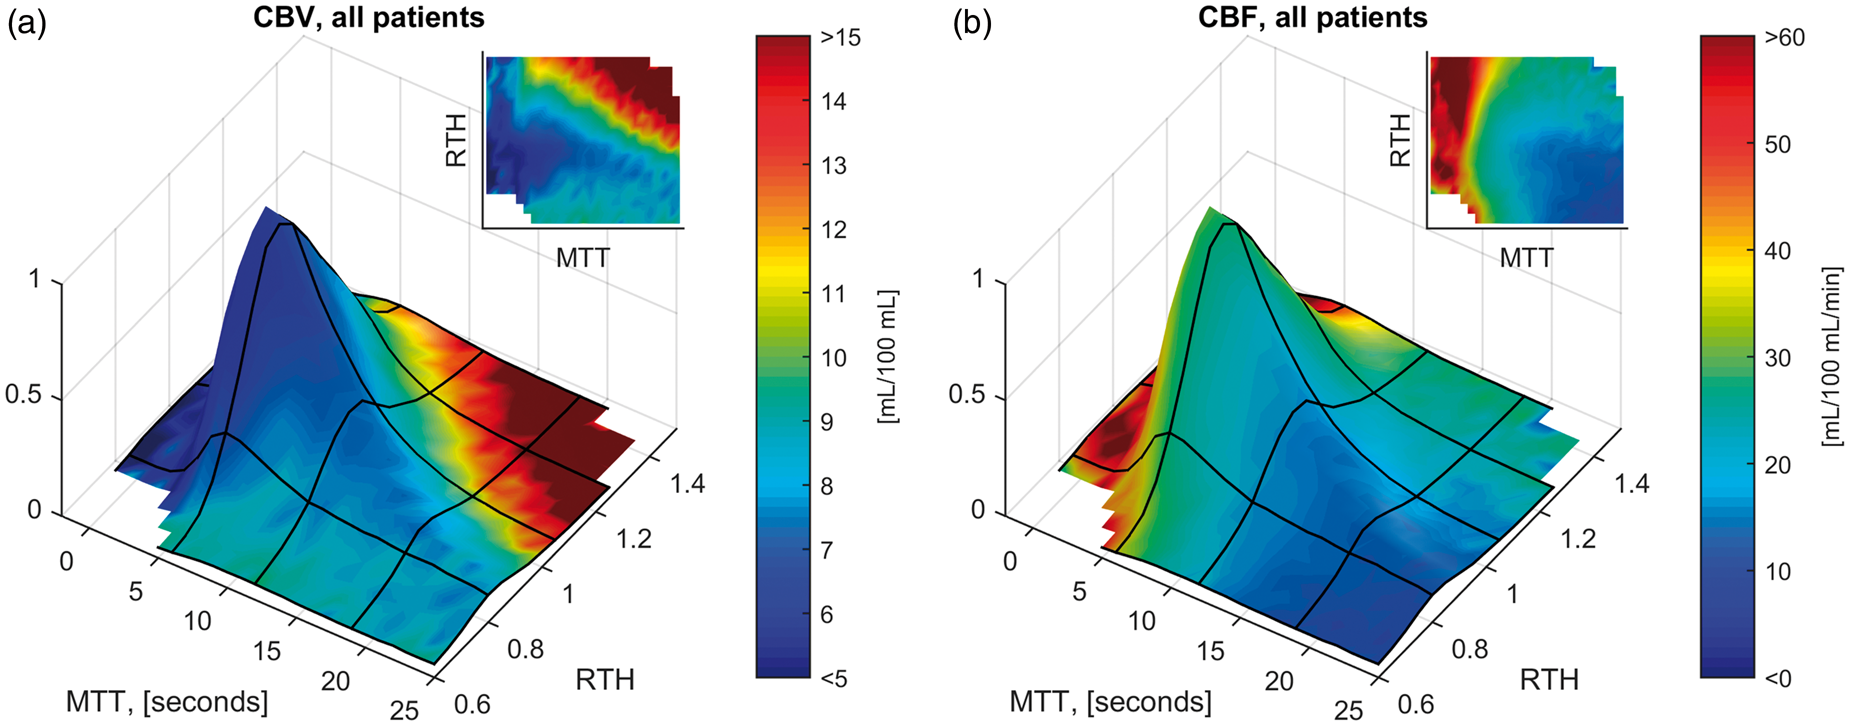
In tissue with prolonged MTT (N = 852,961 voxels; total volume = 10.8 L), the mean (standard deviation) of the perfusion variables was: MTT 13 (11) s, CTH 12 (7.6) s, RTH 1.0 (0.2), CBV 8.3 (7.2) mL/100 mL tissue, and CBF 21 (20) mL/100 mL tissue/min. In patients, who did not recanalize at 24 h, 31% of tissue with prolonged MTT infarcted vs. only 11% in patients who recanalized.
According to the central volume theorem, MTT = CBV/CBF.
41
Including all three parameters in a logistic model might therefore make the corresponding coefficients indeterminable. The primary objective of this study was to examine the effects of RTH (and hence CTH) on infarct risk, including its interplay with both CBF and CBV. Therefore, we chose to include only RTH, CBF, and CBV in our statistical model, keeping in mind that the model was limited to voxels with prolonged MTT (>5 s). Furthermore, we allowed each predictor to affect voxel-wise survival depending on recanalization status, yielding the following formula, where R is a logical indicator of recanalization status (R = 1 recanalization; R = 0 no recanalization)
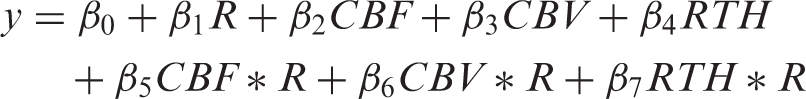
Resulting coefficients for perfusion parameters, depending on recanalization status, were: no recanalization (CBF = −0.14, CBV = −0.18, RTH = −0.62), recanalization (CBF = −0.61, CBV = −0.16, RTH = −0.20). Here, coefficients in the absence of recanalization are β2-4, while, in case of recanalization, the corresponding interaction with recanalization status is added (CBF = β2 + β5, CBV = β3 + β6, RTH = β4 + β7). Since all perfusion variables are normalized to their own standard deviation, coefficients can be interpreted as the expected effect, corresponding to a change of one standard deviation. Thus, for RTH, a decrease from 1.2 to 0.8 (equivalent to two standard deviations) results in a change of
Relation between RTH, CBF, and CBV
In Figure 5, mean values of CBV (panel A) and CBF (panel B) are shown according to voxels’ MTT and RTH values, respectively. Note that CBV is higher in voxels with prolonged MTT, while CBF decreases steadily with increasing MTT. Also, at least for CBV, an association with RTH is readily observable. Interestingly, CBV is relatively low, although not to the level of contralateral white matter, in the region corresponding with the highest infarct risk as observed in Figure 3(c). To further investigate these observations, we devised two linear models with MTT and RTH as independent predictors of CBV and CBF, respectively. Applying the analysis to voxels with prolonged MTT (>5 s), we found significant correlations for both CBV (coefficients: MTT 1.3, RTH 1.4, p = 0) and CBF (coefficients: MTT −3, RTH 3.6, p = 0). These coefficients correspond to a CBV reduction of 1.4 mL/100 mL and a CBF reduction of 3.1 mL/100 mL/min for each 0.2 decrease in RTH, respectively.
In Figure 6, we plotted infarct risks, depending on RTH, CBV, CBF, and recanalization status. For patients, who recanalized at 24 h, CBF provided a clear, threshold-type, relationship with infarct risk at ∼6 mL/100 mL/min. Below this threshold, the corresponding proportion of tissue that ultimately infarcted was 27% vs. only 9% in tissue with ‘preserved’ CBF. Corresponding proportions in patients who did not recanalize were 45% and 28%. Thus, in patients who did not recanalize, a large proportion of tissue with preserved CBF infarcted. Here, the risk of infarction was largely dependent on RTH. Thus, in decreasing quartiles of RTH, the ratio of tissue that ultimately infarcted increased from 17%, through 21%, 27%, and finally 45% vs. only 7%, 9%, 10%, and 11% when recanalization was achieved. These findings were in close agreement with the results from the logistic regression.
Voxel-wise infarction rate depending on CBV, CBF, and RTH. Plots of infarction ratios (as surface colors) as a function of CBV (a, b), CBF (c, d) and RTH for voxels with prolonged MTT (> 5 s). The heights of the surface plots indicate the relative proportion of tissue with a given combination of these parameters. For patients who recanalized at 24 h, CBF provided a clear, threshold-type, relationship with infarct risk at ∼6 mL/100 mL/min (d). Below this threshold, the proportion of tissue that ultimately infarcted was 27% vs. only 9% in tissue with ‘preserved’ CBF. Conversely, in patients who did not recanalize (c), a large proportion of tissue with preserved CBF infarcted. Here, the risk of infarction was largely dependent on RTH. Thus, in decreasing quartiles of RTH the ratio of tissue that ultimately infarcted increased from 17%, through 21%, 27%, and finally 45% vs. only 7%, 9%, 10%, and 11% when recanalization was achieved.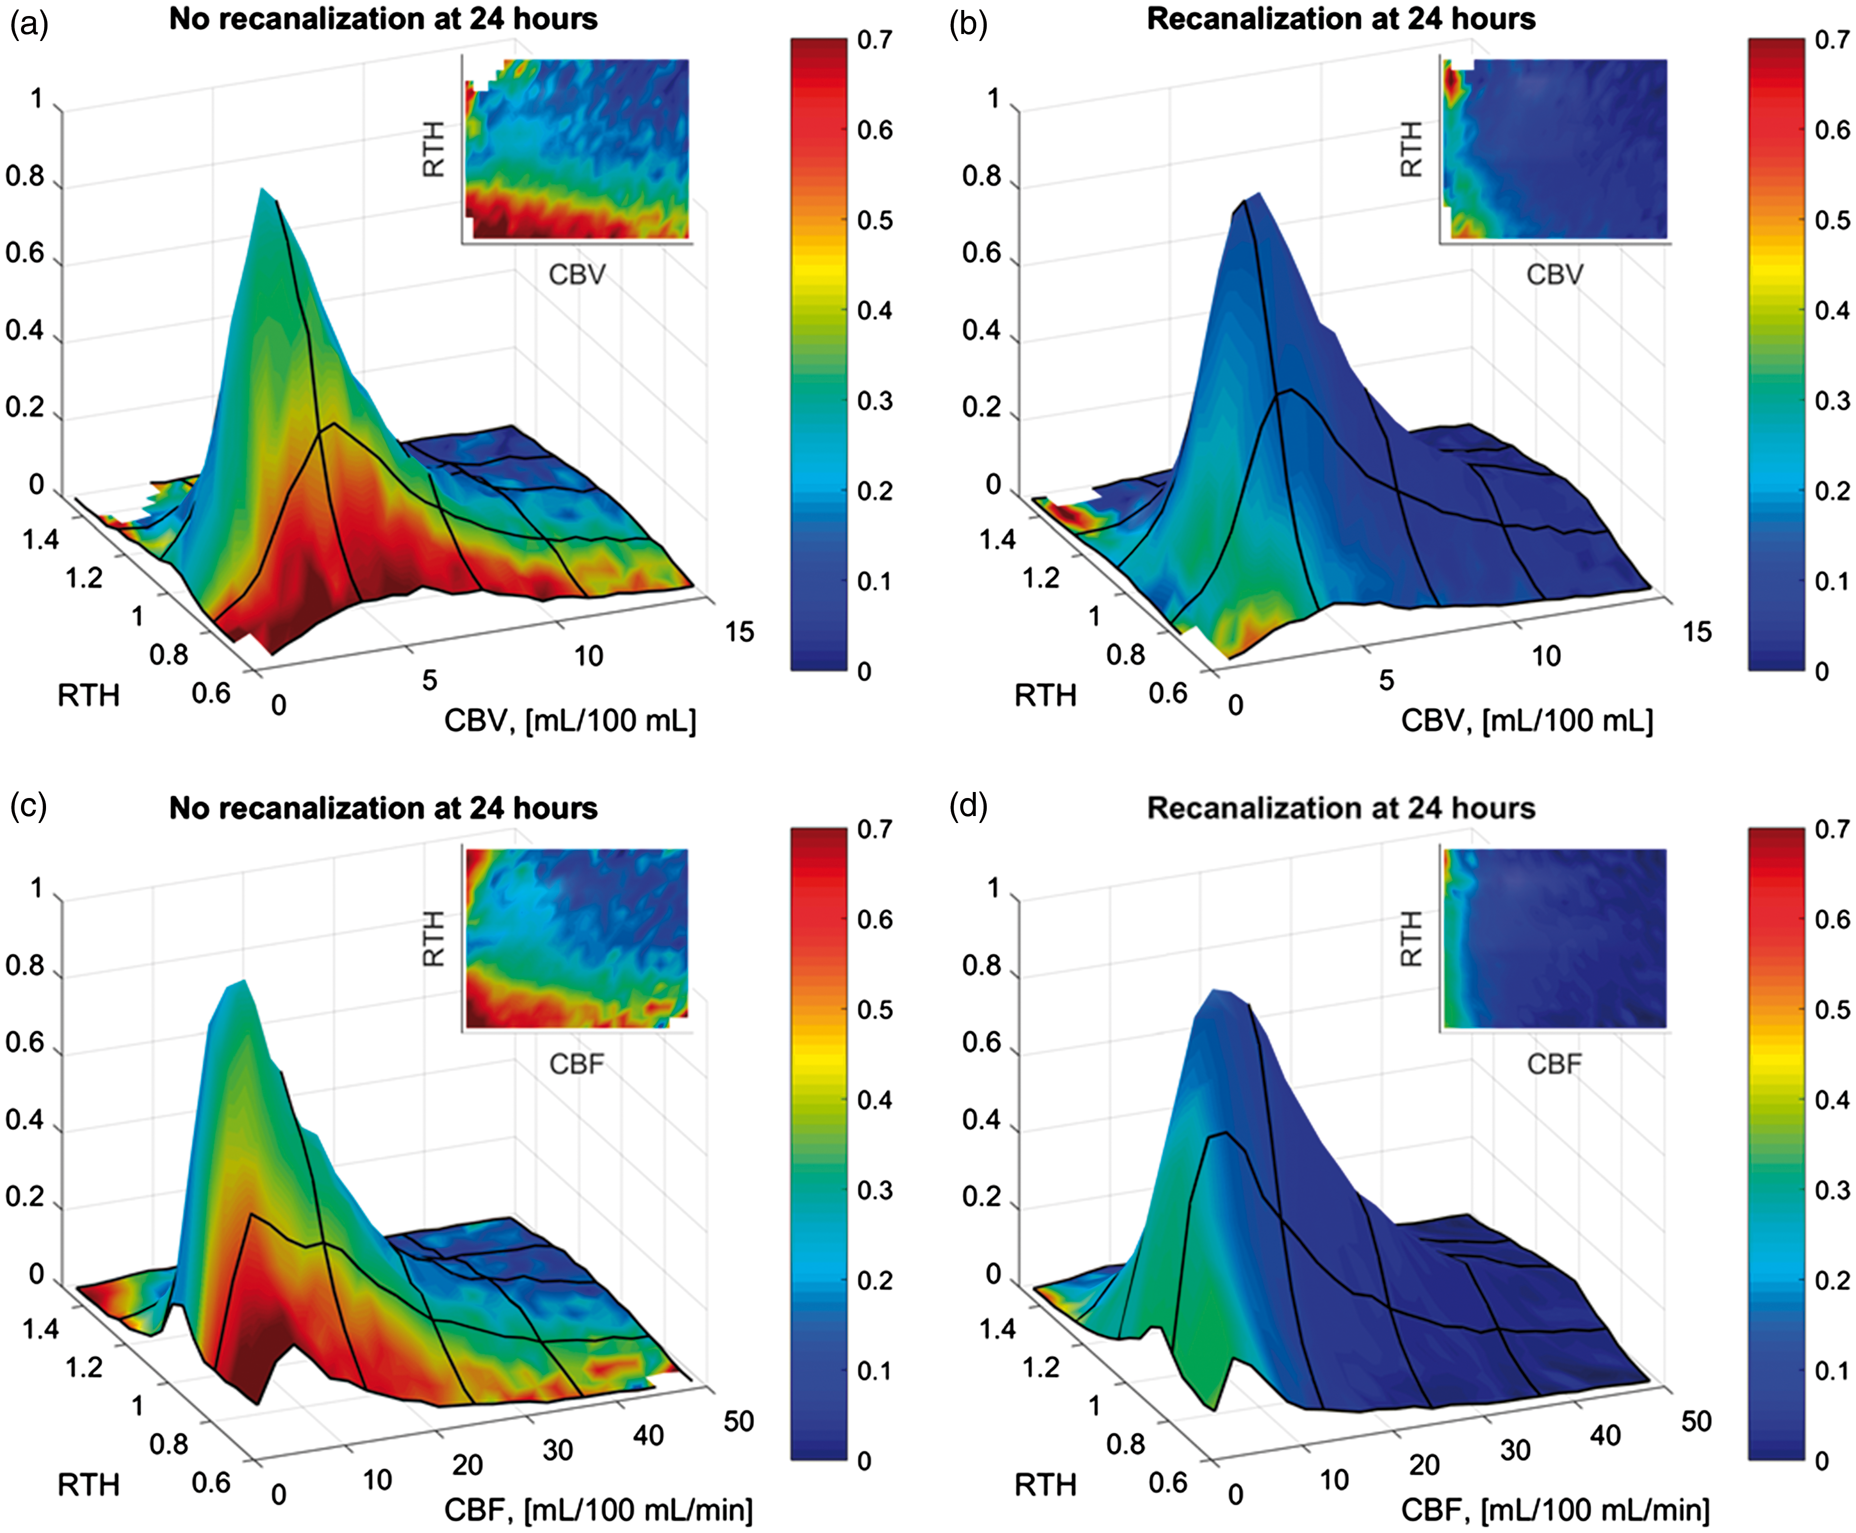
Time from onset analysis
The ischemic penumbra proceeds to infarction unless recanalization is achieved. This quality separates penumbral tissue from tissue with benign oligaemia. Across the entire patient population, low RTH was strongly, and almost exclusively, associated with voxel infarction in the absence of recanalization at 24 h. Therefore, we examined whether tissue with low RTH gradually disappears as more time elapses from symptom onset. Having excluded already infarcted voxels (DWI confirmed) from our sample, we expected that hypoperfused voxels with low RTH would be more prevalent in patients who presented early vs. late. Of the 126 patients included in this study, 75 were scanned within 3 h of symptom onset, 15 after 3 h, while 36 had an uncertain onset time. Figure 1 of the Supplementary material shows the proportion of tissue, with given combinations of MTT and RTH that originated from patients scanned within 3 h of symptom onset. Consistent with the notion that tissue with long MTT and low RTH represents penumbral tissue; such tissue was more likely to be present in patients imaged within 3 h of symptom onset, whereas voxels from patients arriving late were more likely to have normal MTT (≤ 5 s) or prolonged MTT and high RTH values.
Discussion
Herein, we present the first study to quantify and interpret microvascular perfusion heterogeneity in the human ischemic penumbra. By parametric modelling of perfusion MRI data, we characterize voxel-wise blood flow not only in terms of traditional perfusion quantities (MTT, CBF, and CBV), but also by the ‘quality’ of its microscopic distribution (CTH and RTH). The main finding of our study is that not only blood flow, but also its intra-voxel distribution, determines tissue fate in acute ischemic stroke. Thus, we identified regions of extreme flow homogenization as indexed by their RTH values, i.e. their relative departure from the normal relation between CTH and MTT, as particularly predictive of tissue fate. While tissue with severely restricted CBF (≤ 6 mL/100 mL/min) was likely to infarct, largely independent on recanalization status, the fate of tissue with preserved CBF (>6 mL/100 mL/min) was highly dependent on RTH. Accordingly, the proportion of tissue that infarcted increased from 17% to 44% as RTH decreased through its quartiles. Our study extends earlier human studies in which the relation between intra-voxel flow heterogeneity and tissue fate was studied using perfusion-weighted MRI.49–51 These studies did not quantify flow heterogeneity, but rather reported the statistical deviation of intra-voxel relative flow distributions from those observed in normal tissue. This measure provided maps that were highly correlated with final infarcts as observed on a follow up scan. Consistent with our findings, the authors reported that flow disturbances appeared to represent intra-voxel homogenizations. By using RTH as a measure of relative flow homogenization, we were able to further assert this notion, and to demonstrate that, in the absence of recanalization, RTH is a strong predictor of subsequent infarction. Indeed, tissue with prolonged MTT and low RTH seems likely to represent salvageable tissue, and our study therefore offers strong support to the notion that failing microvascular circulation is a key feature of the ischemic penumbra.4,7,26
The second finding of our study is that capillary occlusions appear to play a major role in the microvascular failure identified in hypoperfused tissue. According to our computational model, step-wise occlusion of individual capillaries results in homogenization of transit times in a simplified microvascular network. Meanwhile, in this setting, transit times in the capillaries that remain open decrease, thereby severely impairing oxygen extraction. This redistribution leads to a state of functional shunting with reduced oxygen availability, and thus, most likely, an increased risk of infarction. A causative link between capillary no-flow and decreasing values of CTH and RTH in the penumbra is consistent with our patient data: here, low RTH correlated with both low CBF and low CBV, while the highest risk of infarction existed, when all three variables were low, consistent with the metabolic derangement predicted by the computational model. In addition, hypoperfused, yet still non-infarcted tissue with low RTH was more likely to be present in patients who arrived early at the hospital, consistent with the gradual recruitment of penumbral tissue into the infarct core over time.
We developed a computational model to address the combined effects of functional shunting and no-flow in the microcirculation. Our previous models of tissue oxygen availability calculate the effects of functional shunting in one step, correcting for the fraction of open capillaries in a subsequent step.32,33 Herein, our computational model provides a convenient way of computing and visualizing the effects of graded capillary failure in a manner that captures key features of microvascular changes reported in experimental studies of ischemia, including capillary constrictions and occlusions. We note that experimental studies show augmented no-flow with more severe CBF reduction.13,21 This is consistent with our model as well as our patient data, in which we found a negative correlation between MTT and RTH, such that as MTT increased, transit time homogenization became more severe. We note that by calculating the relative heterogeneity of transit times, RTH, instead of CTH, we removed the inherent dependency of CTH on MTT.36,37 According to our computational model, this is particularly useful in distinguishing passive changes in the microvascular distribution of blood as a result of hypoperfusion (here, CTH increases while RTH remains constant) from physical and/or rheological changes within capillary networks that affect both CTH and RTH.
To our knowledge, three experimental studies have reported some measure of perfusion heterogeneity in models of ischemic stroke.14,52,53 Although all studies found some degree of increased heterogeneity, direct comparison to our results is hampered by (i) methodological differences, particularly as it pertains to perfusion measure – transit time, 14 red blood cell velocity, 52 or tracer concentration, 53 and lack of association with outcome. For example, Tomita et al. reported increased heterogeneity of capillary ‘microflows’ (1/MTT) after both 10 and 120 min of focal ischemia in a rat model. 14 However, paradoxically, mean microflow increased in four of five rats between 10 and 120 min of ischemia. The authors ascribed this observation to a loss of capillaries with reduced flow – i.e. onset of capillary no-flow. This “homogenization” did not, however, decrease the heterogeneity of microflows in the study. In the supplementary material, however, we show how this likely would have been the case, if transit times, rather than their inverse, had been used (Supplementary Figure 2).
The capillary no-flow phenomenon remains controversial; particularly so, as it pertains to whether capillary perfusion deficits persist after recanalization – i.e. no-reflow. 24 Our results support the notion that capillary no-flow is an important characteristic of the ischemic penumbra. Our results further suggest that capillary no-flow may be reversible with recanalization. This does not preclude that some degree of capillary no-flow exists in the hours following recanalization. In the Supplementary material, Figure 3, perfusion scans from a patient for which a 3-h MRI scan was available are shown. This patient presented with a middle cerebral artery occlusion, which had already recanalized at 3 h (TIMI = 2), after the initial scan. Nevertheless, we observed only partial reversal of the RTH (and MTT) lesion. This is consistent with the results of Lee et al., 16 who showed persistent changes to capillary perfusion after recanalization, when the duration of the initial occlusion was extended from 1 to 2 h. Together, the observations support the notion that restoring incomplete microcirculatory reperfusion might improve outcome after an ischemic stroke. 4 Thus, the development of therapies to ensure capillary reperfusion may therefore represent an important adjuvant to existing recanalization therapies. 54 Our results raise another intriguing question, namely whether such therapies might benefit patients who are either ineligible for recanalization therapy, or en route to a specialized stroke unit. Our patient data suggest that tissue with prolonged MTT, but normal RTH, has limited risk of infarction, even if recanalization is not achieved. If capillary reperfusion leads to an increase in RTH as suggested by our computational model, such therapies might therefore augment tissue survival by improving the microscopic distribution of the remaining blood supply, even if recanalization or collateral supply is incomplete.
Strengths and limitations
This study was based on two prospectively sampled databases; one applying a multi-center, observational design (I-KNOW), and the other being a single-center interventional study (Aarhus percondition study). While this approach introduces a somewhat heterogeneous study population, we took strict measures to assure comparability between databases. Also, and of great significance, the detrimental effect of low RTH observed was consistent in sub-analyses of both databases and present independently of whether or not remote perconditioning was given (Supplementary Figure 4 and Supplementary Table 1). Interestingly, a smaller fraction of the tissue at risk infarcted in the I-KNOW database vs. the Percondition study (26% vs. 38%). This was likely explained by a longer duration between onset and acute MRI in the I-KNOW study (mean (SD): 2.8 h (1.8) vs. 1.5 h (0.4), p = 0.03), and also reflected in larger, albeit not significantly, DWI lesions present in the I-KNOW study (mean (SD): 41 mL (38) vs. 15 mL (20), p = 0.09). Note that the latter two analyses were confined to patients with a certain onset time (N = 90). Importantly, both databases consisted of consecutive patients who met the inclusion criteria, and all patients were scanned immediately upon admission. We therefore believe that inclusion bias was limited in the time from onset analysis.
While our perfusion variables provided strong predictors of tissue fate, our results cannot immediately be compared to the predictive performance of other transit time metrics reported in the literature, including the commonly used Tmax and MTT parameters derived from nonparametric deconvolution approaches.55,56 These metrics are affected by, but fail to disentangle, transit time heterogeneity properties.34,57 In light of our findings, we speculate that this shortcoming may have affected the predictive ability of existing transit time metrics.28–30 Here, RTH might represent a missing step towards distinguishing tissue with benign oligaemia from salvageable tissue.
Approximation of flow patterns to the flexible two-parameter gamma function is widely used in microvascular research. Nevertheless, this approximation might not be appropriate in disease conditions such as sudden ischemia. In the Supplementary material, Figure 5, we show the residual errors after fitting gamma functions to tissue concetration time curves. Note that sum-of-squared errors are similar in normal tissue and perfusion/diffusion mismatch tissue when adjusted for CBV, which determines the local signal-to-noise ratio. This indicates that the gamma function is appropriate for both normal and hypoperfused tissue as analyzed in this study. Note that large residuals are observed in regions not reached by contrast material (cerebrospinal fluid and the diffusion lesions), as indicated by negligible CBV.
Our computational model assumes that blood flow is distributed across capillary pathways according to their respective diameters, and thus vascular resistance. Importantly, our goal was not to mimic the actual anatomical or rheological complexity of the cerebral microcirculation. Rather, the simple model design was chosen to appreciate how changes in capillary diameter affect overall hemodynamic characteristics. In reality, erythrocyte dimensions exceed capillary diameters, and slight capillary constrictions may therefore lead to dramatic redistributions of erythrocytes and even to capillaries void of cells. The distribution of plasma in the capillary bed is less dependent on capillary diameter, as emphasized by recent experimental data.5,7 Accordingly, the modest reductions in CBV for low RTH may represent a dramatic reduction in the number of capillaries which carry oxygen-laden erythrocytes. When interpreting perfusion imaging data, which are based entirely on plasma flow dynamics, one might therefore only observe the “tip of the iceberg” in terms of the underlying hemodynamic and thus metabolic derangement.
Naturally, the retrospective nature of this study requires that its results should be considered hypothesis generating, and not taken as the final word on the subject matter. In particular, relating imaging findings to experimental models should be prioritized.
Conclusion
Herein, we have conducted a highly detailed analysis of the relationship between voxel-wise transit time characteristics and both traditional haemodynamic measures and ultimate risk of infarction. As an overarching conclusion, RTH proved the only parameter that distinctly separated tissue with benign oligaemia from salvageable tissue. We therefore propose that characterizations of the ischemic penumbra should be extended to include RTH, a marker of microvascular dysfunction. Furthermore, our computational model provides a rationale for the observed effect, namely, that low RTH values represent net homogenization of transit times present during widespread capillary no-flow.
Funding
The author(s) disclosed receipt of the following financial support for the research, authorship, and/or publication of this article: This study was supported by the Danish National Research Foundation (CFIN), The Danish Ministry of Science, Innovation, and Education (MINDLab), and the VELUX Foundation (ARCADIA).
Footnotes
Declaration of conflicting interests
The author(s) declared no potential conflicts of interest with respect to the research, authorship, and/or publication of this article.
Authors’ contributions
The study was conceived by LØ. TSE and LØ designed the study. Clinical databases were collected and managed by NH, KDH, CZS, GA, IKM, SP, THC, JS, SS, GT, NN, JF, and LØ. Methods and models were developed by MBH, HA, SNJ, KM, and LØ. Image processing was performed by TSE, MBH, SFE, JKB, and IKM. Data management and statistical analysis was performed by TSE, JKB, IKM, and KM. The computational model was developed by TSE, HA, and SNJ. TSE drafted the manuscript. All authors revised and approved the final manuscript.
References
Supplementary Material
Please find the following supplemental material available below.
For Open Access articles published under a Creative Commons License, all supplemental material carries the same license as the article it is associated with.
For non-Open Access articles published, all supplemental material carries a non-exclusive license, and permission requests for re-use of supplemental material or any part of supplemental material shall be sent directly to the copyright owner as specified in the copyright notice associated with the article.