
Abstract
The interpretation of regional blood flow and blood oxygenation changes during functional activation has evolved from the concept of ‘neurovascular coupling’, and hence the regulation of arteriolar tone to meet metabolic demands. The efficacy of oxygen extraction was recently shown to depend on the heterogeneity of capillary flow patterns downstream. Existing compartment models of the relation between tissue metabolism, blood flow, and blood oxygenation, however, typically assume homogenous microvascular flow patterns. To take capillary flow heterogeneity into account, we modeled the effect of capillary transit time heterogeneity (CTH) on the ‘oxygen conductance’ used in compartment models. We show that the incorporation of realistic reductions in CTH during functional hyperemia improves model fits to dynamic blood flow and oxygenation changes acquired during functional activation in a literature animal study. Our results support earlier observations that oxygen diffusion properties seemingly change during various physiologic stimuli, and posit that this phenomenon is related to parallel changes in capillary flow patterns. Furthermore, our results suggest that CTH must be taken into account when inferring brain metabolism from changes in blood flow- or blood oxygenation-based signals .
Keywords
Introduction
Brain function depends critically on a steady supply of oxygen. During rest, the central nervous system receives >20% of the cardiac output, and consciousness is lost within seconds after circulatory arrest. Although functional activation is typically associated with a modest 10% to 30% increase in local cerebral metabolic rate of oxygen (CMRO2), regional cerebral blood flow (CBF) typically increases by 20% to 80%, with δCBF/δCMRO2 coupling ratios consistently larger than unity.1, 2 This functional hyperemia permits the localization of brain activity by imaging techniques such as positron emission tomography and functional magnetic resonance imaging. Today, arterial spin labeling functional magnetic resonance imaging and blood oxygen level-dependent (BOLD) functional magnetic resonance imaging are the preferred tools in human brain mapping.3, 4 The interpretation of regional blood flow and blood oxygenation changes during functional activation has evolved from the concept of ‘neurovascular coupling’: mechanisms that converge on cerebral arterioles to adjust CBF according to changing metabolic needs. The subsequent distribution of blood across the capillary bed, and the oxygen diffusion from the microcirculation to active cells, is extremely complex, and so far biophysical models have been unable to establish with certainty whether the increase in oxygen supply during functional hyperemia is matched to the increased metabolic demands. 5
Buxton and Frank 6 derived the so-called ‘oxygen limitation model’, which relates CBF and CMRO2 through the flow diffusion or Bohr—Kety—Crone—Renkin (BKCR) model. 7 Based on the relation between blood flow velocity and solute extraction in single capillaries, this formalism assumes that all tissue capillaries display identical extraction properties. The model predicts that oxygen availability depends on blood flow and a rate parameter that describes oxygen diffusion from blood to tissue. In brain, opening of previously closed capillaries (‘capillary recruitment’) is not observed under normal physiologic stimuli, and the rate parameter is therefore generally assumed to be constant. As oxygen extraction fraction (OEF) decreases with CBF according to the BKCR model, large CBF increases are required to support even modest increases in CMRO2. Accordingly, the nonlinear relation between CBF and CMRO2 could reflect tight coupling of CBF to CMRO2 through an OEF that varies nonlinearly with CBF.
Hyder et al 8 developed a model of the relation between CBF and CMRO2 in which they permitted the ‘effective diffusivity’ of oxygen to vary linearly with CBF—and hence relaxed the assumption of a constant rate or ‘oxygen conductance’ parameter. The model yielded good fits to a wide range of positron emission tomography data. Vafaee and Gjedde 9 also allowed oxygen conductance to vary, noting that their ‘oxygen diffusibility’ varied with stimulus intensity in positron emission tomography measurements of CBF and CMRO2 during functional activation. They speculated that such variations in oxygen conductance are linked to differences in CBF response, and possibly subject to local regulation. 9
The models above assumed negligible oxygen tension (pO2) in tissue, whereas measurements suggest that interstitial pO2 in brain tissue is in fact roughly 25 mm Hg, albeit with high microregional heterogeneity. 5 Tissue pO2 affects the oxygen concentration gradient between blood and tissue, and therefore net oxygen extraction. Changes in tissue pO2 during hyperemia could therefore contribute to the nonlinear relation between CBF and CMRO2 observed during functional activation. 1 More recent models of the relation between CMRO2 and CBF include tissue pO2 as a variable,10, 11 and can account for a broad range of CBF/CMRO2 coupling ratios without the need to introduce variation in oxygen diffusion properties, for which the biophysical rationale remains unclear. 11 These models have failed, however, to explain more recent dynamic recordings of CBF and tissue pO2 obtained in the somatosensory cortex of rats during electrical forepaw stimulation by Vazquez et al. 12 Instead, these data could be explained if either arterial pO2, capillary volume, or capillary oxygen permeability were allowed to vary. 12 Indeed, satisfactory fits to the observations of Vazquez et al, 12 and to more recent data that include blood oxygenation values 13 by a multicompartment model could only be achieved if the capillary permeability/conductance to oxygen was allowed to vary. 14 Again, the biophysical underpinnings of such a mechanism remain elusive.
Capillary flow patterns are very heterogeneous in resting brain,15, 16, 17 but tend to homogenize during functional activation 17 in a manner that correlates with stimulus intensity. 18 Figure 1 shows covariation between mean capillary transit time and capillary transit time heterogeneity (CTH) based on literature reports from in vivo animal experiments and numerical simulations in a vascular anatomic network (VAN) model. As the relation between flow velocity and oxygen extraction for individual capillaries is nonlinear, this heterogeneity implies that the relation between blood flow and oxygen extraction in tissue cannot be described by a unique, macroscopic oxygen conductance across physiological conditions as assumed by conventional compartment models.7, 19, 20, 21, 22, 23 The overall oxygen conductance of a microvascular system will be less than the sum of individual vessel conductances in presence of heterogeneity. 20 As a result, capillary flow heterogeneity may reveal itself as a need to adjust the oxygen conductance when fitting compartment models to clearance data obtained at different blood flow levels.8, 9, 12, 14
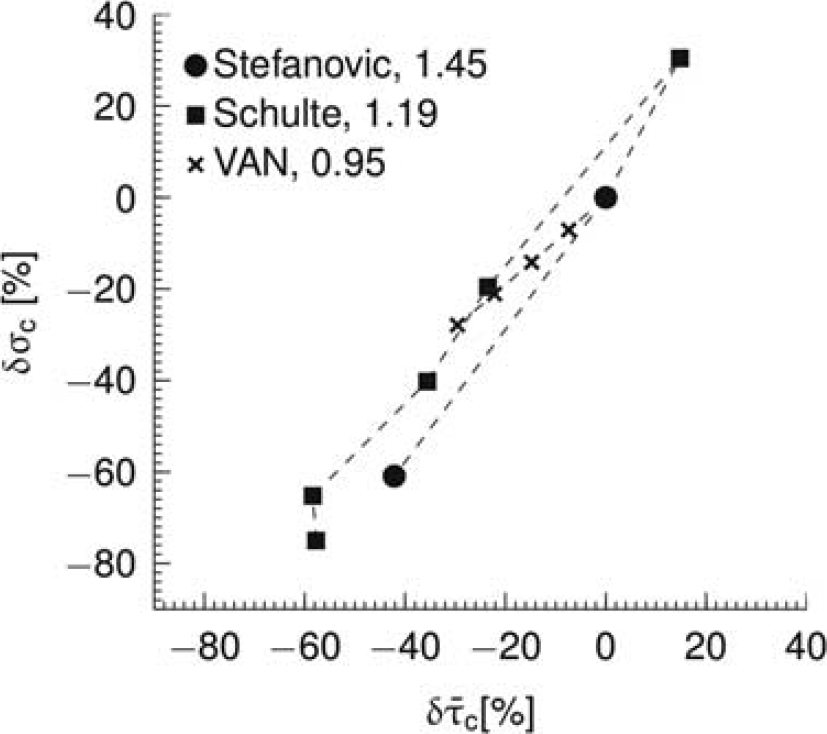
Relationship between relative changes δ in average capillary transit time
We recently extended the BKCR equation to take the effect of CTH into account. 24 This model predicts that presence of CTH leads to decreased oxygen extraction from blood into tissue as compared with a scenario with homogenous capillary transit times. Hence, the degree of CTH influences the overall oxygen transport capacity of the capillary bed. In this article, we model the effect of capillary flow or transit time heterogeneity on the apparent oxygen conductance of ‘conventional’ compartment models. We validate our modeling framework by numerical simulations and comparison with experimental data of Vazquez et al. 13
Materials and methods
Modeling Oxygen Transport
Compartment modeling
The concentration of oxygen in blood is modeled as a sum of oxygen bound to hemoglobin and oxygen dissolved in plasma11, 25

where λ is the bound oxygen concentration at full hemoglobin saturation, s is oxygen saturation, α p is oxygen solubility in plasma, and p is the partial pressure of oxygen in plasma. Under normal physiological conditions, the contribution from dissolved oxygen is relatively small (∼2% to 3%), and the last term in equation (1) may be neglected. The relation between oxygen saturation and partial pressure of oxygen is modeled by the Hill equation

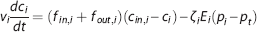
where p50 is the oxygen partial pressure at which hemoglobin is 50% saturated, and the exponent h>1 defines the cooperative binding. The vascular bed is represented as a series of vascular compartments surrounded by a tissue compartment. 25 Change in oxygenation of the i’th vascular segment is derived from mass conservation and Fick's diffusion law
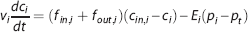
where v i is the volume of the vascular segment, fin,i and fout,i are inflow and outflow, respectively, c i =(cin,i+cout,i)/2 is the average oxygen concentration,11, 25, 26cin,i and cout,i are the inlet and outlet oxygen concentrations, respectively, E i is an oxygen conductance coefficient,14, 27, 28, 29 whereas pi and p t are the average plasma pO2 and tissue pO2, respectively.11, 26 The oxygen conductance coefficient defines oxygen flux in relation to average intravascular and extravascular pO2. Note that the ‘oxygen conductance’ coefficient in equation (3) is mathematically equivalent to the ‘effective diffusivity’, 8 ‘oxygen diffusibility’, 9 ‘permeability-surface (PS) product’,11, 12 and ‘vascular permeability rate’ 25 coefficients. In the tissue compartment, the change in oxygenation is derived from mass conservation
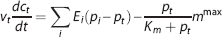
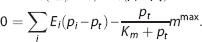
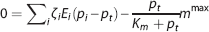
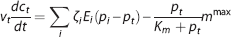
where v t is the volume of the tissue compartment. The last term represents the CMRO2, termed m. mmax is the maximum rate at which oxygen is removed by tissue metabolism, and the product with p t /(K m +p t ) prevents p t from becoming negative in case of insufficient oxygen delivery. 11 We follow previous work within the neuroimaging community and consider the metabolic response mmax to be driven in parallel with the hemodynamic response,2, 11, 14, 25, 30, 31 that is, mmax is a variable that is allowed to change. At steady state, equations 3 and 4 become

Modeling capillary transit time heterogeneity
For the capillary compartment, the steady-state equation (5) can be rewritten as
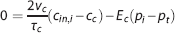
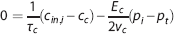
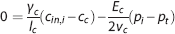
where γ c is the velocity at which an element of blood moves along the compartment representation with length l c . The capillary transit time is related to flow through τ c =v c /f c . Equation 9 shows that oxygen extraction depends on the compartment geometry, the velocity at which blood traverses the compartment, and on the oxygen conductance E c .
A conventional oxygen transport model generalizes from individual capillaries to ensembles of capillaries in tissue by setting
(
To model heterogeneous flow patterns across the capillary bed, we consider a distribution of capillary transit times h(τ
c
),24, 32, 33 parameterized by a mean transit time
The average capillary oxygen concentration
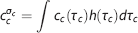
where the capillary concentration c
c
(τ
c
) can be computed from equation 8. The model defined in terms of equations 6, 8, and 10 is referred to as CTHss below. It can be shown mathematically that
Modeling capillary transit time heterogeneity via the resulting changes in apparent oxygen conductance
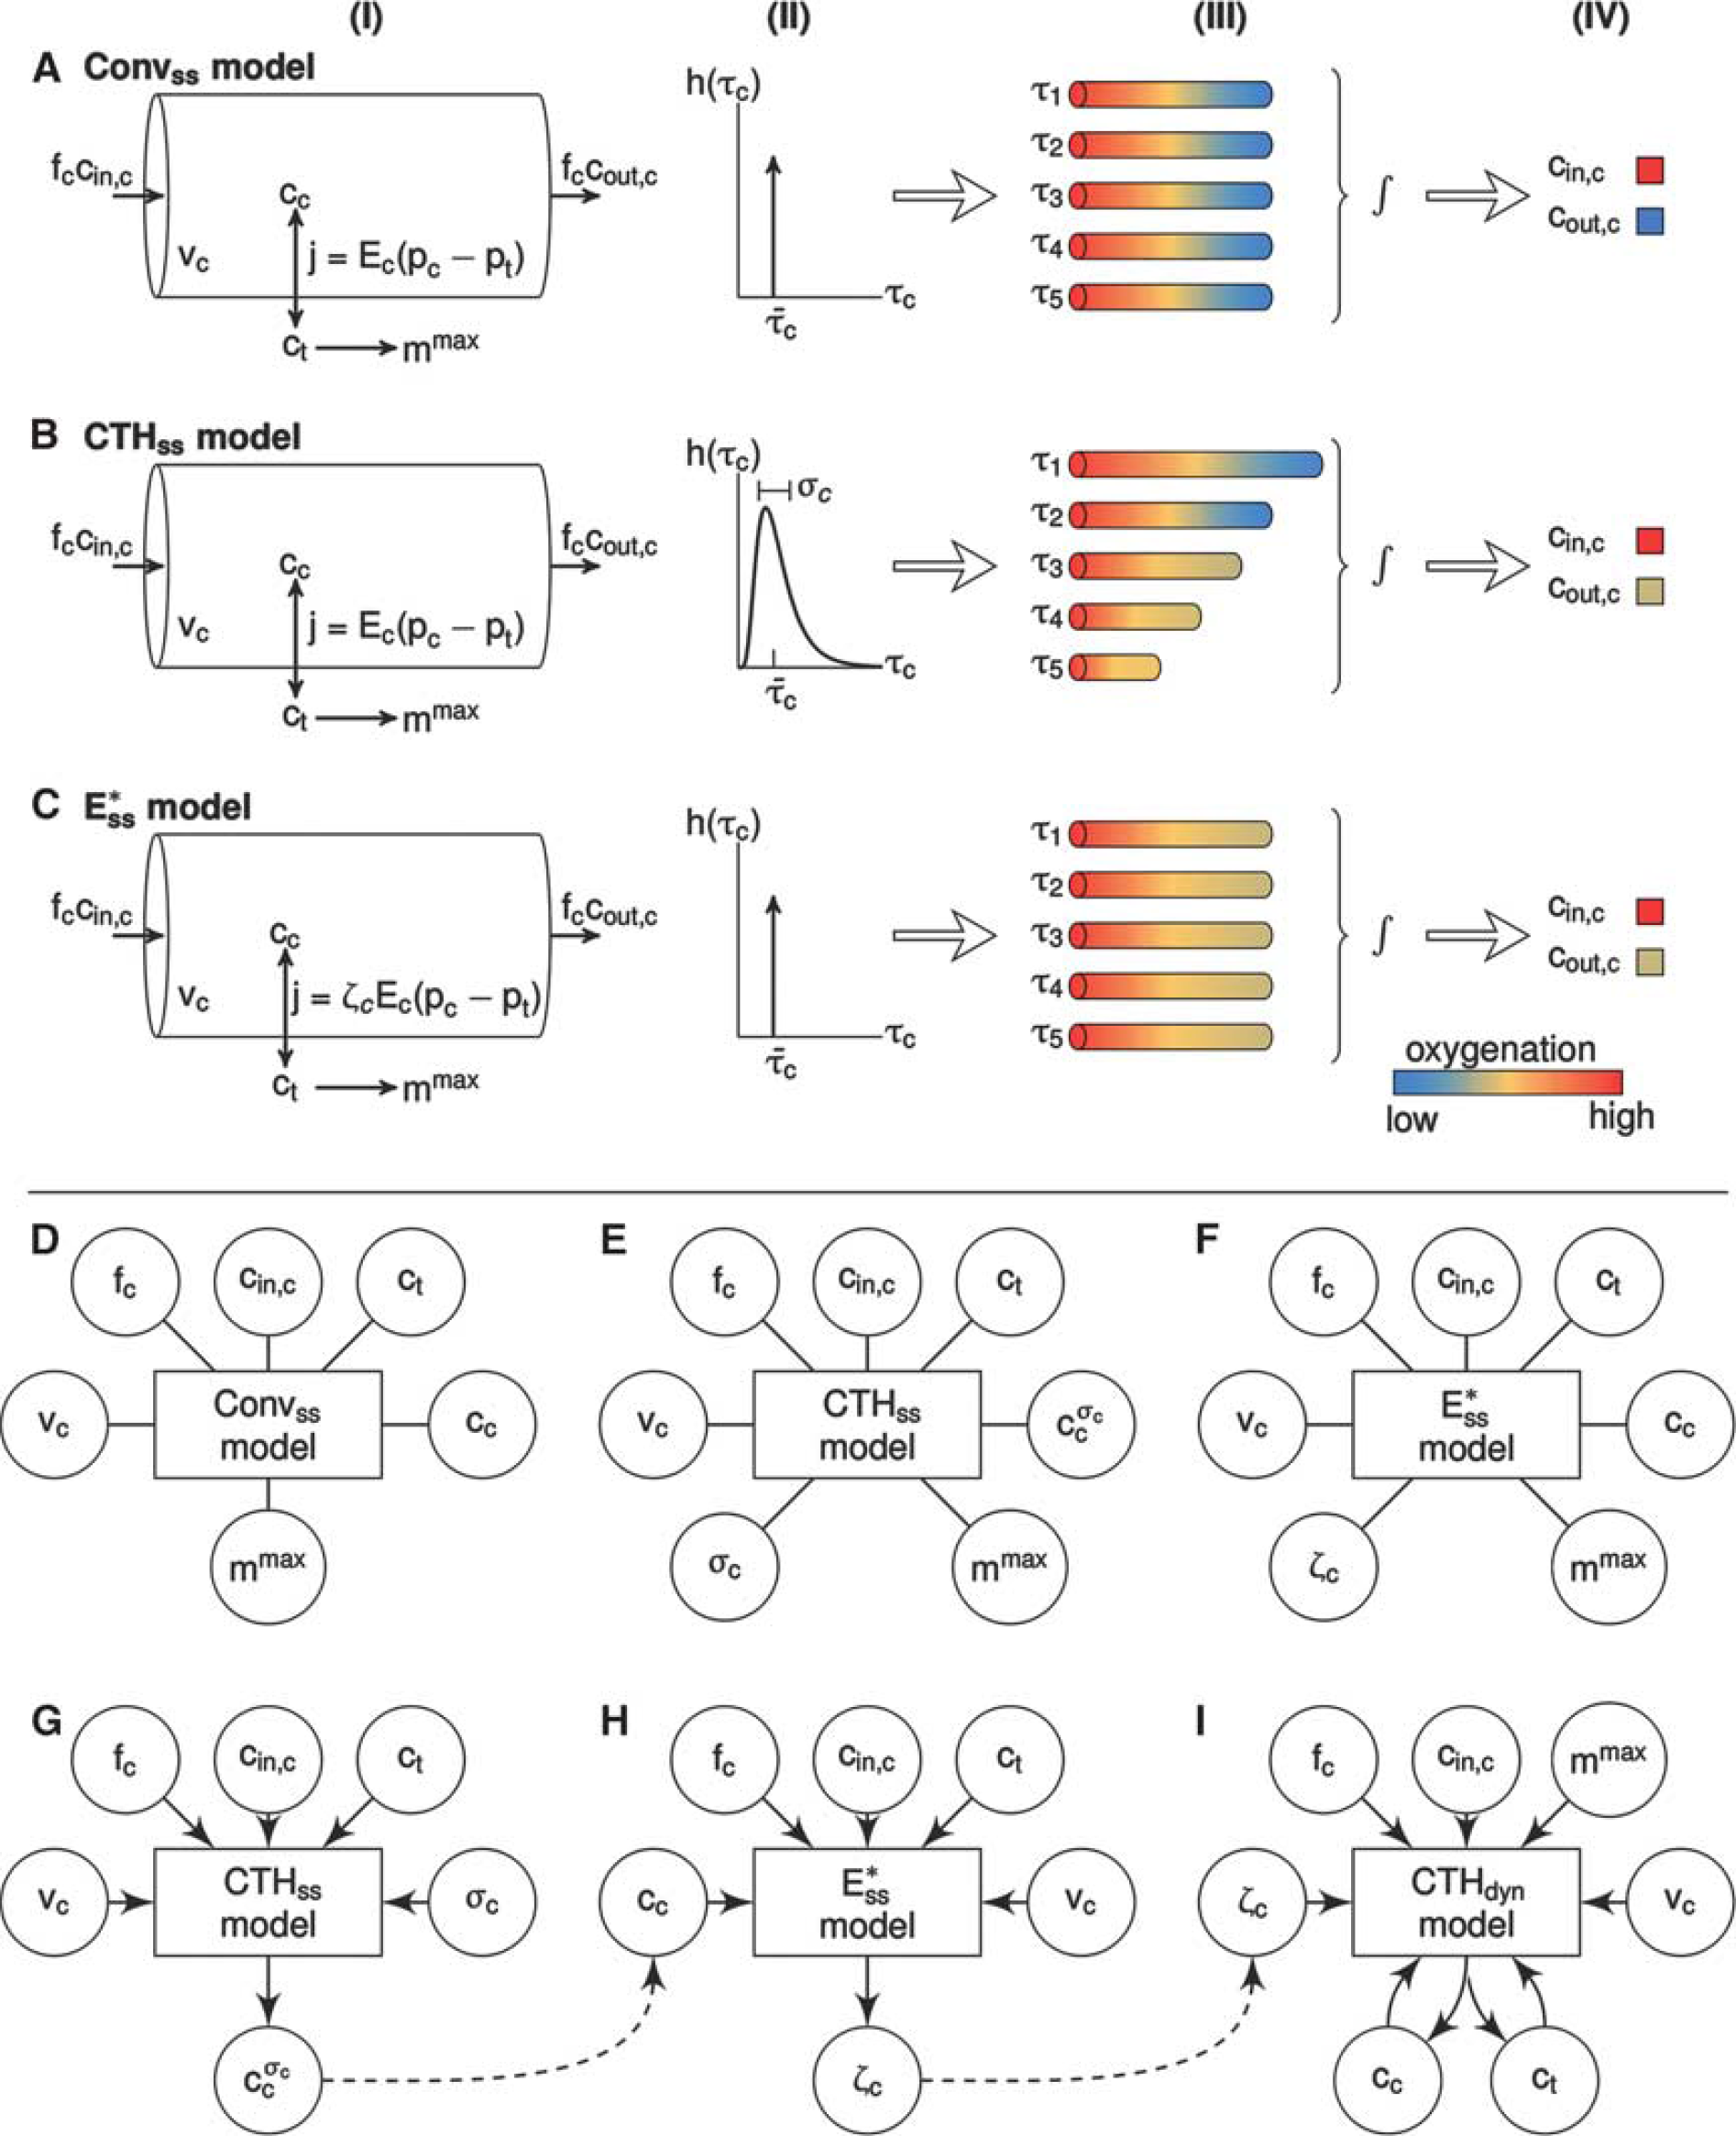
The effect of CTH can be expressed in terms of an apparent oxygen conductance, E∗ (Jespersen and Østergaard 24 ). The apparent oxygen conductance is defined as the oxygen conductance of a conventional model that will lead to the same capillary compartment concentration (and oxygen extraction) as observed in a model that takes CTH into account (Figures 2C and 2F). E∗ is introduced into the steady-state equations 5 and 6 by

where
Compute
Compute ζ
i
of the
Modeling dynamic changes in the apparent oxygen conductance
As in steady state, we also use changes in the apparent oxygen conductance E∗ to model changes in the ability of the vascular bed to transport oxygen as hemodynamic variables evolve over time. E∗ is introduced as a dynamical variable into the dynamical equations (equations 3 and 4):
where
Simulations and Data Analysis
Modeling steady-state effects of capillary transit time heterogeneity
We examined the steady-state behavior of a compartment model in which the effects of CTH on oxygen transport are included (CTHss model). For simplicity, we considered a one-compartment model that describes oxygen exchange between a single-vascular compartment (capillaries) and tissue.2, 11 We assumed the volume of the capillary compartment to be constant, and capillary transit times to be distributed according to a gamma distribution.24, 32 The analysis was based on numerical simulations, using model parameters typical of rat brain as listed in Supplementary Material Table 1.
Modeling dynamical effects of capillary transit time heterogeneity
The dynamical behavior of our oxygen transport model was examined by numerical simulations and by modeling the data set of Vazques et al. 13 We applied a multicompartment model comprising a tissue compartment and three vascular compartments connected in series: arteriolar, capillary, and venous. Arteriolar dilation drives volume and flow changes throughout the vascular compartments during activation.25, 26 The capillary and venous compartments were modeled as compliant elements that expand passively as pressure increases—see Huppert et al 25 for further details. Oxygen transport from the vascular network was modeled as described above, and we again assumed capillary transit times to be described by a gamma distribution.
Modeling dynamical effects of capillary transit time heterogeneity—simulations
In our simulations, we defined the temporal development of a series of dynamical variables that serve as inputs to our model. These inputs include the dynamics of arteriolar volume, inlet arteriolar pO2, maximum CMRO2, and the s.d. of the transit time distribution. Time courses for these variables were constructed by convolving a stimulus block representing the experimental design with a gamma filter. 34 We considered two different versions of the oxygen transport model: (i) a conventional model in which neither the effect of CTH nor dynamical changes in the apparent oxygen conductance of the capillary compartment were modeled (Convdyn model), and (ii) a CTH model in which we modeled heterogeneity in terms of the dynamic changes in the apparent oxygen conductance of the capillary compartment (CTHdyn). Parameters of the multicompartment models were set according to values in Supplementary Material Table 2.
Modeling dynamical effects of capillary transit time heterogeneity—comparison with in vivo data
The study of Vazquez et al 13 reports a data set with dynamical measurements of blood flow, as well as arteriolar, venous, and tissue oxygenation from an experiment with somatosensory activation evoked by electrical forepaw stimulation in anesthetized rats. 13 This data set was recently modeled with a multicompartment model by Barrett and Suresh. 14 They showed that a model that incorporates dynamic changes in the capillary oxygen conductance was in better agreement with these data than a model with constant capillary conductance.
To model this data set, we considered three different versions of the oxygen transport model: (i) a conventional model in which neither the effect of CTH, nor changes in oxygen conductance were modeled (Convdyn model), (ii) an oxygen conductance model in which the apparent oxygen conductance was allowed to vary as proposed by Barrett and Suresh
14
(
Similar to Vazquez et al,
13
we modeled the vascular system from small surface arteries to small emerging surface veins, with the aim of representing the time series of corresponding laser Doppler flows, and oxygen concentrations in small arteries, small veins, and tissue. The reported value of baseline tissue pO2 is rather high (38.0 mm Hg) relative to that of small veins (33.3 mm Hg). Similarly to Barrett and Suresh,
14
we consider this observed tissue pO2 to represent the average of a contribution from tissue and a contribution from the vascular segments. Specifically, we model the observed tissue tension
Results
Modeling Steady-State Effects of Capillary Transit Time Heterogeneity
Figure 3 shows simulation results for a conventional version of the oxygen transport model without incorporating the effect of CTH (panels A—C) (Convss model) and a version of the oxygen transport model that includes the effect of CTH (panels D—F) (CTHss model). Note that tissue pO2 was fixed at 25 mm Hg in these simulations. The abscissae show relative changes in transit times, and the ordinate relative changes in the respective variables. The transit time range (−40% to 40%) corresponds to relative flow changes of (67% to −29%). In the Convss model, the OEF increases as the transit time increases (panel A). The parallel reduction in CBF leads to a relative reduction in the metabolic rate of oxygen that can be supported (panel B). Panel C shows increased BOLD signal with increased flow (decreased transit time) and decreased BOLD signal with decreased flow. In the CTHss model, the efficacy at which oxygen can be extracted at a given tissue pO2 depends not only on transit time but also on the level of transit time heterogeneity. The OEF increases if σ
c
decreases for any fixed value of
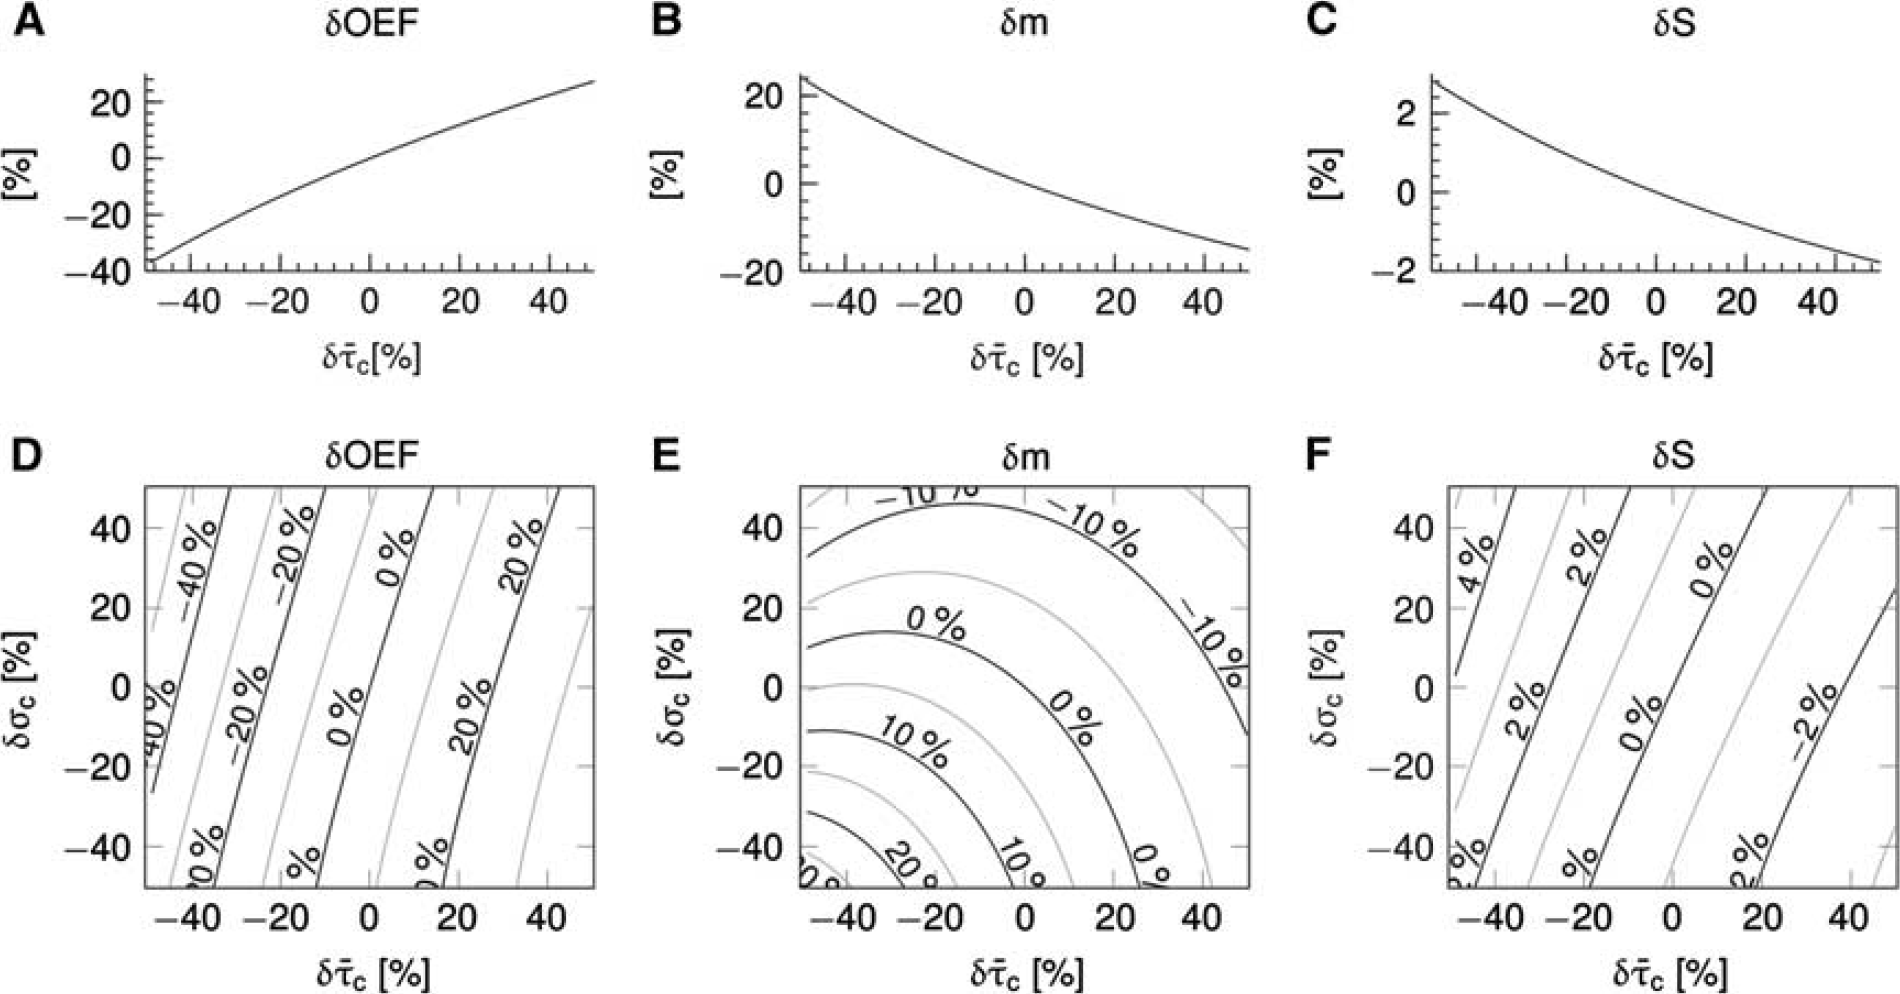
Steady-state simulations in a conventional one-compartment model (Convss model) (
Figure 4 shows simulation results for the CTHss model with combinations of transit time, s.d. of the transit time distribution, and tissue pO2 corresponding to a metabolic rate of oxygen at baseline level (panel A) and with a 20% increase in oxygen metabolism (panel B). The contour plots show the tissue pO2 at a given
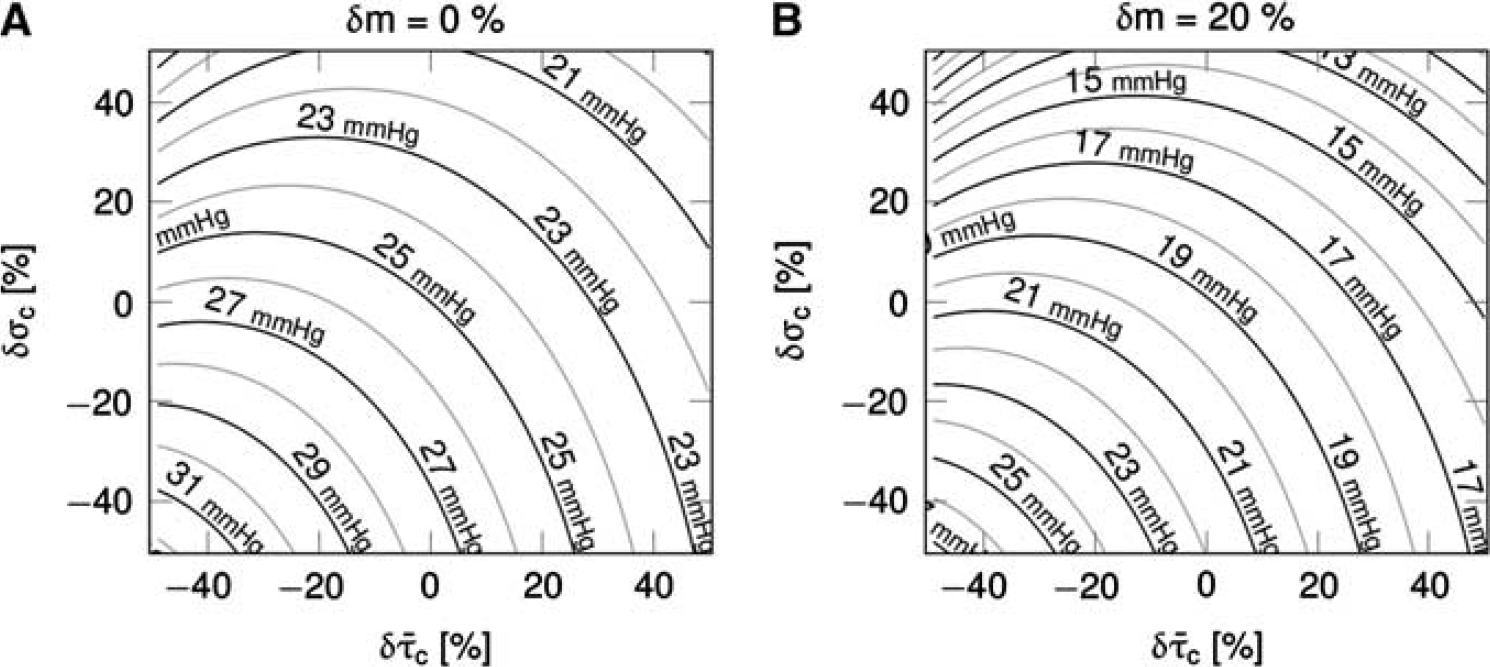
Steady-state simulations in the one-compartment model incorporating the effect of capillary transit time heterogeneity (CTH; CTHss model). The model describe the relationship between the average capillary transit time
Modeling Dynamical Effects of Capillary Transit Time Heterogeneity—Simulations
Figure 5 shows the effect of CTH as modeled by the multicompartment model (CTHdyn model) in comparison with a conventional model (Convdyn model). The inlet pO2 was fixed in panels (A—C), whereas the inlet pO2 increased 10% in simulations presented in panels (D—F) representing decrease in upstream oxygen extraction because of flow increase. Panels A and D show the temporal dynamics of variables that served as inputs to the model. The ratio of flow/metabolism changes n was n=1.25 in panels (A—C) and n=2.25 in panels (D—F). Relative changes in tissue pO2 are shown in panels B and E. The moderate flow response (panel A) results in a drop in tissue pO2 of 11% for the conventional model (panel B), whereas the stronger flow response (panel D) together with increases in inlet pO2 result in an increased tissue pO2 in the conventional model (panel E). The tissue pO2 is lower in the CTH model as compared with the Convdyn model, if σ c is fixed at baseline value (panels B and E). However, if σ c decreases in response to stimulation, the tissue pO2 increases, approaches the level observed in the Convdyn model and finally exceeds this level (panels B and E). The solid curves in panels (C and F) show relative changes in tissue oxygenation for a range of plateau values of the σ c response magnitude (the dotted lines mark the tissue pO2 of the Convdyn model for reference). The point where the solid and the dotted curves intersect corresponds to the σ c response magnitude at which the relative change in the apparent oxygen conductance for the capillary compartment equals zero (δE∗=0%) in the CTHdyn model. The dashed curves show relative changes in the apparent oxygen conductance of the capillary compartment in the CTHdyn model over the range σ c response magnitude values. A rather linear trend is observed, with the apparent oxygen conductance increasing as σ c decreases.
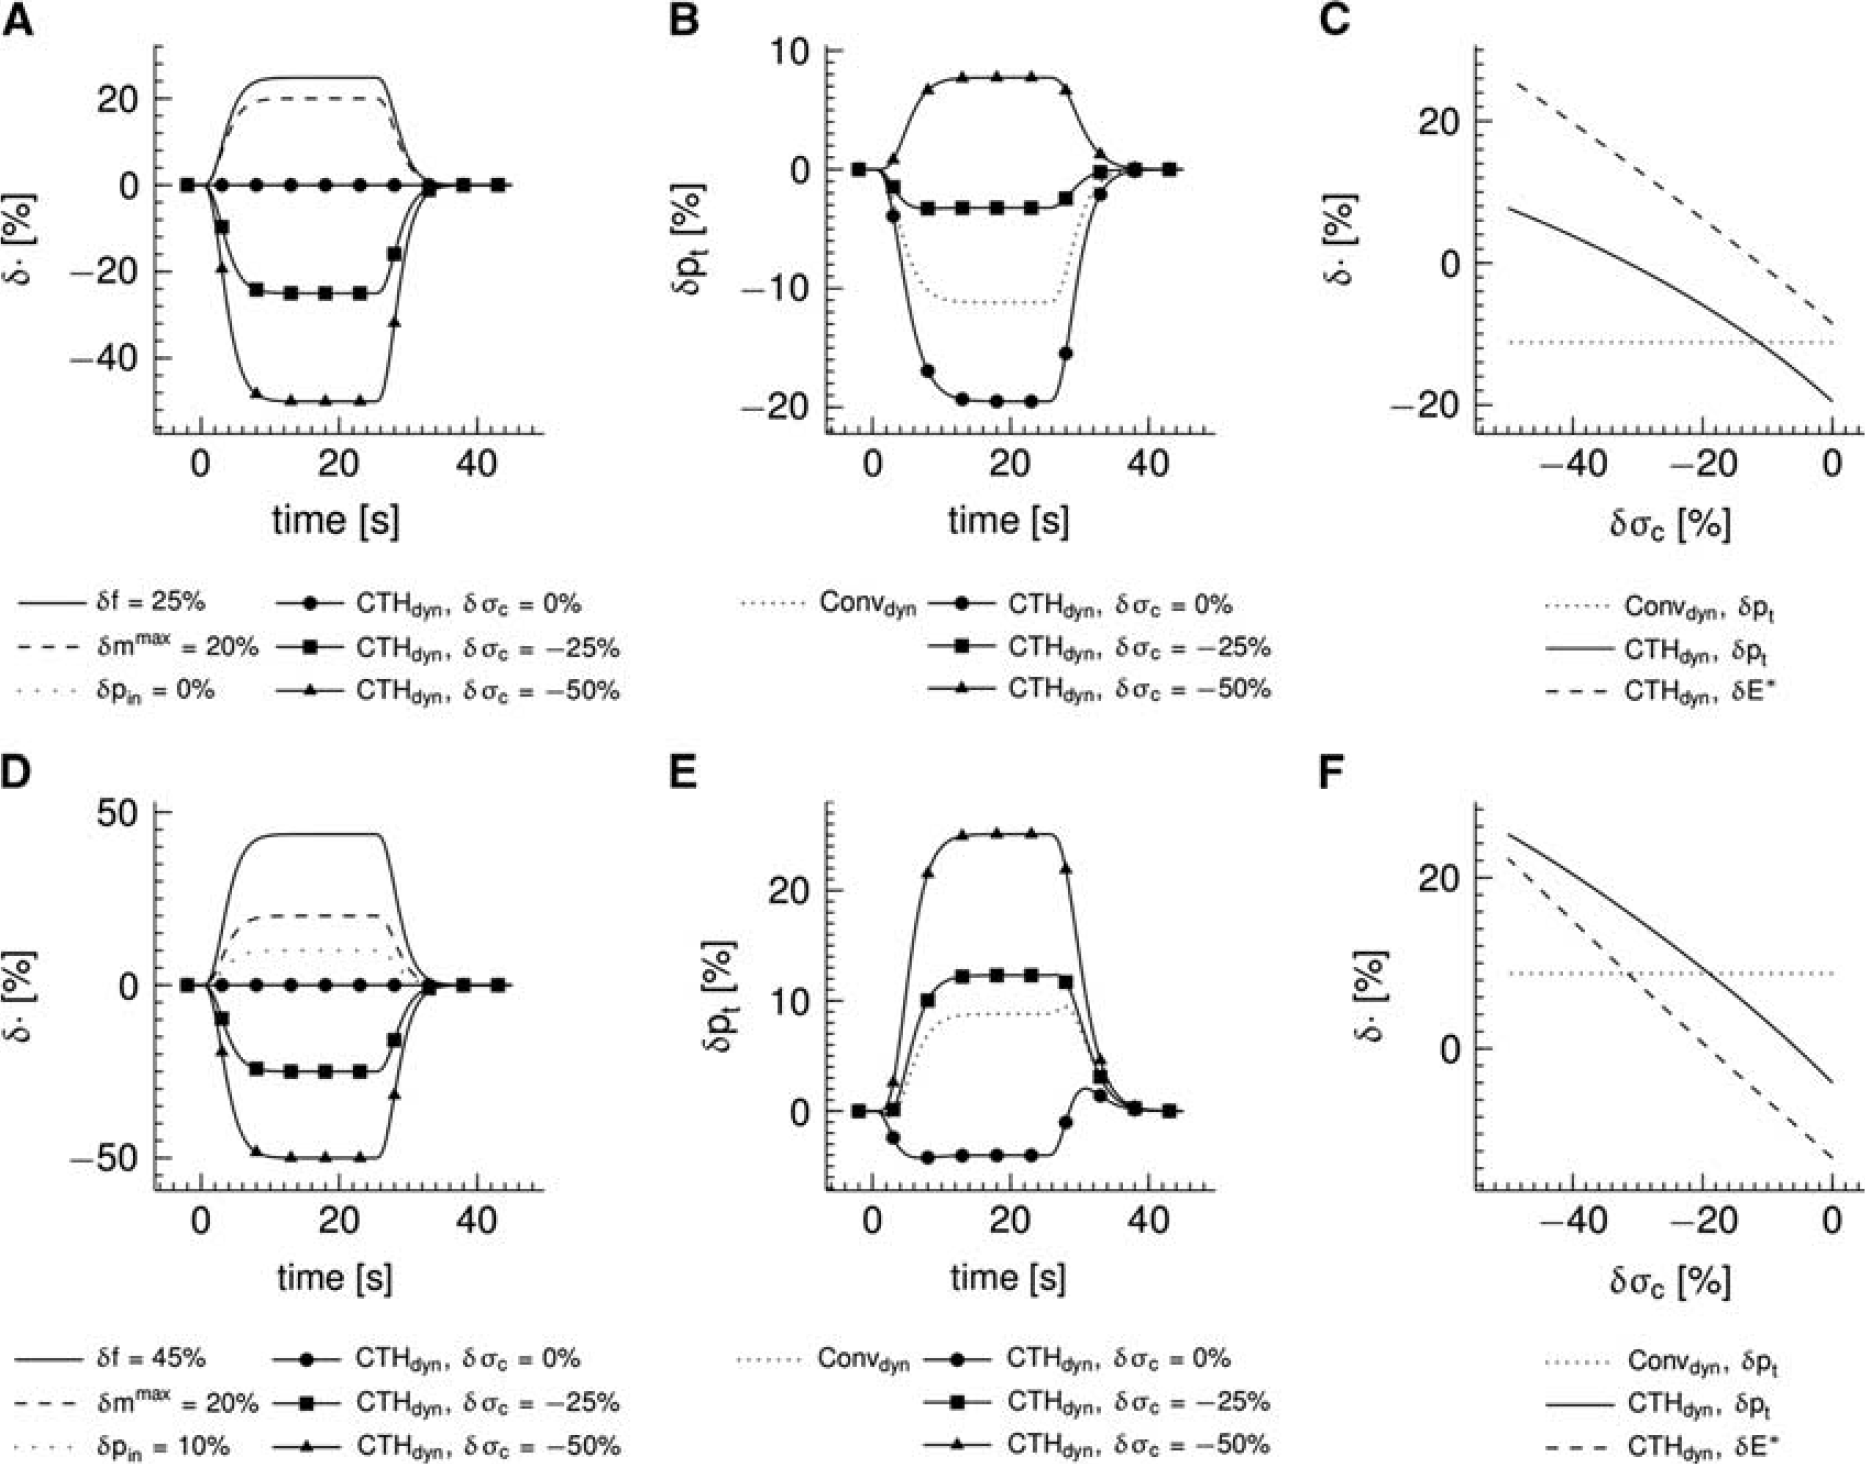
Simulations of temporal dynamics in the multicompartment model incorporating the effect of capillary ‘transit time’ heterogeneity (CTH; CTHdyn model) and a conventional multicompartment model for comparison (Convdyn model). (
Modeling Dynamical Effects of Capillary Transit Time Heterogeneity—Modeling I n Vivo Data
The analysis of the in vivo data set from Vazquez et al
13
is presented in Figure 6. The data set was modeled by (i) a conventional model (Convdyn model), (ii) a model with dynamically varying apparent oxygen conductance (
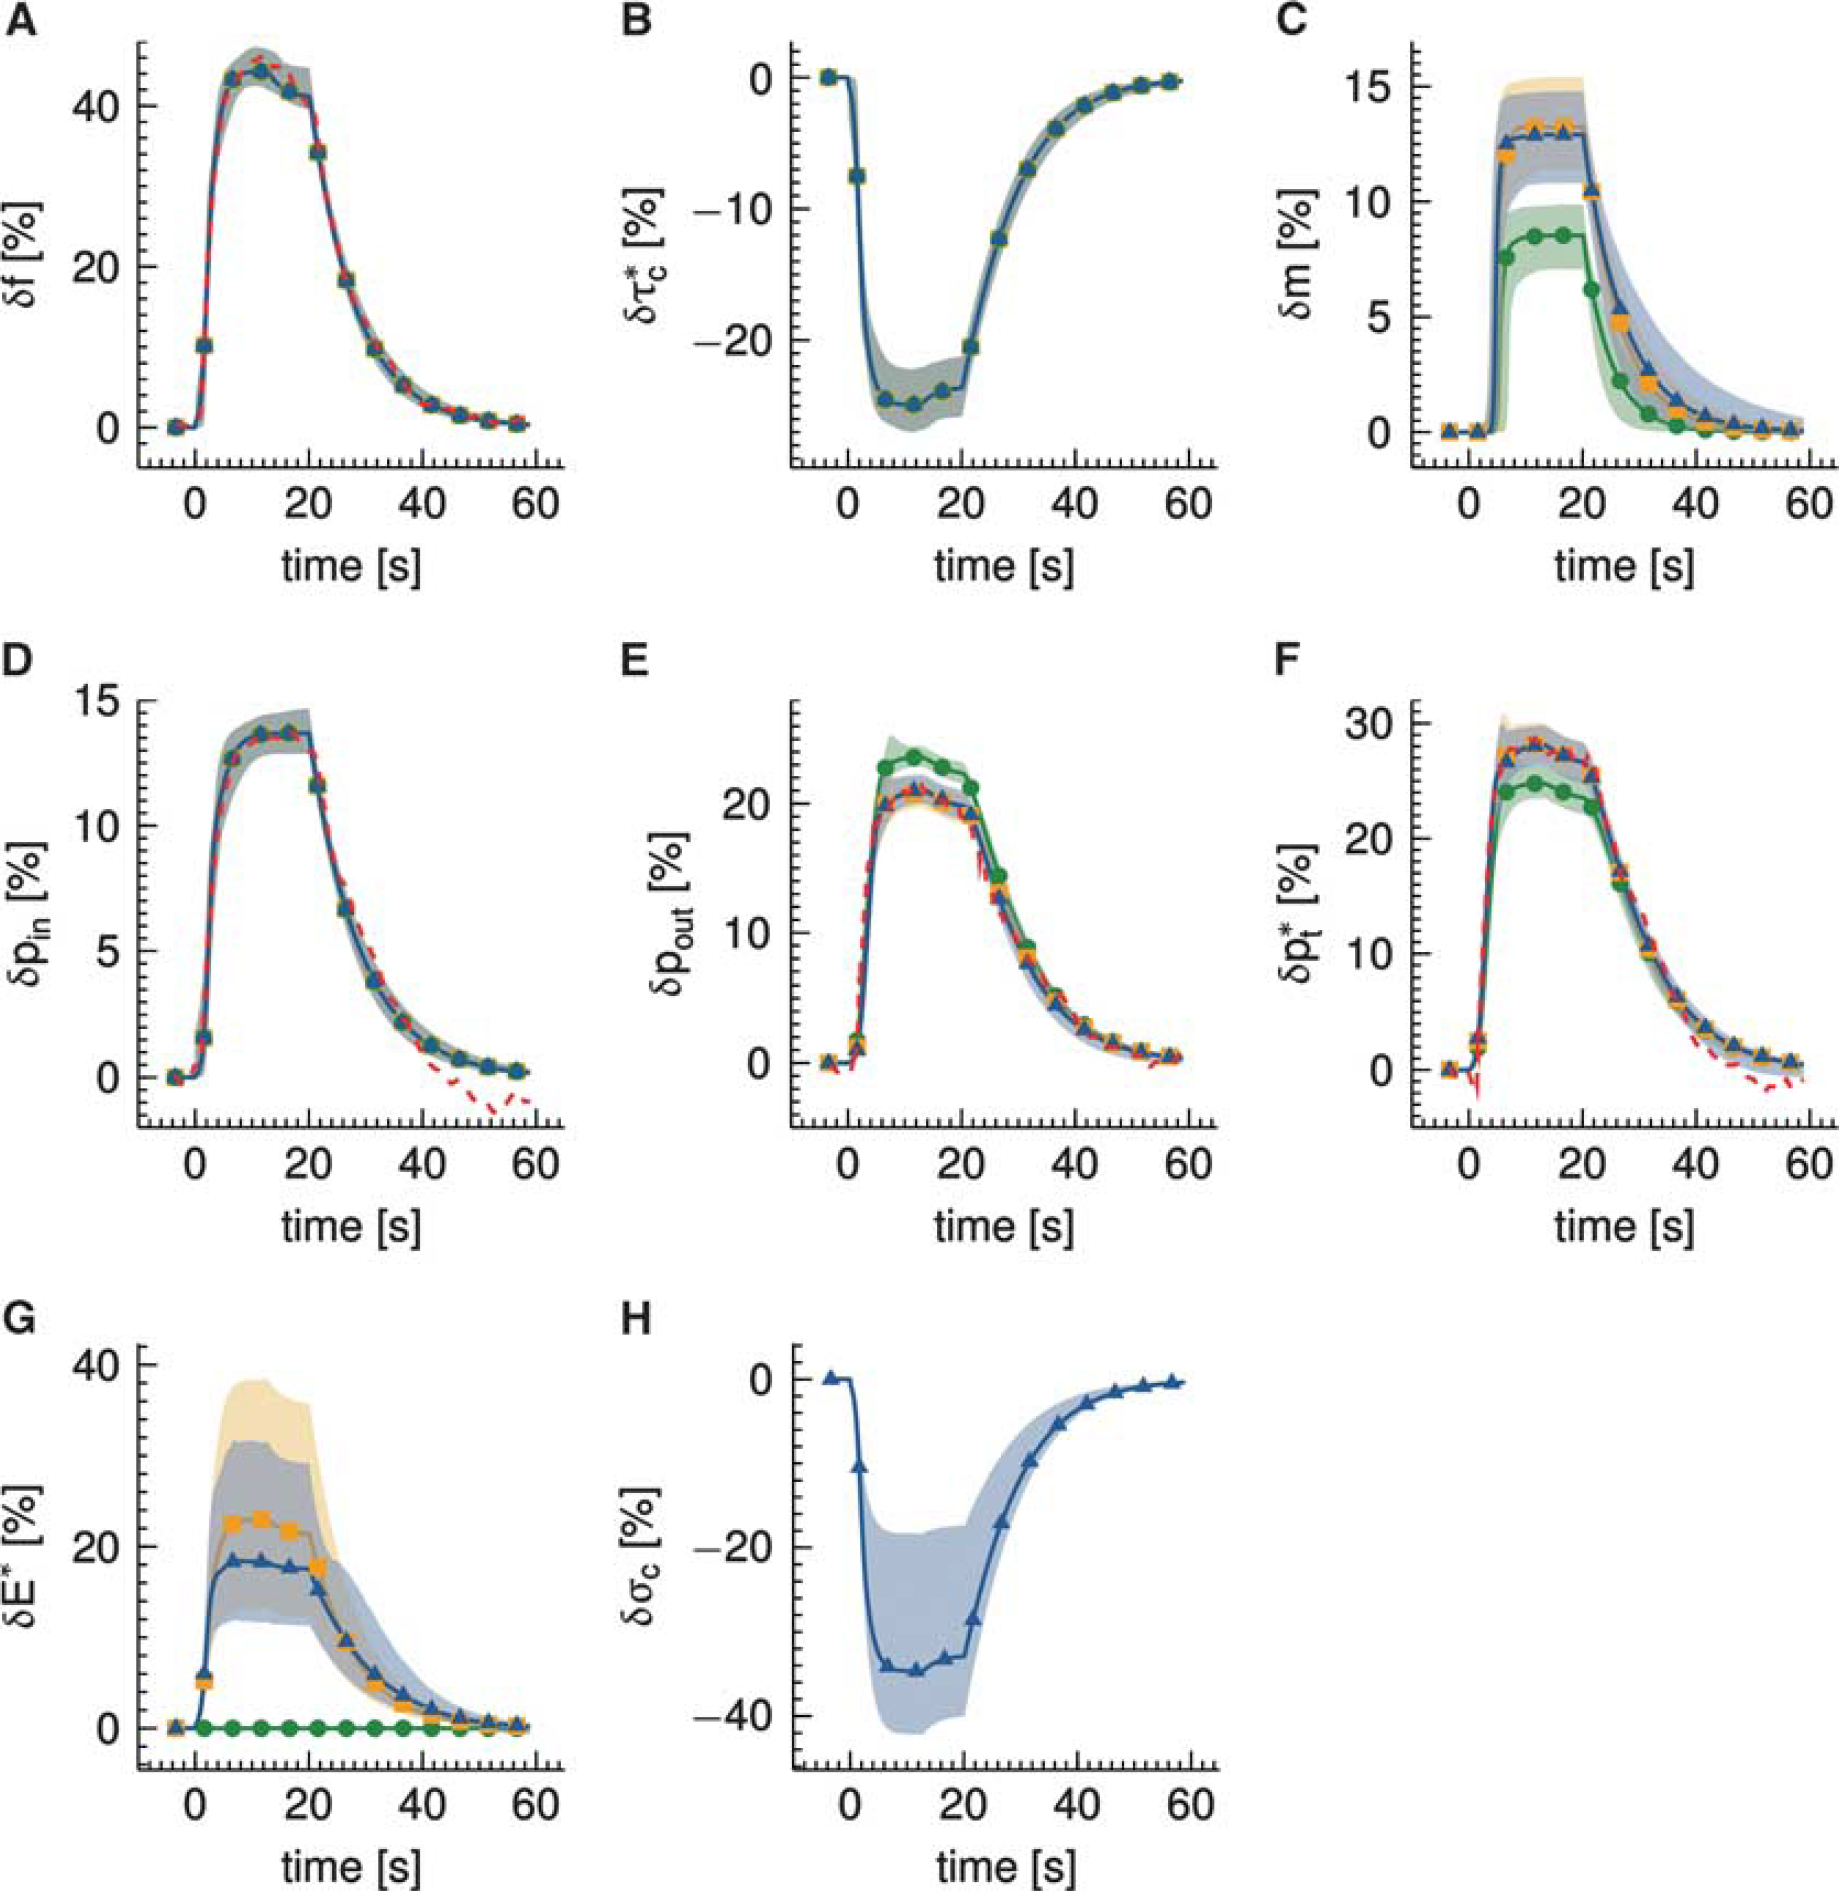
Analysis of experimental data from Vazquez et al
13
acquired from rats with electrical forepaw stimulation in the interval (0, 20) seconds. Three multicompartment models were used to model the relative changes δ in (
Discussion
The extraction of solutes into tissue depends on the capillary distribution of blood flow.7, 22, 23, 24 The oxygen conductance coefficient used when describing the relation between solute extraction and blood flow in tissue by a macroscopic compartment model may therefore be interpreted as a variable that vary with transit time heterogeneity, rather than a physiologic constant for the solute and capillary bed in question. We have developed a framework for modeling the quantitative effect of transit time heterogeneity on the apparent oxygen conductance coefficient of compartment models, and found that the resulting change in oxygen extraction is consistent with dynamic recordings of CBF and oxygenation during functional activation in an animal model. Our results support earlier observations that oxygen diffusion properties seemingly change during various physiologic stimuli, and propose that this phenomenon is related in part to parallel changes in capillary flow patterns.
The Relation Between CBF and Capillary Transit Time Heterogeneity
The topology, morphology, and hemodynamics of the microvasculature are characterized by a large degree of heterogeneity.21, 22, 23 The heterogeneity of erythrocyte fluxes and velocities in capillaries is high, and this heterogeneity is reduced during functional activation.17, 18 Jespersen and Østergaard
24
compiled a table with estimates of mean and s.d. of transit times based on measurements of erythrocyte fluxes and velocities in rat brains. These estimates suggest that transit times homogenize as flow increases (Figure 1). To address this relation from the perspective of microvascular network properties, we extended a VAN model
26
to incorporate CTH. Details on this simulation are provided in the Supplementary Material. Similar to the literature reports, this extended VAN model exhibits a decrease in CTH as flow increases (Figure 1). Note that this reduced heterogeneity is ‘passive’ in the sense that the capillary segments of the VAN model were not actively controlled to reduce heterogeneity. Note that Buxton and Frank
6
observed a minor dependence of transit time heterogeneity on oxygen extraction. This may be explained by their parameterization of the transit time distribution (fixed shape parameter in gamma distribution), which entails a linear relationship between
Recently, advanced modeling and imaging methods have been combined to examine hemodynamic regulation within the cortical microvasculature. Microvascular network analysis has suggested that penetrating vessels may supply blood to multiple cortical columns, and that blood flow is controlled at the level of microvessels. 37 Two photon microscopy has shown that arteriolar vasodilation in response to functional activation propagates upstream toward the cortical surface, as well as downstream into local capillary beds. 38 Meanwhile, recent studies have shown that pericyte tone is actively regulated, causing capillaries to dilate approximately 1 second before the penetrating arterioles. 39 Indeed, it was speculated that the initial flow increase after functional activation is caused by a reduction in vascular resistance because of capillary dilation, rather than by the immediate relaxation of arteriolar smooth muscle cells. 39 In addition to the effects of pericyte dilation on CBF, we speculate that a flow regulation at the capillary level is part of a neurocapillary coupling that optimizes the microscopic distribution of blood during rest, and actively reduces flow pattern heterogeneity/CTH to optimize oxygen extraction during functional activation so that the metabolic needs of tissue can be met. Pries et al 23 proposed that transit time heterogeneity may facilitate a smooth modulation of solute exchange over a range of flow changes.
Capillary Oxygen Conductance: A Structural or a Physiological Property?
Previous studies have shown that conventional compartment models cannot be fitted to experimental data unless oxygen transport characteristics (dubbed ‘PS area product’, ‘effective diffusivity’, ‘diffusion capacity’, or ‘conductance’) are allowed to vary during physiologic stimuli.8, 9, 12, 14 It has been suggested that increased capillary oxygen tension, hematocrit, changes in blood volume, or capillary recruitment8, 9, 14 may explain these observations, but the existence of such mechanisms remains controversial. 11 Debates over whether the oxygen conductance/PS product, in this case for oxygen, can change during functional activation typically emerge from structural interpretations of this quantity.9, 12, 14 This misconception may date back to August Krogh who observed opening of previously closed capillaries (capillary recruitment) in tissue during stimulation. He correctly noted that this phenomenon would increase PS in proportion to the number of recruited capillaries. Since then, the reverse implication has prevailed, namely that changes in oxygen conductance/PS, as derived from the BKCR equation, are caused by changes in physical capillary surface area—that is, either opening or closing of capillaries, or diameter changes in already open capillaries. The absence of physical capillary recruitment in the brain has therefore been taken to imply that oxygen conductance for freely diffusible substances is constant despite speculations that capillary flow patterns across open capillaries may affect the efficacy of oxygen extraction. 40 Similar debates have dominated the study of other organs: in the heart it has been convincingly shown that the oxygen conductance/PS of oxygen must increase linearly with blood flow to yield satisfactory fits to experimental positron emission tomography oxygen uptake data, 41 whereas no evidence of classical recruitment has been observed in heart muscle.
From the perspective of modeling, the misconception that the oxygen conductance/PS product one finds when fitting the clearance data to the BKCR equation is flow independent, originates from the generalization of single-capillary properties into models of tissue.7, 19, 20, 21, 22 Compartment models are convenient when we characterize tissue at a macroscopic scale, and generally apply averaged macroscopic parameters and variables such as volume flow rates, oxygen conductance/PS, and metabolic rates. In case of the BKCR equation, however, the relation between flow velocity and solute extraction in single capillaries is nonlinear, and our analysis clearly show that the distribution of flows or transit times at the capillary level must be considered when formulating compartment models, and when interpreting macroscopic parameters that were determined from fits to such models.21, 22 Indeed, Renkin realized that macroscopic solute clearance/extraction would be overestimated in the presence of any heterogeneity in microscopic parameters associated with vessel geometry, hemodynamics, and oxygen transport.7, 19, 20 In 1959, he thus pointed out that the overall PS product of a system's microvasculature would be less than the sum of single-capillary local PS products in the presence of microvascular heterogeneity. 20
Two topologically identical microvascular networks may yield different extraction of a diffusible substance such as oxygen depending on their capillary flow distributions. 7 Instead of a ‘structural/physical’ interpretation of the oxygen conductance/PS derived from compartment models, our analysis support the notion that oxygen conductance/PS varies, and suggest that changes in capillary flow patterns, either passively in response to increases in CBF (above), or actively, in response to pericyte dilations, 39 may influence this biophysical property.
Incorporating CTH into Models of Oxygenation-Based Signals
Our analysis suggests that knowledge of CTH may improve estimates of CMRO2 based on measurements of CBF and pO2 (Figure 3). Specifically, CTH affects the OEF and hence the estimates of CMRO2 and the BOLD signal. Alternatively, if CBF, CMRO2, and CTH are specified, the model allows the corresponding tissue pO2 to be calculated (Figures 4 and 5). In existing models of neurovascular coupling, increased CMRO2 is supported by increased CBF, and hence by an increase in the difference between blood and tissue oxygenation. In this framework, neurovascular coupling is associated with increased BOLD signals during functional activation, whereas reductions in BOLD signals, such as the initial dip, must result from either increased neuronal metabolism or an uncoupling/mismatch between CBF and CMRO2, during which increased oxygen metabolism is accompanied by a reduction in tissue oxygenation, and a ‘passive’ increase in blood—tissue pO2 gradients. Homogenizations of capillary flow patterns provide a mechanism by which increases in oxygen metabolism can be supported by reductions in CTH—either alone or in combination increases in CBF (Figures 4 and 5). Hall et al 39 recently reported that pericyte dilations precede arteriolar dilation during functional activation. Meanwhile, lactate, which may form during functional activation, is also thought to relax pericytes. 42 If we assume that capillary dilation gives rise to reduced CTH, the resulting changes in neurocapillary coupling would indeed be predicted to result in a brief, negative BOLD signal change at the onset of functional activation, and again during the washout of interstitial lactate, consistent with reports of an initial dip, and of poststimulus BOLD undershoots in relation to functional activations. We speculate that adjustment of local flow patterns may be an additional mechanism by which the vascular system can adjust oxygen availability to meet metabolic demands.
Limitations and Future Research Directions
In this study, we have developed a methodology for modeling the microscopic effect of flow pattern heterogeneity/CTH in macroscopic compartment models. By focusing on a macroscopic model, we aim at a rather simplistic description of an extremely complex underlying system. Compartment models may capture sufficient effects to account for experimental data despite their simplicity. 2 Future development of macroscopic compartment models may be guided by microscopic simulations and by evaluating the models’ ability to describe experimental data.
Modeling oxygen transport has been a topic within microcirculatory research for many years. Model complexity range from compartment models, over Krogh cylinder models, to spatially distributed models with realistic geometry, see Goldman 43 for a comprehensive review. Significant gradients of pO2 are present both within blood vessels and in tissue. Such effects are explicitly included in derivations of compartment models based on space averaging over parameters in distributed models incorporating ensembles of Krogh cylinders.27, 28, 44, 45 These compartment models are, similarly to the compartment model we consider, parameterized by compartment averages, that is, averaged intravascular and extravascular oxygen tensions. However, the numerical values of the oxygen conductance parameters in these models are derived in a ‘bottom up approach’ from microscopic structural and functional parameters such as individual vessel diameters, radii of Krogh tissue cylinders, number of vessels, and the diffusion coefficient of oxygen. The macroscopic representation is obtained by summing contributions from identical microvessels.27, 28, 44, 45 This is in contrast to compartment models derived within the field of neuroimaging research, where oxygen conductance parameters are calibrated so that the models reproduce specified baseline OEFs.6, 25
Although focusing on the distribution governing microscopic flow patterns, the present model only includes average tissue pO2. Future research should address whether the assumption about average tissue pO2 allows the macroscopic model to capture the main macroscopic effects or whether a more detailed description of tissue pO2 including spatial heterogeneity and gradients of pO2 is required. 2 The topological structure of the symmetrical VAN model used in the simulations of the CTH—mean transit time relation is relatively unrealistic. CTH was introduced in this model simply by manipulating the resistances associated with capillary segments. This is clearly a first approximation, and a rigorous approach is to consider realistic microvascular networks that naturally exhibit considerable heterogeneity in both geometry and flow rates.21, 22, 23 Recently, there has been an increased interest within the neuroimaging community to construct microscopic models of the brain microvascular system, where the model network topology is informed by microscopy. 2 Detailed analysis of such realistic microvascular networks provides estimates of the relevant microvascular parameters and their distributions. Such an analysis would also allow us to assess how realistic the distributional assumptions regarding the capillary transit time distribution are. Methods for measuring blood and tissue oxygenation and hemodynamics with high spatial and temporal resolution are also becoming increasingly available.46, 47 A combination of these advanced modeling and measurement techniques will allow for a detailed quantification of the distributions governing the relevant microscopic parameters and also provide insight into how these distributions change in response to activation. Such an analysis is highly relevant and is a topic for future research.
Conclusion
We modeled the effects of CTH on compartment models of the neurovascular coupling. Presence of heterogeneity influences oxygen availability and this effect mimics a change in the apparent oxygen conductance one finds by conventional compartment models. The modeling framework allows us to quantify how this oxygen conductance is affected by changes in CTH. Our results support the notion that the oxygen conductance/PS product of oxygen in compartment models may change during functional hyperemia, and ascribe this phenomenon to parallel reductions in CTH, which have been reported in the literature. Our analysis suggests that changes in CTH, either as a passive result of hyperemia, of active regulation at the capillary level, or disease are important when inferring brain function and metabolism from measurements of oxygenation-based signals.
Footnotes
References
Supplementary Material
Please find the following supplemental material available below.
For Open Access articles published under a Creative Commons License, all supplemental material carries the same license as the article it is associated with.
For non-Open Access articles published, all supplemental material carries a non-exclusive license, and permission requests for re-use of supplemental material or any part of supplemental material shall be sent directly to the copyright owner as specified in the copyright notice associated with the article.