
Abstract
The purpose of this study was to explore the capability and uniqueness of amide proton transfer-weighted (APTw) imaging in the detection of primary and secondary injury after controlled cortical impact (CCI)-induced traumatic brain injury (TBI) in rats. Eleven adult rats had craniotomy plus CCI surgery under isoflurane anesthesia. Multi-parameter MRI data were acquired at 4.7 T, at eight time points (1, 6 h, and 1, 2, 3, 7, 14, and 28 days after TBI). At one and six hours post-injury, average APTw signal intensities decreased significantly in the impacted and peri-lesional areas due to tissue acidosis. A slightly high APTw signal was seen in the core lesion area with respect to the peri-lesional area, which was due to hemorrhage, as shown by T2*w. After the initial drop, the APTw signals dramatically increased in some peri-lesional areas at two and three days post-injury, likely due to the secondary inflammatory response. The use of APTw MRI has the potential to introduce a novel molecular neuroimaging approach for the simultaneous detection of ischemia, hemorrhage, and neuroinflammation in TBI.
Keywords
Introduction
Traumatic brain injury (TBI) is a leading cause of death and disability among children, young adults, and elderly individuals. The incidence of TBI is increasing, with more than 1.7 million cases per year in the United States alone. 1 TBI has been referred to as “a silent epidemic.” 2 Long-term cognitive impairments associated with TBI affect more than 5.3 million individuals in the United States. 3 TBI is associated with huge socioeconomic costs and has limited treatment options. 4
TBI results in primary injury and secondary injury cascades. 5 Improved characterization of the spatiotemporal dynamics of these injuries is crucial for the diagnosis, staging of injury, and evaluation of novel treatments. Neuroimaging improves the detection of brain injury pathophysiology and the prediction of TBI outcome. A recent extensive literature review 6 regarding the effectiveness of neuroimaging modalities for the detection of TBI concluded that computed tomography (CT), magnetic resonance imaging (MRI), and transcranial Doppler were the most useful modalities in the clinical setting, but no single imaging modality proved sufficient for all patients due to the heterogeneity of TBI. For example, CT has been used to detect large hemorrhages at the acute stage that require urgent surgical intervention, 7 but CT assessment remains insensitive to many other primary and secondary injuries. Today, advanced MRI methods are being used to detect many of the functional and pathophysiological alterations that result from TBI.8–12 These advanced methods include susceptibility-weighted imaging for hemorrhage detection, 13 diffusion-weighted and diffusion tensor imaging for edema quantification 14 and axonal injury identification, 15 perfusion-weighted imaging to assess hemodynamic disturbances after injury, 16 and magnetization transfer imaging for white matter abnormalities.17,18 However, these commonly used neuroimaging techniques provide little or no information about secondary injury processes, such as excitotoxicity, neuroinflammation, ischemic/hemorrhagic damage, cell death, and proliferation.
Amide proton transfer (APT) imaging, 19 a type of chemical exchange saturation transfer (CEST) MRI,20,21 is an important molecular MRI method that can generate contrast based on tissue pH 22,23 or concentrations of endogenous mobile proteins and peptides.24,25 Previous studies in animals and in humans have demonstrated that APT imaging is capable of detecting brain tumors26,27 and an ischemic lesion.28–32 Notably, we found, in a recent preclinical study, that APT imaging can accurately detect intracerebral hemorrhage and distinctly differentiate hyperacute hemorrhage from cerebral ischemia. 33 In this study, we explored the capability and uniqueness of APT imaging for the detection of primary and secondary brain injuries in experimental TBI models. The goal of this study was to apply multi-parametric quantitative MRI, consisting of T2, T1, isotropic apparent diffusion constant (ADC), cerebral blood flow (CBF), APTw, and magnetization transfer ratio (MTR), to systemically characterize the spatiotemporal dynamics of an open-skull, controlled cortical impact (CCI) model of TBI in rats. We hypothesized that data obtained with APT imaging might aid in the detection of abnormalities not seen with other MRI methods.
Methods and materials
Animals
All procedures were approved by the Johns Hopkins University Animal Care and Use Committee and conducted in accordance with the National Institutes of Health guide for the care and use of laboratory animals. Animal experiments were reported in accordance with the ARRIVE (Animal Research: Reporting in Vivo Experiments) guidelines (www.nc3rs.org.uk/arrive-guidelines). Fifteen adult, male Sprague-Dawley rats (300–325 g) were obtained from Charles River Laboratories (Frederick, MD) and maintained in the Johns Hopkins animal facility. All efforts were made to minimize the numbers of animals used and to ensure that the animals received the highest quality care. TBI was induced in 13 rats, two of which were euthanized due to severe complications during the first 24 h post-injury. Thus, 11 injured and two sham-operated rats were included in the final analysis.
CCI model of TBI
Rats were anesthetized initially with 5% isoflurane and maintained with 1.5%–2% isoflurane in oxygen-enriched air (20% oxygen/80% air) with spontaneous ventilation. CCI injury was induced with a PSI TBI-0310 Impactor (Precision Systems and Instrumentation, Fairfax, VA), which uses electromagnetic force to produce an impact velocity for which speed, depth, and dwell time can each be individually manipulated to produce injuries with different severities. 34 The rats were placed on a stereotactic frame with a built-in heating bed that maintains body temperature at 37℃. The head was mounted in the stereotactic frame. Under aseptic conditions, a midline longitudinal incision was made over the skull, and a 5-mm craniotomy was made using a portable drill and trephine over the left parietal cortex (center of the coordinates of the craniotomy relative to bregma: 1 mm posterior, 1 mm lateral). The bone flap was removed. A pneumatic cylinder with a 3-mm flat-tip impounder produced CCI in the rats at a velocity of 5.5 m/s, depth of 5 mm, and impact duration of 65 ms. The scalp was closed with cyanoacrylate tissue glue. Rats of the sham group received a scalp incision, but the skull was kept intact.
After surgery, buprenorphine hydrochloride (0.04 mg/kg body weight, i.p.) was injected to minimize the animal’s discomfort during recovery. During the follow-up period, the animals were housed in individual cages and kept under controlled laboratory conditions. The animals were monitored daily for any bleeding from the wound site, breathing abnormalities, gross neurological deficits, irreversible distress as evidenced by poor grooming and feeding, wound infection, lethargy, and weight loss. If necessary, the animals were euthanized immediately without further MRI and pathology experiments.
MRI data acquisition
We acquired MRI data using a 4.7 T horizontal bore animal imager (Bruker Biospin; Billerica, Massachusetts, USA) with an actively decoupled cross-coil setup (a 70-mm body coil for radiofrequency transmission and a 25-mm surface coil for signal reception). MRI data were acquired at eight time points (1, 6 h, and 1, 2, 3, 7, 14, and 28 days after TBI). Rats in the sham group were imaged at the same time points. First, high-resolution T2-weighted (T2w) imaging with a fast spin echo sequence (echo train length = 8; repetition time or TR = 3 s; echo time or TE = 64 ms; slice thickness = 1.5 mm; number of averages or NA = 2) was acquired in both the horizontal plane (number of slices = 5; matrix = 256 × 192; field of view =42 × 32 mm2) and the coronal plane (number of slices = 7; matrix = 192 × 192; field of view = 32 × 32 mm2). Several quantitative MRI parameters were acquired, including T2 (TR = 3 s; TE = 30, 40, 50, 60, 70, 80, and 90 ms; NA = 4), T1 (inversion recovery, predelay = 3 s; TE = 30 ms; inversion recovery time = 0.05, 0.3, 0.6, 1.8, 2.5, and 3.5 s; NA = 4), ADC (a single-shot trace-diffusion sequence, Pattern III as described previously 35 ; TR = 3 s; TE = 80 ms; b-values = 0, 166.7, 333.3, 500, 666.7, 833.3, and 1000 s/mm2; NA = 8), CBF (arterial spin labeling or ASL 22 ; 3-s labeling 20 mm away from the imaging slice; TR = 6 s; TE = 28.6 ms), and APT (frequency labeling offsets of ± 3.5 ppm; TR = 10 s; TE = 30 ms; saturation power = 1.3 mT; saturation time = 4 s; NA = 16). An unsaturated image in the absence of radiofrequency saturation was also acquired for APT imaging signal intensity normalization. To reduce the effect of B0 field inhomogeneity on APT imaging, high-order, localized slab shimming (thickness = 10.5 mm) was performed around the lesion. In addition, prior to the APT data acquisition, a magnetization transfer spectrum with a low saturation power (0.5 µT) and a narrow offset range (−0.6 to 0.6 ppm at intervals of 0.05 ppm) was acquired on the same APT slice. The magnetization transfer-spectrum center frequency was determined on the scanner and used to adjust the scanner transmitter frequency. Conventional MTR images were also acquired with the same experimental parameters as the APT scan except that a saturation frequency offset of 10 ppm (2 kHz at 4.7 T) was used. Single-shot, spin-echo, echo-planar imaging was used for all quantitative MRI data acquisition (matrix = 64 × 64; field of view = 32 × 32 mm2; single slice; slice thickness = 1.5 mm). The image slice was overlapped with one of the coronal T2w images, and all quantitative MRI sequences had the same geometry and location. Finally, T1-weighted (T1w) images (TR = 700 ms; TE = 10 ms; NA = 10) and T2*-weighted (T2*w) images (TR = 700 ms; TE = 10 ms; NA = 10) were acquired with the same geometry and location as the T2w images.
Image analysis
Data processing procedures were performed with Interactive Data Language software (IDL, version 7; Exelis Visual Information Solutions, Inc., Boulder, Colorado, USA). The images were interpolated to 384 × 384. The T1 map, T2 map, and ADC map were fitted using the following equations: I = A+B exp (−TI/T1) (where A and B are the other two fitting parameters in addition to T1), I = I0 exp (−TE/T2), and I = I0 exp (−b ADC), respectively. The CBF map was reconstructed from images with and without labeling, using previously described methods.
22
The APTw images were calculated based on the MTR asymmetry at ± 3.5 ppm with respect to the water signal:
19
MTRasym(3.5 ppm) = Ssat(−3.5 ppm)/S0 – Ssat(+3.5 ppm)/S0, where Ssat and S0 are the signal intensities with and without selective radiofrequency irradiation, respectively. Based on the MTR asymmetry analysis, negative APTw values may be observed due to the confounding upfield nuclear Overhauser effect.
36
The MTR map at 2 kHz was calculated using the well-known equation: 1 – Ssat(2 kHz)/S0. The obtained images were interpolated to 384 × 384, thresholded based on the S0 image, and displayed using a window of −6% to 6%. For the quantitative image analysis, the signal abnormalities on the high-resolution T2w images were used as a reference to define regions of interest (ROI). Seven ROIs were drawn manually on the T2w images (Figure 1) and then transferred to identical sites on all co-registered MRI maps.
37
ROIs (dashed lines) drawn on a T2w image acquired at 1 h post-injury. Core lesion area (C), ipsilateral cortex (IC), contralateral cortex (CC), bilateral hippocampus (H), and bilateral thalamus (T).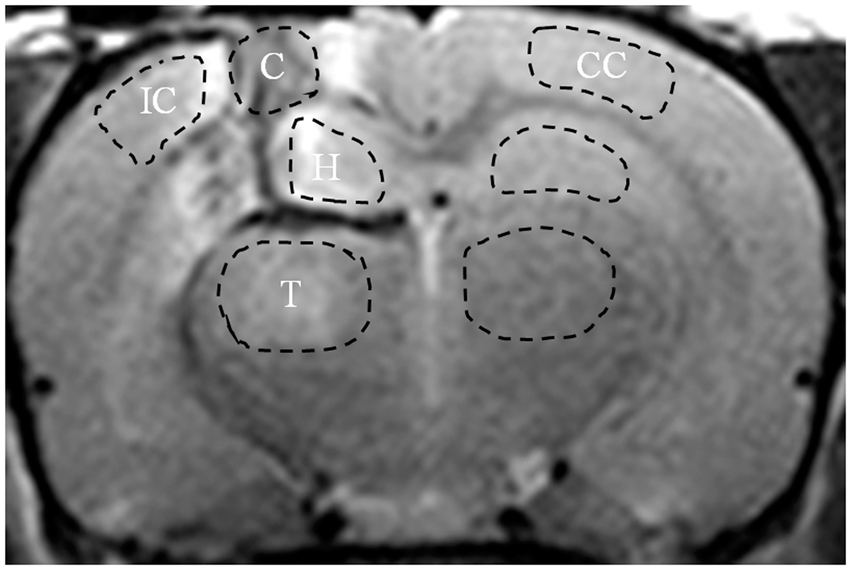
Statistical analysis
All results were expressed as mean ± standard deviation (SD). MRI parameter differences between TBI and control groups were calculated using a one-way ANOVA, followed by Tukey's HSD post hoc test. Eleven sets of MRI parameters for two sham-operated rats from all eight follow-up time points were randomly selected as the control group. All statistical analyses were performed using the statistical package SPSS for Windows (Version 22, Chicago, IL). The level of significance was set at P < 0.05.
Results
Multiparametric MRI features of TBI
Figure 2(a) shows representative MR images of the TBI model in a rat at multiple time points post-injury, including structural (T2, T1), functional (ADC, CBF), and molecular (APTw, MTR) MRI parameters, as well as several routine, high-resolution MRI sequences (T2w, T1w, and T2*w). The primary injury at the impacted site was evident on the T2w and T2*w images at 1 h and 6 h post-injury. The T2w signals in the lesion were heterogeneous, indicating the presence of both edematous tissue and bleeding. The T2*w images verified the presence of hemorrhage in areas of the parietal cortex, hippocampus, and lateral ventricle. Further, quantitative T2 and T1 maps showed heterogeneous, but primarily hyperintense signals in the impacted area, compared with the contralateral brain tissue. At the contusion site, a cyst formed at the later time points of 14 d and 28 d post-injury.
(a) A typical example of the multi-parametric MR images of TBI in a rat at different time points. (b) Enlarged APTw images at several time points. The APTw signal intensity decreased globally at 1 h and 6 h post-injury (green arrows). In the core lesion, there were some intermediate to slightly hyperintense signal intensities, which were due to hemorrhage (red arrows), as shown by T2*w. After the initial drop, the low APTw-MRI signal was gradually recovered. At 2 d and 3 d post-injury, the APTw signal intensities of the ipsilateral cortex and ipsilateral hippocampus (blue arrows) dramatically increased, due to the secondary inflammatory response. A cyst (open orange arrows) was noted at 14 d and 28 d post-injury. The display windows are T2 (0 to 100 ms), T1 (0.5 to 2.5 sec), ADC (0 to 2 × 10⁻⁹ m2/sec), blood flow (0 to 150 ml/100g/min), APTw (−6% to 6% of the bulk water signal intensity), and MTR at 2 kHz (0 to 50% of the bulk water signal intensity).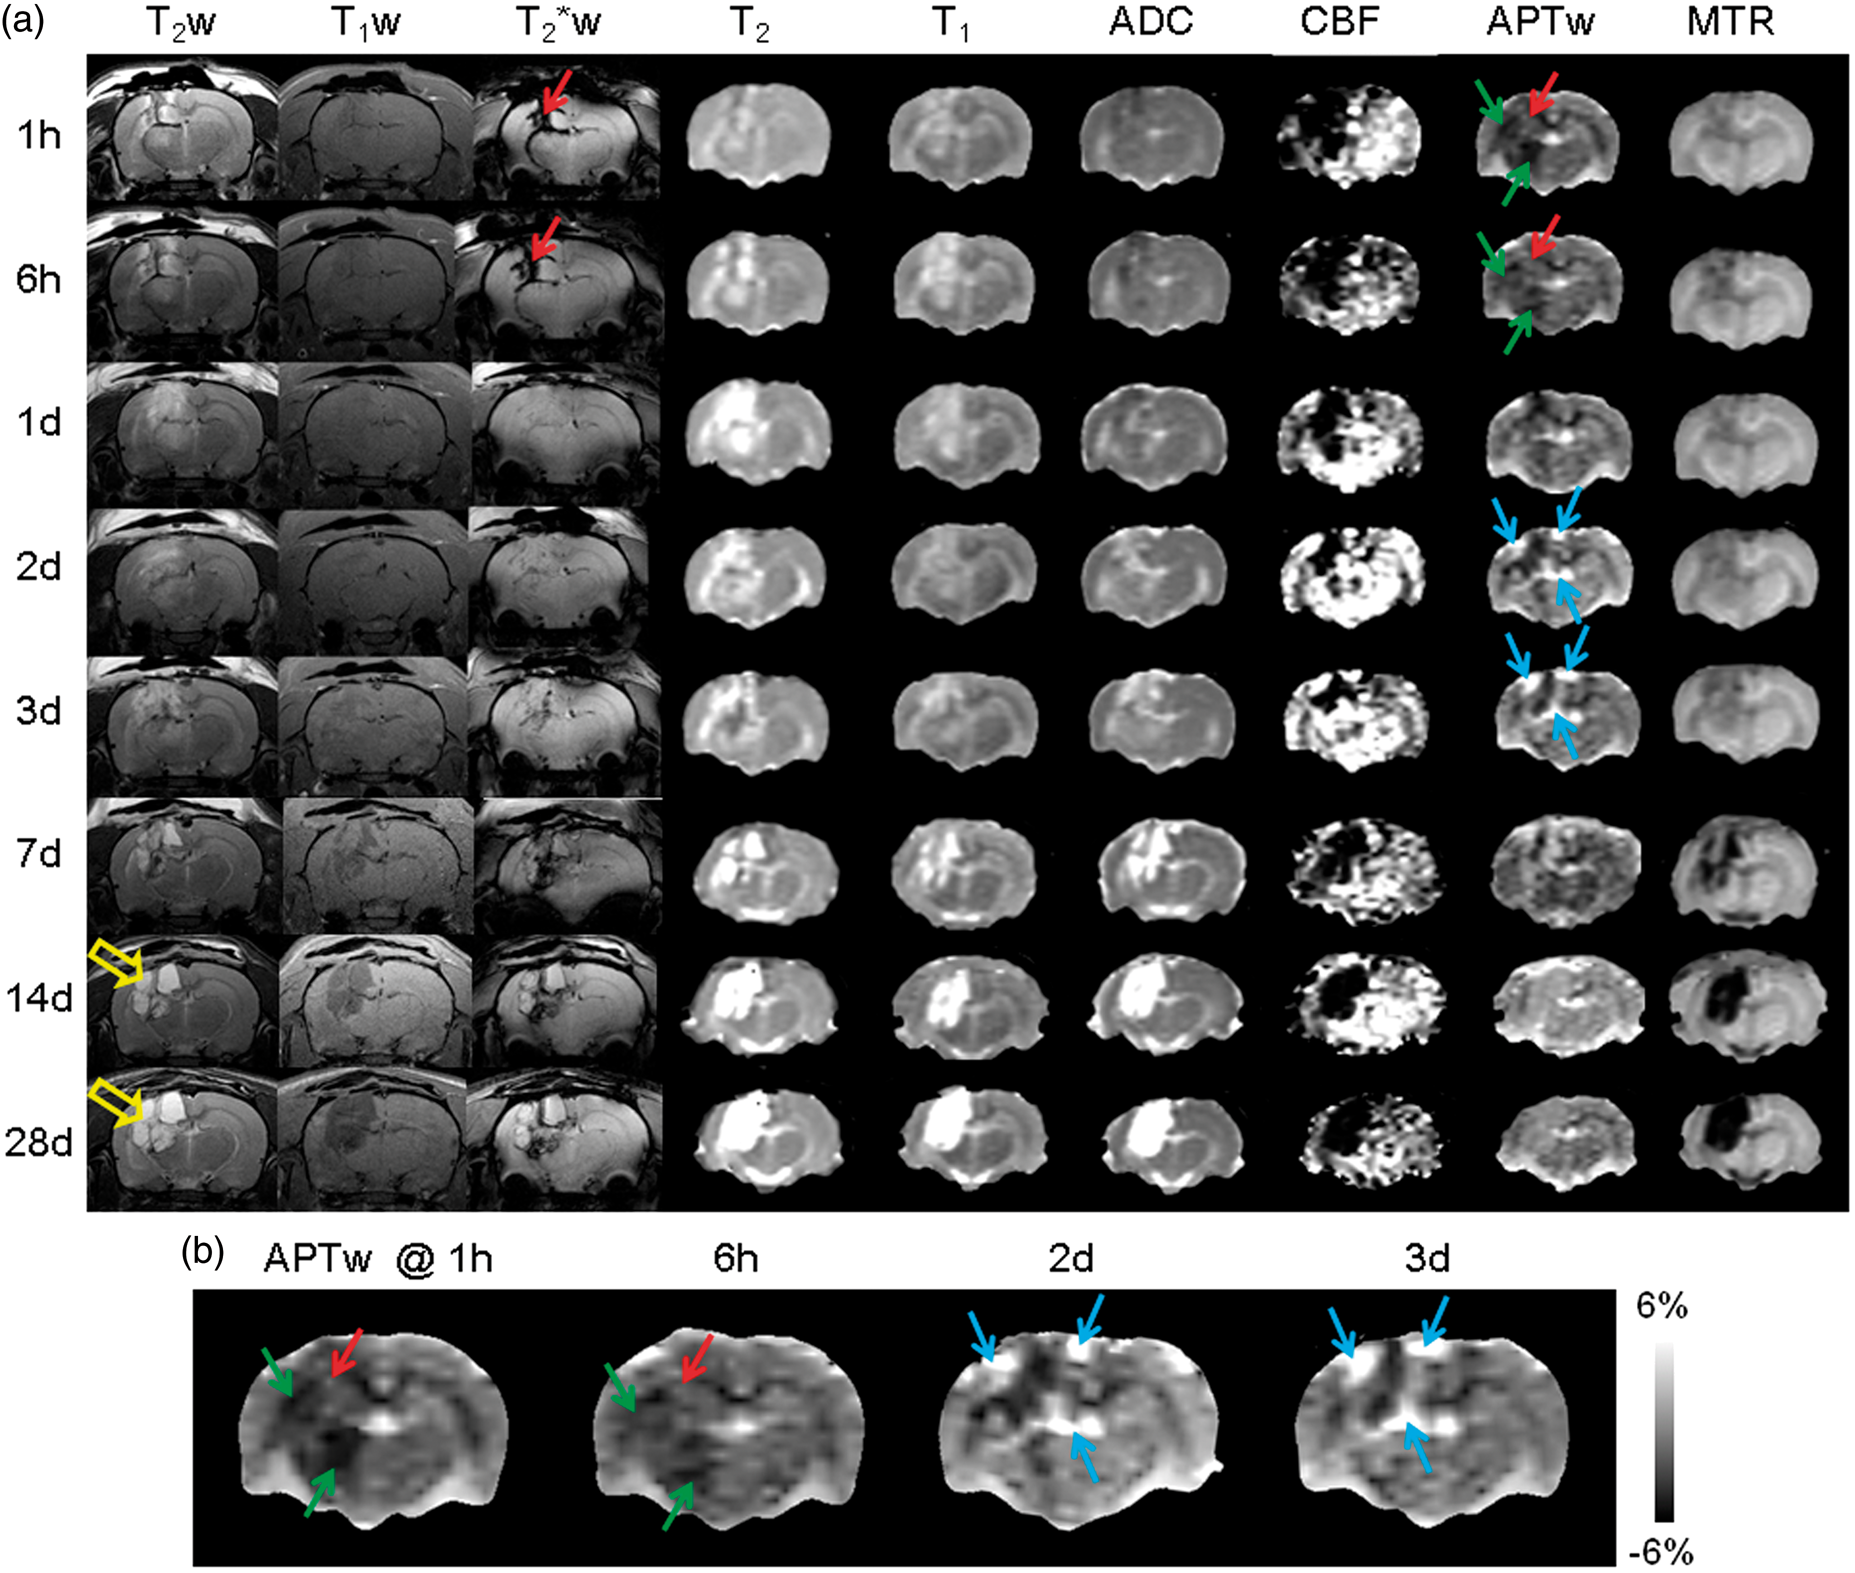
Based on advanced MRI sequences (Figure 2(a)), the ADC maps showed heterogeneous signals, with slight hypointensity at the earliest time point of 1 h post-injury, indicating possible cellular or cytotoxic edema, as well as observable hyperintensity at many time points thereafter, perhaps indicating vasogenic edema, as reported in the literature. 38 The most noticeable changes in MRI were found in the CBF and APTw measurements. The CBF signals decreased considerably in most ipsilateral and even some contralateral regions at 1 h and 6 h post-injury, and recovered gradually thereafter, except in the core lesion area. Similar to CBF, the APTw signals in the ipsilateral brain tissue showed an acute drop at 1 h and 6 h post-injury (Figure 2(b)), compared to the contralateral brain tissue. The areas with decreased CBF and APTw were similar. In addition, there was a slightly high APTw signal in the core lesion area with respect to the peri-lesional area, which was due to hemorrhage (with abundant mobile proteins), as demonstrated by T2*w. It is also interesting to note that the CBF and APTw signals at 2 d and 3 d post-TBI increased drastically in the ipsilateral peri-lesional area, compared with the contralateral brain area.
Quantitative analysis of MRI parameters
Quantitatively, the T2 and T1 values in the core lesion area (Figure 3) increased consistently over time, compared to those of shams. T2 prolongation was significant from 1 d (p < 0.001), T1 prolongation was significant from 6 h (p < 0.05), and both were sustained throughout the whole follow-up period. Substantial increases in these two structural MRI parameters were observed at 28 d post-injury (T2 increased by 4.1 times, T1 by 0.7 times; both p < 0.001), perhaps due to cystic liquefactive necrosis. As far as two functional MRI parameters (ADC and CBF) are concerned, there was a small ADC drop at 1 h post-injury (insignificant, p = 0.544), compared to shams. Thereafter, like T2 and T1, the ADC signals in the core lesion area increased consistently over time, indicating the loss of diffusion-limiting structures. At 14 d and 28 d post-injury, the measured ADC values were, respectively, 1.6 and 2.2 times higher than those in shams (both p < 0.001) due to cystic liquefactive necrosis. Notably, the CBF signals decreased dramatically throughout the whole follow-up period (all p < 0.001). For two molecular MRI parameters (APTw and MTR), the APTw values in the core lesion area showed a significant drop at the two earliest time points of 1 h and 6 h post-injury (p < 0.001 and 0.01, respectively), compared to shams (−0.78%, a negative value). Thereafter, APTw returned to the sham level within a few hours post-injury, and later showed an increasing trend toward positive values (e.g. APTw = 1.2% at 7 d; p < 0.001). The MTR signal intensities substantially decreased in the core lesion area (all p < 0.001), especially when a cyst formed at 14 d and 28 d post-injury.
Quantitative analysis of multiparametric MRI signal intensities at the different time points after TBI in the core lesion area, ipsilateral cortex, and contralateral cortex. Data are shown as mean ± SD. Statistical significances: *p < 0.05; **p < 0.01; ***p < 0.001, compared with the shams (S).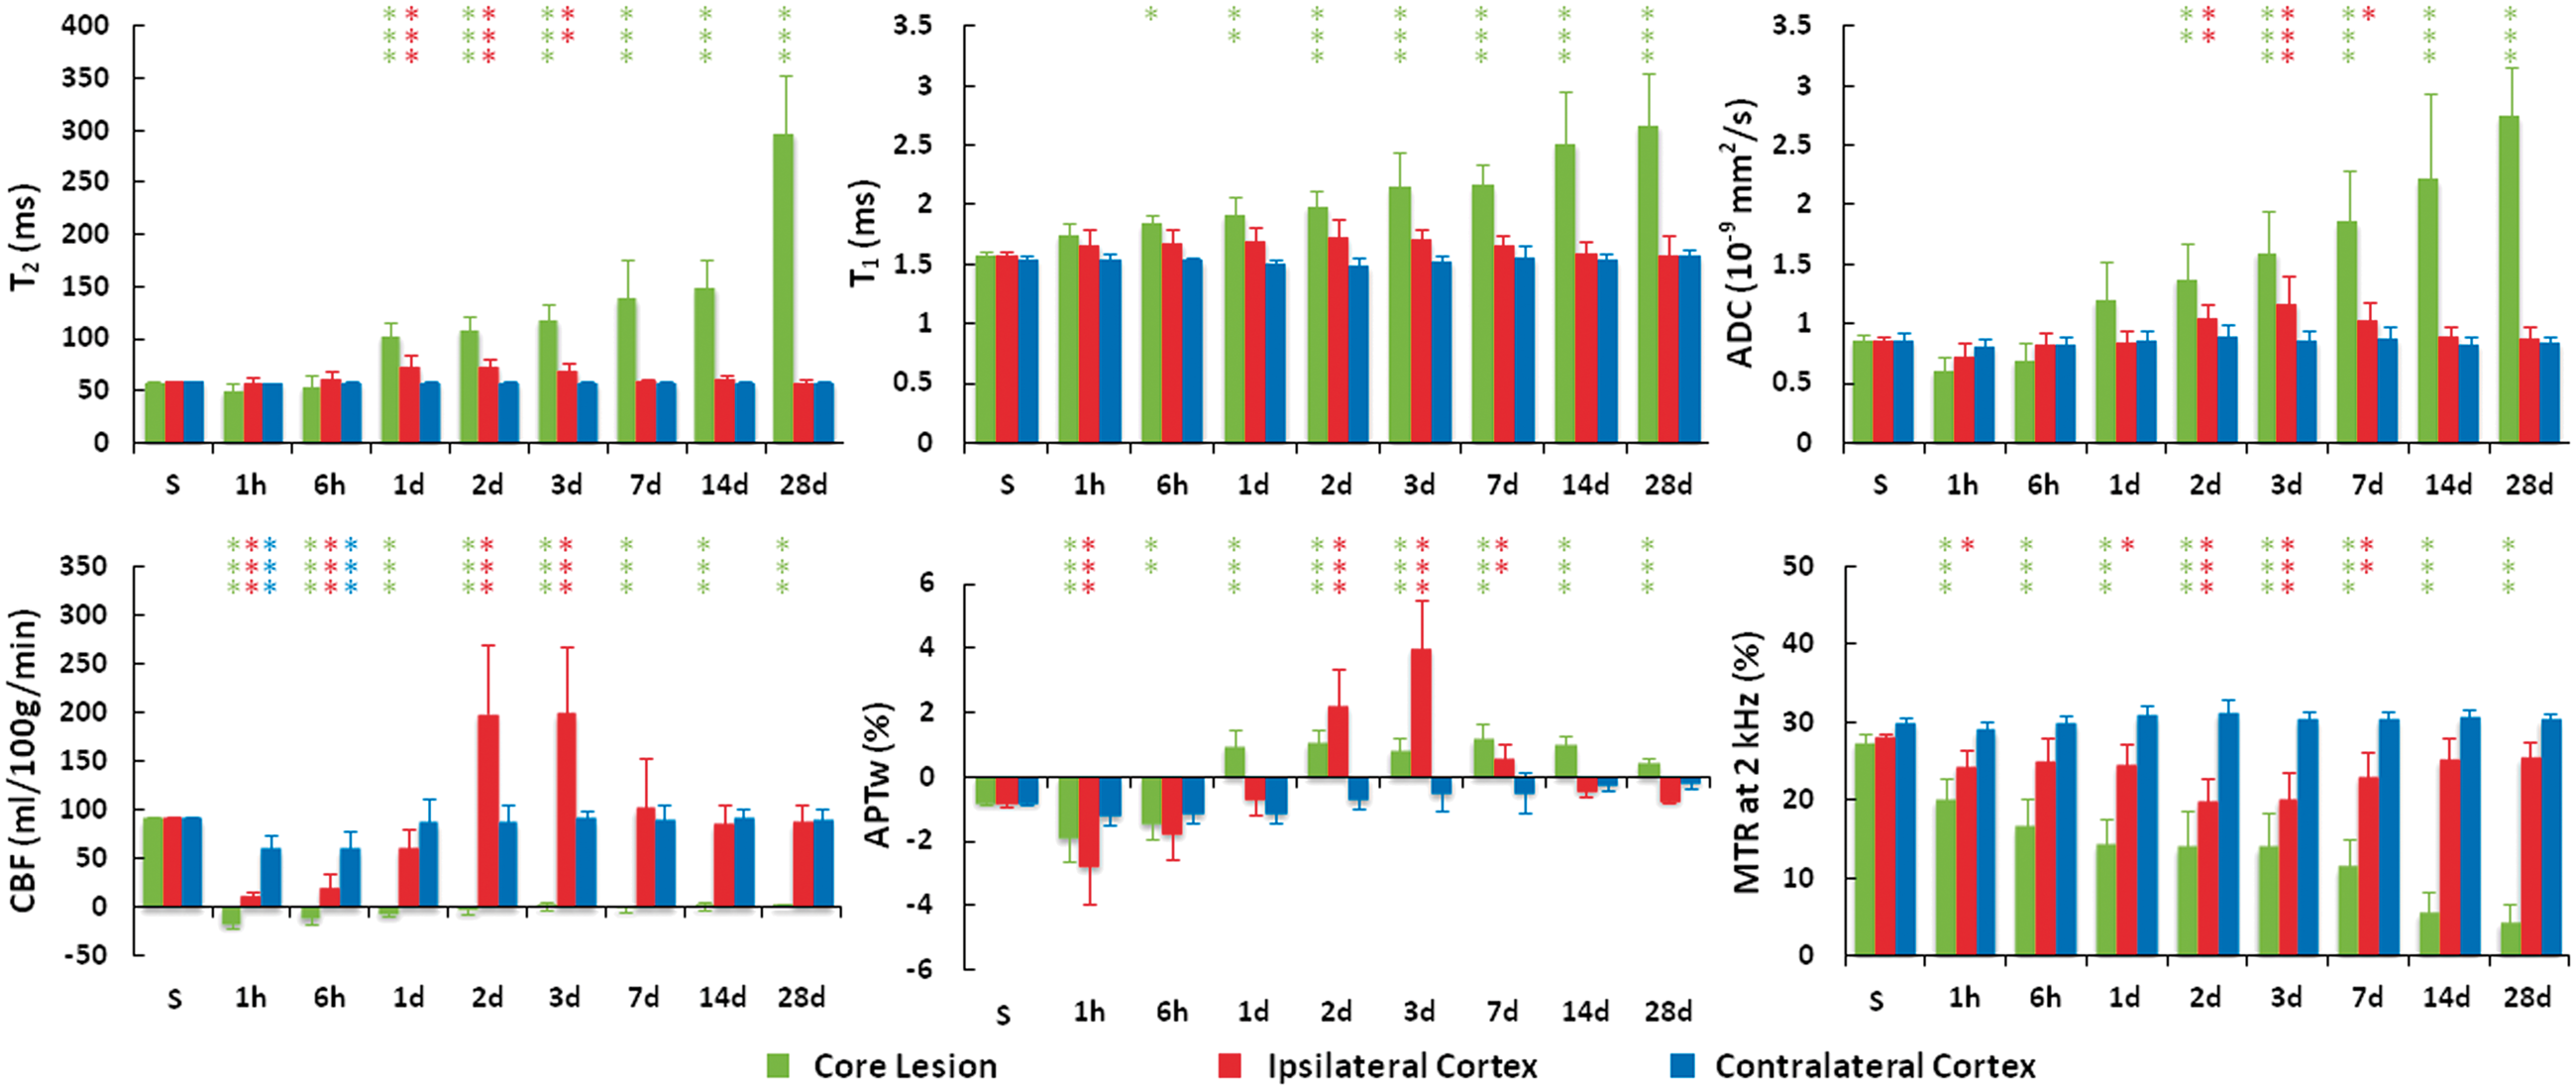
In the ipsilateral cortex (Figure 3), the T2 values remained at the sham level at the earliest time points of 1 h and 6 h post-injury. Then, a significant increase in T2 was observed during 1 d and 3 d post-injury (all p < 0.01), compared to shams. From 7 d post-injury, T2 recovered to the sham level. Similar to T2, the T1 value showed a slight increase around 2 d post-injury, and the difference was almost statistically significant (p = 0.053). As in the core lesion area, the ADC value in the ipsilateral cortex showed an insignificant drop at 1 h post-injury (p = 0.107), compared to shams. Thereafter, ADC returned toward the sham value, and further showed a significant increase between 2 d and 7 dpost-injury (all p < 0.05), compared to shams. There were no significant changes in T2, T1, or ADC in the contralateral brain areas. Both the ipsilateral and contralateral cortices, in particular, showed a significant drop of CBF at 1 h and 6 h post-injury (both p < 0.001). After the initial drop, CBF recovered toward the sham values. Notably, the CBF values of the ipsilateral cortex were markedly increased at 2 d and 2 d (both increased by 1.2 times; p < 0.001), compared to shams, and finally returned toward the sham values. Similar to CBF, the APTw values in the ipsilateral cortex had an initial drop at 1 h (p < 0.001), and were dramatically increased during 2 d and 7 d (e.g. APTw = 4% at 3 d vs. −0.78% in shams; p < 0.001). Thereafter, APTw returned toward the sham values at 28 d post-injury. The MTR values in the ipsilateral hemisphere were decreased significantly at most of the early time points post-injury.
In other peri-lesional areas (ipsilateral hippocampus and ipsilateral thalamus), some degree of change in the measured MRI parameters was clearly observed, significantly or insignificantly. Roughly, the T2, T1, and ADC signals in these peri-lesional areas typically showed increases, and MTR typically showed a decrease, compared with those of shams. However, the CBF and APTw signals could demonstrate relatively complicated changes with time, depending on the degree of injury severity. Particularly, as seen in the ipsilateral and contralateral cortices (Figure 3), both the ipsilateral and contralateral hippocampus (Figure 4(a)) showed a large drop of CBF or APTw at the earliest time points post-injury. However, the CBF and APTw values of the ipsilateral hippocampus were markedly increased at 2 d and 3 d (all p < 0.001), compared to shams. In the ipsilateral thalamus relatively far from the primary injury site (Figure 4(b)), after their initial increase or drop, all MRI parameters recovered toward the corresponding sham values at the later time points of 7–28 d post-injury. There was a consistent decrease in CBF or APTw (at several earliest time points post-injury only) from the sham. In the contralateral thalamus, no significant changes for any MRI parameters were detected in any follow-up time points (except APTw at 1 h).
Quantitative analysis of multiparametric MRI signal intensities at the different time points after TBI (a) in the ipsilateral hippocampus and contralateral hippocampus and (b) in the ipsilateral thalamus and contralateral thalamus. Data are shown as mean ± SD. Statistical significances: *p < 0.05; **p < 0.01; ***p < 0.001, compared with the shams (S).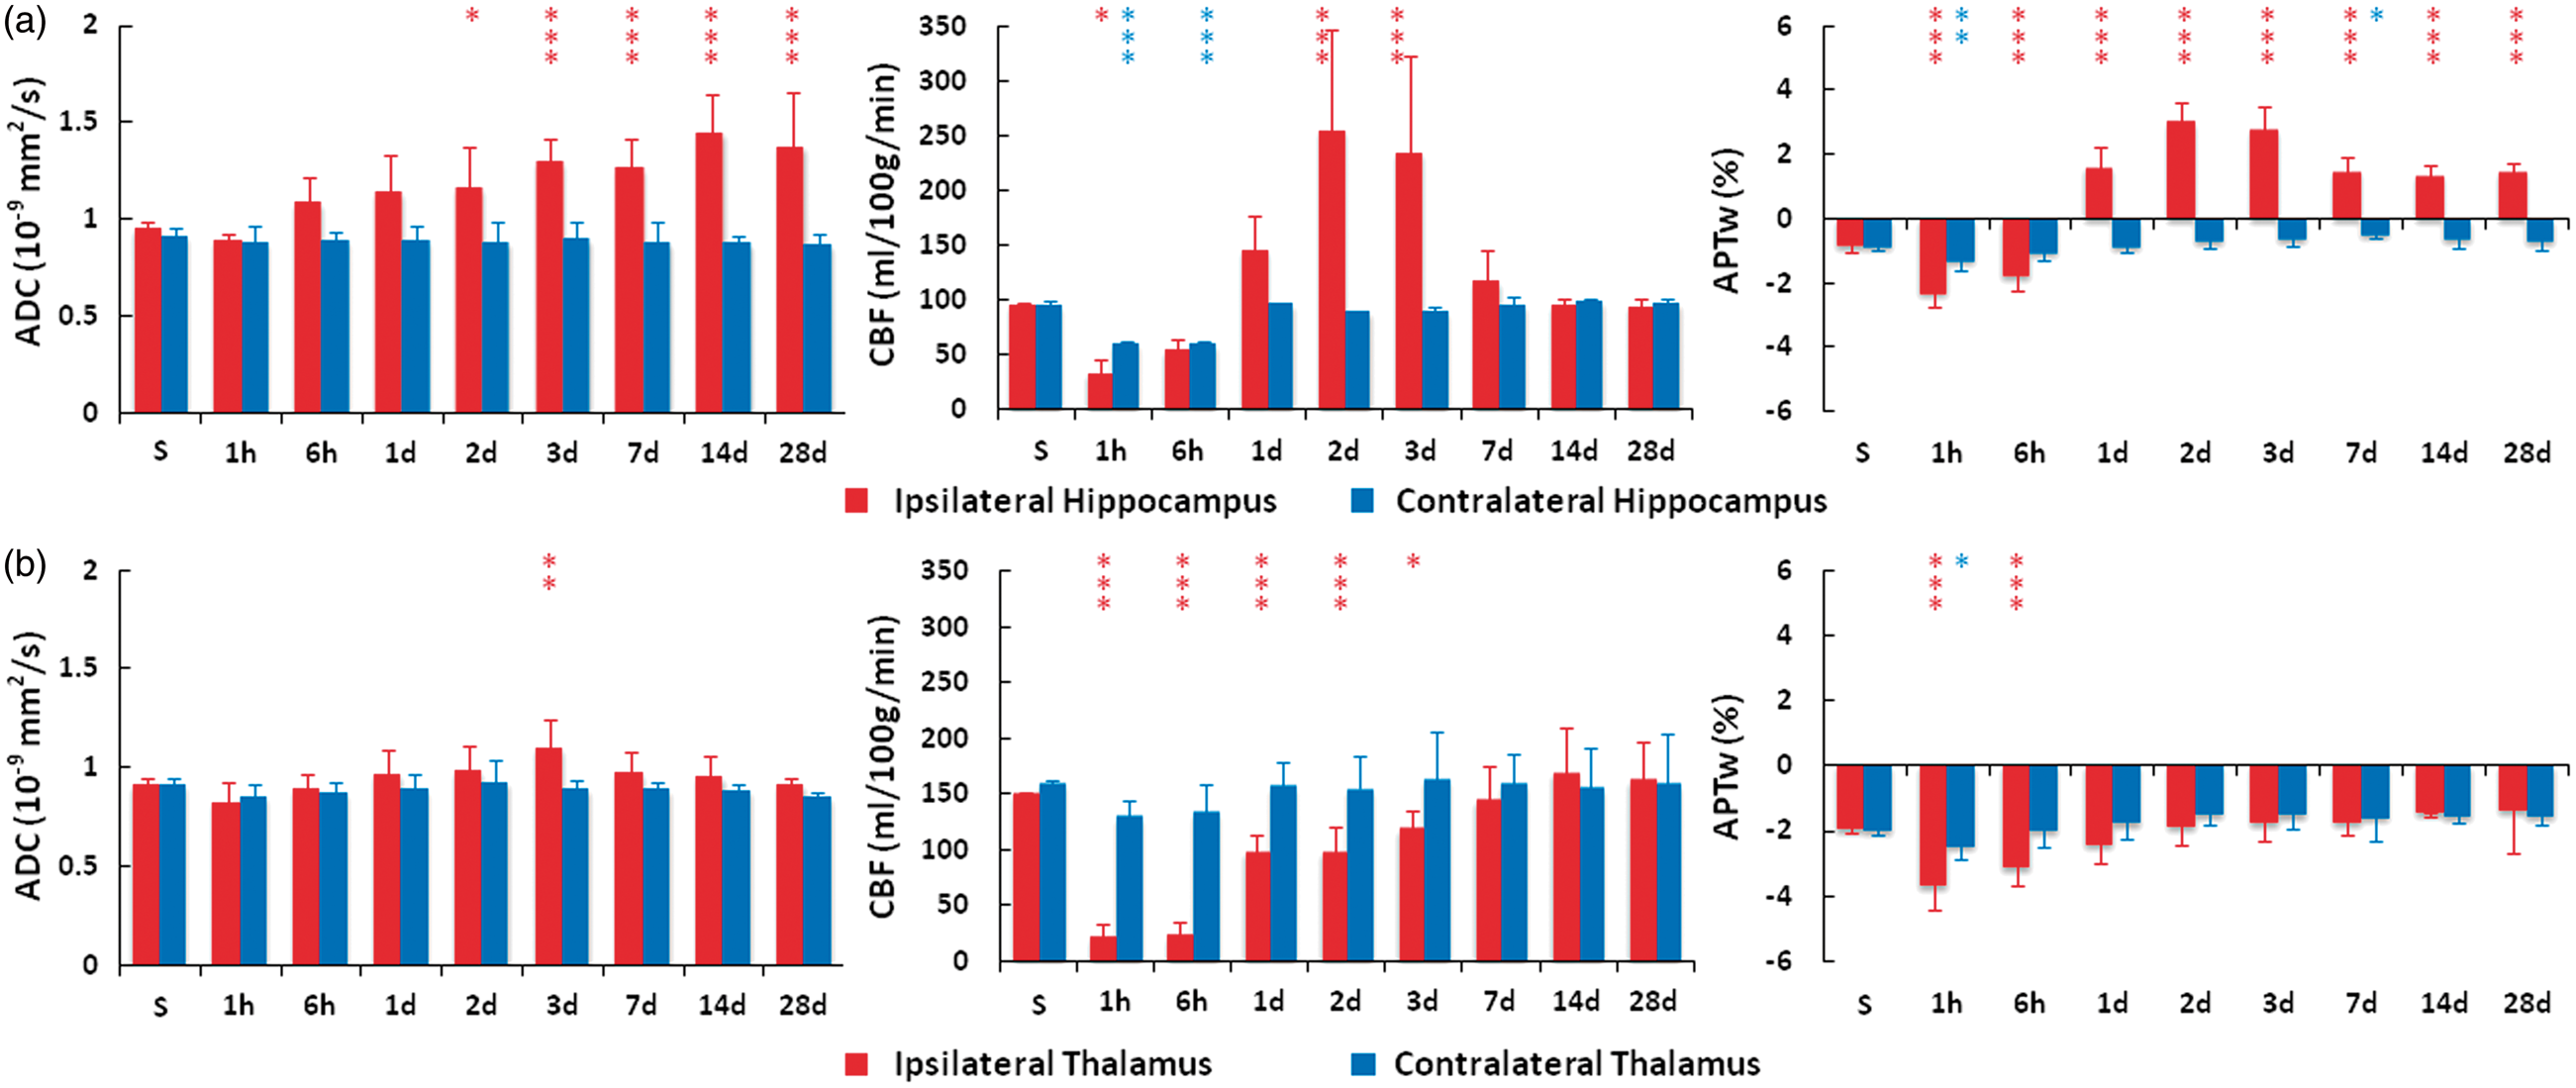
Discussion
Once a TBI occurs, a number of short- and long-term destructive processes begin to affect the brain. In most cases, TBI-induced primary injury results in direct damage to the brain parenchyma, such as contusion, hemorrhage, laceration, and diffuse axonal injury. 39 The primary injury triggers a secondary wave of biochemical cascades, together with metabolic and cellular changes. TBI-induced secondary injury consists of excitotoxicity, ischemia, inflammation, oxidative stress, blood–brain barrier disruption, and brain edema.40–43 The secondary injury can be detected mainly in the peri-lesional regions, but neurodegeneration in brain areas located far from the primary injury site has recently been recognized. 44 As such, the surrounding tissue is often the focus of TBI research. In this study, we used several noninvasive, structural, functional, and molecular MRI techniques to evaluate the spatiotemporal evolution of TBI, and explored the capability and uniqueness of APT imaging for the detection of primary and secondary brain injuries.
It is known that cerebral injury after TBI at the initial stage is characterized by direct tissue damage and impaired regulation of CBF and metabolism, an “ischemia-like” pattern that can lead to accumulation of lactic acid due to anaerobic glycolysis, increased membrane permeability, and consequently edema formation. 5 In several previous studies,28–32 APTw hypointensity was observed in ischemic stroke due to tissue acidosis after impaired aerobic metabolism. Based on this study, the use of CBF and APTw imaging revealed an acute “ischemia-like” pattern of CBF and APTw hypointensities around the impacted area at 1 h and 6 h post-injury, which were not evident on several other MRI sequences. Further, it was demonstrated recently that a single APT-MRI scan is capable of detecting cerebral hemorrhage and ischemia simultaneously. 33 In the current study, a slightly hyperintense APTw signal intensity could be observed in the core lesion area with respect to in the peri-lesional area, which was due to hemorrhage, as shown by T2*w. The APTw hyperintensity in hyperacute hemorrhage was primarily attributable to the presence of abundant erythrocytes and other plasma proteins and peptides in the newly formed hematoma. In addition, a slightly higher pH in the hematoma (∼0.2 pH units), relative to normal brain tissue, may have further increased the APTw contrast. This high APTw signal in blood has previously been observed in pure blood experiments 45 and in many brain lesions, such as brain tumors.46–48
TBI induces a complex array of immunologic/inflammatory responses with similarities to hemorrhagic stroke injury. Both primary and secondary TBI insults activate the release of cellular mediators, including proinflammatory cytokines, prostaglandins, free radicals, and the complement system. 5 Long-term neurological deficits after TBI are associated with neuroinflammation, which may have different functions over time, making treatment a very complex task.49–51 Reliable, non-invasive predictive markers for the possible long-term effects would greatly facilitate treatment approaches and patient management. The APTw images were heterogeneous with areas of high and low APTw signal intensities at 2 d and 3 d post-injury. The APTw values were dramatically increased in some peri-lesional areas (ipsilateral cortex and hippocampus). Similarly, the CBF of peri-lesional areas was markedly increased at 2 d and 3 d post-injury. These changes in CBF and APTw can be attributed to the inflammatory response, typically observed a few days post-TBI, 52 and other pathophysiologic processes (such as the vasodilation 53 ). In a preliminary histopathology and immunofluorescence experiment (Supplementary Figure 1), consistent with a prior study, 52 we observed an increased glial response (e.g. activated microglia and astrocytes) in the peri-lesional regions at 3 d post-TBI, compared to at 1 d post-TBI and in the sham brain at the same day. Notably, the APTw signal intensities also increased in the same areas and at the same time point, suggesting that APT MRI could be a sensitive biomarker for neuroinflammation (that could cause an increase in cellularity, thus leading to an increase in APTw-detectable mobile, cytosolic protein and peptide concentration24,25). A further quantitative radiographic-histopathologic correlation study is needed to better understand longitudinal changes in these MRI signals.
Finally, we would like to point out that both ASL and APT seem equally applicable for imaging of TBI. However, ASL is typically associated with a change of 1–2% bulk water intensity and APT is associated with a change of 3−5% bulk water intensity; thus, APT imaging has higher signal-to-noise ratios than ASL, as seen in Figure 2. Technically, APT imaging works well on 4.7 T animal MRI scanners (as shown in the current study), as well as on standard 3 T clinical MRI scanners54–56. Recently, it has become possible to perform whole-brain APT imaging in a few minutes on 3 T MRI scanners. 57 Therefore, the findings obtained in this study can readily be translated to the clinic, which would significantly improve precision-medicine-based clinical care.
Conclusions
In this study, we applied the novel APT-MRI approach, as a scan of multi-parameter MRI, to the TBI model in rats at 4.7 T. The data showed that APT MRI can reveal some key TBI features in vivo, such as ischemia, hemorrhage, and inflammatory response. Increased APTw signals in peri-lesional areas at two to three days after injury could be attributed to the increased secondary inflammatory response. The results of this preclinical study support the possibility of using a single molecular MRI scan, such as APTw imaging, to simultaneously detect several key pathophysiological features in TBI, such as ischemia, hemorrhage, and neuroinflammation.
Footnotes
Funding
The author(s) disclosed receipt of the following financial support for the research, authorship, and/or publication of this article: This work was supported in part by grants from the National Institutes of Health (R01NS083435, R01NS078026, R01EB009731, R01CA166171, and R01AT007317), the American Heart Association (13GRNT15730001), and the National Natural Science Foundation of China (81361120392), and a “Stimulating and Advancing ACCM Research (StAAR)” grant from the Department of Anesthesiology and Critical Care Medicine, Johns Hopkins University.
Acknowledgments
The authors thank Ms. Mary McAllister for editorial assistance.
Declaration of conflicting interests
The author(s) declared the following potential conflicts of interest with respect to the research, authorship, and/or publication of this article: JZ is co-inventor on a patent for the APT MRI technology. This patent is owned and managed by Johns Hopkins University. All other author declared no potential conflicts of interest with respect to the research, authorship, and/or publication of this article.
Authors’ contributions
HZ, WW, JW, and JZ conceived and designed the research. HZ, WW, SJ, YZ, H-YH, and JZ performed the research. HZ, WW, SJ, YZ, H-YH, XW, YP, JW, and JZ analyzed data. HZ, WW, JW, and JZ wrote the paper. JW and JZ obtained funding. All authors revised the paper and approved the final version.
References
Supplementary Material
Please find the following supplemental material available below.
For Open Access articles published under a Creative Commons License, all supplemental material carries the same license as the article it is associated with.
For non-Open Access articles published, all supplemental material carries a non-exclusive license, and permission requests for re-use of supplemental material or any part of supplemental material shall be sent directly to the copyright owner as specified in the copyright notice associated with the article.