
Abstract
Diffusion weighted imaging (DWI) has been commonly used in acute stroke examination, yet a portion of DWI lesion may be salvageable. Recently, it has been shown that diffusion kurtosis imaging (DKI) defines the most severely damaged DWI lesion that does not renormalize following early reperfusion. We postulated that the diffusion and kurtosis lesion mismatch experience heterogeneous hemodynamic and/or metabolic injury. We investigated tissue perfusion, pH, diffusion, kurtosis and relaxation from regions of the contralateral normal area, diffusion lesion, kurtosis lesion and their mismatch in an animal model of acute stroke. Our study revealed significant kurtosis and diffusion lesion volume mismatch (19.7 ± 10.7%, P < 0.01). Although there was no significant difference in perfusion and diffusion between the kurtosis lesion and kurtosis/diffusion lesion mismatch, we showed lower pH in the kurtosis lesion (pH = 6.64 ± 0.12) from that of the kurtosis/diffusion lesion mismatch (6.84 ± 0.11, P < 0.05). Moreover, pH in the kurtosis lesion and kurtosis/diffusion mismatch agreed well with literature values for regions of ischemic core and penumbra, respectively. Our work documented initial evidence that DKI may reveal the heterogeneous metabolic derangement within the commonly used DWI lesion.
Keywords
Introduction
Diffusion weighted imaging (DWI) is sensitive to acute stroke and has been widely regarded as an imaging approximation of the most severely damaged infarction core.1,2 Built on this assumption, multiple mismatch paradigms have been proposed that use perfusion/DWI, angiography/DWI, fluid-attenuated inversion recovery imaging (FLAIR)/DWI, or clinical/DWI mismatches to identify potentially salvageable ischemic tissue (penumbra).3–7 In addition, infarction core volume, often assessed by diffusion MRI, has been used as one of imaging criteria to guide late stroke treatment.8–10 However, increasing evidence has suggested that DWI lesion includes both the infarction core and potentially salvageable ischemic tissue; a portion of DWI lesion may normalize following effective recanalization, even in cases of large DWI lesions.11,12 This is consistent with the observations of graded metabolic disruption within the DWI lesion.13,14 It is not uncommon to have sustained DWI reversibility, especially with early reperfusion and therefore, the use of DWI lesion as infarction core may underestimate ischemic penumbra volume.15,16 However, the severity of apparent diffusion coefficient (ADC) change does not predict irreversible tissue damage and there has been no well-established imaging means to delineate the heterogeneous DWI lesion. 17
Diffusion kurtosis imaging (DKI) quantifies non-Gaussian diffusion that refines the commonly used yet simplistic ADC analysis.18–21 It has been shown that kurtosis/diffusion lesion mismatch often renormalizes following prompt recanalization while kurtosis lesion shows poor recovery, suggesting that kurtosis lesion identifies the most severely damaged DWI lesion. 22 However, little is known about the underlying pathophysiological difference between kurtosis lesion and kurtosis/diffusion lesion mismatch; positron emission tomography (PET) is not readily available in the acute stroke setting and the spatiotemporal resolution of MR spectroscopy is limited, particularly in experimental stroke models. It is worthwhile to mention that tissue acidosis is a surrogate metabolic index that alters prior to tissue infarction. 23 Therefore, we postulated that DKI may reflect graded hemodynamic and/or metabolic injury within the heterogeneous DWI lesion.
In this study, we used a well-established middle cerebral artery occlusion (MCAO) rodent model of acute stroke, and collected multi-parametric MRI to assess ischemic tissue injury. Specifically, we acquired arterial spin labeling (ASL) MRI to measure tissue perfusion. To investigate pH, we applied amide proton transfer (APT) MRI, a specific form of chemical exchange saturation transfer (CEST) MRI that is sensitive to pH-dependent amide proton exchange between endogenous mobile proteins/peptides and bulk tissue water.24–27 It has been shown that APT MRI is closely correlated with lactate concentration during acute ischemic stroke, and tissue pH can be estimated from quantitative APT MRI.28,29 To suppress the intrinsic kurtosis heterogeneity not related to acute ischemia, we applied the inherent correlation-based normalization (ICON) analysis for semiautomatic kurtosis lesion segmentation. 30 We then analyzed perfusion, pH, diffusion, kurtosis, and relaxation values in the contralateral normal area, diffusion lesion, kurtosis lesion, and the kurtosis/diffusion lesion mismatch. Importantly, we found that kurtosis lesion had significantly worsened pH drop from the kurtosis/diffusion lesion mismatch, substantiating the postulation that DKI provides an expedient means to resolve the routine DWI lesion based on its severity of metabolic derangement.
Material and methods
Rodents
In vivo studies have been approved by the institutional animal care and use committee, Massachusetts General Hospital (IACUC, MGH). All procedures were conducted in accordance with the National Research Council guidelines for the care and use of animals. Our study is also in compliance with the ARRIVE guidelines. Briefly, adult male Wistar rats (Charles River Laboratory, Wilmington, MA) were anesthetized with 1.5–2.0% isoflurane/air mixture throughout the study, with physiological parameters (e.g. heart rate, sPO2, and rectal temperature) monitored and maintained within their normal ranges. Five normal rats (n = 5) and additional fifteen acute stroke rats (n = 15) were imaged between 1 and 2 h after MCAO. Briefly, after exposure of the right carotid bifurcation, the common carotid and distal external carotid arteries were sutured, and a silicone-coated 4-0 nylon filament was inserted and slowly advanced to block the origin of middle cerebral artery. One animal had failed MCAO surgery and was removed from the study. Another animal had technical issues with ASL MRI, and perfusion scan was excluded from data analysis.
MRI
Images (five slices, slice thickness = 2 mm, field of view = 20 × 20 mm2, matrix = 48 × 48) were acquired at a 4.7 T Biospec MRI (Bruker Biospin, Billerica, MA). Briefly, we scanned a fast DKI protocol (gradient duration/diffusion time (δ/Δ) = 6/20 ms, repetition time (TR)/echo time (TE) = 2500/36.6 ms, 4 averages, scan time = 3 min).
31
The fast DKI protocol consisted of one b = 0 s/mm2 reference image, followed by three images of b = 1000 s/mm2 along three gradient directions of (1,0,0), (0,1,0), and (0,0,1), and nine images of b = 2500 s/mm2 along nine diffusion directions of
Data analysis
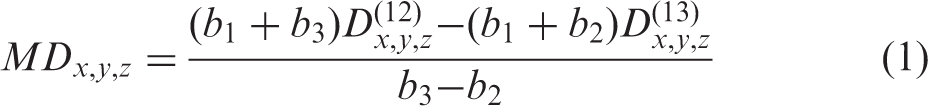
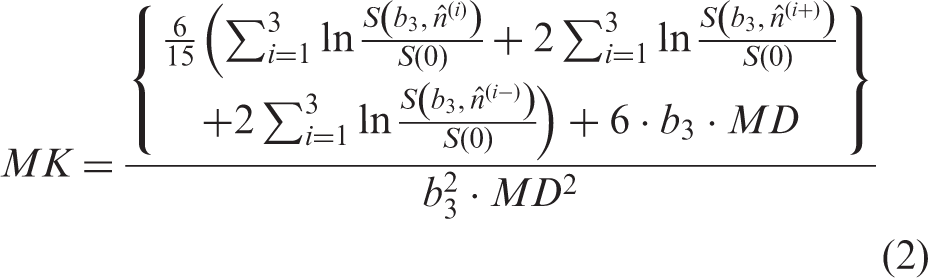
MRI images were processed in Matlab (Mathworks, Framingham, MA). Specifically, for the fast DKI, mean diffusivity (MD) was calculated as the mean of MDx,y,z derived from the formula proposed by Jensen et al.
19
:
In addition, parametric T1 map was obtained with least squares fitting of the signal as a function of the inversion time (
For kurtosis lesion segmentation, we generalized the ICON analysis by including both magnetization transfer (MT) and T1 images.
30
Briefly, pixel-wised MK, T1 and mean magnetization transfer ratio (MMTR) indices from the contralateral normal brain, excluding ventricles, was correlated using Pearson’s correlation. An estimated MK map (MKest) was calculated per pixel (i.e. MKest =C0 + C1*R1 + C2*MMTR + C3*R1*MMTR), where Cs are coefficients determined from the intact normal brain. The difference between the experimentally measured MK and that estimated from regression analysis assuming no ischemia was calculated ΔMRMK = MK-MKest. The diffusion and kurtosis (i.e. ICON-MK) lesions were determined using a K-means clustering-based algorithm.
30
Note that we defined kurtosis lesion as kurtosis abnormality, similar as the commonly used perfusion and diffusion lesions. Contrast to noise ratio (CNR) between striatum and cortex regions was calculated as
Results
Multiparametric images from a representative normal rat are shown in Figure 1. Specifically, Figure 1(a) and (b) shows R2 (1/T2) and R1 (1/T1) images, respectively. In addition, ΔCBF (Figure 1(c)) map shows no noticeable hypoperfusion, as expected. MD map (Figure 1(d)) was reasonably homogeneous within the brain while MK image (Figure 1(e)) shows noticeable heterogeneity between the white matter (e.g. striatum) and gray matter (e.g. cortex, 0.79 ± 0.05 vs. 0.63 ± 0.04, P < 0.01). We assessed the image heterogeneity using the CNR between striatum and cortex regions. The CNR for MD and MK images was 0.57 ± 0.17 and 2.37 ± 0.49, respectively. The high CNR from the MK image suggested substantial intrinsic heterogeneity in the intact brain tissue. We found significant correlation between MK and R1 (Figure 1(b)) and MMTR (Figure 1(f)), per pixel (Figure 1(g), R2 = 0.60 ± 0.09, P < 0.01). Indeed, the difference between the experimentally measured MK image and that estimated assuming no ischemia insult (Figure 1(h), ΔMRMK =MK-MKest) is substantially more homogeneous than the raw MK image. The ICON analysis significantly reduced the kurtosis CNR between striatum and cortex from 2.37 ± 0.49 (MK) to 0.39 ± 0.16 (P < 0.01), without a significant difference from that of MD (P > 0.10). Therefore, both MD and ΔMRMK images have CNR well under 1, suggesting that their regional signal variations in the intact brain tissue are within their respective noise level, rendering their change specific to ischemic tissue (Table 1).
Illustration of magnetization transfer and relaxation-normalized kurtosis image. (a) R2 image, (b) R1 image, (c) ΔCBF image, (d) MD image, (e) experimentally measured MK image, (f) MMTR image, (g) regression between MK and MMTR and R1, and (h) the ΔMRMK map that is of reduced intrinsic MK heterogeneity not related to acute ischemia. Magnetization transfer and relaxation normalized MK map reduces intrinsic heterogeneity between intact brain WM and GM.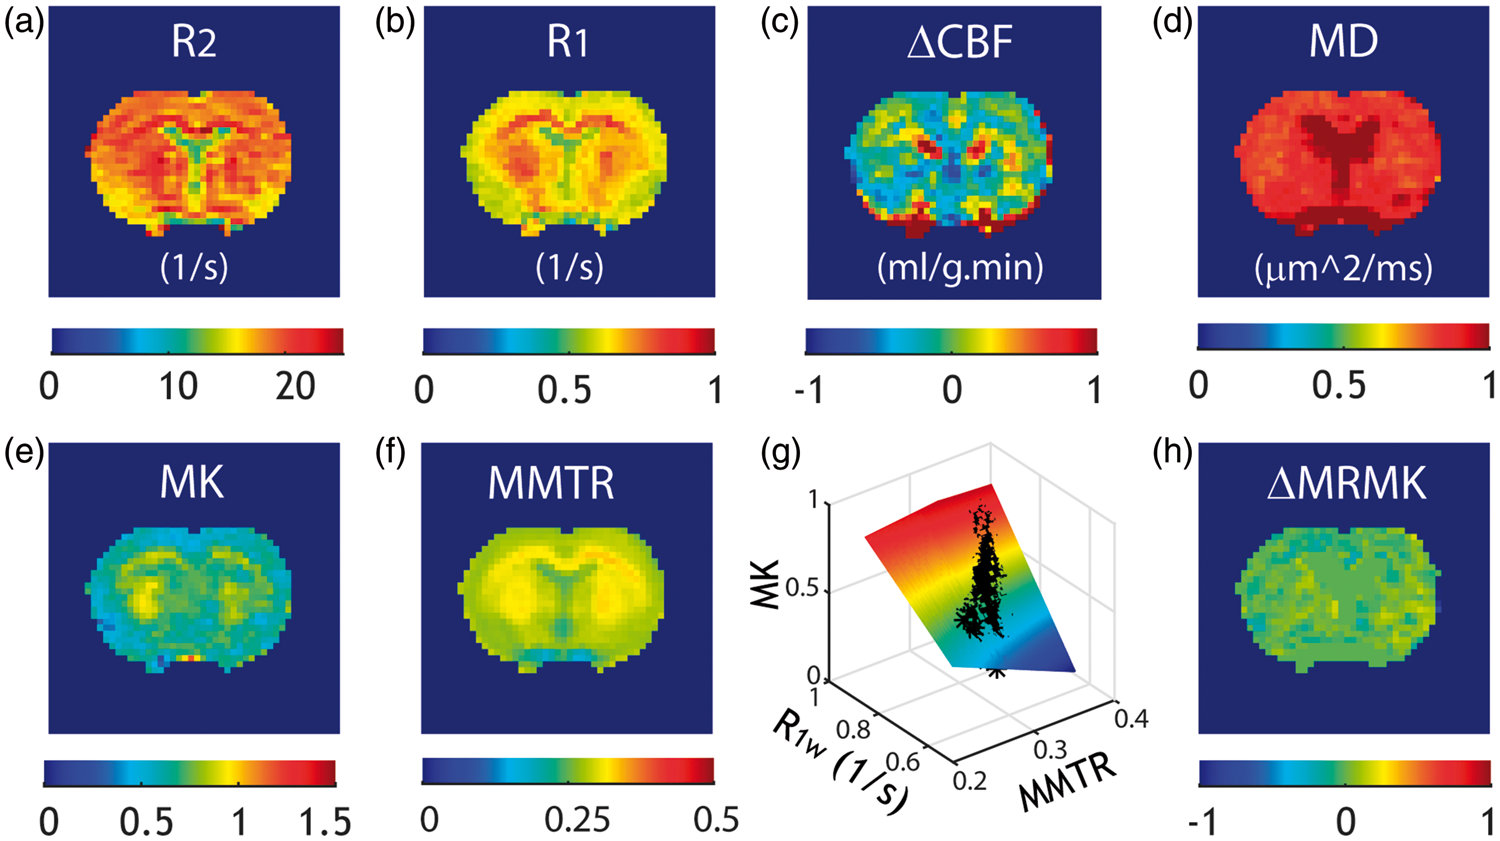
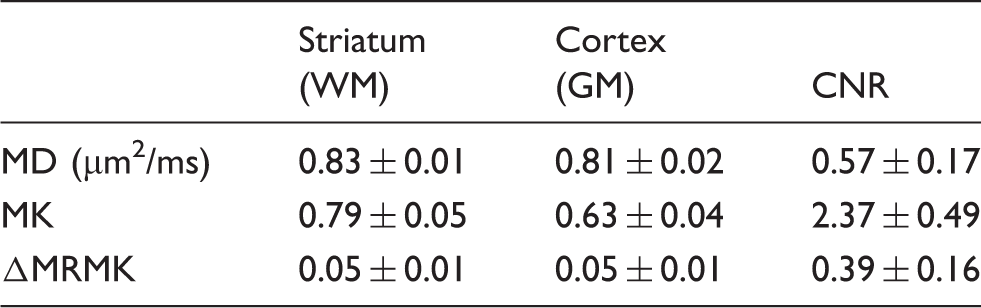
Figure 2 shows R2 (Figure 2(a)) and R1 (Figure 2(b)) maps from a representative acute stroke rat, displaying only small changes. Notably, ΔCBF (Figure 2(c)) and MD (Figure 2(d)) maps showed ipsilateral hypoperfusion and diffusion lesion, showing severe ischemia, with MK and ΔMRMK images shown in Figure 2(e) and (f), respectively. Whereas MD image presents significant diffusion lesion in the ischemic brain, the ipsilateral lateral cortex, interestingly, appeared to have relatively little kurtosis elevation when compared to that of the striatum. Both diffusion and kurtosis (ΔMRMK) lesions were semiautomatically segmented and overlaid on a DWI image (b = 1000 s/mm2), with kurtosis lesion shown in black, and kurtosis/diffusion lesion mismatch shown in pink (Figure 2(g)). Over all animals, the kurtosis lesion and diffusion lesion volume were 122.3 ± 47.4 mm3 and 153.4 ± 64.1 mm3, respectively (P < 0.01, paired t-test). The kurtosis/diffusion lesion mismatch was 19.7 ± 10.7% of the DWI lesion volume (P < 0.01, two-tailed one sample t-test). Importantly, tissue pH map (Figure 2(h)) revealed that the kurtosis/diffusion lesion mismatch had less pH drop when compared to that of the kurtosis lesion.
Multiparametric MRI from a representative MCAO rat. (a) R2 image, (b) R1 image, (c) ΔCBF image, (d) MD image, (e) experimentally measured MK image, (f) ΔMRMK image, (g) kurtosis/diffusion lesion mismatch overlaid on a DWI image (b = 1000 s/mm2), and (h) pH image.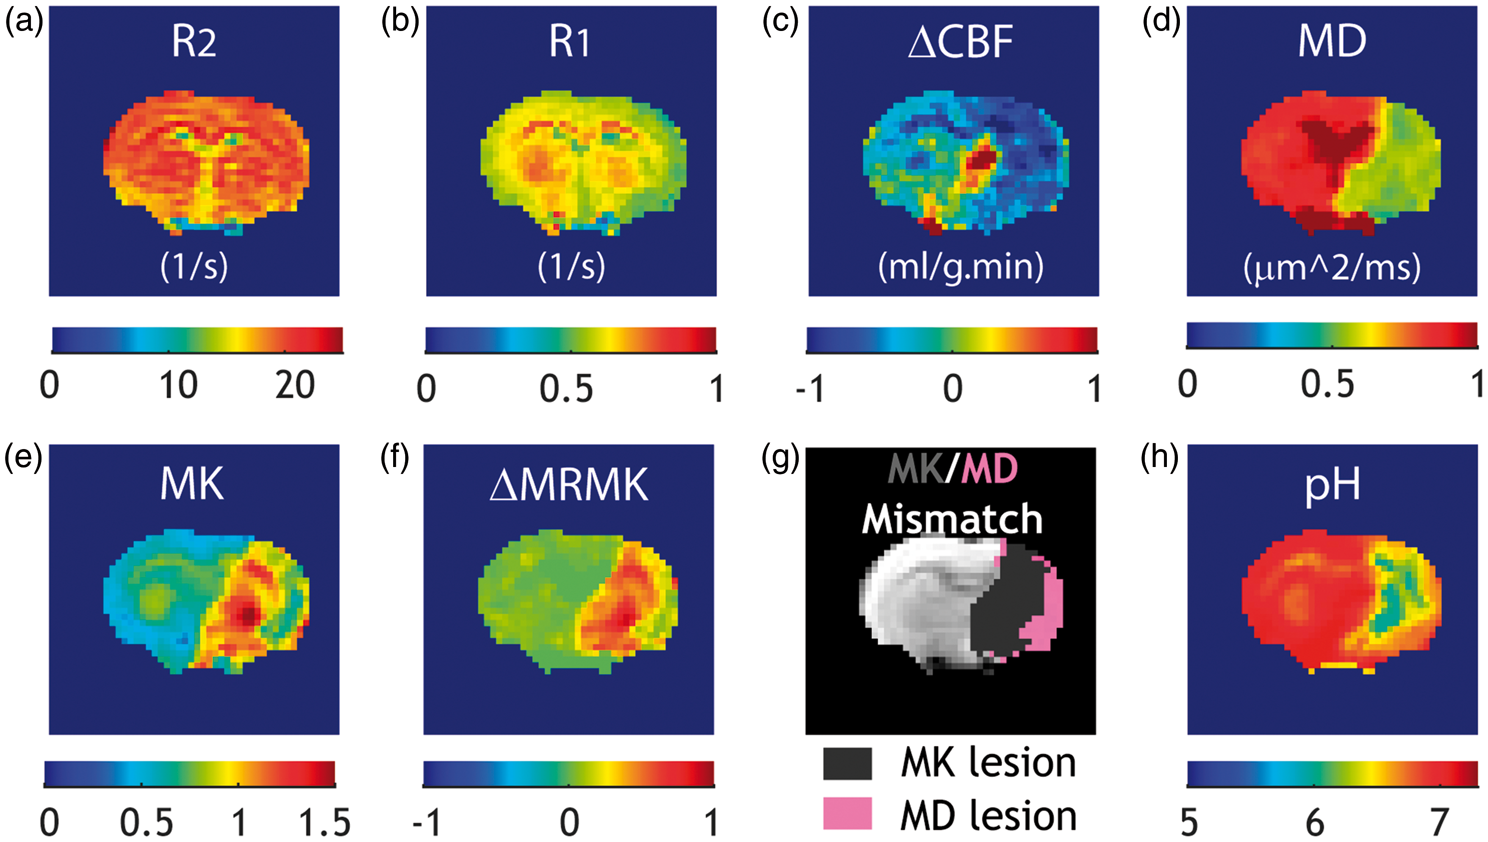
Multi-parametric MRI indexes for the normal, diffusion lesion, kurtosis lesion, and their mismatch.
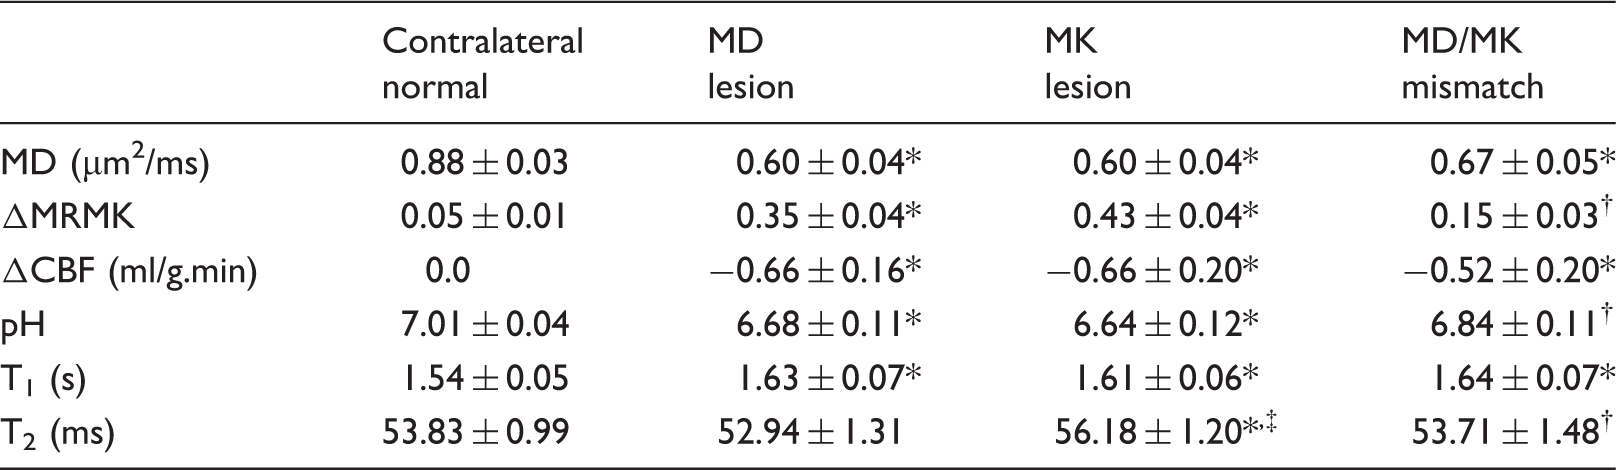
Kruskal–Wallis test with Dunns posttest analyses were performed with *P < 0.05 indicating significant difference between contralateral normal and lesion regions, †P < 0.05 indicating significant difference between MK lesion and MD/MK lesion mismatch, ‡P < 0.05 indicating significant difference between MD lesion and MK lesion or MD/MK lesion mismatch, respectively.
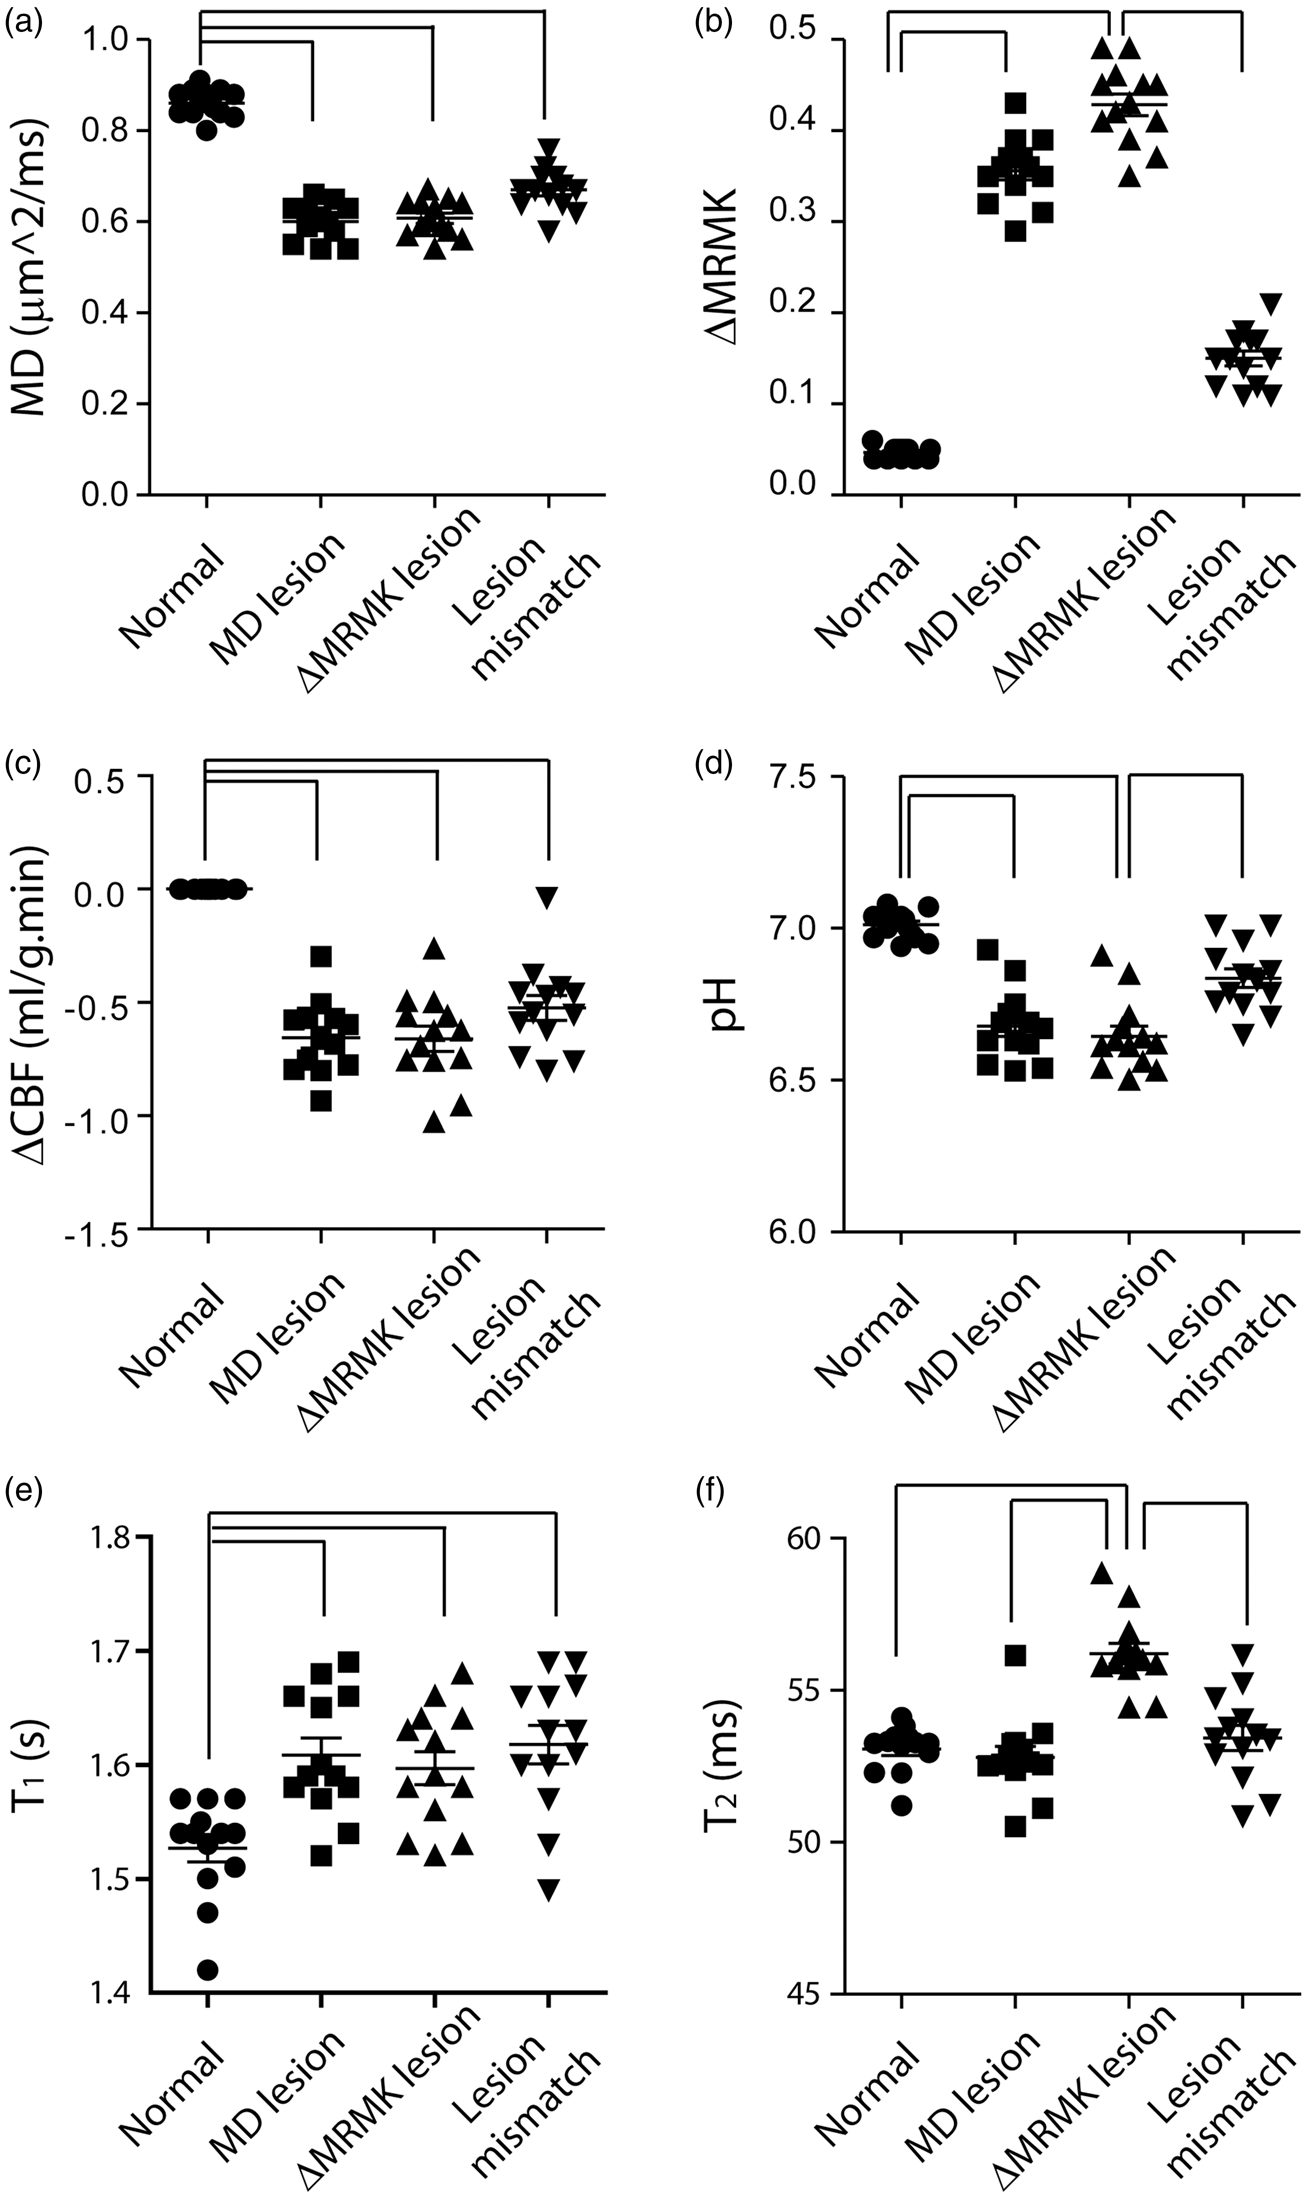
Regional analysis of multi-parametric MRI of the normal region, diffusion lesion, kurtosis lesion, and kurtosis/diffusion lesion mismatch. (a) MD, (b) ΔMRMK, (c) ΔCBF, (d) pH, (e) T1, and (f) T2.
Discussion
Our study documented significant pH difference between the kurtosis lesion and kurtosis/diffusion lesion mismatch, providing converging evidence that the commonly used and heterogeneous DWI lesion can be delineated based on emerging pH and DKI stroke MRI. It is noteworthy to mention that Peek et al. used double autoradiographic imaging and reported that penumbral tissue has significantly elevated rate of glucose consumption and higher pH (6.87 ± 0.05) from the infarction core, which has lower pH (6.69 ± 0.11, P < 0.05) and reduced glucose metabolism. 32 Our study found pH in the kurtosis lesion and kurtosis/diffusion mismatch in good agreement with those determined by Peek et al., suggesting that kurtosis lesion is more specific to infarction core while the kurtosis/diffusion mismatch belongs to penumbra.
It is important to point out that both perfusion and diffusion methods provide incomplete tissue classification; PWI lesion overestimates the outer boundary of penumbra by including benign oligemia, while the DWI lesion underestimates the inner boundary of penumbra as part of the DWI lesion is reversible.15,33 As such, our study focused on refining the commonly used diffusion lesion, and additional study is needed to improve perfusion imaging for penumbral tissue stratification. Specifically, the commonly used ADC analysis assumes that water molecules follow a Gaussian displacement profile, which, strictly speaking, applies only to the case of unrestricted diffusion. DKI addresses this limitation by quantifying not only diffusion rate but also the degree of deviation from the Gaussian diffusion. Although the kurtosis/diffusion mismatch region showed a trend of higher perfusion level from that of the kurtosis lesion, their difference, unlike pH, was not statistically significant. This is because CBF is dynamic and under the influence of physiological conditions such as blood pressure and blood oxygenation saturation. In addition, the brain white matter and gray matter have slightly different CBF baselines. In comparison, tissue pH is reasonably stable and uniform under normal physiological conditions, making it a specific biomarker to characterize the regional tissue metabolic derangement.
23
Worth mentioning is that DKI and pH MRI results corroborate each other, substantiating the postulation that kurtosis lesion suffers worsened structural and metabolic injury than the kurtosis/diffusion lesion mismatch.
22
The kurtosis/diffusion lesion mismatch, despite its DWI hyperintensity, experiences mild acidosis with pH in line with that of penumbra tissue.
32
Altogether, DKI is promising to augment the perfusion/diffusion mismatch for improved mapping of ischemic penumbra; the infarction core is better defined using the kurtosis lesion and the penumbra extends into DWI lesion by including the kurtosis/diffusion lesion mismatch (Figure 4). As such, the use of stroke DKI is promising to avoid overestimation of the infarction core volume, which is crucial as the recanalization window is likely to be extended with more effective endovascular devices.
DKI-aided ischemic lesion classification. (a) Routine perfusion/diffusion MRI-based tissue stratification. (b) Kurtosis MRI refines diffusion lesion mismatch into two areas: (Ia) infarction core captured by kurtosis lesion and (Ib) Viable DWI lesion captured by kurtosis/diffusion lesion mismatch.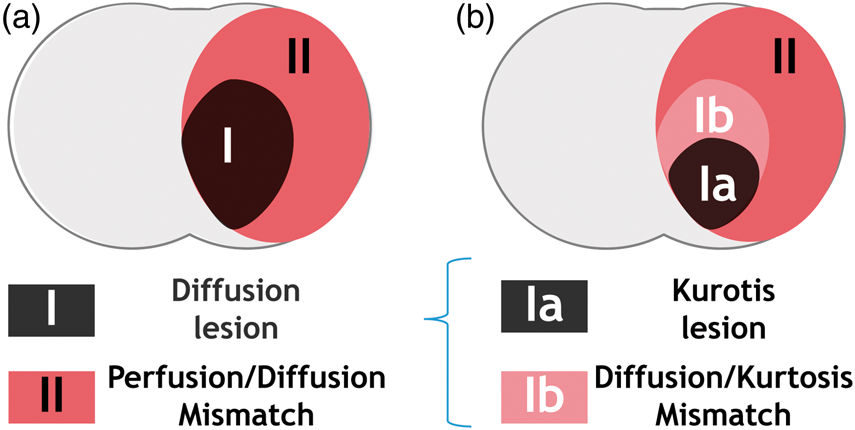
Although it is plausible that ischemic lesion may continue to evolve during the imaging, it is likely that the initial tissue damage happens fast following filament MCAO due to its nature of severe hypoperfusion while the tissue injury stabilizes hours post-MCAO. For example, Hui et al. showed that MD, MK, and CBF lesions were stable 1–2 h after MCAO. 34 It has also been shown that pH-weighted MRI lesion remains stable for a few hours after MCAO. 25 In addition, both MD and MK were derived from the same fast DKI sequence, ensuring the same ischemia insult duration for these two indices. It is necessary to point out that the fast DKI approach proposed by Hansen et al. directly calculates MD and MK without resorting to the tensor-model based fitting. 31 It has been shown that fast DKI and the routine tensor-based approaches provide highly correlated measurements in normal and MCAO rats. 35 Because the fast DKI also provides higher CNR between the intact and ischemic tissue than the tensor-model based fitting approach, it is suitable for acute stroke imaging. 36
Our study aims to understand the diffusion/kurtosis mismatch with multi-parametric MRI, an incremental albeit important step to improve the widely used diffusion MRI. Because pH drop induces sodium and subsequently calcium overload in the acidic tissue, causing cell injury, there may be further heterogeneity even within the kurtosis lesion.37,38 It is necessary to note that it becomes increasingly challenging to investigate finer mismatch regions, from perfusion/diffusion mismatch, diffusion/kurtosis mismatch to possibly kurtosis/pH mismatch, and future experiments are needed to determine the spatiotemporal course of multi-parametric MRI. To our best knowledge, this is the first study to investigate the metabolic state of acute stroke DKI, which provides initial evidence that DKI refines the heterogeneous DWI lesion. Although DWI lesion reversibility is not uncommon with early reperfusion, DWI lesion often proceeds to infarction without recanalization. Because the commonly used staining techniques (e.g. hematoxylin–eosin and 2,3,5-triphenyltetrazolium chloride) are not sensitive to hyperacute ischemic tissue damage, our study used multiparametric MRI to investigate the tissue heterogeneity. It is important to point out that tissue glucose metabolic status can be assessed with autoradiographic imaging.32,39,40 A comprehensive study that combines advanced immunohistology and novel MRI can strengthen the mechanistic understanding of acute kurtosis lesion injury to fully substantiate the refined ischemic penumbra imaging. In addition, it is necessary to evaluate advanced imaging-guided stroke treatment to test the evolution and salvageability of MRI-defined penumbra.
Footnotes
Funding
The author(s) disclosed receipt of the following financial support for the research, authorship, and/or publication of this article: NSFC (81571668 to Wu), SSTP (GJHZ20160229200622417 and JCYJ20170307165550864 to Wu), and NIH (R21NS085574 and R01NS083654 to Sun).
Acknowledgements
The authors would like to thank Gary Boas for proofreading the manuscript.
Declaration of conflicting interests
The author(s) declared no potential conflicts of interest with respect to the research, authorship, and/or publication of this article.
Authors’ contributions
Drs. Wang and Wu conducted data analysis, Drs. Wang and Igarashi contributed to animal stroke model, Drs. Cheung and Zhou collected MRI data, Drs. Zhang and Sun designed the study, drafted and revised the manuscript. All authors approved the draft.