
Abstract
Recently, we discovered a new role for the well-known axonal growth inhibitory molecule Nogo-A as a negative regulator of angiogenesis in the developing central nervous system. However, how Nogo-A affected the three-dimensional (3D) central nervous system (CNS) vascular network architecture remained unknown. Here, using vascular corrosion casting, hierarchical, synchrotron radiation μCT-based network imaging and computer-aided network analysis, we found that genetic ablation of Nogo-A significantly increased the three-dimensional vascular volume fraction in the postnatal day 10 (P10) mouse brain. More detailed analysis of the cerebral cortex revealed that this effect was mainly due to an increased number of capillaries and capillary branchpoints. Interestingly, other vascular parameters such as vessel diameter, -length, -tortuosity, and -volume were comparable between both genotypes for non-capillary vessels and capillaries. Taken together, our three-dimensional data showing more vessel segments and branchpoints at unchanged vessel morphology suggest that stimulated angiogenesis upon Nogo-A gene deletion results in the insertion of complete capillary micro-networks and not just single vessels into existing vascular networks. These findings significantly enhance our understanding of how angiogenesis, vascular remodeling, and three-dimensional vessel network architecture are regulated during central nervous system development. Nogo-A may therefore be a potential novel target for angiogenesis-dependent central nervous system pathologies such as brain tumors or stroke.
Keywords
Introduction
Sprouting angiogenesis, the process of formation of new blood vessels from pre-existing ones,1–4 is the predominant vascularization mechanism during central nervous system (CNS) development and in many CNS pathologies.4,5 During mouse brain development, vascularization of the CNS occurs in different steps: First, at embryonic day 7.5–8.5 (E7.5–E8.5), the perineural vascular plexus in the future meninges forms via vasculogenesis in the ventral region of the neural tube.5,6 Then, at E9.5, sprouting angiogenesis from the perineural vascular plexus into the CNS tissue takes place. After formation of the large penetrating vessels, extensive vessel sprouting, branching, and arborization occur throughout embryogenesis5,6 and continue during postnatal CNS development.3,4,7 Vascular remodeling further expands and refines the complex 3D vascular network of the CNS in order to adapt to local metabolic needs and neural activity.3,4,8–10 The most important currently known molecular factors regulating the complex processes of CNS angiogenesis and vascular network generation are the ligand–receptor pairs VEGF-VEGFR, bFGF-bFGFR, Dll4-Notch, and Angiopoieitin-Tie, as well as protein members of the TGF–β superfamily, the orphan receptor GPR124, Wnt family members, and DR6/TROY death receptors.4,5,11–13 Interestingly, classical axonal guidance molecules such as Netrins, Semaphorins, Slits, and Ephrins have been shown recently to not only influence growing neurons but also growing blood vessel.4,14 Accordingly, the terms “neurovascular link” to describe the common principles of nerve and blood vessel growth as well as “angioneurins” to describe molecules regulating both systems have been introduced.4,5 Whereas the effects of most of these axonal guidance molecules on angiogenesis and vascular patterning have been described outside the CNS and in the retina, only very little is known on whether these “angioneurins” affect postnatal brain angiogenesis and vascular network formation.4,5
Nogo-A is a high molecular weight membrane protein with important inhibitory functions for neurite growth in the adult CNS, where it limits the regeneration of neurons after spinal cord injury or stroke and dampens synaptic plasticity.15,16 In addition, Nogo-A acts as a repulsive axonal guidance molecule during development of the CNS as well as of the peripheral nervous system. 16 Recently, we have identified an additional function of Nogo-A as a negative regulator of postnatal CNS angiogenesis in vivo and in vitro, 9 thereby identifying this molecule as an “angioneurin.” During mouse postnatal brain and retina development, Nogo-A genetic deletion or antibody-mediated neutralization lead to higher vessel densities. 9 Nogo-A restricted the number of endothelial tip cells in vivo as well as spreading, migration, sprouting, and lamellipodia and filopodia movement of cultured brain endothelial cells in vitro. 9 These findings revealed an effect of Nogo-A on sprouting angiogenesis and endothelial cell migration in the postnatal mouse brain. However, it remained unclear how Nogo-A is involved in shaping the 3D architecture of the developing vascular network.
In the present study, we employed vascular corrosion casting, high-resolution hierarchical imaging and computational vascular network analysis to reveal effects of Nogo-A on the 3D vascular network at different vessel calibers in the postnatal mouse brain at day 10 (P10). Our results demonstrate that genetic ablation of Nogo-A increases the perfused vascular volume fraction and decreases mean extravascular distance in different brain regions of the P10 mouse, mainly due to an increase in the number of capillaries paralleled by a higher number of vascular branchpoints. Interestingly, vessel segment diameter, -length -tortuosity, and -volume for both capillaries and non-capillary vessels were unaffected by Nogo-A gene deletion. Thus, Nogo-A not only limits capillary vessel sprouting and branching but also the formation of perfused micro-networks in the postnatal mouse brain.
Moreover, this combination of parameters (more capillary segments with unchanged capillary morphology including unchanged capillary length) speaks against a simple insertion of additional capillaries into the pre-existing vessel network but rather for additional capillary micro-networks interlaced into pre-existing ones as the final stable result of angiogenesis and subsequent vascular remodeling. Taken together, our results provide evidence for a mechanism of angiogenesis and subsequent vascular remodeling that results in capillary micro-network insertion into the mouse brain vasculature, similar to what we previously observed. 17
Methods
Mice
We used P10 wild-type (WT) and Nogo-A−/− C57BL/6 mice 18 of both genders. Due to the redundancy of mechanisms acting on the vascular system, effects on angiogenesis and on the vasculature that are observed in different KO mice during (embryonic or postnatal) development are often compensated at the adult stage. This is also the case for the Nogo-A−/− mouse, which displays hypervascularization during postnatal development, effects that are strongly attenuated in the adult. 9 Moreover, Nogo-A−/− animals do not show neither gross anatomical changes nor major phenotypes in the adulthood and are entirely viable and fertile. 18 Thus, we chose P10 animals to address the vascular network in WT and Nogo-A−/− mice. All animal experiments were performed in accordance with governmental, institutional (University of Zurich), and ARRIVE guidelines and had been approved by the Cantonal Veterinary Department of Zurich (license number 173/2010).
Vascular corrosion casts
P10 mice were anesthetized with 100 mg/kg pentobarbital intraperitoneally and perfused through the left ventricle with 10–20 ml artificial cerebrospinal fluid containing 25,000 U/L Heparin, followed by 4% paraformaldehyde in phosphate buffered saline, and then by the polymer resin PU4ii (vasQtec, Zürich, Switzerland), both infused at the same rate (4 ml/min and 110 mmHg). 19 After resin curing, tissue was macerated in 7.5% potassium hydroxide followed by decalcification of surrounding bone structures with 5% formic acid. The cerebral vasculature was dissected from the remaining extra-cranial vessels. The cerebral vascular corrosion casts were washed in distilled water and dried by lyophilization. For routine scanning electron microscopy (SEM; Hitachi S4000) imaging, the casts were mounted on stubs and sputter-coated with gold.20,21 Alternatively, for synchrotron-radiation based micro computed tomographic (SRμCT) imaging, another set of vascular corrosion casts was stained using osmium tetroxide. 17 Casts were then mounted using cyano-acrylat glue on custom made plexiglas stubs equipped with stainless steel pins for sample repositioning in the μCT. 22
Scanning electron microscopy
Imaging casts were evaluated by light microscopy, and then prepared for SEM by sputtering with gold.20,21
Desktop μCT imaging and region of interest selection
Three-dimensional images of whole brain samples were acquired using a desktop μCT system (μCT 40, Scanco Medical AG) operated at 50 kVp and 160 mA with a nominal isotropic voxel size of 16 μm. 22 Per scan, 1000 projection images were acquired with an integration time of 200 ms and additional three times frame averaging for improved signal-to-noise ratio. 22 Tomographic images were reconstructed, segmented, and imported into custom-made region of interest (ROI) picker software. 17 One to three ROIs of 1 mm3 per animal and brain region were placed in the cerebral cortex, hippocampus, superior colliculus, and brain stem. Relative coordinates of ROIs with respect to the two sample holder pins were calculated and saved for subsequent re-orientation and measurement at the synchrotron beamline.
High-resolution SRμCT imaging
High-resolution 3D images of selected ROIs were acquired at the X-Ray Tomographic Microscopy Station of the Materials Science beamline at the Swiss Light Source of the Paul Scherrer Institute using a previously described local tomography setup.17,22 Briefly, the system was operated at 17.5 keV with a sample-detector distance of 30 mm for distinct edge enhancement and an optical magnification resulting in isotropic voxels of nominal 0.73 μm. Each measurement included 1001 projections acquired at an integration time of 2 s each. Data were reconstructed using a filtered back projection procedure. Due to relatively low signal-to-noise ratio and edge enhancement, a more detailed segmentation as compared to the desktop μCT data was necessary, requiring two Gaussian filtration and segmentation passes on full and down-sampled image resolution, as well as component labeling in order to eliminate small pieces of noise. The net volume of the final images was 716 × 716 × 856 voxels, corresponding to 1.2 mm3 of tissue volume.
Computational reconstruction of the 3D vascular network – vessel segmentation
To analyze and characterize the 3D vascular network computationally, the reconstructed SRμCT imaging data needed to be processed first. We used a customized Insight Segmentation and Registration Toolkit (ITK; http://www.itk.org) and Visualization Toolkit (VTK; http://www.vtk.org) image processing pipeline to extract the vessel segmentation map and to derive a corresponding vessel network topology. Briefly, after initial application of anisotropic diffusion filtering 23 for noise reduction while preserving sharp edges vascular structures were separated from background using a machine-learning framework for 3D vessel segmentation. 24 This approach uses multiscale steerable filter templates to extract highly discriminative image features that are invariant with respect to the local vessel direction. These image features were computed on different scales (0.97 μm, 1.94 μm, and 3.88 μm) to account for the multiscale nature of blood vessels. 24 The samples were then cropped to 97% of its initial sizes to handle segmentation artifacts close to the sample boundaries. Next, a spherical structuring element (radius 3 μm) was used in order to morphologically close small gaps between vessel branches and connected component labeling and to remove isolated noise volumes with less than 54 voxels. The result of this post-processing step was the final vessel segmentation map which was used to analyze the global morphometry as well as the local topology of the vascular network (see below).
Computational reconstruction of the 3D vascular network – global vascular network morphometry
Global morphometry allows to quantify properties of each dataset without considering the form- and shape-properties of individual vascular structures. This allows for an overview and more abstract quantification of the data. In contrast, the local vascular network topology allows to quantify the form and shape of the vascular network by analyzing each individual vascular structure. The properties of each individual vascular structure within the dataset then influence the quantification and analysis.
Computational reconstruction of the 3D vascular network – local vascular network topology
To get deeper insight into the 3D vascular network architecture, certain properties of each individual vessel structure were determined. Therefore, every individual vessel had to be identified, extracted, and interconnected into the vascular network. This was done in four different steps: Step 1: Skeletonization: distance-ordered homotopic thinning was utilized. 25 The algorithm peels off vessel-surface voxels until the vessel is thinned down to a width of one voxel, defining the centerline. Step 2: Graph extraction: a graph-node was placed at each voxel along the previously calculated centerline. Consecutive nodes were connected with an edge, representing a rigid tube of fixed length and diameter. Assuming local cylindrical symmetry of vessels, the radius of the vessel lumen at each node was estimated as the radius of the maximal inscribed sphere. This cylindrical radius was assigned to the edge. A vessel segment was then modeled as a sequence of consecutive piecewise linear edges between two bifurcations. Step 3: Artifact removal: In noisy boundary areas, short incomplete vessel segments were found that resulted from the ill-conditioned nature of morphological thinning. To detect and remove these spurious sprouts, two simple geometric heuristics were applied: (1) vessel segments with one free end, shorter than twice the radius of the proximal bifurcation; (2) isolated sprouts with two free ends if the ratio of segment length and vessel radius was less than two. Step 4: Graph smoothing: The discrete, voxel-accurate vessel centerlines were smoothened using spline smoothing. A constant radius was finally assigned to each segment such that the cylindrical volume equaled the summed up cylindrical volume of all single edges. The result of the smoothing step was the vascular network graph which was used to analyze the local characteristics of the vessel network (= local vascular network topology).
Global morphometry and local topological vascular network analysis
Global morphometry and local topological vascular network analysis were performed for each high-resolution image in collaboration with Nemtics (http://www.nemtics.com/) and in accordance to our previous work. 17 Global morphometry analysis is based on the vessel segmentation map and considers the characteristics of the vascular structure on a per-voxel level. Global morphometry analysis of the 3D vascular network allows to assess the vascular parameters vascular volume fraction (=vessel volume per tissue volume), vessel/segment density, and branchpoint density. Therefore, a radial crop of each sample of 95% to avoid boundary artifacts introduced during the postprocessing step of the vessel segmentation map was applied. In contrast to global morphometry analysis, local topological analysis of the 3D vascular network allows to characterize individual per-vessel parameters like vessel/segment diameter, length, tortuosity, and branchpoint degree. Additionally, local topological analysis allowed to differentiate between capillary and non-capillary vessels of the highly interwoven hierarchical 3D vessel/capillary network. 26 Therefore, we applied a series of further processing steps to the sample’s vessel network graph. First, we cropped the sample radially at 50% and 75% in height. The cut sample was then recursively processed to remove all segments shorter than 2 μm. This process effectively removed clusters of branchpoints as a resulting artifact of skeletonization and graph extraction. We classified the resulting vessels as capillary if its average inner diameter was less than 7 μm and as non-capillary vessel if its average inner diameter was equal to or more than 7 μm. 27 Branchpoints are junctions between at least three vessel segments where the number of vessel segments joining in one branchpoint is called branchpoint degree (which equals at least 3). We defined the branchpoint diameter as the diameter of the thickest joining segment, hence allowing the discrimination between capillary and non-capillary branchpoints. The branchpoint density per volume was defined as the number of branchpoints per cubic millimeter.
With regard to the different vascular parameters, we adopted for reasons of simplicity the following nomenclature: The parameters “vessel diameter,” “vessel length,” “vessel tortuosity,” and “vessel volume” instead of “vessel segment diameter,” “vessel segment length,” “vessel segment tortuosity,” and “vessel segment volume” to describe the average diameter/length/tortuosity/volume of the vessel segments in the two genotypes throughout the manuscript as well as in the figures and in the figure legends.
Statistical analysis
The mean of the parameters obtained from the WT was compared with those from Nogo-A−/− mice using the Welch t-test. Statistical significant differences were assumed at P-values below 0.05. Detailed statistical values (exact P-values and bin-widths/number of bins for the histograms) are indicated in the corresponding figure legends. In the figures, all data are shown as box-plots with whiskers spanning at most 1.5 times the inter-quartile-range (IQR = height of the boxes) above and below the 25% and 75% quartiles. Whiskers are drawn at the highest/lowest data value if it is inside the 1.5 IQR. An open dot represents the mean. The horizontal line represents the median. The boxplots comply to the standard in the study of Tukey.
28
Of note, in the majority of the diagrams, the 1.5 IQR whiskers cover the entire data-range, which underlines the relatively low variance in the data. Both, statistical testing and figure plotting were performed with Scipy (http://www.scipy.org). For all quantitative analysis in the cortex (Figures 1 to 5, Supplementary Figures S3 to S5), we used 5 P10 WT and 7 P10 Nogo-A−/− animals. For all quantitative analysis involving other brain regions (cortex, hippocampus, superior colliculus, brain stem) (Figure 6), we used three to six P10 WT and four to seven P10 Nogo-A−/− animals. In average, we have analyzed about two ROIs per animal and brain region.
Genetic deletion of Nogo-A leads to increased vascular volume fraction in various regions of the postnatal mouse brain. (a, b) SEM images of cortical blood vessels in P10 WT (a) and P10 Nogo-A−/− mice (b) are displayed. Mice lacking functional Nogo-A showed a higher density of cortical blood vessels than the control animals (a). The boxed areas are enlarged below. (c, d) Computational 3D reconstructions of µCT scans of cortical vascular networks of P10 WT and a P10 Nogo-A−/− displayed with color-coded vessel thickness. The increased vessel density in the Nogo-A−/− cortices is obvious. Color bar indicates vessel radius. The boxed areas are enlarged at right. (e–h) Quantification of the 3D vascular volume fraction in P10 cortex (e), hippocampus (f), superior colliculus (g), and brainstem (h) by computational analysis using global morphometry. The vascular volume fraction in all these brain structures was significantly higher in the Nogo-A-deficient animals than that in the WT control animals (n = 3–6 for P10 WT; n = 4–7 for P10 Nogo-A−/− animals; and in average two ROIs per animal and brain region). All data are shown as mean distributions, where the open dot represents the mean. Boxplots indicate the 25% to 75% quartiles of the data. *P < 0.05, **P < 0.01, ***P < 0.001. Scale bars: 100 µm (a, b, overview); 50 µm (a, b, zoom); 100 µm (c, d, overview); 50 µm (c, d, zoom).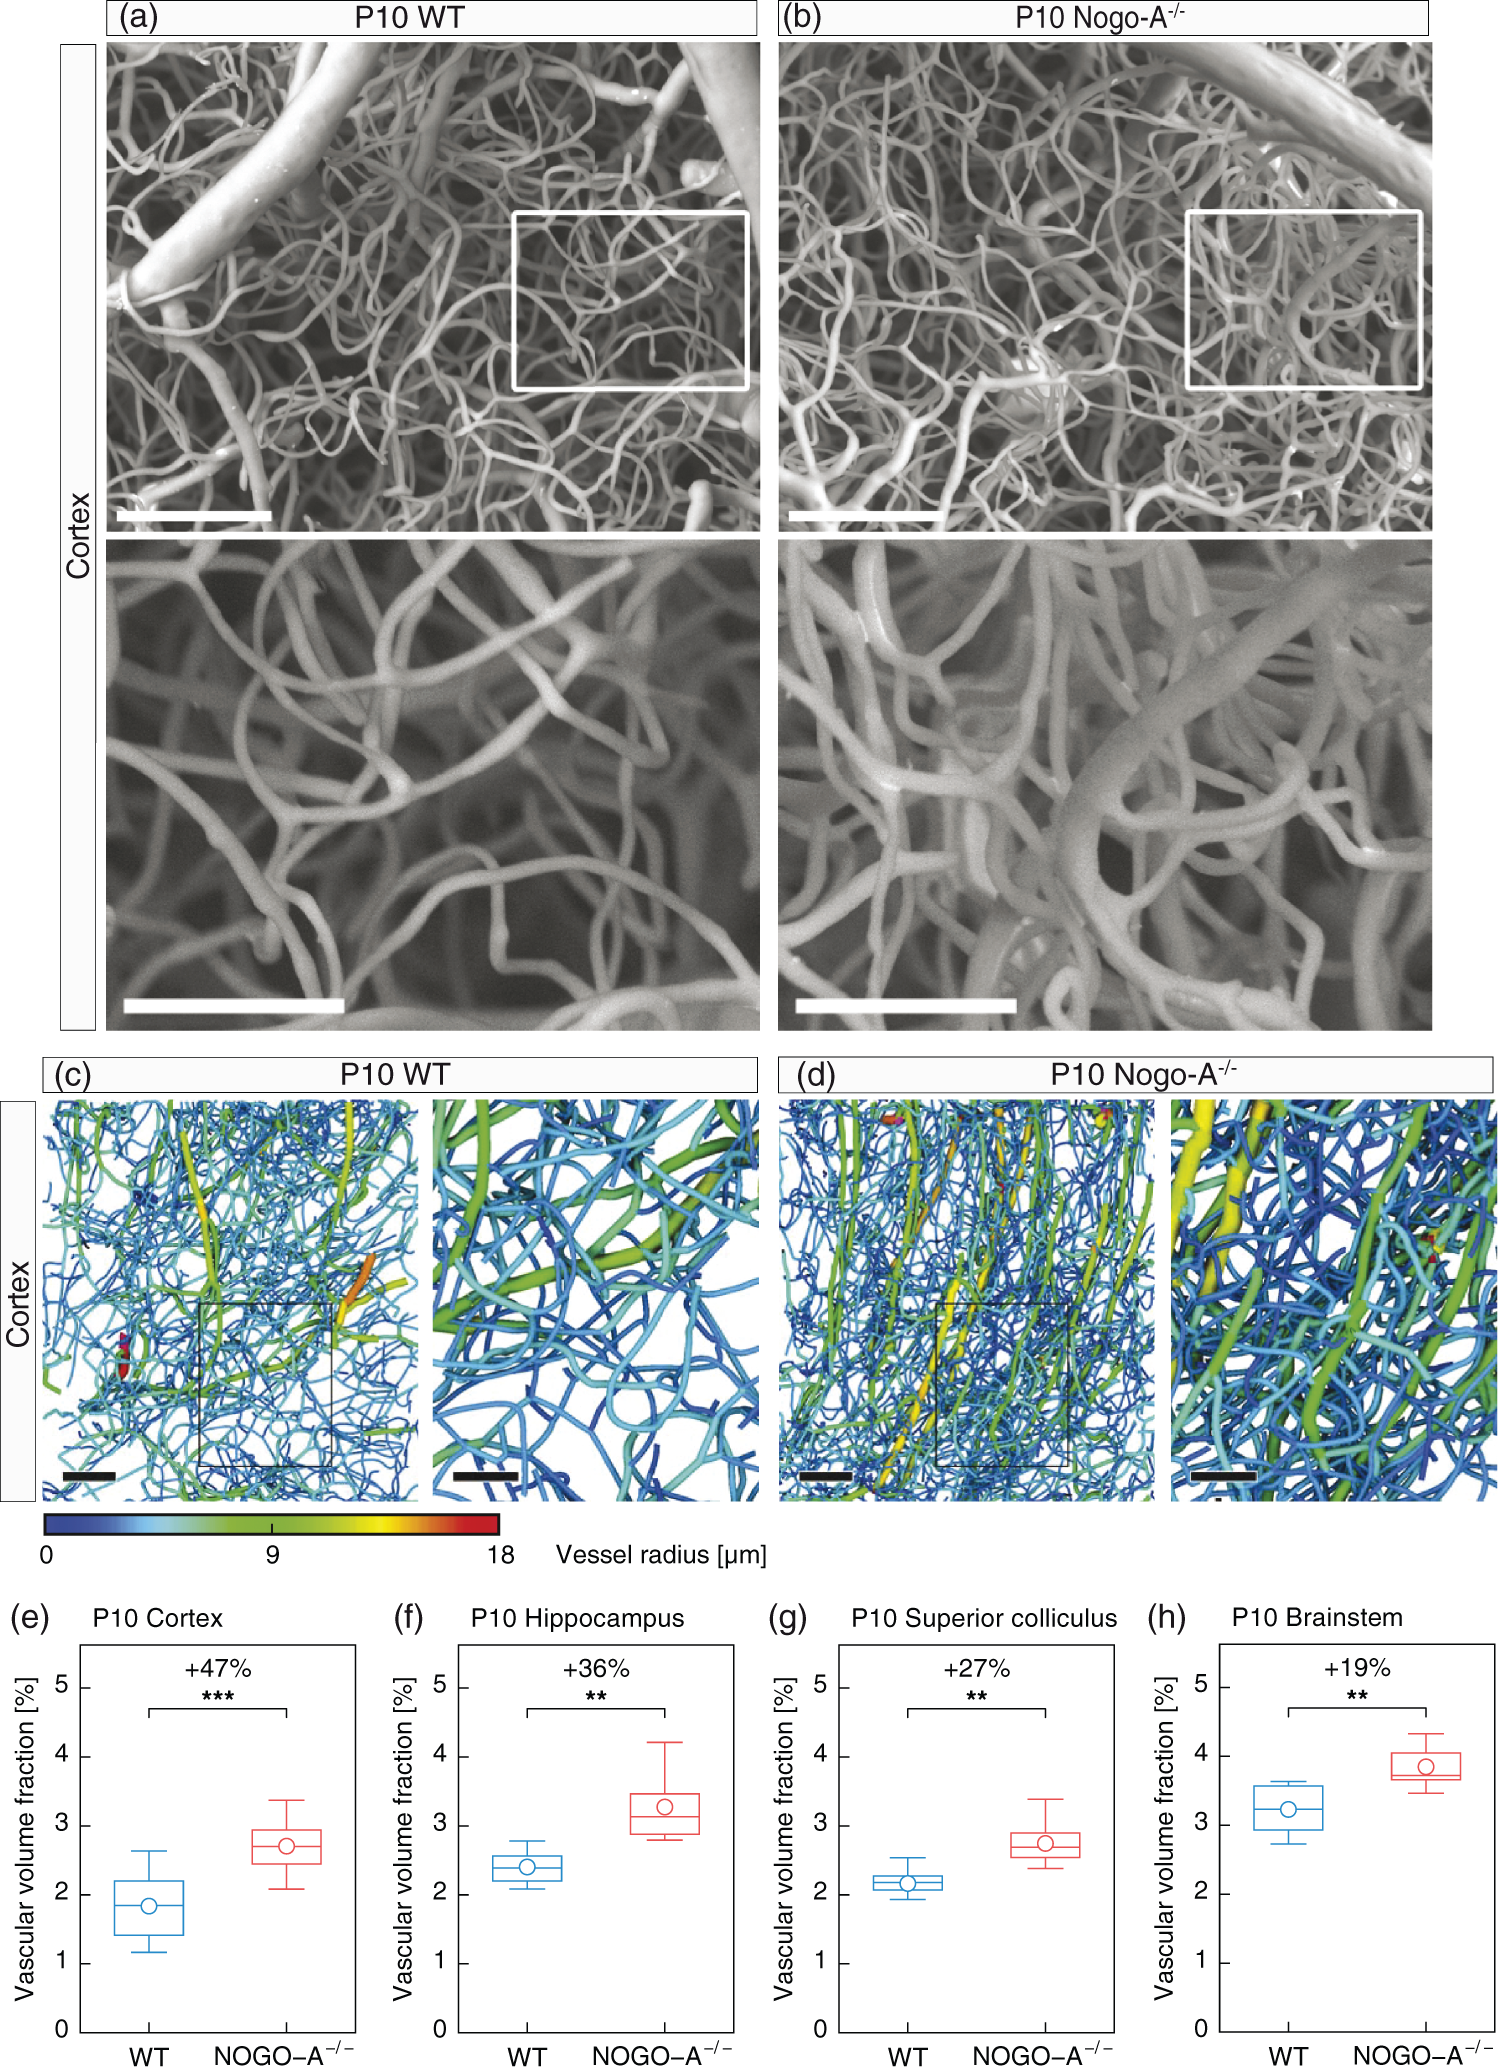
Results
Vascular corrosion casting technique is suitable for analysis of 3D postnatal mouse brain vasculature
The technique of vascular corrosion casting allows to visualize the perfused blood vessel network in three dimensions and has previously been applied to study various biological questions in the field of angiogenesis, including the effects of VEGF165 overexpression on vascularization in the adult mouse brain or vascular alterations in a mouse model of Alzheimer.17,29 To investigate whether vascular corrosion casting could be applied to visualize the 3D vasculature of mice during postnatal brain development – a stage where brain angiogenesis and vascular remodeling are highly dynamic3,4,7,9 – we perfused P10 WT mice with the polyurethane resin PU4ii (see Methods section) that was used in the above-described studies. Light microscopy and SEM of brain tissue samples from resin-perfused P10 WT mice revealed a dense vascular network in the superficial cortex with well-defined vessel structures of all sizes (Supplementary Figure S1(a) to (d)). Larger blood vessels showed oval imprints on the cast surface that are due to endothelial cell nuclei (Supplementary Figure S1(c)) which are also observed in vascular corrosion casts of adult mice thereby demonstrating the perfect molding of the vascular lumen. 29 The fine capillary network was well visible and devoid of vessel interruptions in these P10 brain cortices (Supplementary Figure S1(d)). All these morphological features were very similar to the characteristics of the normal cerebral vasculature in adult mice.19,21,22 Finally, we inspected the raw μCT images of the vascular corrosion casts obtained at the synchrotron radiation beam line at the Swiss Light Source. These SRμCT images were of excellent quality (Supplementary Figure S2(a)) and therefore well suited for computer-aided 3D-recontruction (Supplementary Figure S2(b)). Thus, the vascular corrosion casting technique is an excellent method to visualize the 3D vessel network also in the brains of P10 mice.
Nogo-A deficiency increases the vessel volume fraction in the postnatal mouse brain mainly at the level of capillaries
To investigate the effects of Nogo-A on 3D vessel morphology, we next compared WT and Nogo-A−/− mice. To this end, we referred to animals at the postnatal stage (P10 WT and P10 Nogo-A−/− mice) because we previously reported that Nogo-A gene deletion led to a hypervascularization during postnatal brain development, effects that were compensated in the adulthood. 9 Accordingly, using Isolectin B4 staining and the intraluminal marker Evans blue, we have identified Nogo-A as a negative regulator of postnatal CNS angiogenesis. 9 However, these techniques did not allow a precise 3D analysis of the vascular network or a distinction of different vessel sizes in the two genotypes. Vascular corrosion casting and SRμCT techniques used here allow to overcome these limitations and to address the effects of Nogo-A on the postnatal vasculature more precisely. Qualitatively, SEM images of vascular corrosion casts of P10 WT and P10 Nogo-A−/− animals revealed an increased density of cortical blood vessels in P10 NogoA−/− as compared to P10 WT mice (Supplementary Figure S1(a) and (b)). To quantitatively assess these differences, we next determined the vascular volume fraction (percent of the tissue volume occupied by vessels) in the computationally reconstructed 3D datasets. The vascular volume fraction in WT animals in the different regions investigated was between 2% and 3.5% and thus very similar to previous studies of our3,17 and other groups.7,30 Moreover, the vascular volume fraction in Nogo-A−/− mice was significantly increased in the cortex (P10 Nogo-A−/− vs. P10 WT (mean ±SD; applies also for all subsequent values): 2.71 ±0.39% vs. 1.84 ±0.47%, P = 0.000356), hippocampus (P10 Nogo-A−/− vs. P10 WT: 3.27 ±0.49% vs. 2.4 ±0.25%, P = 0.01), superior colliculus (P10 Nogo-A−/− vs. P10 WT: 2.75 ±0.3% vs. 2.17 ±0.26%, P = 0.0017), and brainstem (P10 Nogo-A−/− vs. P10 WT: 3.85 ±0.28% vs. 3.23 ±0.33%, P = 0.0032) as compared with WT animals (Figure 1(c) to (h)). The increase of the vascular volume fraction of perfused vessels was between 20% and 50%, again very similar to what we observed previously using (immuno)fluorescent methods. 9 Given that the highest increase of vascular volume fraction in response to Nogo-A gene deletion was found in the cerebral cortex (+47%), we used the cortex for all subsequent analysis.
Next, we investigated the vascular volume fraction in WT and Nogo-A−/− cortices separately for larger vessels (non-capillaries, ≥7 μm in diameter) and capillaries (<7 μm in diameter, Figure 2(a) and (b) and Weber et al.
27
). Nogo-A−/− animals showed an increased absolute frequency of capillaries, whereas the absolute frequency of bigger vessels was very similar to the WT condition (Figure 2(b)). In line with this observation, computational 3D analysis revealed that the increased vascular volume fraction in the cortices of Nogo-A−/− animals was mainly due to a significant increase of the vascular volume fraction at the capillary level (P10 Nogo-A−/− vs. P10 WT: 0.83 ±0.2% vs. 0.43 ±0.15, P = 0.00015), whereas a slight increase of the vascular volume fraction of larger vessels (non-capillaries, P10 Nogo-A−/− vs. P10 WT: 1.7 ±0.45% vs. 1.35 ±0.44%, P = 0.12) did not reach statistical significance (Figure 2(c) to (g)). Quantitatively, the vascular volume fraction was increased by 92% for capillaries and by 25% for non-capillaries (Figure 2(f) and (g)). Taken together, these results reveal that the chronic ablation of the Nogo-A gene results in an increased vascular volume fraction, which is mainly due to additionally formed capillaries whilst the number of larger non-capillaries remains relatively unaffected.
Genetic deletion of Nogo-A leads to increased vascular volume fraction of capillaries in the cortex of the postnatal mouse brain. (a) Scheme illustrating the principle of vascular corrosion casts. The vascular corrosion casts represent the inner volume of perfused blood vessels (a, blue; defined by the inner vessel diameter), after maceration of the surrounding CNS tissue including the blood vessel wall (a, red; defined by the outer vessel diameter). A capillary is defined as a blood vessel with an inner diameter (a, blue) of < 7 µm, whereas a non-capillary vessel is defined a blood vessel with an inner diameter (a, blue) of ≥7 µm, according to Weber et al.
27
(b) Histogram showing the distribution of vessel diameter in WT and Nogo-A−/− animals. Nogo-A-deficient animals show an increased absolute frequency of capillaries as compared to the WT situation, whereas the number of non-capillaries remains largely unchanged (bin width = 0.364; number of bins = 55). Black dashed line marks the separation between capillaries (<7 µm) and non-capillaries (≥7 µm). (c, d) Computational 3D reconstructions of µCT images of cortical vascular networks of P10 WT and a P10 Nogo-A−/− mice separated for non-capillaries (magenta) and capillaries (green). The increased density of capillaries (green) in the Nogo-A−/− cortices is evident, non-capillaries (magenta) appear largely unchanged. The boxed areas are enlarged at right. (e–g) Quantification of the 3D vascular volume fraction for all vessels (e), non-capillaries (f), and capillaries (g) in P10 WT and Nogo-A−/− cortices by global morphometry analysis. The significant increase of the vascular volume fraction for all vessels in the Nogo-A-deficient animals (e) was mainly due to a significant increase at the level of cortical capillaries (g) (n = 5 for P10 WT; n = 7 for P10 Nogo-A−/− animals; and in average two ROIs per animal and brain region). All data are shown as mean distributions where the open dot represents the mean. Boxplots indicate the 25% to 75% quartiles of the data. The shaded blue and red areas indicate the SD. *P < 0.05, **P < 0.01, ***P < 0.001. Scale bars: 100 µm (c, d, overviews); 50 µm (c, d, zooms).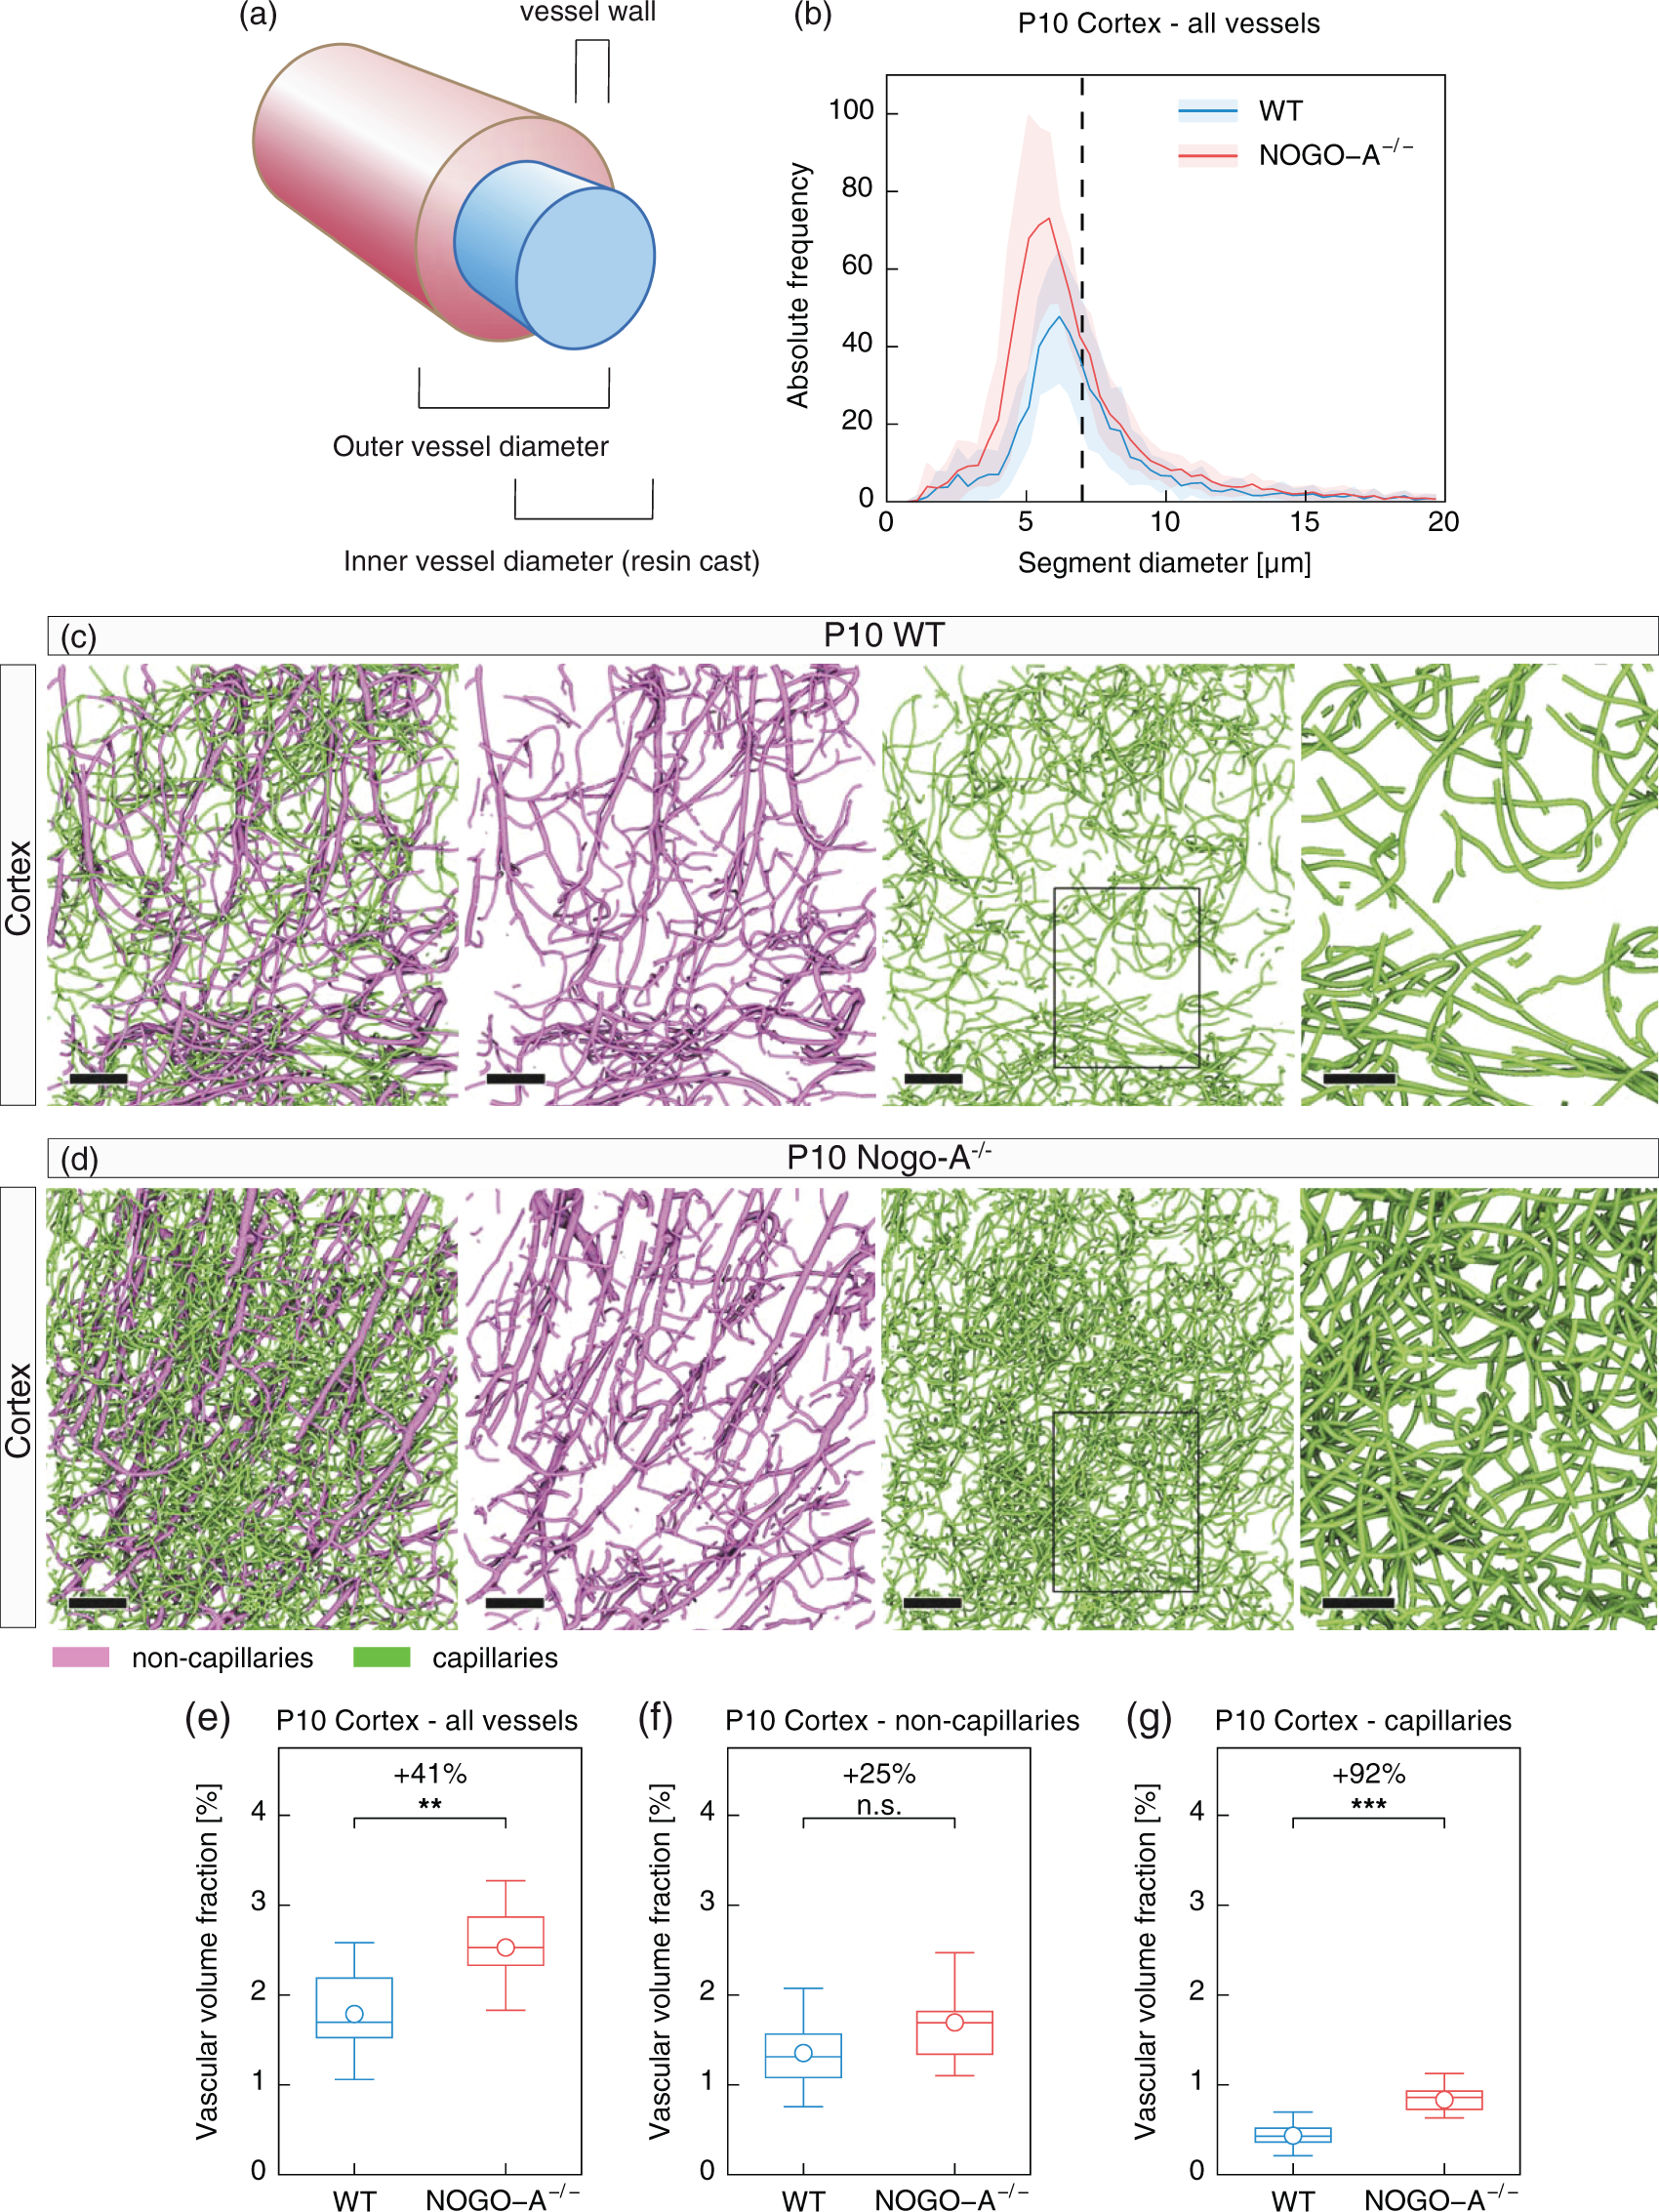
Nogo-A ablation increases the number of vessel branchpoints mainly at the capillary level
An increased vascular volume fraction may be due to increased vessel branching and concomitant newly formed vessel segments, or caused by an increased vessel diameter, an increased vessel length, or a combination of these factors. To address the origin of the additionally formed vessels, we next determined the number of vascular branchpoints in the cortices of WT and Nogo-A−/− animals referring to local topological analysis. Vessel branchpoints are characterized by their degree,
17
defined as the number of vessels adjacent to a vessel branchpoint, usually ranging from degree 3 to degree 518 (Figure 3(a)). Accordingly, vascular branchpoints were defined as points where three (branchpoint degree 3), four (branchpoint degree 4), or five (branchpoint degree 5) vessel segments converge (Figure 3(a)). Two branchpoints can computationally only be distinguished if the distance between the two branchpoints is >2 μm. In consequence, branchpoints distant less than 2 μm from each other were considered as a single branchpoint (Figure 3(a)). For discrimination between “capillary branchpoints” and “non-capillary branchpoints,” the branchpoint diameter was considered to be that of the thickest vessel adjacent to a given branchpoint (Figure 3(a) and (b)). Accordingly, if the thickest vessel adjacent to a given branchpoint was <7 μm, the branchpoint was classified as a “capillary branchpoint,” whereas if the thickest vessel adjacent to a given branchpoint was ≥7 μm, the branchpoint was classified as a “non-capillary branchpoint.” Nogo-A−/− animals showed a pronounced increase of branchpoint density (of all degrees) at the capillary level (P10 Nogo-A−/− vs. P10 WT: 2990.9 ±1255.7mm−3 vs. 1597.6 ±753.5mm−3, P = 0.014) and a slighter increase of the number of branchpoints for non-capillaries (P10 Nogo-A−/− vs. P10 WT: 4538.9 ±940.3mm−3 vs. 3449.6 ±1206.9mm−3, P = 0.041) as compared to the WT mice (Figure 3(b)). Computational reconstructions revealed an increased number of vessel branchpoints in cortices of Nogo-A−/− as compared with WT mice (Figure 3(c) and (d)). Quantitatively, the density of cortical branchpoints for all vessels was significantly (by 49%) increased (P10 Nogo-A−/− vs. P10 WT: 7529.8 ±1839.4mm−3 vs. 5047.2 ±1425.9mm−3, P = 0.006) in P10 Nogo-A−/− as compared to P10 WT animals (Figure 3(c), (d), and (e)), predominantly due to an almost doubled (+86%) number of branchpoints in the capillary bed (P10 Nogo-A−/− vs. P10 WT: 2990.9 ±1255.7mm−3 vs. 1597.6 ±753.5mm−3, P = 0.014, Figure 3(c), (d), and (g)) and an additional significant increase (+32%) at the level of non-capillaries (P10 Nogo-A−/− vs. P10 WT: 4538.9 ±940.3mm−3 vs. 3449.6 ±1206.9mm−3, P = 0.041, Figure 3(c), (d), and (f)). Interestingly, in the transgenic animals, this was mainly due to an increased number of vessel branchpoints of degree 3 for all vessel sizes (+49% for all vessels, +32% for non-capillaries, and +88% for capillaries, Supplementary Figure 3(b), (d), and (f) and Supplementary Figure S4(a) to (c)). Vessel branchpoints of degree 4 or 5 were very rare and showed only a non-significant increase in Nogo-A−/− animals (Supplementary Figure S3(b), (d), and (f) and Supplementary Figure S4(d) to (f)). Moreover, the mean vessel branchpoint degree for the different vessel sizes was very similar in the two genetic conditions (Supplementary Figure S3(a), (c), and (e)), indicating that Nogo-A gene deletion does not alter the branchpoint degree. Together, these data reveal that genetic deletion of Nogo-A enhances the vascular volume density by increasing the number of vascular branchpoints mainly at the level of capillaries.
Nogo-A ablation increases the number of vascular branchpoints in the postnatal mouse brain cortex. (a) Scheme depicting the definition of vascular branchpoints. Each voxel of the vessel center line (black) with more than two neighboring voxels was defined as a vascular branchpoint. This results in branchpoint degrees (number of vessels joining in a certain branchpoint) of minimally three. In addition, two branchpoints were considered as a single one if the distance between them was below 2 µm. Of note, nearly all branchpoints had a degree of 3. Branchpoint degrees of four or even higher accounted together for far less than 1% of all branchpoints (cf. Supplementary Figure S4(a) and (f)). (b) Histogram showing the distribution of branchpoint diameter in WT and Nogo-A−/− animals. Nogo-A-deficient animals show an increased branchpoint density as compared to WT control mice mainly at the capillary level (bin width = 0.50; number of bins = 40). Black dashed line marks the separation between capillaries (< 7 µm) and non-capillaries (≥ 7 µm), as defined in Figure 1. (c, d) Computational 3D reconstructions of µCT images of cortical vascular networks of P10 WT and a P10 Nogo-A−/− mice with visualizations of the vessel branchpoints displayed as dots, separately for non-capillaries (magenta) and capillaries (green). The higher density of branchpoints in the Nogo-A−/− cortices especially at the capillary level (green) is obvious, a slight increase of branchpoint density can be observed at the non-capillary level (magenta). The boxed areas are enlarged at right. (e–g) Quantitative analysis of the branchpoint density for all vessels (e), non-capillaries (f), and capillaries (g) in P10 WT and Nogo-A−/− cortices by local morphometry analysis. The significant increase of the branchpoint density for all vessels in the Nogo-A-deficient animals (e) was mainly due to a significant increase at the level of capillaries (g) and in part due to a significant increase at the level of non-capillaries (f) (n = 5 for P10 WT; n = 7 for P10 Nogo-A−/− animals; and in average two ROIs per animal and brain region). All data are shown as mean distributions where the open dot represents the mean. Boxplots indicate the 25% to 75% quartiles of the data. The shaded blue and red areas indicate the SD. *P < 0.05, **P < 0.01, ***P < 0.001. Scale bars: 100 µm (c, d, overviews); 50 µm (c, d, zooms).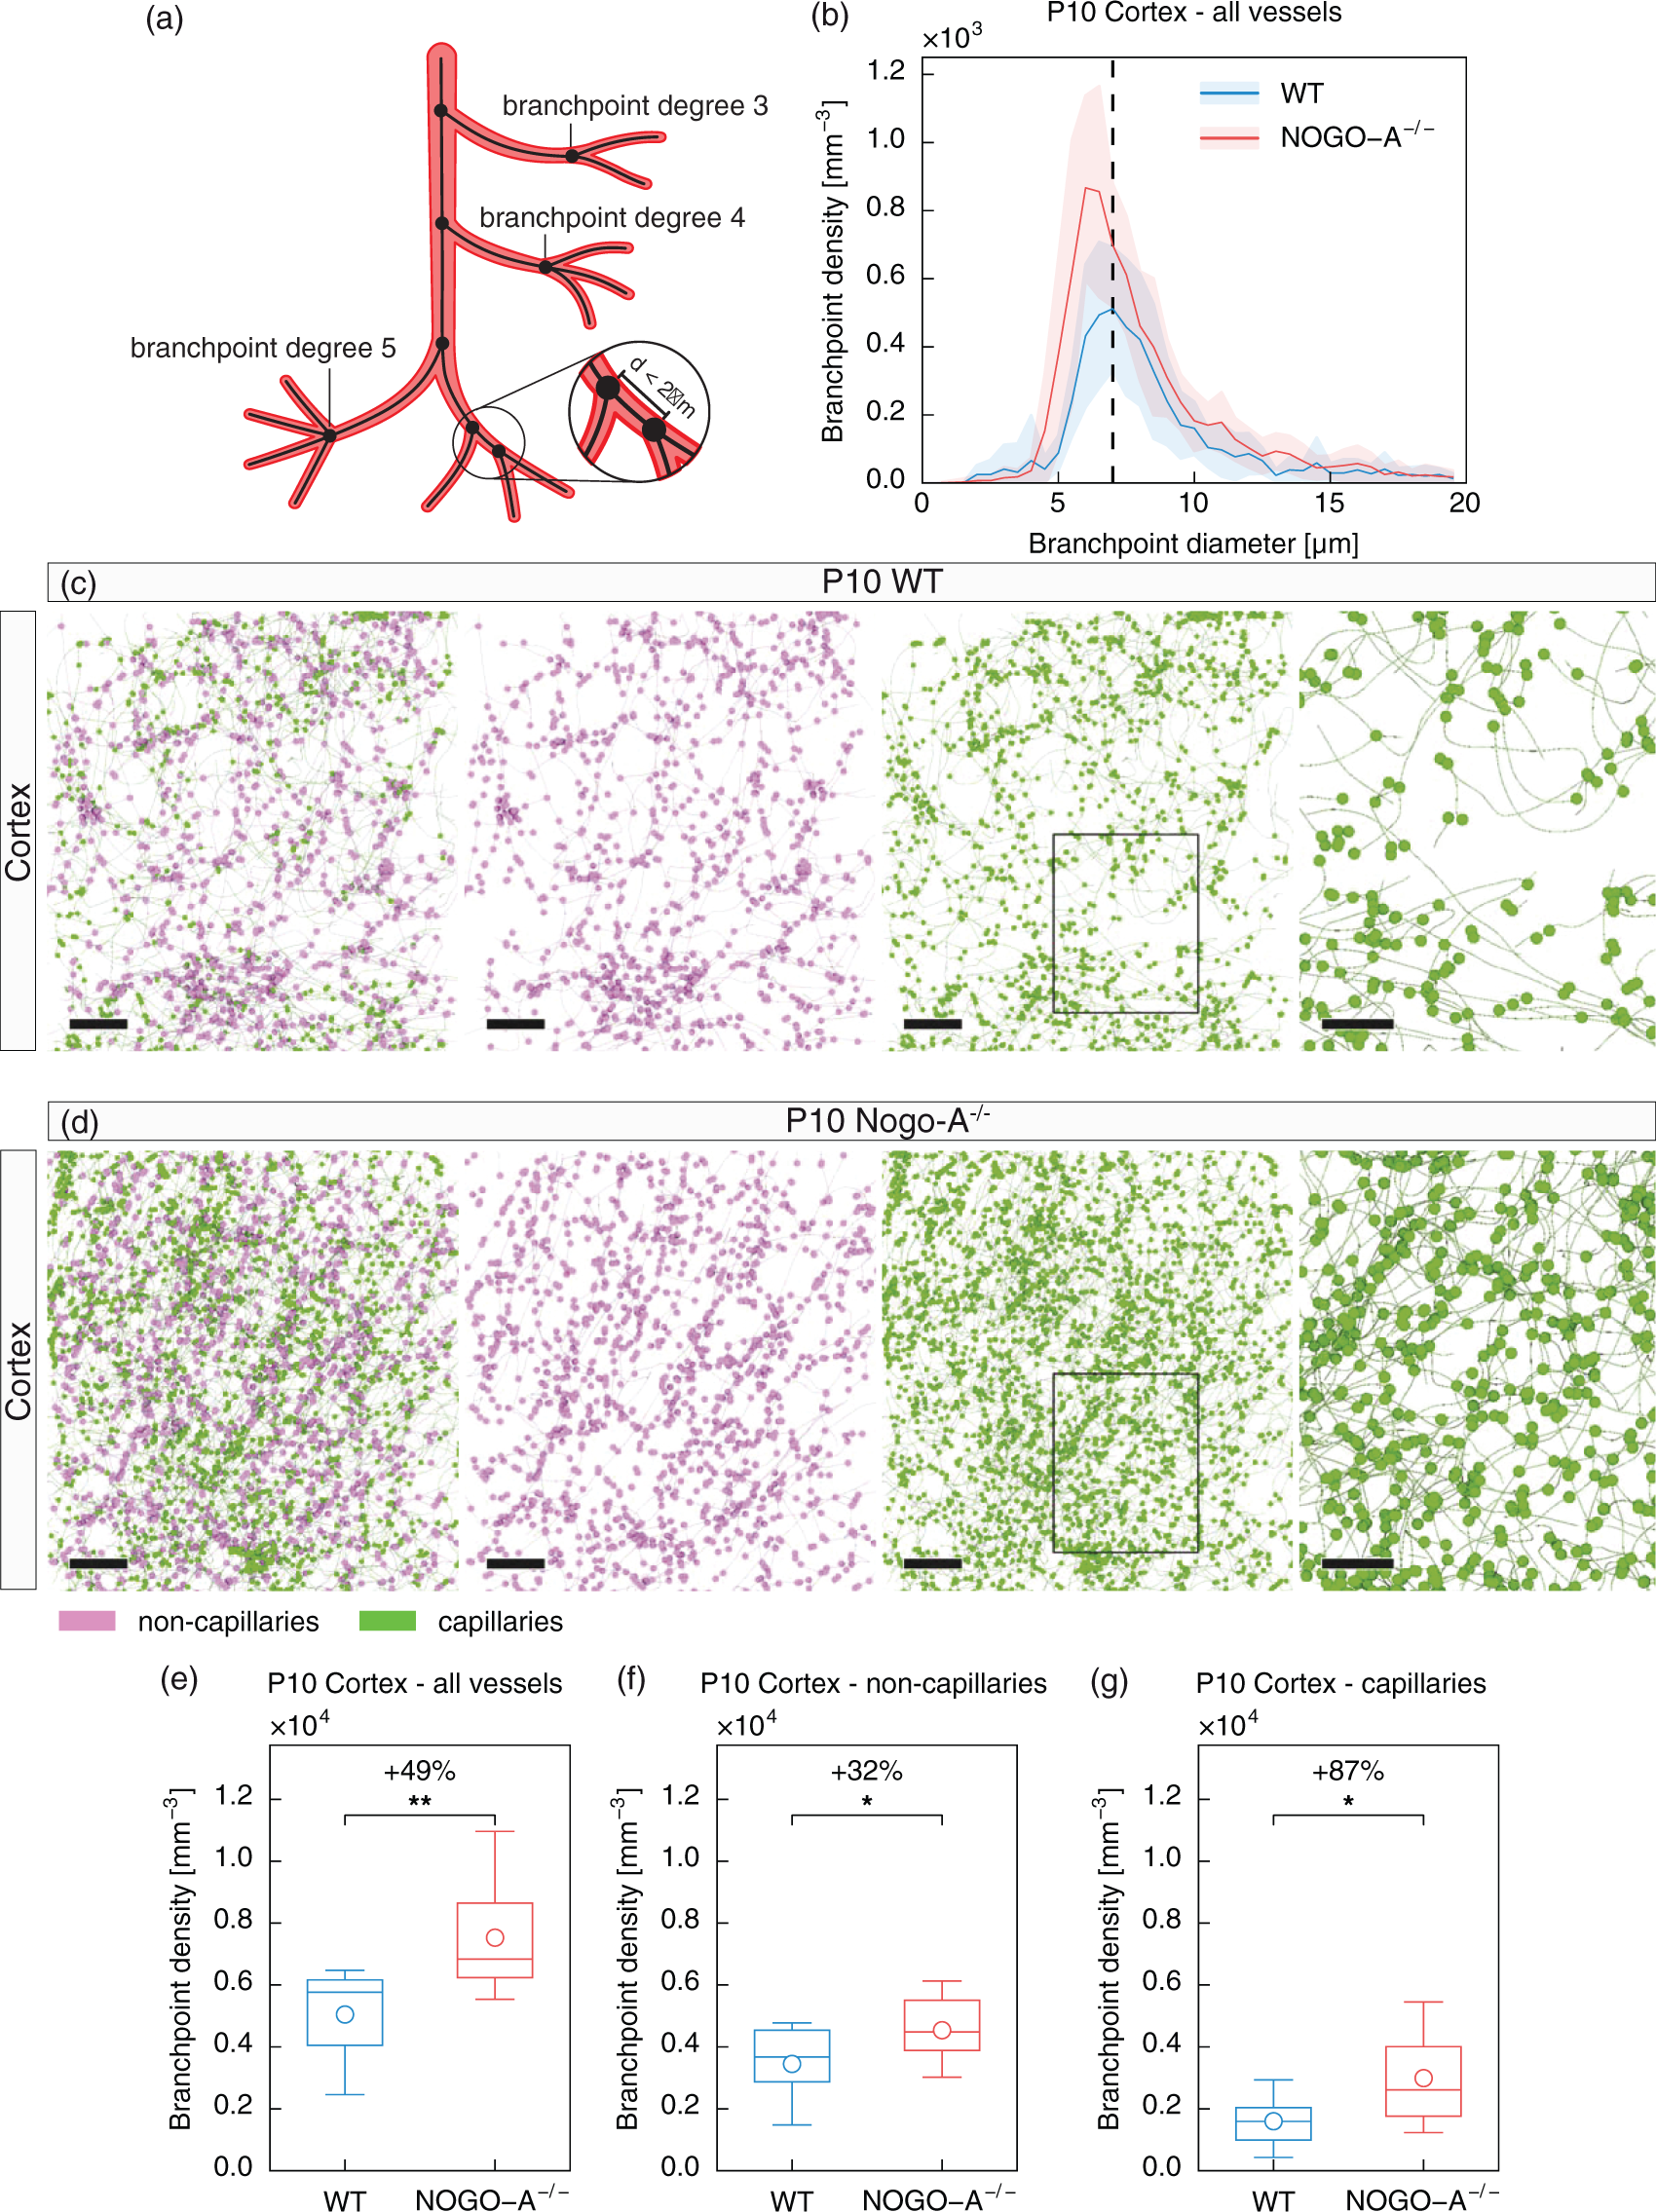
Nogo-A gene deletion leads to an increased density of morphologically unaltered capillary segments
Local topological analysis revealed that the number of vessel segments was significantly increased in Nogo-A−/− as compared to WT animals, namely by 52% for all vessels (P10 Nogo-A−/− vs. P10 WT: 14,556.3 ±2982.9mm−3 vs. 9603 ±2635.6mm−3, P = 0.0016) and by 73% for capillaries (P10 Nogo-A−/− vs. P10 WT: 9352.5 ±2603.2mm−3 vs. 5396.9±1760mm−3, P = 0.0019, Supplementary Figure S5(a) to (e)), whereas only a non-significant increase of vessel segments at the level of non-capillaries was observed (+24%, P10 Nogo-A−/− vs. P10 WT: 5203.8 ±1153mm−3 vs. 4206.1 ±1617.2mm−3, P = 0.134, Supplementary Figure S5(d)). The very similar relative increase of the number of vessel segments (Supplementary Figure S5(c) to (e)) and the number of vessel branchpoints (Figure 3(e) to (g)) in animals lacking Nogo-A indicates that most of the newly forming vessel branches result in newly formed blood vessels integrated into the circulation. Together, these data suggest that Nogo-A gene deletion enhances vascular branching mainly from capillaries leading to more vessel segments at the capillary level.
Despite the formation of new vessel segments, the increased vascular volume fraction in Nogo-A−/− could also be caused by vessel thickening, an increased vessel length or other morphological alterations of the newly formed vessel segments. Thus, we next performed a detailed analysis of several morphological vessel parameters such as vessel length, diameter, tortuosity, and vessel volume (Figure 4(a) and (b) and Heinzer et al.17,22). Histogram analysis revealed that for a given vessel length, vessel diameters were very similar between the two groups (Figure 4(c)), indicating that abnormal vessel thickening was not associated with Nogo-A gene deletion. Importantly, the mean segment diameter (P10 Nogo-A−/− vs. P10 WT: all vessels: 7.3 ±0.43 μm vs. 7.6 ±0.65 μm, P = 0.32; capillaries: 5.4 ±0.23 μm vs.5.6 ±0.32 μm, P = 0.18; non-capillaries: 10.6 ±0.9 μm vs. 9.8 ±1.1 μm, P = 0.4) and the mean segment length (P10 Nogo-A−/− vs. P10 WT: all vessels: 35.6 ±4.2 μm vs. 33 ±4.3 μm, P = 0.21; capillaries: 36.2 ±6.8 μm vs. 30.4 ±4.9 μm, P = 0.061; non-capillaries: 33.7 ±3.9 μm vs. 36.4 ±4.6 μm, P = 0.19) were very similar between Nogo-A−/− and WT animals and did not show any significant changes for all vessel sizes (Figure 4(d) to (i)). Similarly, segment tortuosity (P10 Nogo-A−/− vs. P10 WT: all vessels: 1.2 ±0.024 vs. 1.2 ±0.024, P = 0.42; capillaries: 1.2 ±0.041 vs. 1.2 ±0.028, P = 0.77; non-capillaries: 1.2 ±0.021 vs. 1.2 ±0.017, P = 0.004) and segment volume (P10 Nogo-A−/− vs. P10 WT: all vessels: 1839.3 ±425.3 μm3 vs. 1991 ±380.7 μm3, P = 0.44; capillaries: 931.3 ±179.9 μm3 vs. 852.9 ±165.4 μm3, P = 0.35; non-capillaries: 3396.6 ±792.5 μm3 vs. 3617.7 ±940.9 μm3, P = 0.59) were also largely unchanged for all vessel sizes between the two groups (Figure 4(j) to (o)). Taken together, all these data show that the increased vascular volume fraction upon Nogo-A gene deletion is due to additional sprouting and branching events resulting in supernumerous and morphologically unaltered perfused vessels (mainly capillaries) that are integrated into the existing vascular network.
Nogo-A ablation does not affect vessel diameter, length, tortuosity, and volume. (a, b) Scheme showing the definition of vessel diameter (a), vessel length (a), and vessel tortuosity (b). The segment diameter is defined as the average diameter of all single elements of a segment (a). The segment length is defined as the sum of the length of all single elements between two branchpoints (a; cf. Figure 2(a)). The segment tortuosity is the ratio between the effective distance le and the shortest distance ls between the two branchpoints associated to this segment (b). The segment volume is defined as the product of the segment length and (π × (segment diameter/2)
2
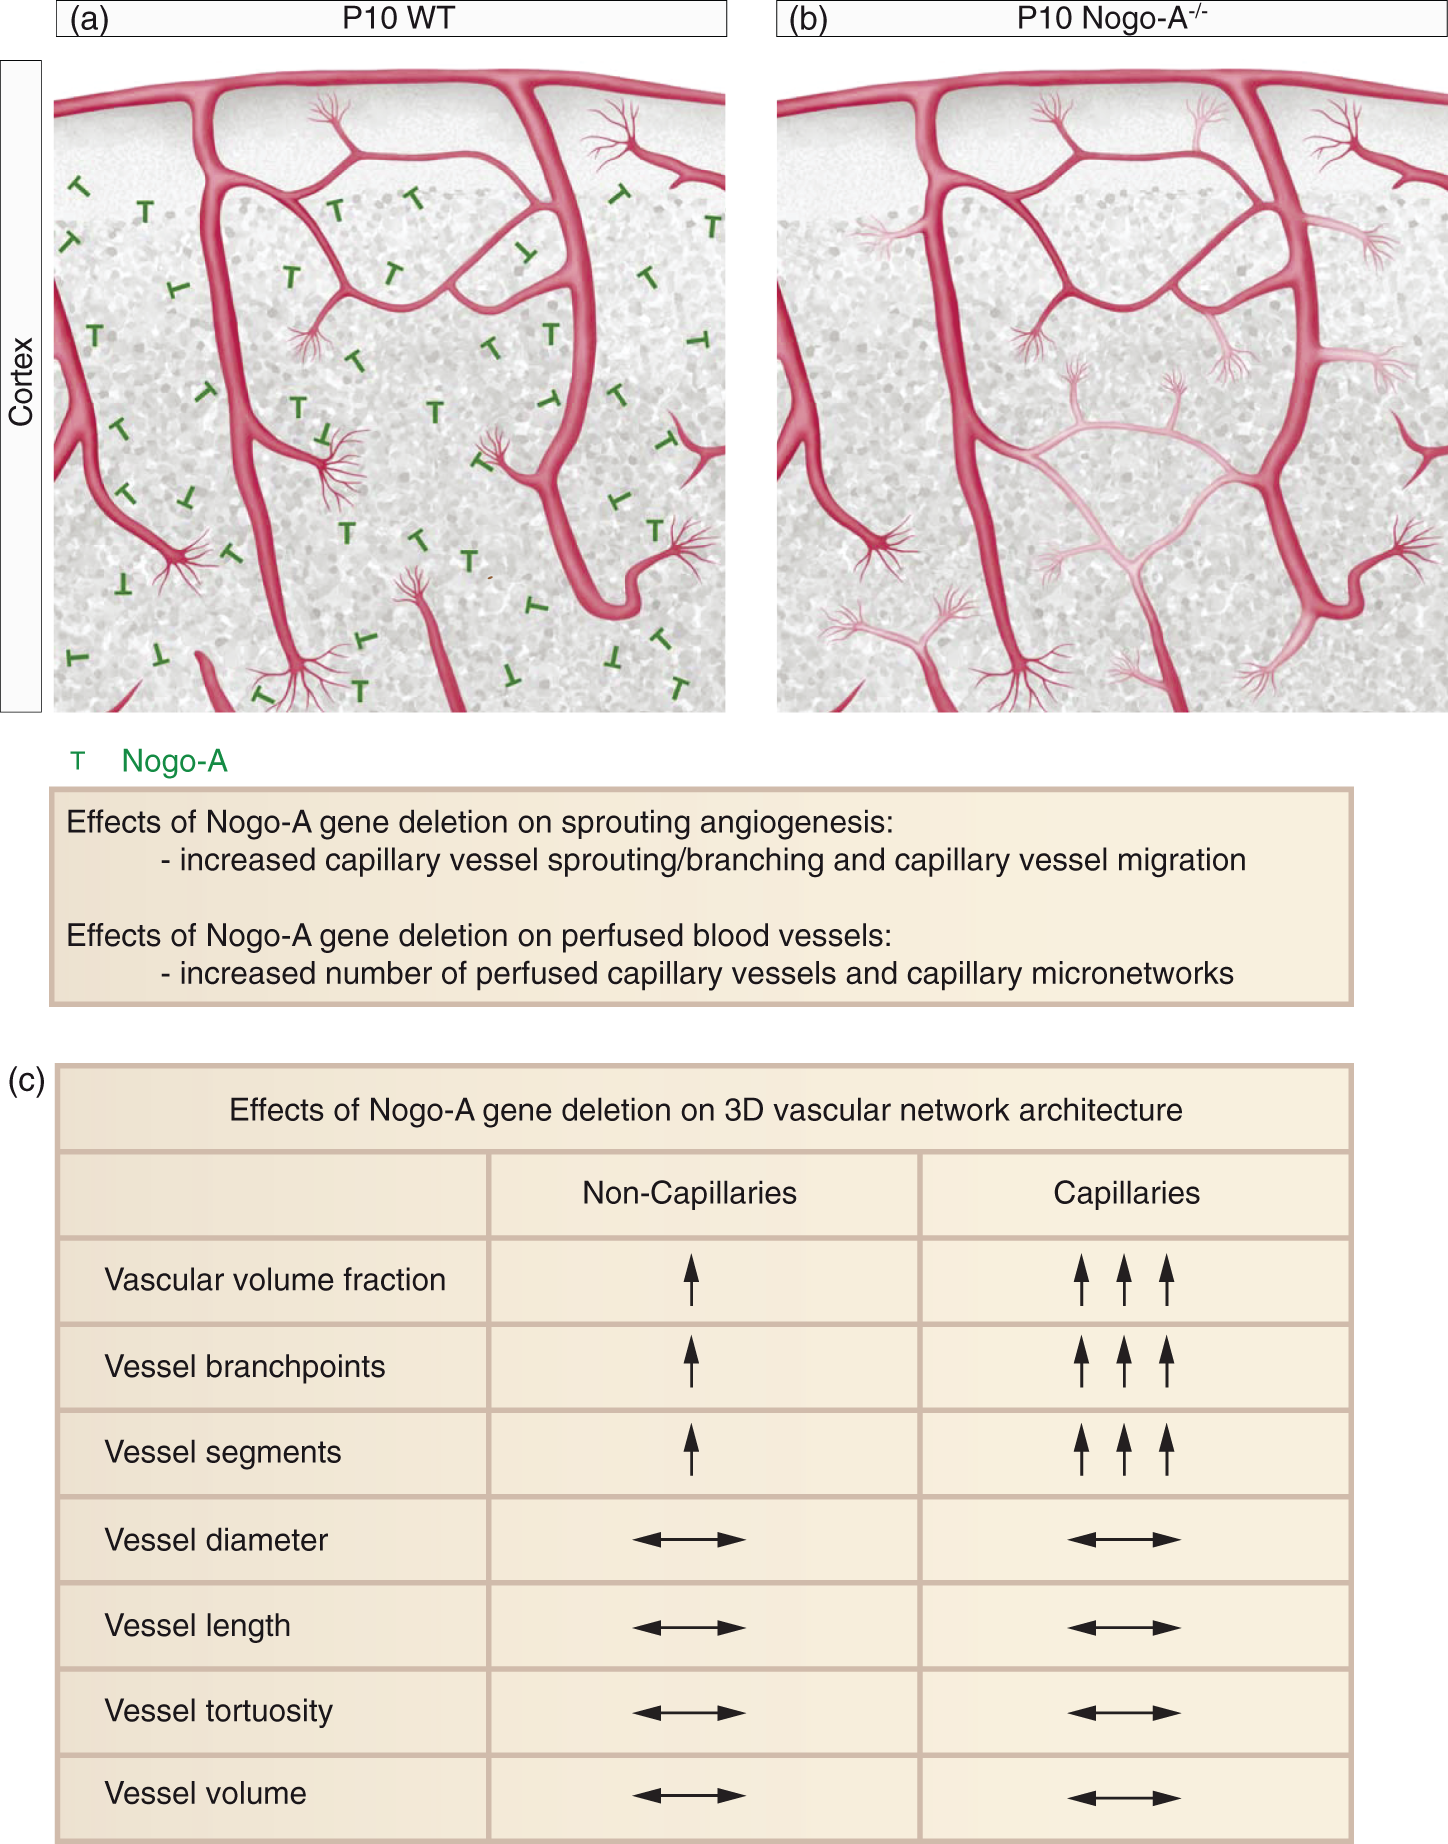
). (c) Graph depicting the relationship between segment diameter and segment length in WT and Nogo-A−/− animals. No major difference in the ratio “segment diameter-to-segment length” between P10 WT mice and P10 Nogo-A−/− mice was observed. (bin width = 4.929; number of bins = 14). (d–o) Quantification of the 3D vessel network parameters segment diameter (d–f), segment length (g–i), segment tortuosity (j–l), and segment volume (m–o) for all vessels, non-capillaries, and capillaries in P10 WT and Nogo-A−/− cortices by local morphometry analysis. There were no major difference between WT and Nogo-A−/− mice regarding segment diameter (d–f), segment length (g–i), segment tortuosity (j–l), or segment volume (m–o) at the different vessel sizes (all vessels, non-capillaries, capillaries) (n = 5 for P10 WT; n = 7 for P10 Nogo-A−/− animals; and in average two ROIs per animal and brain region). All data are shown as mean distributions where the open dot represents the mean. Boxplots indicate the 25% to 75% quartiles of the data. The shaded blue and red areas indicate the SD. *P < 0.05, **P < 0.01, ***P < 0.001. Nogo-A gene deletion leads to decreased extravascular distance. (a) Schematic displaying the parameter extravascular distance, being defined as the shortest distance of any given voxel in the tissue to the next vessel structure. (b) Color map indicating the extravascular distance in the cortex of a P10 WT mouse. Each voxel outside a vessel structure is assigned a color to depict its shortest distance to the nearest vessel structure. Color bar indicates shortest distance to the next vessel structure. (c, d) Color maps showing the extravascular distance for cortices of a P10 WT (c) and a P10 Nogo-A−/− mice (d). The reduced extravascular distance in Nogo-A−/− animals as compared to WT control animals is obvious. Color bar indicates shortest distance to the next vessel structure. (e) Histogram showing the distribution of the extravascular distance in WT and Nogo-A−/− animals. Nogo-A-deficient animals show an increased relative frequency of shorter extravascular distances as compared to the WT situation (bin width = 10; number of bins = 20). (f) Quantification of the extravascular distance in P10 WT and Nogo-A−/− cortices by global morphometry analysis. The extravascular distance in the cortices of Nogo-A-deficient animals was significantly decreased as compared to the WT control animals (n = 5 for P10 WT; n = 7 for P10 Nogo-A−/− animals; and in average two ROIs per animal and brain region). All data are shown as mean distributions where the open dot represents the mean. Boxplots indicate the 25% to 75% quartiles of the data. The shaded blue and red areas indicate the SD. *P < 0.05, **P < 0.01, ***P < 0.001. Scale bars: 100 µm (b–d). Working model summarizing the effects of Nogo-A on angiogenesis and 3D vascular network architecture during postnatal mouse brain development. (a, b) Schematic coronal section of the postnatal mouse brain cortex vasculature showing functional, perfused blood vessels as well as newly formed blood vessel sprouts including endothelial tip cells and their filopodial protrusions (red). In the mouse cortex, genetic deletion of Nogo-A (a, green) leads to an increased vascular volume fraction of functional blood vessels via increased vascular endothelial sprouting, branching, and migration mainly at the capillary level (b and Walchli et al.
9
). Enhanced vascular sprouting, branching, and migration in Nogo-A-deficient animals then result in the formation of morphologically unaltered vessel segments that are integrated into the existing vasculature, thereby forming new functional and perfused capillary micronetworks (b; additional endothelial tip cells, vascular sprouts, perfused blood vessels, and capillary micronetworks in Nogo-A knockout mice are displayed in light red). The distance of any given extravascular point in the brain tissue to the nearest vessel structure is thereby reduced (b). (c) Table summarizing the effects of Nogo-A gene deletion on the 3D vascular network architecture in the postnatal mouse brain. The vascular volume fraction (percentage of tissue volume occupied by the entire vascular network), the number of vessel segments, and the number of vessel branchpoints are predominantly increased at the capillary level. Other vascular parameters such as vessel diameter, vessel length, vessel tortuosity, and vessel volume (product of vessel diameter and vessel length) are not affected in Nogo-A-deficient mice at both the level of capillaries and non-capillaries.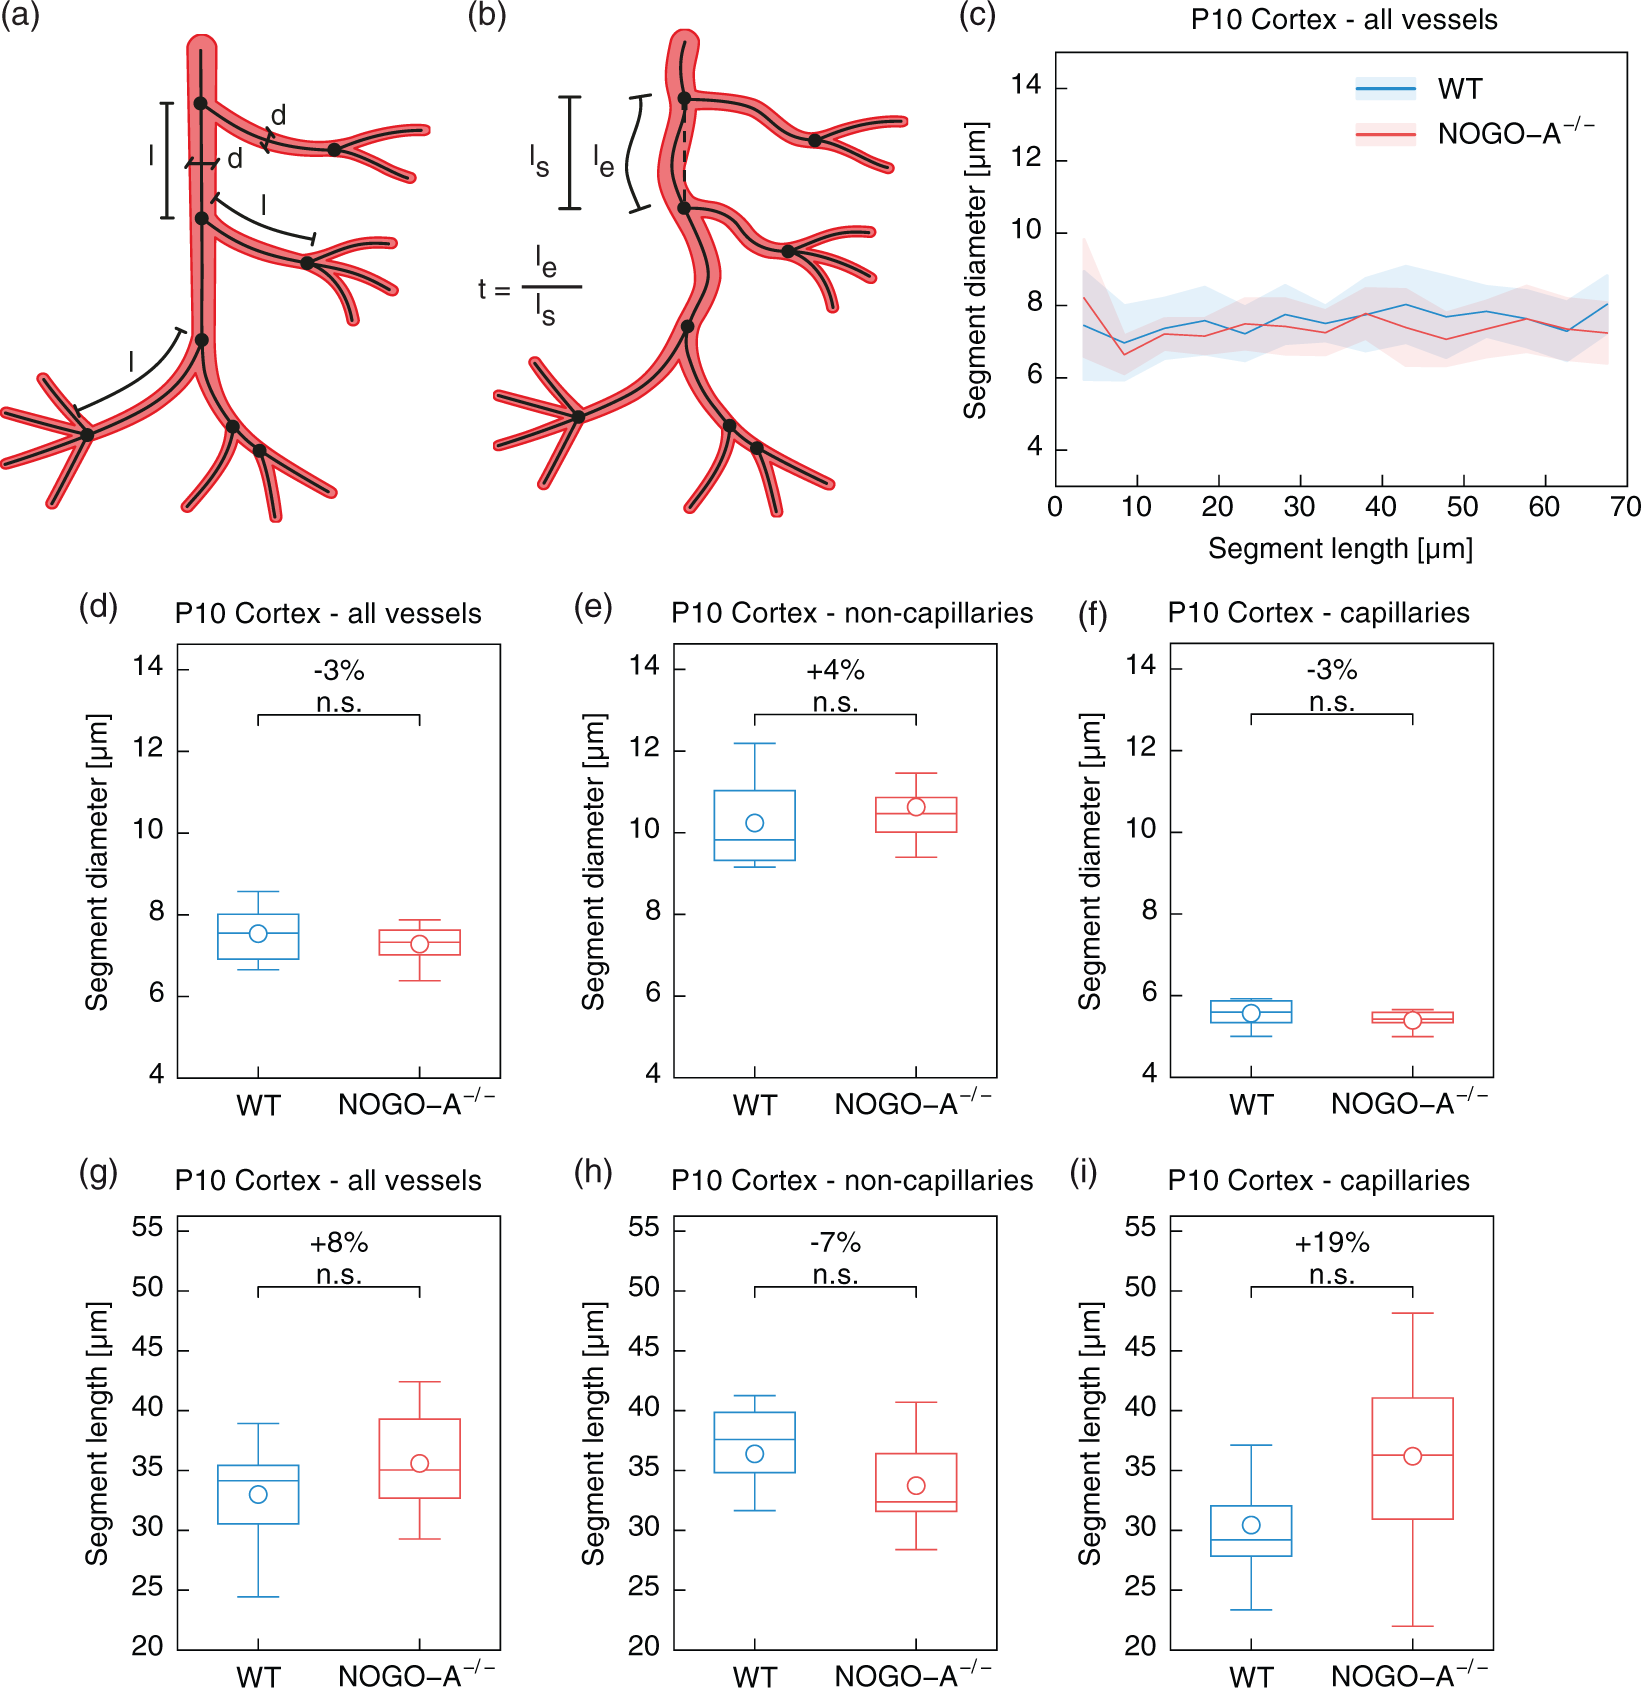
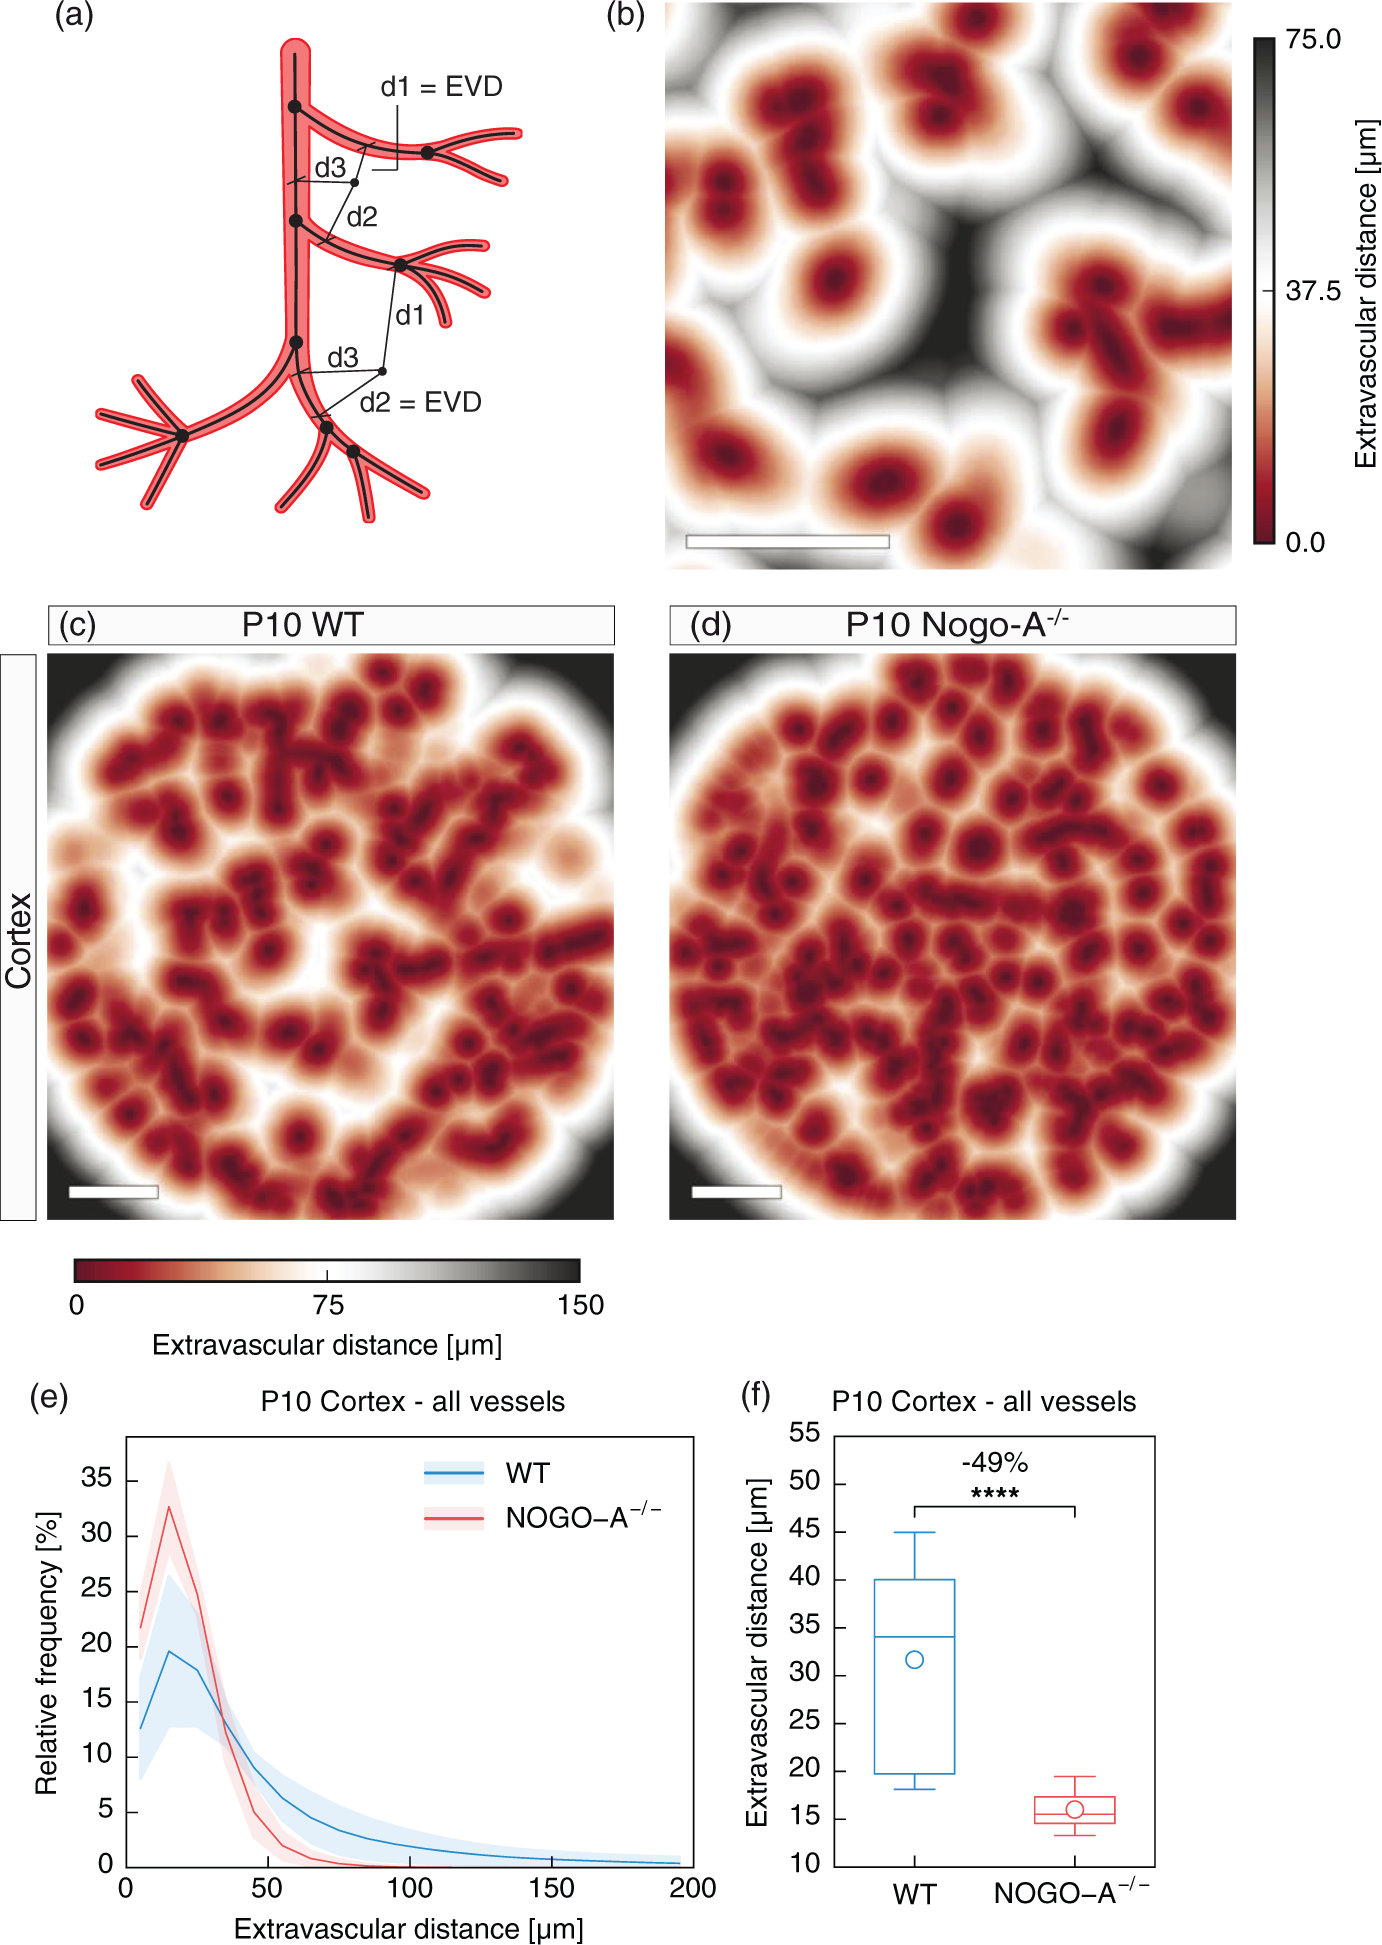
Nogo-A gene deletion leads to reduced vessel spacing
Next, to assess the functional consequences of the increased vascular volume fraction in the Nogo-A knock-out animals, we determined the extravascular distance – defined as the shortest distance of any given extravascular voxel in the tissue to the nearest vessel structure (Figure 5(a) and (b)) – which measures the diffusion distance. The extravascular distance in WT mice was similar to our previous work 18 and was markedly reduced in P10 Nogo-A−/− as compared to P10 WT cortices (Figure 5(c) and (d)). Furthermore, histogram distribution analysis revealed a marked shift towards smaller extravascular distances in the Nogo-A-deficient animals (Figure 5(e)). Quantitative analysis showed a highly significant reduction of the extravascular distance in Nogo-A−/− to almost half (−49%) as compared to WT mice (P10 Nogo-A−/− vs. P10 WT: 16 ±1.83 μm vs. 31.7 ±10.64 μm, P = 0.000093, Figure 5(f)). Taken together, these data suggest that the effects of Nogo-A gene deletion on the 3D vascular network result in a markedly lowered vessel spacing and diffusion distance.
Discussion
In the present study, using vascular corrosion casting and 3D computational network analysis, we show that genetic deletion of Nogo-A increases the 3D vascular volume fraction in the postnatal mouse brain predominantly at the capillary level. Our data reveal that this is due to an increased vessel sprouting and branching resulting in an increased number of perfused, morphologically unaltered capillary segments and a subsequent decreased extravascular distance. Importantly, vessel diameter, length, tortuosity, and vessel volume remained largely unaffected by Nogo-A gene deletion. In summary, we propose a model in which the loss of Nogo-A stimulates angiogenesis via increased capillary branching/sprouting resulting in the insertion of additional complete and perfused capillary micro-networks into the existing brain vasculature. These data support a new fundamental mechanism in angiogenesis of how additional capillaries are integrated into pre-existing vascular networks upon pro-angiogenic stimuli.
Vascular corrosion casting, SRμCT, and computational network analysis are applicable to study angiogenesis and 3D blood vessel network morphology in the postnatal mouse brain
The process of postnatal brain angiogenesis and especially the 3D vascular remodeling at the network level are still not well understood.3,4,7,31,32 In particular, the commonly used immunofluorescent methods are limited with regard to their capacity to analyze the architecture of the brain vasculature in three dimensions or at the level of vascular networks.3,6,7 To circumvent these limitations and in order to study the cerebral vasculature in three dimensions, we employed vascular corrosion casting in combination with high-resolution, synchrotron radiation-based μCT and computational network analysis, techniques that provide quantitative, characteristic features of 3D blood vessel networks.19,21,33,34 Previously, these or similar methods were only used in adult mice, for example to investigate the effects of VEGF165 overexpression on angiogenesis in the adult mouse brain, 17 the vascular alterations in a mouse model of Alzheimer, 29 and to study microvascular networks in rat brain tumors. 32 Here, we demonstrated that vascular corrosion casting can indeed be applied in very young and small mice at the stage of postnatal brain development. The values for different blood vessel parameters obtained here are comparable to other studies using similar17,22 or different 3D methods.30,35 While other methods have the advantage of in vivo analysis of the cerebral cortex or other superficial regions of the central nervous system,7,35 the strength of our method lies in the possibility to analyze larger tissue volumes of any desired region of the central nervous system, thereby leading to more stable statistics as well as to a broader range of application. Importantly, the vascular corrosion casts revealed highly detailed vascular images down to the level of capillaries, of excellent technical quality. Moreover, the comparison between P10 WT and Nogo-A−/− animals confirmed our previous findings using classical immunofluorescent vessel stainings and stereological analysis,3,9 thereby further validating the above-mentioned techniques in young postnatal mice.
Nogo-A deficiency augments vessel density in developing CNS at the level of capillaries
Given that sprouting angiogenesis leads to new vessel sprouts and endothelial tip cells mainly at the capillary level,1–5 one would expect that upon Nogo-A gene deletion mainly the number of capillaries would be affected. Indeed, we found that the higher vessel volume fraction observed in animals lacking functional Nogo-A was predominantly due to a higher capillary volume fraction. In contrast, larger non-capillary vessels showed only a non-significant trend towards a higher vessel volume fraction suggesting that the contribution of sprouting from larger vessels is less important. Moreover, this also suggests that Nogo-A specifically represses the number of newly formed endothelial tip cells and capillary sprouts. How Nogo-A precisely acts in this regard remains unclear, but several underlying mechanisms are possible: Nogo-A may either directly inhibit the generation of endothelial tip cells1–4 or may, once an endothelial tip cell has been formed, negatively influence its function, e.g., by anti-adhesive or collapse-inducing effects on the filopodia and lamellipodia, or may negatively regulate the stabilization of the transient endothelial tip cell phenotype. We previously showed that the Nogo-A specific fragment Nogo-A Delta 20 suppressed brain endothelial cell sprouting and migration by inducing lamellipodia and filopodia retraction in vitro. 9 Moreover, migration of vascular endothelial cells was inhibited by Nogo-A Delta 20, and, conversely, cell migration on the Nogo-A containing CNS myelin substrate was enhanced by anti-Nogo-A antibodies. 9 We proposed a direct cellular interaction between neurons or oligodendrocytes expressing Nogo-A at the surface membrane and endothelial tip cells expressing a Nogo-A receptor, resulting in cell body and filopodia retraction.4,9 Nogo-A Delta 20 binds to the recently identified Nogo-A specific receptor sphingosine-1-phosphate receptor 2 to inhibit neurite outgrowth and induce neuronal growth cone collapse. 36 Whether sphingosine-1-phosphate receptor 2—that has well-known functions in angiogenesis37—and the recently discovered Nogo-A Delta 20 co-receptor Tetraspanin-338 also act as receptors to mediate Nogo-A’s inhibitory effects on angiogenesis awaits further investigations.
Nogo-A deficiency does not disrupt the morphologic integrity of the newly formed vessel segments
Angiogenesis involves various cellular and molecular sub-mechanisms such as vessel sprouting, branching, endothelial cell proliferation and migration, and finally lumen formation1–5 that could be affected in a different proportion in Nogo-A-deficient animals. For example, increased vessel sprouting and branching would result in more vessel segments, enhanced endothelial cell proliferation and migration would lead to increased vessel length, and increased vessel proliferation or lumen formation would be associated with a bigger vessel diameter.1,3–5 In other words, a disproportional stimulation of angiogenesis could result in abnormal vessel morphology.39,40 However, despite a significantly increased number of vessel branchpoints and vessel segments in Nogo-A−/− as compared to the control mice average branchpoint degree and other relevant characteristics of the 3D brain vessel network such as vessel diameter, vessel length, vessel tortuosity, and vessel volume were not affected in the Nogo-A transgenic animals. Taken together, these results suggest the insertion of morphologically normal capillaries into the existing vasculature. Interestingly, this is in contrast to the effects of acute, uncontrolled VEGF-A overexpression that results in “angioma-genesis” rather than angiogenesis,39,40 e.g., more tortuous, dilated, and leaky vessels, thereby limiting possible therapeutic applications.40,41 On the other hand, in transgenic mice with brain-restricted VEGF165 overexpression, the additional capillary segments and micro-networks were also morphologically and functionally normal. 39 Of note, we previously found no hint for abnormal vessel morphology upon acute blockade of Nogo-A by anti-Nogo-A antibodies or acute adenovirus-mediated downregulation of Nogo-A. 9 Thus, genetic ablation of Nogo-A as well as acute blockade of Nogo-A seem to increase vessel sprouting while keeping vessel morphology and integrity intact, making Nogo-A inhibition a more promising pharmaceutical approach for therapeutic angiogenesis as compared to VEGF overexpression.
In summary, the very similar increases in vascular volume fraction, vessel branchpoints, and vessel segments in combination with unaltered vessel morphology in Nogo-A-deficient animals indicate that Nogo-A gene deletion enhances vascular volume fraction predominantly via increasing the number of vessel segments but without disturbing the balance with other angiogenic sub-mechanisms. Nevertheless, as the generation of additional blood vessels also requires increased endothelial cell proliferation, vascular lumen formation, and vessel anastomosis, future studies should address how Nogo-A affects endothelial cell proliferation for instance by using Ki-67 stainings or in vivo BrdU pulse labeling and also referring to Moesin, Par3, or PODXL stainings to investigate vascular lumen formation1,2 in P10 WT and Nogo-A−/− mice.
Insertion of complete capillary micro-networks upon Nogo-A gene deletion – a new model for 3D vascular network formation in the CNS?
A somewhat surprising finding was the unchanged capillary segment length in the Nogo-A knockout animals because one would rather expect a decreased segment length with increased vessel branchpoints at the capillary level: a new sprout arising somewhere along a capillary would introduce a new branchpoint and at the same time divide the original capillary segment into two shorter ones. In contrast, our results indicate that Nogo-A gene deletion increases the frequency of vessel sprouting, 9 leading to increased vessel branchpoint and segment numbers without affecting segment length (Figure 6(c)). One explanation could be that when new sprouts arise from pre-existing capillary segments, the new segments simultaneously grow longer and thereby reestablish the same initial length. However, this would be accompanied by an increased segment tortuosity that we did not observe in our transgenic animals. Thus, our data favor a branching and sprouting process where new capillary segments do not arise somewhere along the existing vessel but at the vessel- or capillary tip (Figure 6(b)). This again speaks for a direct inhibitory effect of Nogo-A on capillary sprouting rather than on sprouting from non-capillary vessels. As the technique of vascular corrosion casting only detects perfused, functional vessels but not newly formed and not-yet perfused vessel sprouts or endothelial tip cells,19,21,29 this means that Nogo-A gene deletion not only leads to new vessel segments but results in the formation of newly formed vessels that are functionally integrated into the pre-existing vasculature. From a network and functional perspective, the key question is how the newly formed vessel segments are inserted into the pre-existing vascular network. Based on our findings that Nogo-A mainly affects the capillary bed and that Nogo-A gene deletion does not alter vessel morphology (including vessel length), we therefore propose a working model in which Nogo-A gene deletion mainly results in the integration of entire, morphologically normal capillary micro-networks – and not just single capillary segments – into the pre-existing vascular network (Figure 6(a) and (b)). Interestingly, these findings in Nogo-A knockout mice are very similar to what we previously observed in the brain of VEGF165 overexpressing mice. 17 Thus, using vascular corrosion casting and 3D network analysis, we found similar characteristics of the vascular network upon both, gene deletion of an anti-angiogenic molecule (Nogo-A) as well as overexpression of a pro-angiogenic molecule (VEGF165) 17 (Figure 6(b)). In both conditions, the angiogenic stimulation resulted in the integration of complete capillary micro-networks with morphologically unaltered capillary segments into the existing 3D vasculature bed. These findings therefore suggest a new, fundamental mechanism of angiogenesis and vascular remodeling on how new vascular elements are integrated three-dimensionally into existing vascular networks. It will be of utmost interest to investigate whether other pro- and/or anti-angiogenic molecules affect the postnatal CNS vasculature in a similar manner at the network level.
A variety of CNS pathologies such as brain tumors or stroke depend on angiogenesis,1,4,5 and the modulation of the vasculature plays crucial roles in regenerative and tumor angiogenesis.1,2,4,5 Alterations of microvascular networks in rat brain glioma tumors as compared to healthy brains were previously reported using similar methods as described here. 32 Interestingly, Nogo-A expression seems to negatively correlate with the malignancy grade of oligodendrogliomas 42 and to serve as a tool to differentiate between oligodendrogliomas and the more densely vascularized glioblastomas, 43 suggesting that Nogo-A may also be involved in regulation of neo-angiogenesis in brain tumors.
Moreover, given the pro-angiogenic roles of Nogo-B and its specific receptor NgBR outside the CNS44–46 and with regard to the fact that Nogo-A is also expressed in the developing skin and in the developing as well as adult heart, 16 it will be interesting to investigate the role of Nogo-A on angiogenesis also outside the CNS.
In conclusion, the present study demonstrates a role for Nogo-A as an important negative regulator of angiogenesis, vessel sprouting/branching and finally 3D capillary micro-network formation during postnatal brain development. Moreover, we provide a potent methodology that allows to visualize and analyze 3D vascular networks during postnatal brain development. Finally, the specific combination of local morphometric parameters observed here (Figure 6(c)) suggests that upon Nogo-A deletion in our mice complete additional capillary networks had been interlaced into the pre-existing ones as the final stable result of increased angiogenesis and subsequent vascular remodeling. Together with our findings in VEGF165 overexpressing mice, 17 the observations in Nogo-A−/− mice further support our previous hypothesis that the “angiogenic quantum” is a micro-network and not a single capillary segment. 17 These findings boost our understanding of how angiogenesis and subsequent vascular remodeling in the postnatal brain are regulated from the level of endothelial tip cells up to the formation of perfused 3D vascular network structures.
Footnotes
Funding
The author(s) disclosed receipt of the following financial support for the research, authorship, and/or publication of this article: T.W. was supported by an MD-PhD fellowship of the Swiss National Science Foundation, by the Olga Mayenfisch Foundation, the Hartmann Müller Foundation, the EMDO Foundation, by the OPO Foundation, the “Filling the Gap” grant of the Medical Faculty of the University of Zurich, the Baasch-Medicus Foundation, the Fonds für Medizinische Forschung, the Swiss Heart Foundation, the Kurt und Senta Herrmann Foundation, the Novartis Foundation, and by the MD-PhD student allowance of the Swiss Society for Microvascular Research (SSMVR). P.C. was supported by a Federal Government Belgium grant (IUAP P7/03), long-term structural Methusalem funding by the Flemish Government (14/08), and a European Research Council (ERC) Advanced Research Grant (EU-ERC269073). M.E.S was supported by grants of the Swiss National Science Foundation (31003A-149351-1) and an advanced grant of the European Research council (ERC GrantNr. 294115 “Nogorise”). J.V. was supported by the Swiss National Science Foundation (no. 310000 120321/1). S.P.H. was supported by the Swiss Heart Foundation.
Acknowledgments
Declaration of Conflicting Interests
The author(s) declared no potential conflicts of interest with respect to the research, authorship, and/or publication of this article.
Authors’ contributions
T.W., M.E.S., J.V., and S.P.H. designed the experiments. T.W., A.U.S., E.M., and C.H. conducted the experiments. T.W., J.V., A.U.S., and C.H. analyzed the data. T.W., J.V., and S.P.H wrote the paper. M.E.S., O.B., L.R., M.Y.E, M.S., and P.C. gave critical inputs to the manuscript. All authors read and approved the final version of the manuscript.
References
Supplementary Material
Please find the following supplemental material available below.
For Open Access articles published under a Creative Commons License, all supplemental material carries the same license as the article it is associated with.
For non-Open Access articles published, all supplemental material carries a non-exclusive license, and permission requests for re-use of supplemental material or any part of supplemental material shall be sent directly to the copyright owner as specified in the copyright notice associated with the article.