
Abstract
Aerobic activity has been shown highly beneficial to brain health, yet much uncertainty still surrounds the effects of exercise on the functioning of cerebral microvasculature. This study used two-photon fluorescence microscopy to examine cerebral hemodynamic alterations as well as accompanying geometric changes in the cortical microvascular network following five weeks of voluntary exercise in transgenic mice endogenously expressing tdTomato in vascular endothelial cells to allow visualization of microvessels irrespective of their perfusion levels. We found a diminished microvascular response to a hypercapnic challenge (10% FiCO2) in running mice when compared to that in nonrunning controls despite commensurate increases in transcutaneous CO2 tension. The flow increase to hypercapnia in runners was 70% lower than that in nonrunners (p = 0.0070) and the runners’ arteriolar red blood cell speed changed by only half the amount seen in nonrunners (p = 0.0085). No changes were seen in resting hemodynamics or in the systemic physiological parameters measured. Although a few unperfused new vessels were observed on visual inspection, running did not produce significant morphological differences in the microvascular morphometric parameters, quantified following semiautomated tracking of the microvascular networks. We propose that voluntary running led to increased cortical microvascular efficiency and desensitization to CO2 elevation.
Introduction
Physical exercise can be a powerful tool for promoting brain health. Regular aerobic exercise has been shown to enhance performance on cognitive tasks in aged humans1–6 and in learning and memory tests in animals.7–13 In addition, physical exercise may be protective against Alzheimer’s disease8,9,14–20 and may enhance recovery from both stroke21–25 and traumatic brain injury. 11 However, the changes in brain morphology and function underlying these effects remain incompletely understood.
Changes in cerebrovascular function in response to physical exercise may in part explain its beneficial effects on brain function. In aged humans who exhibit cerebral hypoperfusion, 26 regular exercise is associated with decreased blood pressure,3,27 increased cerebral blood volume (CBV) in the hippocampus, 1 increased resting cerebral blood flow (CBF),28–30 and increased cerebrovascular conductance.3,30 Effects of exercise on blood flow increase to hypercapnia have been varied, with some studies showing higher cerebrovascular reactivity (CVR),3,30–32 others showing decreased CVR,29,31 and still others reporting no changes in CVR with exercise. 33 On the other hand, preclinical research has shown regionally specific increases in CBV and CBF in rodents,1,34,35 with Swain et al. reporting increased vascular reactivity to hypercapnia in the motor cortex. 34
In addition, age-related increases in oxidative stress have been shown to decrease with exercise in both humans 27 and rodents.7,36 The antioxidative effects of exercise increase bioavailability of nitric oxide (NO),24,25,36–40 which may be beneficial to the vasculature since low NO levels have been linked to vascular dysfunction.27,41 Similarly, exercise induced increased expression of neuroprotective/antioxidant markers.11,37
Brain structural changes have also been observed. With exercise, humans exhibit gray and white matter volume increases, 2 increases in microvascular density, and decreased cerebrovascular tortuosity. 42 Experimental animals on exercise regimes have shown increases in brain volume and cortical thickness;43–46 neurogenesis in the hippocampus;1,10,13,47–49 and angiogenesis in the cortex,34,50,51 hippocampus,48,49 and cerebellum.45,52,53 While rodent studies to date employed different forms of environmental enrichment in addition to an exercise wheel, it appears that the running component is the driving force at least for the neurogenesis and increased brain-derived neurotrophic factor (BDNF) peptide levels seen within the hippocampus. 54 Angiogenic and neurogenic effects of physical exercise take at least three days to present 49 and the elevated blood vessel density and neurogenesis are eventually extinguished after cessation of exercise.12,49
Notwithstanding, it has yet to be determined what brain functional hemodynamic changes occur at the microvascular level due to chronic exercise and how they may be coupled to morphological alterations in situ. Two-photon fluorescence microscopy (2PFM) provides an excellent way to image the hemodynamic changes at the micrometer scale. Bolus tracking and red blood cell (RBC) speed measurements during hypercapnia55,56 can be performed with 2PFM to measure the vasodilatory response to CO2 elevation at the microvascular level. In addition, high resolution 2PFM data on the mouse cortical microvascular architecture can be concomitantly acquired so as to assess exercise-induced changes in microvascular morphology. These assays were conducted presently to evaluate structural and functional changes in the cortical microvasculature following five weeks of voluntary exercise. We used Cre x tdTomato mice endogenously expressing tdTomato in vascular endothelial cells so as to assess angiogenesis at prelumen formation stages. Oregon Green dextran was injected intravascularly to measure bolus transit and RBC speed changes induced by hypercapnia.
Materials and methods
Animals
All experimental procedures in this study were approved by the Animal Care Committee of the Sunnybrook Health Sciences Center, which adheres to the Policies and Guidelines of the Canadian Council on Animal Care and meets all the requirements of the Provincial statute of Ontario, Animals for Research Act as well as those of the Federal Health of Animals Act. All animal experiments complied with the ARRIVE guidelines. 57 Thirty-five 12-week old Cre x tdTomato mice (B6.Cg-Tg(Tek-cre)1Ywa/JxB6; 129S6-Gt(ROSA)26Sortm14(CAG-tdTomato)Hze/J), bred in house, were used in this study: see Supplementary Table 1 for detailed description of animal allocation within study. These mice express tdTomato (a red fluorescent protein with an emission wavelength maximum of 581 nm) under the direction of the murine Tie2 promoter in endothelial cells. 58 Mice were randomly assigned into two groups: five weeks of voluntary exercise group (n = 19) and a nonrunning control group (n = 16). Three extra mice were assigned to the runner group to address lack of interest observed in prior work. Exercise mice had free access, within their standard cage, to a 5 in. inner diameter aluminum exercise wheel (Lafayette Instruments, Lafayette, IN, USA) affixed to the cage lid with an electronic odometer for daily readouts of the distance run. Additional animal enrichment included bedding (Aspen Sani-Chips, Harlan, Indianapolis, IN, USA), nestlets, and plastic mouse houses. Control mice were housed in the same conditions excluding the running wheel. Mice were allowed food and water ad libitum, with cages on ventilated racks and kept on a 12 h light/dark cycle with lights on at 7:00 am and off at 7:00 pm. Animal experimentation occurred during daytime light cycle following five weeks of voluntary running. Animals were euthanized by an overdose of sodium pentobarbital immediately following image acquisition. Four mice were lost to attrition: three died during the course of surgery and one died during image acquisition (cf. Supplementary Table 1).
Surgical preparation
Surgical procedures have been described in detail previously.59,60 Briefly, mice (average weight ± standard deviation of 24 ± 4 g) were anesthetized via inhalation of isoflurane (5% induction; 1–2% maintenance). Body temperature was kept at 37.5℃ using a heating pad, with feedback control input afforded by the rectal probe (TC-1000, CWE Inc., Ardmore, PA). Hydration was maintained with subcutaneous injections of 0.5–1.0 ml Ringer’s solution. Animals were tracheostomized, mechanically ventilated (SAR 830/P, CWE Inc., Ardmore, PA) with 21% O2 and balance nitrogen, and placed in a stereotaxic frame, with the head secured by ear and incisor bars. A circular cranial window, approximately 3 mm in diameter, was centered over the primary motor cortex (1.75 mm medial–lateral and + 1.5 mm anterior–posterior relative to bregma). The cranial window was closed with a 5 mm circular glass coverslip (World Precision Instruments) secured to the surrounding skull with cyanoacrylate adhesive, and the dental cement-based well around the cranial window was filled with double distilled water for the water dipping objective. End tidal respiratory pressure and CO2, transcutaneous CO2, temperature, O2 saturation, breath and pulse distension, and heart rate were recorded throughout surgery and imaging (Biopac MP150 Biopac Systems Inc., Goleta, CA; microcapstar CWE Inc., Ardmore, PA; TCM4 Radiometer, Copenhagen Denmark; MouseOx, Starr Life Sciences Corp, Oakmont, PA). Isoflurane was lowered to 1–1.25% during imaging. A gas mixer (GSM-3, CWE Inc.), triggered by the microscope image acquisition was used to deliver a mixture of 10% CO2, 21% O2, and balance nitrogen during 3–4 hypercapnic challenges that lasted at most 3 min, with an air-breathing period of 10 min between challenges.
Image acquisition
A tail vein catheter was implanted for the intravascular injection of fluorescent dextran (70 kDa Oregon green 33 mg/kg, dissolved in PBS; Invitrogen). In six animals, the tail vein catheterization failed, so Sulforhodamine 101 (SR101) was dissolved in PBS and injected intraperitoneally (10 mM solution, 8 μl/g) and line scans acquired as described below. The animal was placed in the stereotaxic frame with head secured by ear bars and an incisor bar. It was then positioned under a 25 × 1.05 NA objective with a working distance of 2 mm and a field of view of 509 µm × 509 µm (Olympus, Tokyo, Japan), with the animal and stage rotated to render the exposed cortical surface horizontal. Scanning was performed using a multiphoton laser scanning microscope (FV1000MPE Olympus, Tokyo, Japan). A Mai Tai mode-locked Titanium Sapphire tunable laser (690–1040 nm; Newport Corp, Irvine, CA) was used to excite the Oregon green dextran at 910 nm for bolus tracking scans, 900 nm for SR 101 line scans, and 985 nm for exciting both Oregon green and tdTomato during line scans and z-stacks. An external photomultiplier tube (Hamamatsu, Hamamatsu City, Japan) collected the resulting fluorescent emissions following bandpass filtering of 495/540 nm for Oregon green and 575/630 nm for tdTomato.
We performed three types of acquisitions. To estimate vascular transit times, four paired bolus injections of 30 μl (8.25 mg/kg, for a total of 33 mg/kg) of Oregon green were administered via the tail vein catheter during normocapnia and in the course of hypercapnia (10% CO2 in the gas mixer delivered via GSM). A series of 2D frames were acquired during each bolus in a single transverse plane at 150 µm below the brain surface for the first pair and at 125 µm below the pial surface for the second pair, with 509 µm × 255 µm FOV, 2 µm × 2 µm nominal in-plane resolution, 2 μs/pixel, and ∼230 ms/frame, for a total scan time of 60 s. To evaluate angiogenesis, z-stacks of 2D images parallel to the cortical surface were acquired between the pial surface and 300–700 µm below cortical surface, every 1.5 µm, with nominal in-plane resolution of 0.5–1.0 µm × 0.5–1.0 µm; and dwell time of 4–8 μs/pixel, for a total scan time of up to 45 min. Finally, paired line scans along the apparent centerlines of primary branches of cortical penetrating vessels were acquired to measure RBC velocities during normocapnia and hypercapnia. Each line scan comprised 10,000 lines acquired over ∼12 s at 2 μs/pixel, ∼1.2 ms/line, and a nominal spatial resolution of 0.5 µm/pixel.
Image analysis
All image segmentation was conducted by observers blinded to running and nonrunning groups. Maximum intensity projection (MIP) images were created with Imaris (Bitplane) software. Penetrating vessels were designated arterioles or venules based on their morphological features and branching pattern61–64 as seen in the XYZ scans. Those cortical penetrating vessels exhibiting few branches across the imaged cortical depth, having a large capillary free space in their surround, and having a fairly constant diameter throughout their length were designated as arterioles. In turn, vessels showing more branches, a smaller capillary free space in their surround, and a diameter that progressively increased toward the cortical surface were deemed veins. Vessels with diameter less than 10 µm 65 not directly connected to a penetrating vessel were labeled as capillaries. Those vessels that did not have Oregon green dextran within their lumen but still showed tdTomato endothelial expression were designated as newly formed.
Automated vessel tracking, as described in Rennie et al. 66 and Ghanavati et al. 67 was performed on the Oregon Green perfused cortical vessels imaged in the z-stacks. This algorithm follows the centerlines of vessels, which are represented as discrete medial atoms. 68 The centerline is sampled every micrometer along the vessel by optimizing the position and radius of an image operator, which is defined by eight spokes extending from the atom to the vessel boundary, thus identifying centerline location, local tangent to the vessel, and vessel radius. The cost function optimized is the sum of the signal intensity gradients at the end of each spoke.
Each image was convolved with a 2D median filter (3 µm × 3 µm) and a 2D Gaussian blurring kernel with a full width at half maximum (FWHM) of 3 µm and then resampled to an isotropic voxel size of 1.5 µm × 1.5 µm × 1.5 µm. Tracing of vessels was initiated from numerous seed locations inside the vessels to enhance the likelihood of all vessels being traced. All voxels deemed within the foreground (based on manual signal thresholding) that were a local signal intensity maximum of the six nearest neighbors were selected as seed locations (to ensure most seeds were proximal to the centerlines of the vessels). To minimize computation time, tracking was not initiated in seeds located in a previously tracked vessel. The resulting graph was then used to gather data on morphological features of the microvasculature such as branch density, vessel density, diameter, length, and tortuosity. Figure 1(b) shows an example vessel-tracked data set. Three-dimensional rendering of vessel tracked data was created using Display (MINC tool kit, McConnel Brain Imaging Centre).
Maximum intensity projection normal to the cortical surface and centered over the primary motor cortex of a Cre x tdTomato mouse with vascular endothelial cells expressing tdTomato (red) and Oregon green dextran distributed within plasma (green) (a, scale 50 µm). The vessel-tracked vascular tree for this data set is seen in (d), scale 50 µm. Insets are of a penetrating vessel from the top (b, scale 20 µm) and the side showing the composite (c, scale 30 µm), green only (e, scale 30 µm), and red only (f, scale 30 µm) channel data.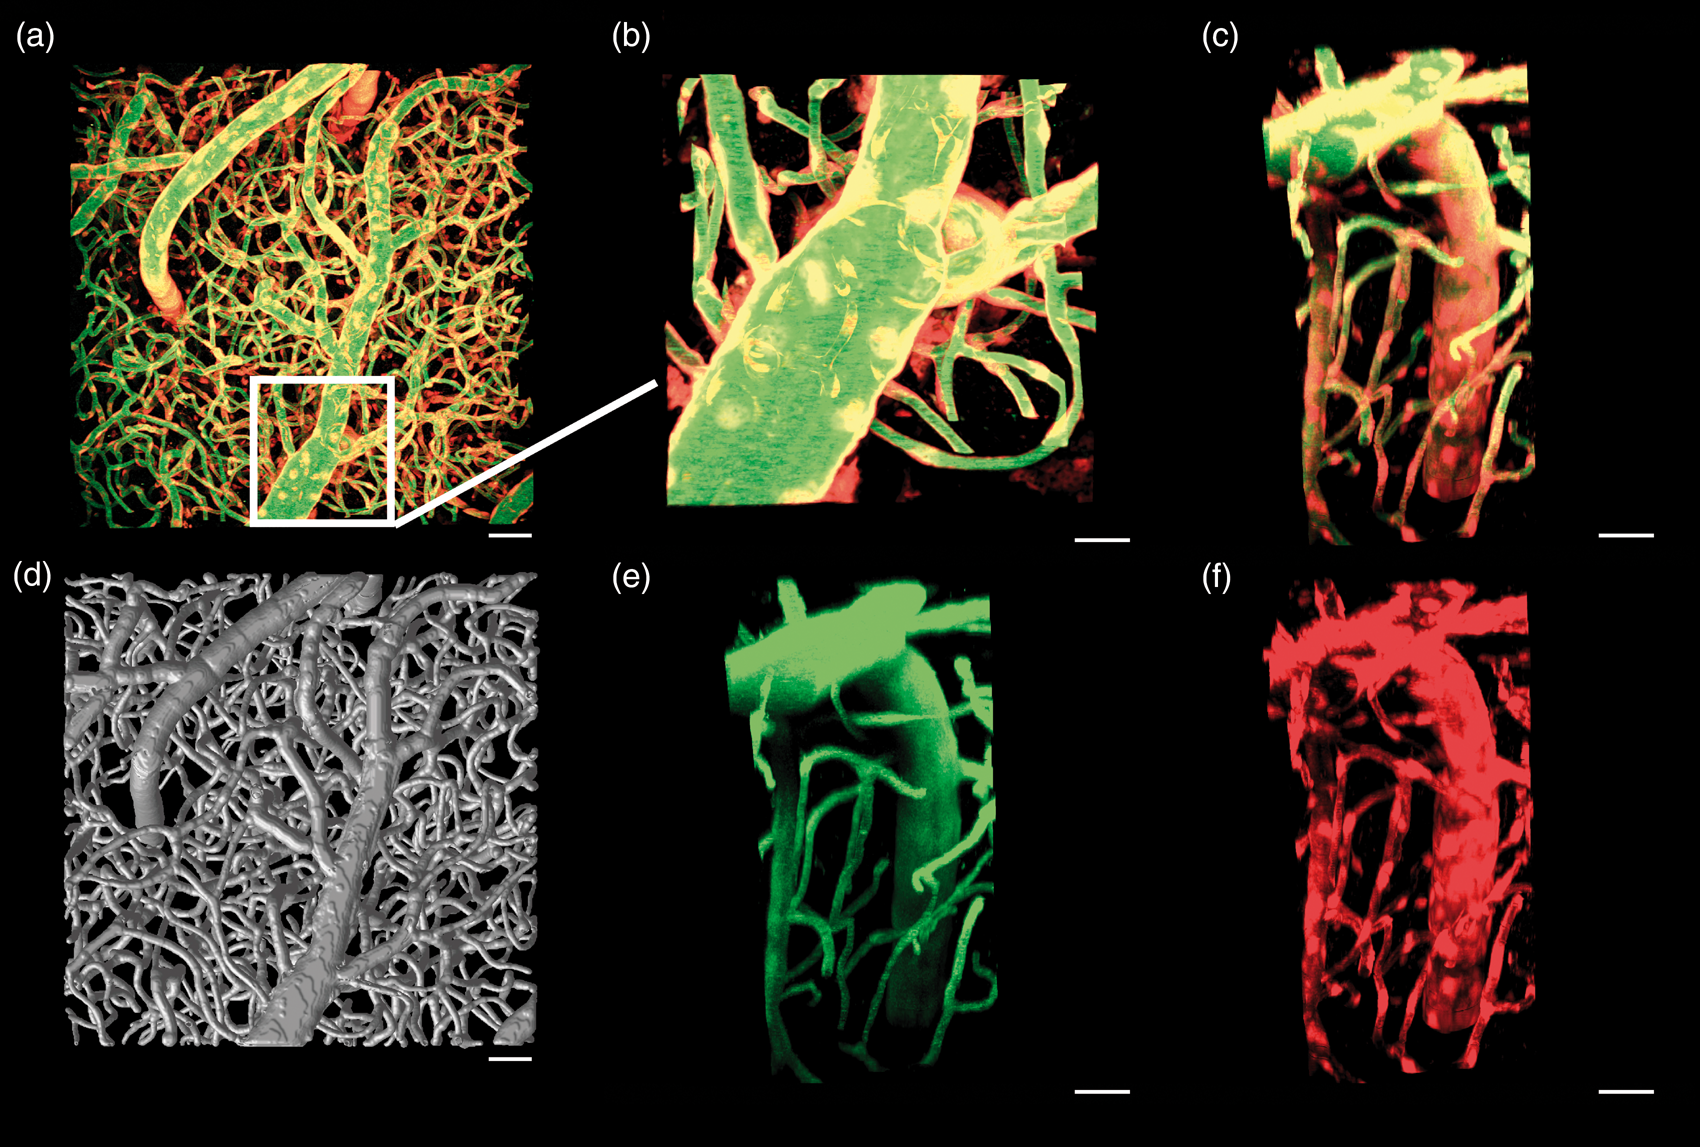
The bolus time series data acquired during normocapnia and hypercapnia were 2D median filtered (3 × 3 voxel kernel in x and y). MIP was performed on the filtered time series and the vessels of interest segmented semiautomatically. The average vessel signal intensity time series for each vessel in the imaging FOV was computed and normalized to the peak signal intensity of that vessel; the transit times were then analyzed across all vessels of the same vessel type (i.e. across all arterioles, capillaries, venules) on a population level. The bolus passage, during both normocapnia and hypercapnia, was next modeled using the gamma variate function,69,70 as described previously.55,71
RBC speed estimates from line scans were calculated as described previously. 71 Data were filtered with a median filter (kernel size 2 × 2 pixels), followed by a Gaussian filter (kernel size 1 × 1 pixel) and the RBC speed then estimated using an algorithm based on Schaffer et al. 72
Statistical analysis
All data were analyzed using linear mixed effects analysis (lme function in nlme package, R), with animals treated as random variables. This modeling yields sensible restricted maximum likelihood estimates from unbalanced allocation of animals by factors presently resulting from attrition. 73 For vessel morphology measurements, average radius, length, and tortuosity were modeled as linear mixed effects functions of treatment (nonrunners, runners) and vessel type (arteriole, capillary, venule). For bolus tracking analysis, we modeled the time-to-peak (TTP) under hypercapnia as a linear function of two fixed effects: treatment (nonrunners, runners) and TTP under air breathing. We thereby evaluated the interaction between treatment and TTP under air on TTP under hypercapnia, so as to test for differences in slopes of TTP under hypercapnia versus TTP under air in runners versus nonrunners. 74 Compared to other slope comparison tests, linear mixed effects models have the advantage of accounting for within- and between-subject variation. The flow change was estimated from the inverse of the respective slope. Specifically, the decreased dispersion of TTP during hypercapnia relative to normocapnia under physiological conditions56,59,75,76 was interpreted as a corresponding and proportionate increase in blood flow. For line scan data analysis, the change in arterial RBC speed induced by CO2 challenge was modeled as a linear function of treatment.
Results
No effects of running on systemic physiology or microvascular morphology
Systemic physiology of the runners and nonrunners.
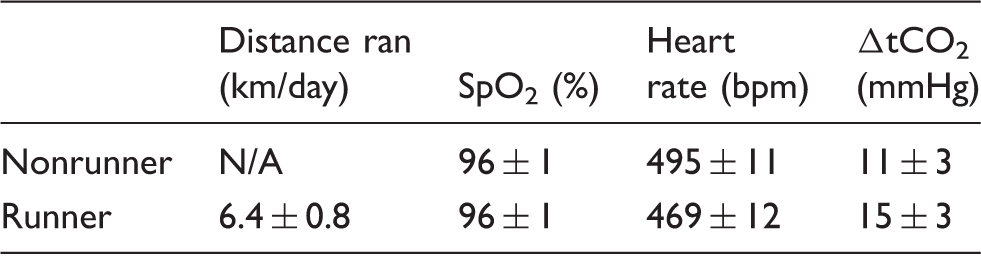
Arterial blood oxygenation (SpO2 in %), heart rate (bpm), and change in transcutaneous CO2 induced by hypercapnia. There were no significant differences between nonrunners and runners in any measures, but there was a trend of lower heart rate in the runners (p = 0.12). Mean ± SEM.
Figure 1 shows MIP from an XYZ scan of a Cre x tdTomato nonrunner mouse. TdTomato expression provides a strong signal from the endothelium, while Oregon dextran distributes within plasma.
Figure 2 shows data from an example runner mouse: top (a) and side (b) MIP, as well as two example vessel segments found in layers II/III (indicated by blue arrows in (c) and (d)) not perfused with plasma, which may be newly formed vessels as we expect all mature capillaries to be perfused with plasma in a healthy brain.76,77 (Similar evidence of angiogenesis has been reported using another endothelial–intravascular dye combination on 2PFM in the remodeling vascular tree of early postnatal brain and in hypoxia challenged adult mice.
78
)
Maximum intensity projection of a two-photon fluorescence microscopy z-stack from the surface of the motor cortex (a, scale 50 µm) and side angle (b, scale 100 µm) with red showing vascular endothelial cells expressing tdTomato and green showing intravascular Oregon green. (c) and (d) (scale 10 µm) shows tdTomato labeling in the absence of Oregon green labeling (blue arrows), suggesting a new vessel.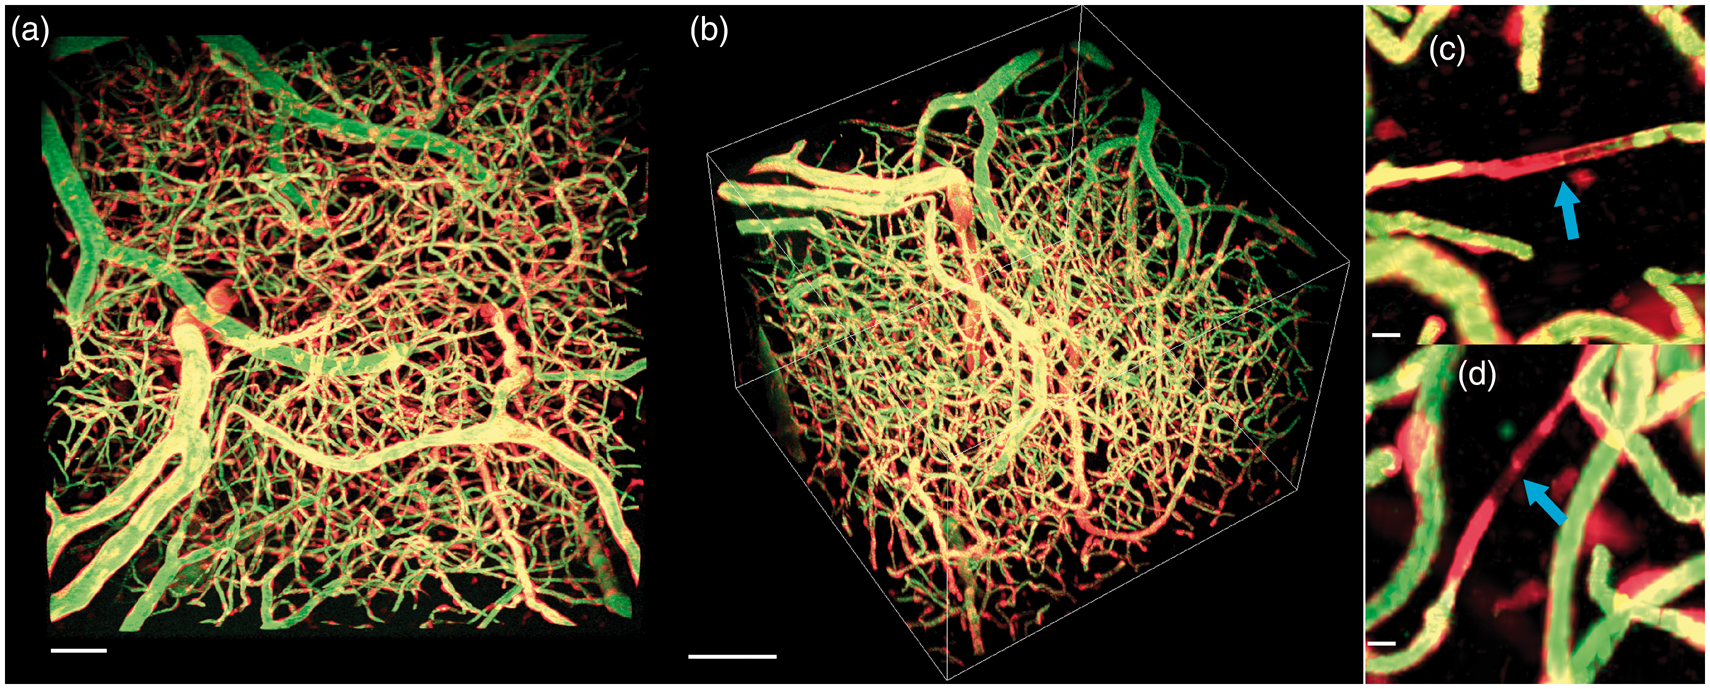
Cortical microvasculature morphological characterization.
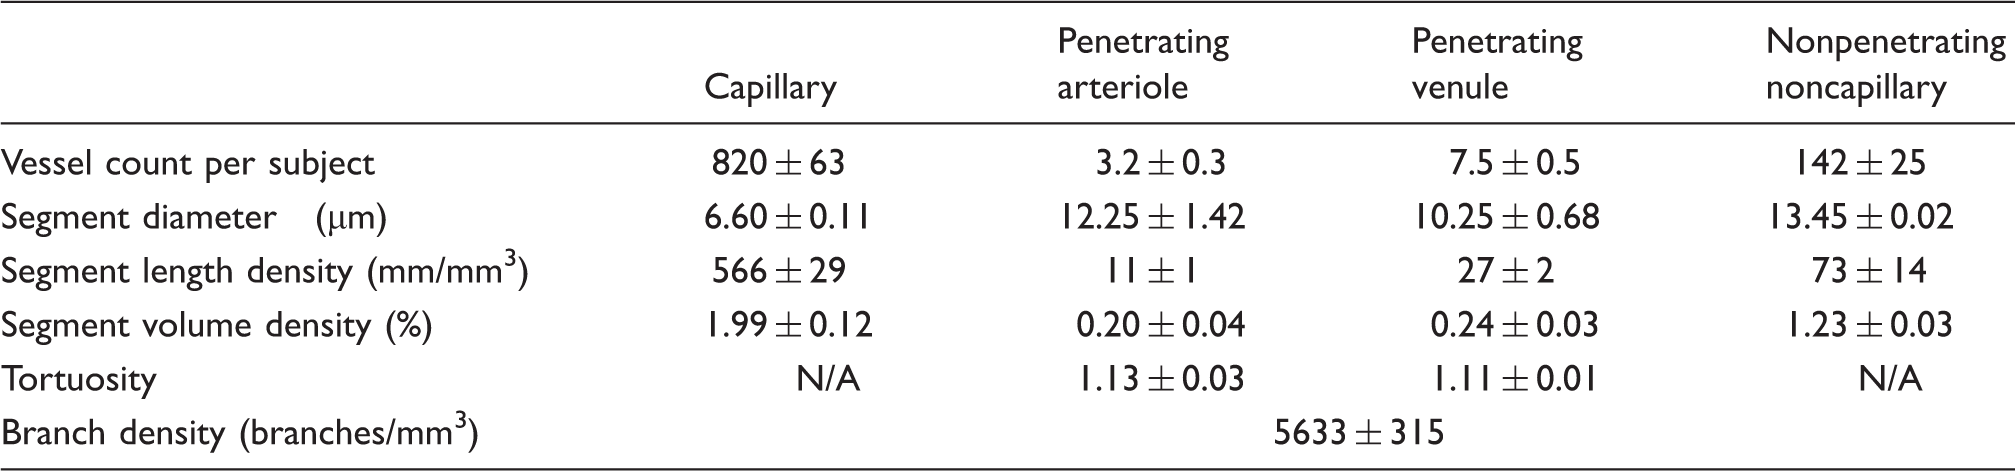
Morphological characterization of the cortical microvascular networks imaged. The data from runners and nonrunners have been pooled due to absence of significant differences in any of the parameters examined. The average across-animal cortical vascular density was 3.5 ± 0.3%. NA = not applicable. Mean ± SEM, N = 16 mice.
Attenuation of blood flow response to hypercapnia after voluntary exercise
To examine functional changes in cerebral vasculature induced by voluntary exercise, we followed the passage of a fluorescent dextran bolus through the microvascular bed at 125–150 µm beneath the cortical surface in 11 nonrunners and 11 runners. The signal peaked first in the artery, then in capillaries, and lastly in the veins (Figure 3(a) and (b) showing the signal time traces in a sample artery and a sample vein). Inhalation of 10% CO2 induces a drop in pH and a robust cerebral (and peripheral) vasodilation and blood flow increase. Figure 3(c) and (d) shows signal traces in an example artery and vein from a nonrunner during air breathing (c) and during hypercapnia (d), showing the quickening of bolus transit through both vessels in response to hypercapnia. Similar changes are qualitatively observed in signal traces of an example artery and vein of a runner mouse, in Figure 3(e) (air breathing) and (f) (hypercapnia), but with an attenuated CO2 induced shortening of arterial transit time. Due to the small lateral FOV and limited light penetration depth relative to the extent of mouse cortical cerebrovascular network, it is frequently not possible to ascertain whether a given pair of vessels are closely connected, precluding assessment of the effects of the vessel’s branching order on the transit time.
86
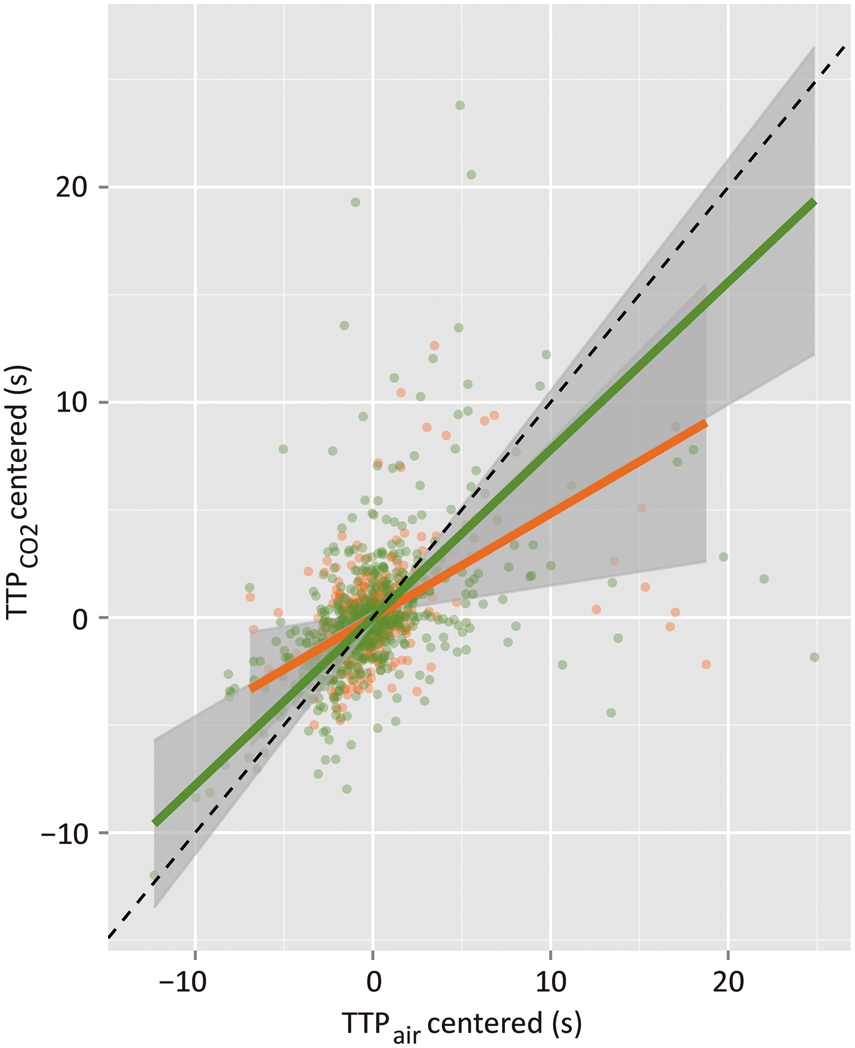
Flow was estimated by inverse slope of Deming regression to hypercapnic versus normocapnic TTP data across all vessels (since no vessel-type effects were found), as shown in Figure 4. (Deming regression
87
minimizes the sum of distances in both the x and y, appropriate presently in light of errors on TTP estimates both during air breathing and during hypercapnia.) Runners exhibited a higher slope than did the nonrunners (0.78 ± 0.15 in runners versus 0.48 ± 0.18 in nonrunners; p = 0.0070), indicating a lower flow increase to hypercapnia in runners than in nonrunners. In particular, flow increased by a factor of 1.3 ± 0.2 in response to hypercapnia in runners and by a factor of 2.1 ± 0.8 in response to the same challenge in nonrunners. Of note, there was no difference in the hypercapnia-induced increase in transcutaneous CO2 tension in these two groups (p = 0.90), suggesting that the observed attenuation of CVR was not secondary to peripheral adaptation.
Samples of a bolus scan time series at a cortical depth of ∼150 µm, showing the bolus arrival first in an artery (a, middle panel; b, red pseudocolor), then in capillaries, and lastly in a vein (a, last panel; b, blue pseudocolor). The mean fluorescence signal change over time in the artery (red) and in the vein (blue) during air (c) and hypercapnia (d) in a nonrunner mouse. The bolus transit is faster in the sample artery than in the sample vein in both conditions; the bolus transit is shortened in each vessel under hypercapnic mixture versus air breathing (mean ± stdev based on signal variation within the vessel). Artery: TTP = 2.28 ± 0.04 s during air, TTP = 1.84 ± 0.05 s during hypercapnia. Vein: TTP = 2.93 ± 0.30 s during air, TTP = 2.35 ± 0.04 s during hypercapnia. The mean signal change over time for an exercise mouse during air (e) and hypercapnia (f); bolus transit time during hypercapnia is shortened for the vein, but minimally affected for the artery. Artery: TTP = 2.00 ± 0.02 s during air, TTP = 1.78 ± 0.06 s during hypercapnia. Vein: TTP = 3.30 ± 0.05 s during air, TTP = 2.42 ± 0.07 s during hypercapnia. Scatterplot of the estimates of the time-to-peak intensity of the fluorescent signal over the course of the bolus passage in each scanned vessel during hypercapnic challenge (y-axis) versus that during air breathing (x-axis) (N = 11 runners, N = 11 nonrunners). The slope of the Deming regression to these data was 0.78 ± 0.15 in the runners (green line) and 0.48 ± 0.18 in the nonrunners (orange line). Flow change to hypercapnia was estimated by the inverse of the slope of the regression: flow thus increased in response to 10% CO2 inhalation by a factor of 1.3 ± 0.2 in runners and by a factor of 2.1 ± 0.8 in nonrunners.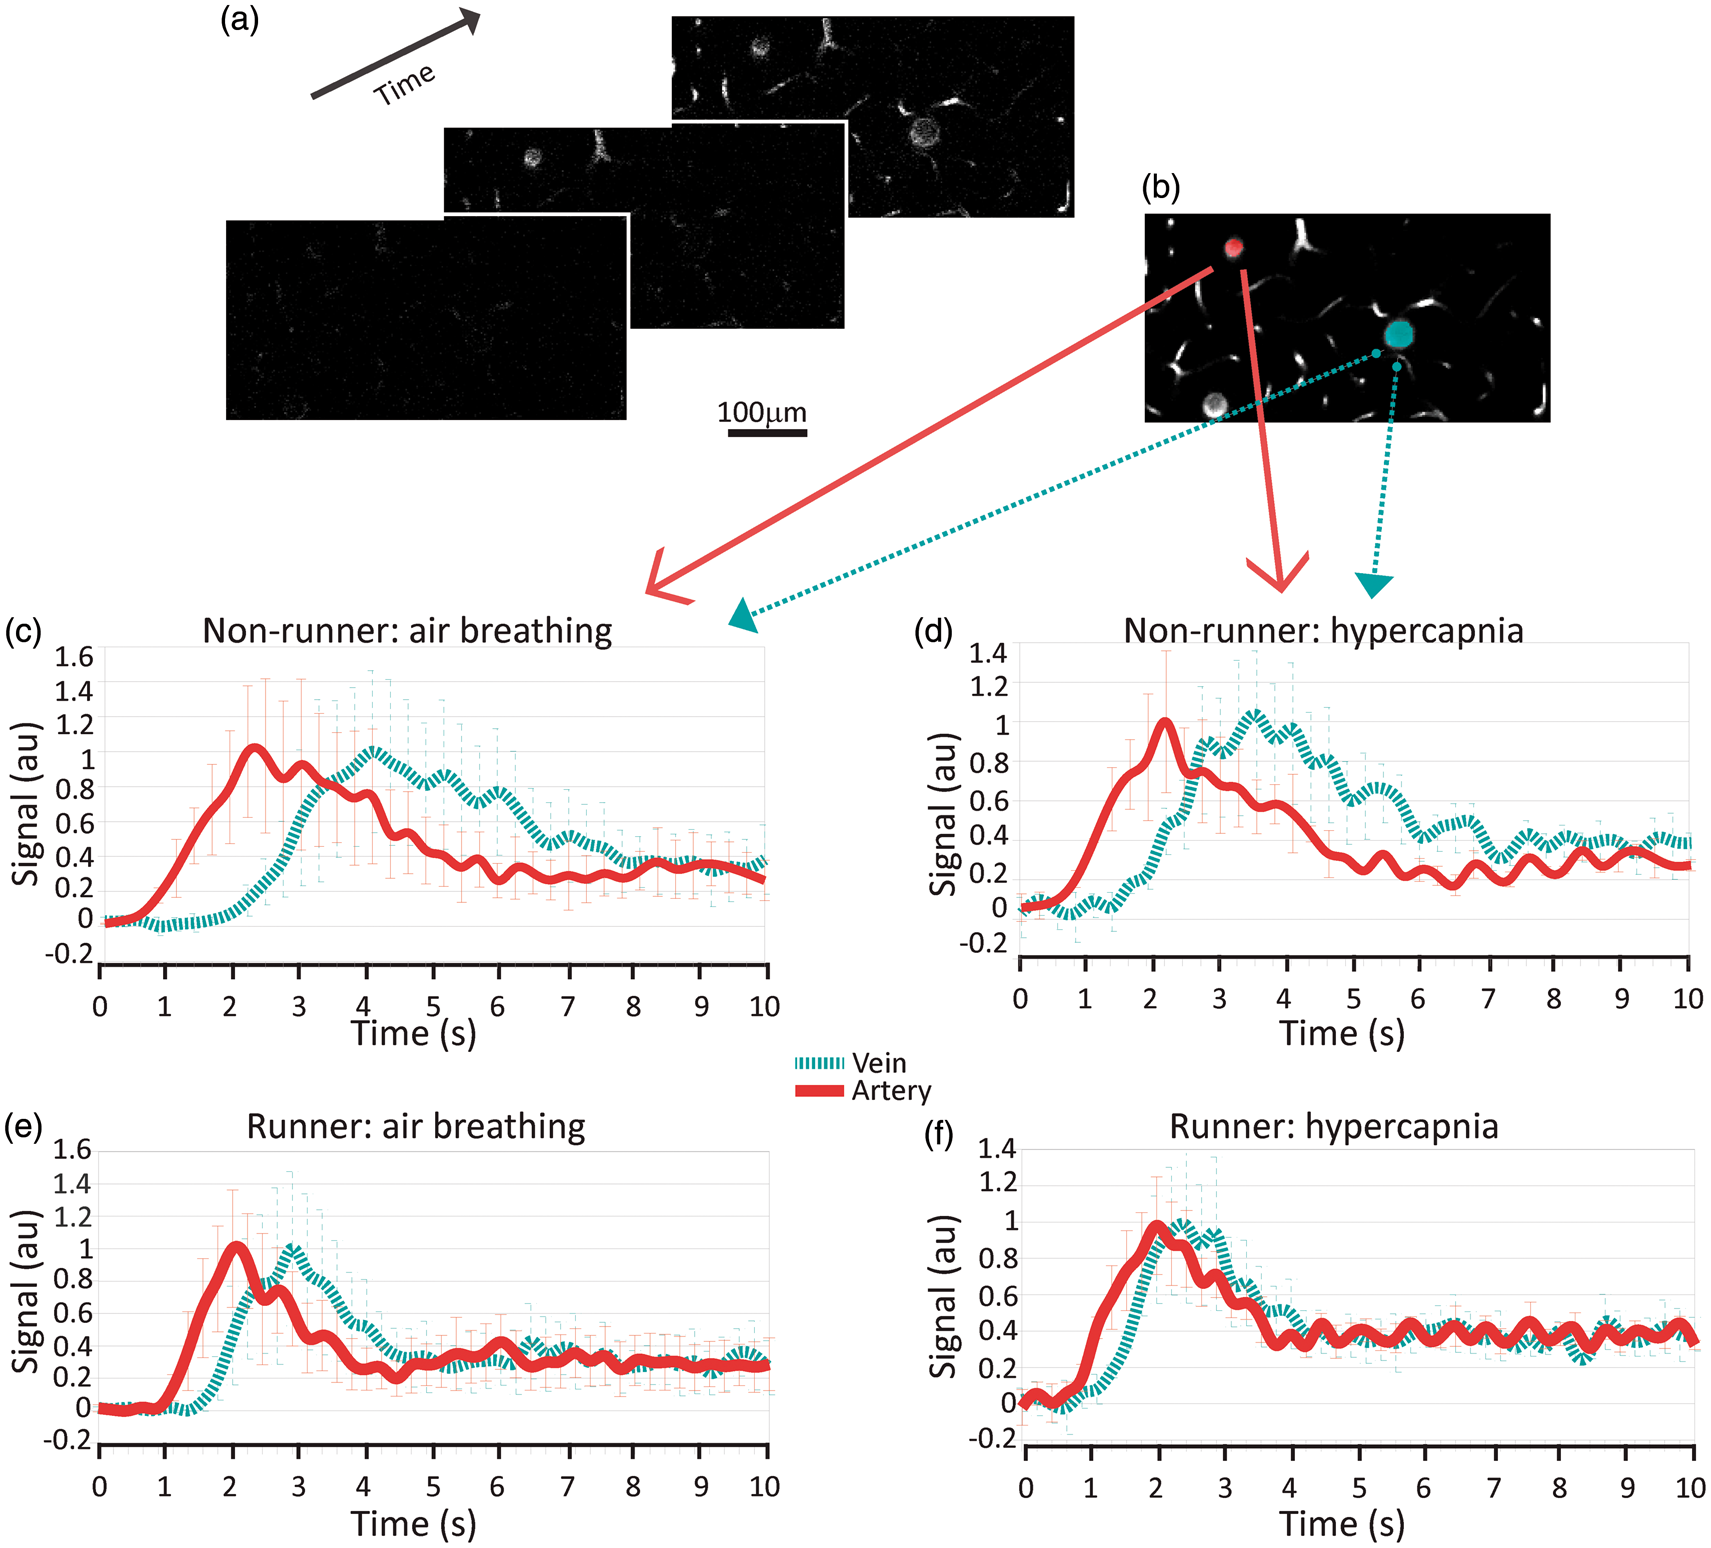
Voluntary running-induced attenuation of arteriolar RBC speed increase to hypercapnia
Sample line scan data, acquired to allow estimation of RBC speeds, are shown in Figure 5. A section of the centerline of a primary branch of a penetrating vessel (Figure 5(a) and (b)) was imaged during both air (Figure 5(c)) and 10% CO2 breathing (Figure 5(d)). No effect of running was seen on resting arteriolar RBC speed (2.4 ± 0.1 mm/s in runners (N = 4 mice); 2.3 ± 0.1 mm/s nonrunners (N = 5 mice); p = 0.99). Paralleling bolus tracking findings on hypercapnia-induced flow increases in the two cohorts, runners showed a smaller increase in RBC speed (0.44 ± 0.05 mm/s) in response to hypercapnia than did the nonrunners (0.85 ± 0.05 mm/s) (Figure 5(e)), by 0.45 ± 0.13 mm/s (p = 0.0085). Of note, however, in the animals for which arteriolar vRBC was evaluated, there was a trend toward smaller (by 8.3 ± 4.4 mmHg; p = 0.1) hypercapnia-induced increase in transcutaneous CO2 in comparison to that of the nonrunning controls, suggesting that there may have been some differential effect on the periphery. In addition, runners showed a lower RBC speed increase across all vessels (N = 14 mice) with tCO2 than did the nonrunners (N = 13 mice): runners: 0.0029 ± 0.0012 mm/s/mmHg; nonrunners: 0.014 ± 0.002 mm/s/mmHg (p = 1 e-5). Finally, runners exhibited decreased arteriolar RBC speed reactivity to tCO2 elevation than did nonrunners: 0.021 ± 0.002 mm/s/mmHg (runners) versus 0.030 ± 0.002 mm/s/mmHg (nonrunners) (p = 0.0026). Ignoring a particularly avid runner (averaging 9 km/day versus 5–7 km/day for the rest), there was a trend toward lower arteriolar RBC speed during air breathing with increasing total distance ran (p = 0.08); and a trend toward lower arteriolar RBC speed during hypercapnia with increasing total distance ran (p = 0.10), suggesting progressive increase in the system’s efficiency (with respect to cerebral perfusion) with additional running, followed by eventual saturation of this effect (with extreme running). On the other hand, tCO2 levels (during air or hypercapnic mixture breathing) were not affected by the distance ran (p = 0.2; p = 0.4 for air and hypercapnic conditions, respectively).
RBC speeds are measured in a penetrating vessel branch of an artery (a, scale 80 µm, and b, scale 10 µm, with pink line showing location of line scan). Line scan data samples from this vessel during air (c) and hypercapnia (d). RBC speeds thus estimated in this vessel were 1.32 ± 0.02 mm/s during air breathing and 1.86 ± 0.03 mm/s during breathing of 10% CO2. Steeper slopes indicate smaller RBC speeds. Bar graph (e) showing change in arteriolar RBC speed induced by hypercapnia for nonrunners (N = 5) and runners (N = 4).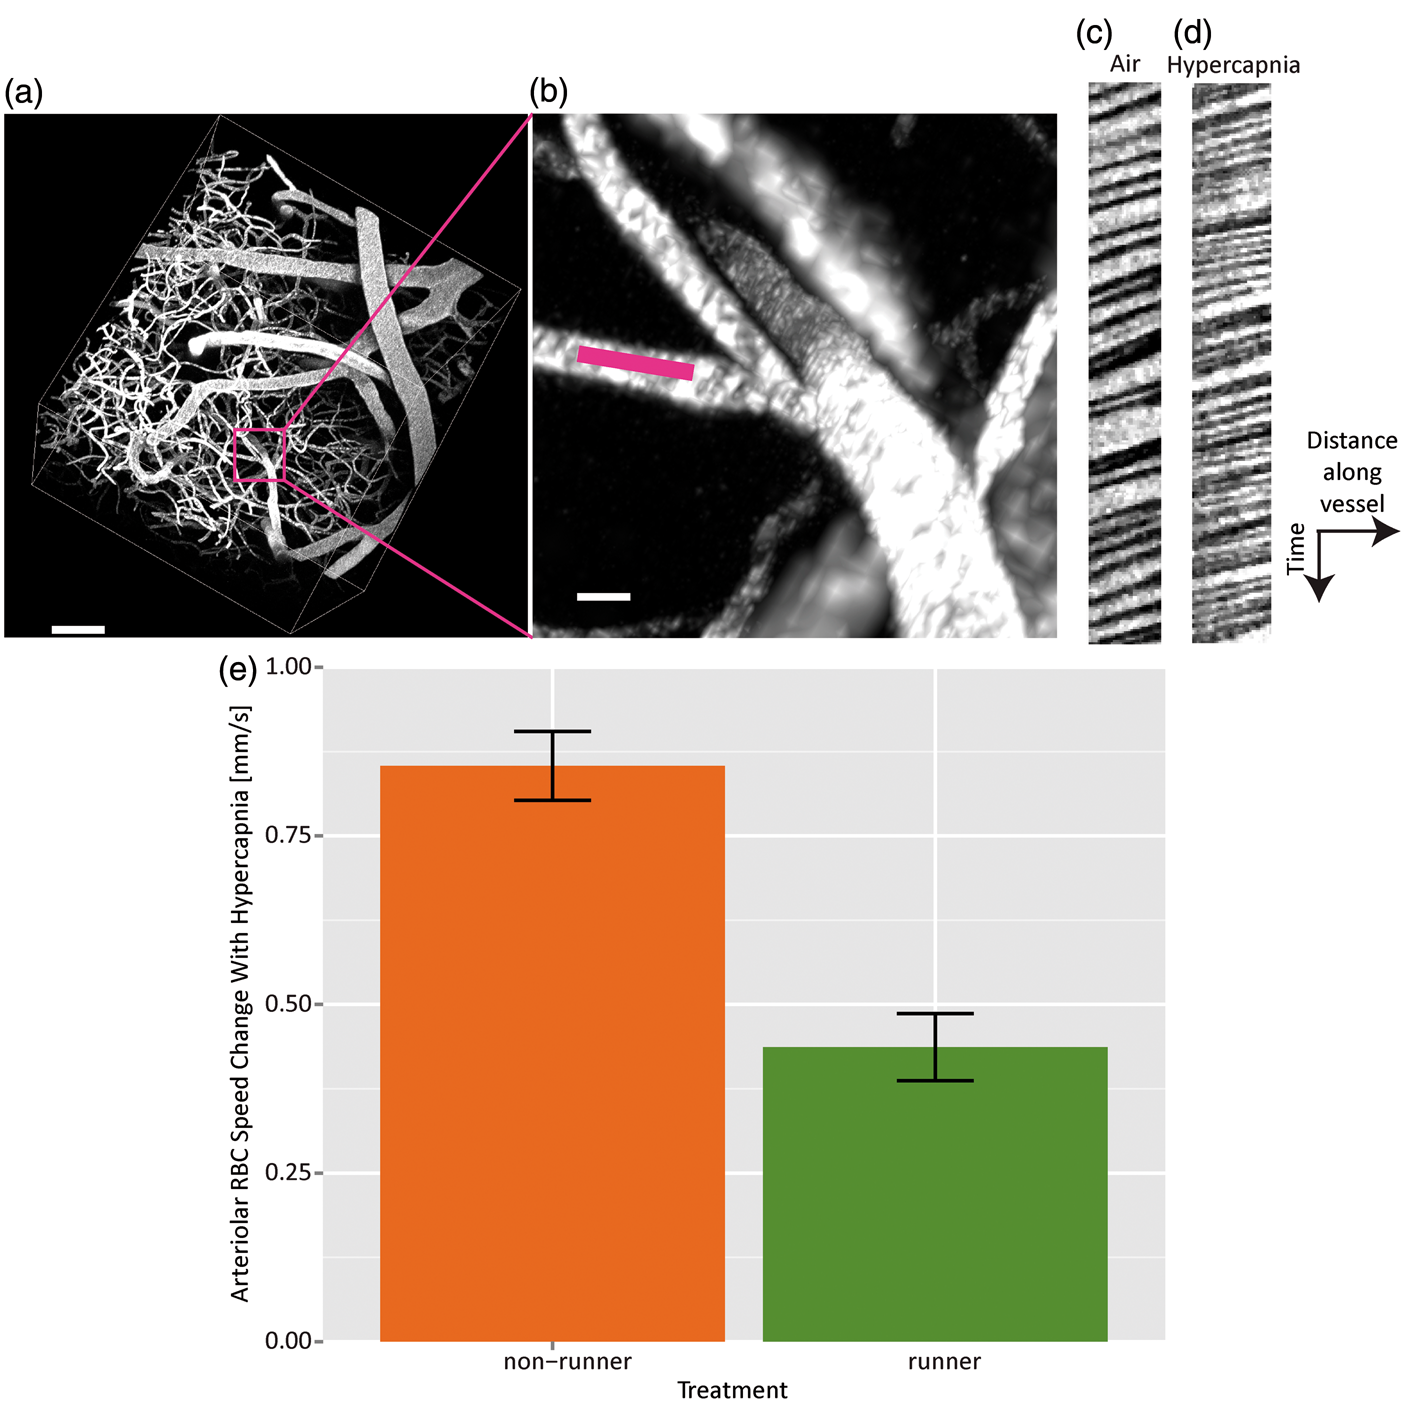
Discussion
In the present study, five weeks of voluntary running produced significant changes in the microvascular function in the primary motor cortex of mice. Whereas inhalation of 10% CO2 doubled the cortical blood flow in nonrunners, it raised the flow in runners by only ∼30%. Correspondingly, the RBC speed elevation in primary branches of cortical penetrating vessels of runners was only half that found in nonrunners. These reductions in hemodynamic responses to hypercapnia were not accompanied by significant changes in either microvascular network morphology or in systemic physiology, both assessed under anesthesia. We posit that the exercise regimen elevated the vascular reserve capacity 88 or network’s efficiency, thus decreasing the challenge-induced perturbations of the existing microvascular network.
Voluntary exercise has shown a broad range of beneficial effects on systemic and central physiology in both preclinical models and humans1,12,13,24,40,89 and has been promulgated as a promising therapeutic intervention to steady the effects of aging and neurodegeneration.4,7,9,17,28,30,90,91 Exercise is thought to increase growth factor concentrations such as the neurogenesis impacting BDNF, the angiogenesis impacting vascular endothelial growth factor, and insulin-like growth factor 1 which influences both neurogenesis and angiogenesis.47,51,53,54,92–96 Exercise upregulates NO production, which can influence the increase of BDNF production and improve cerebrovascular functionality.25,35,39,97 Meanwhile chronic exercise regime has shown to decrease reactive oxidative species production and neuroinflammation, decreasing their negative effects on the above-mentioned growth factors and NO production.7,27,36,96,98,99 Notwithstanding, the mechanisms underlying its many effects are not fully elucidated, hindering the rational design of exercise-based interventions.96,100
Brain microcirculation is a major target of exercise. To date, studies of the exercise-induced changes on brain vascular function have produced varied results, with regionally specific changes in cerebral vascular morphology and function. Autoradiographic measurements of CBF following six weeks of treadmill running in adult rats showed decreased perfusion in sensorimotor cortex—in agreement with current work—as well as in striatum, and vermis, but increased perfusion in deep cerebellar nuclei, thalamus, paravermis, and globus pallidus during slow walking on the Rotarod. 35 On the other hand, T2*-weighted MRI and flow-alternating inversion recovery MRI data acquired after 30 days of running in adult rats have indicated blood volume increases and a ∼20% increase in motor cortical (relative to striatal) perfusion during 10% CO2 breathing in rats. 34 CD61 integrin immunostaining in these animals also indicted capillary growth in motor cortex, with runners showing approximately doubled mean capillary volume fraction in layer II/III of the motor cortex. 34 In contrast, Kleim et al. found that 30 days of voluntary running in adult male rats resulted in increased blood vessel density in layer V of the forelimb motor cortex. 50 Limited light penetration in vivo precluded us from examining the microvascular morphology beyond layer III/IV in the present study. Notwithstanding, the current data on the cortical layers II/III provide evidence of the broader extent of functional changes relative to (any) morphological changes in the cerebral microvasculature induced by exercise. Future studies are required to examine effects of exercise on CVR in deeper cortical layers, using postmortem analysis or broader coverage in vivo techniques.
Directly comparing current observations to data from human studies is hindered by methodological confounds. Notwithstanding, in broad qualitative agreement with present observations, Thomas et al. showed higher baseline CBF with lower CO2-induced CBF changes in elderly master athletes. 29 Gauthier et al. similarly reported lower CVR, as measured by BOLD fMRI, in frontal regions involved in the Stroop task processing in those elderly adults who performed the task faster and exhibited higher cardiorespiratory fitness. 31 Notwithstanding, investigations of the effects of exercise on the CVR in humans have yielded varied and region-specific findings.3,29–33
Anesthesia
The imaging was conducted under 1–1.25% isoflurane to ensure robust paCO2 elevations; however, isoflurane exerts global vasodilatory effects. 101 In response to hypercapnia, the flow in nonrunners doubled, commensurate with prior observations in nonrunning mice under alpha-chloralose or propofol anesthesia102–104 and suggesting ample dynamic range for flow regulation. Nonetheless, it is possible that the flow responses to hypercapnia would have been higher in awake animals, 105 supporting the acclimatization of animals to imaging procedures in future studies. However, awake imaging would likely confound hypercapnic challenges (given respiratory adaptation106,107) and thus require use of alternate vasodilatory stimuli.
Degree of exercise
Our data suggest that the progressive decrease in hypercapnic reactivity seen with increased distance ran saturates at high level of running. Moreover, it is likely that extended exercise regimens eventually produce morphological changes in the cerebral microvasculature: Yoshihara et al. demonstrated increased capillary volume and surface area after 14 months of treadmill running in aged rats. 80
Systemic effects
Chronic exercise regime in humans and animals is typically associated with decrease in resting blood pressure and a decrease in resting heart rate.3,89,97,108,109 In light of methodological complexity of accurate blood pressure monitoring in mice, we have not tracked blood pressure in our animals in the present study. The heart rate measurements obtained during imaging experiments have not shown a difference between runners and nonrunners, though we did observe a trend toward decreased resting heart rate in runners, in agreement with the literature. Further, in the animals for which arteriolar RBC speed was measured, we have also seen a trend toward smaller hypercapnia-induced increase in transcutaneous CO2 in runners when compared to nonrunners. On the whole, the present exercise regimen likely produced some, though limited systemic effects, in addition to the central effects described.
Cerebral vascular reserve capacity
On the level of both individual cortical vessels (interrogated by line scan measurements of vessel-wise RBC speeds) and the cortical microvascular network (studied by tracking the passage of the fluorescent bolus dextran), the present experiments indicate a reduced hemodynamic response to hypercapnia following the five weeks of ad lib running. Whereas decreased vascular reactivity is often interpreted as evidence of cerebrovascular dysfunction in disease,59,110–113 we suggest that the present attenuation of the hemodynamic response to hypercapnia in runners may be a manifestation of increased efficiency of the system. In support of this notion, despite commensurate resting diameters, the dispersion in TTP was lower in runners than in nonrunners (ratio of variances of 1.6 ± 0.2, p-value < 1 e-5), another indicator of increased microvascular network efficiency. Although the preclinical evidence is limited,35,114 there is mounting evidence in support of “neural efficiency” hypothesis, which suggests that significantly increased chronic utilization of a set of neuronal networks may raise the efficiency of their operation. In human studies, increased efficiency is most often reflected in decreased responses (both in terms of magnitude and spatial extent of changes) to task performance in experts. Thus, greater guitar playing skills correlate with decreased motor cortical activity (on EEG) during planning of motor movements involved in playing; 115 hemodynamic responses (on BOLD fMRI) in professional formula race car drivers are more focused than those in naïve drivers during performance of simple visuo-motor skill tasks; 116 compared to controls, skilled keyboard players show attenuated hemodynamic changes (on BOLD fMRI) in the cerebellum during complex finger movement tasks; 117 less cortical activity (on EEG) is seen in fitter than in less fit cyclists during cycling at the individual anaerobic threshold. 118
In the context of current work, we postulate that chronic elevation of CO2 levels during sustained exercise may lead to arteriolar desensitization to CO2 29 as well as a metabolic adaptation leading to increased system’s efficiency. 119 We speculate that NO signaling may be the mediator of the arteriolar desensitization given its involvement in hypercapnic vasodilation.120,121 This hypothesis is motivated by prior demonstrations of exercise-induced increase in the availability of NO, which may induce short-term dilation,38,122 followed by long-term desensitization of smooth muscle cells to NO elevations. 123 In addition to arteriolar desensitization to CO2, we speculate that the chronic elevation in cortical activity as a result of exercise may also have led to the adaptation of the cortical metabolism, possibly by utilization of greater relative amounts of lactate-to-glucose 119 and hence allowing the brain to perform the same amount of “input processing” despite attenuated blood flow increase to the input stimulus and thus attenuated stimulation-induced increase in metabolite delivery. Future studies are required to examine the mechanisms of vascular desensitization and metabolic adaptation as a result of chronic voluntary exercise.
Conclusion
The present investigation provides evidence of attenuation in the CVR to hypercapnia in the primary motor cortex following five weeks of ad lib running in mice. The decrease in hypercapnia-induced changes occurred in the absence of any significant changes in the morphology of the cerebrovascular network or changes in the physiological monitoring parameters. The decrease in the flow response to hypercapnic challenge likely resulted from increased motor cortical efficiency and desensitization of the cortical arterioles to CO2 manipulations.
Footnotes
Funding
The author(s) disclosed receipt of the following financial support for the research, authorship, and/or publication of this article: Canadian Institutes of Health Research Grant MOP 231389.
Acknowledgements
The authors would like to thank Jun Dazai for his technical assistance.
Declaration of conflicting interests
The author(s) declared no potential conflicts of interest with respect to the research, authorship, and/or publication of this article.
Authors’ contribution
AD and LAMT contributed equally to this work. BS, JGS, and LSC designed the experiments. AD, LAMT, and MMK acquired the data. AD, LMAT, BS, ILJ, and JS analyzed the data. AD, LAMT, and BS wrote the manuscript. All authors reviewed and edited the manuscript.
References
Supplementary Material
Please find the following supplemental material available below.
For Open Access articles published under a Creative Commons License, all supplemental material carries the same license as the article it is associated with.
For non-Open Access articles published, all supplemental material carries a non-exclusive license, and permission requests for re-use of supplemental material or any part of supplemental material shall be sent directly to the copyright owner as specified in the copyright notice associated with the article.