
Abstract
Amnestic mild cognitive impairment represents an early stage of Alzheimer’s disease, and characterization of physiological alterations in mild cognitive impairment is an important step toward accurate diagnosis and intervention of this condition. To investigate the extent of neurodegeneration in patients with mild cognitive impairment, whole-brain cerebral metabolic rate of oxygen in absolute units of µmol O2/min/100 g was quantified in 44 amnestic mild cognitive impairment and 28 elderly controls using a novel, non-invasive magnetic resonance imaging method. We found a 12.9% reduction (p = 0.004) in cerebral metabolic rate of oxygen in mild cognitive impairment, which was primarily attributed to a reduction in the oxygen extraction fraction, by 10% (p = 0.016). Global cerebral blood flow was not found to be different between groups. Another aspect of vascular function, cerebrovascular reactivity, was measured by CO2-inhalation magnetic resonance imaging and was found to be equivalent between groups. Therefore, there seems to be a global, diffuse diminishment in neural function in mild cognitive impairment, while their vascular function did not show a significant reduction.
Keywords
Introduction
Amnestic mild cognitive impairment (MCI) is thought to represent an early stage of Alzheimer’s disease (AD)1,2 and is postulated to be an ideal stage for AD intervention.3–8 Many studies have investigated imaging biomarkers of MCI. Glucose metabolism measured by fluorodeoxyglucose (FDG) positron emission tomography (PET) has been used extensively in AD and, to some extent in MCI patients as a marker of neurodegeneration.7,9–12 However, FDG PET cannot provide absolute quantification of brain metabolism without arterial blood sampling, thus usually only estimates relative metabolism using cerebellum or pons as a reference. It is therefore unclear how absolute metabolism of the brain as a whole may alter in MCI. Furthermore, FDG PET measurement is associated with ionizing radiation and is not suitable for the purpose of routine screening.
Cerebral blood flow (CBF) can be quantitatively measured without ionizing radiation. Since CBF is often tightly coupled with cerebral metabolism,13,14 it has been used as a surrogate marker of neurodegeneration in AD and MCI.15–18 However, CBF can also be altered by physiological changes other than cerebral metabolism, including vascular risk factors that are common in Alzheimer’s patients. Indeed, several studies of cerebrovascular reactivity (CVR) have provided evidence of a vascular dysfunction in AD and MCI patients,17,19 and some are predictive of cognitive impairment.20,21 Therefore, in order to differentiate the effects of neurodegeneration from vascular deficits, it is useful to evaluate metabolism and blood flow separately.
Our laboratory has recently developed, and validated a technique to measure the brain’s global metabolism with magnetic resonance imaging (MRI).22,23 The technique does not require any exogenous tracer, can be completed within 5 min on a standard 3T, has a test-retest variability of less than 4%, and has recently been evaluated in a multi-site setting.24,25 Furthermore, this method can provide absolute values of global brain metabolism in physiological units of µmol O2/min/100 g brain tissue, an advantage over the FDG measure of a ratio index only. Therefore, the present work represents the first study to apply this novel imaging technique to examine absolute brain metabolic rate in MCI patients and is different and complementary to earlier work using FDG PET which is more focused on relative changes in localized brain regions.9,10,12
Another advantage of this technique, which includes a T2-Relaxation-Under-Spin-Tagging (TRUST) MRI and a phase-contrast (PC) MRI, is that global oxygen extraction fraction (OEF) and CBF can be obtained in the same measurement. This is useful because they provide some causal insight as to whether changes in brain metabolism is due to insufficient blood supply or because the tissue itself has (partly) lost the ability to extract and consume oxygen. This can shed some light on the neural versus vascular origin of the metabolic change.
In the present study, we measured several physiological parameters related to brain oxygen utilization, specifically cerebral metabolic rate of oxygen (CMRO2), OEF, and CBF, in MCI individuals using completely non-invasive MRI methods. The results were compared with those from age-matched, cognitively intact controls. In addition to these baseline measures, we also evaluated cerebrovascular reserve of the participants using a novel CO2-inhalation technique, 26 which provided further information on the vascular function of the MCI patients.
Methods
Participants
Demographic, neuropsychological, and vascular risk factor information of the study participants.
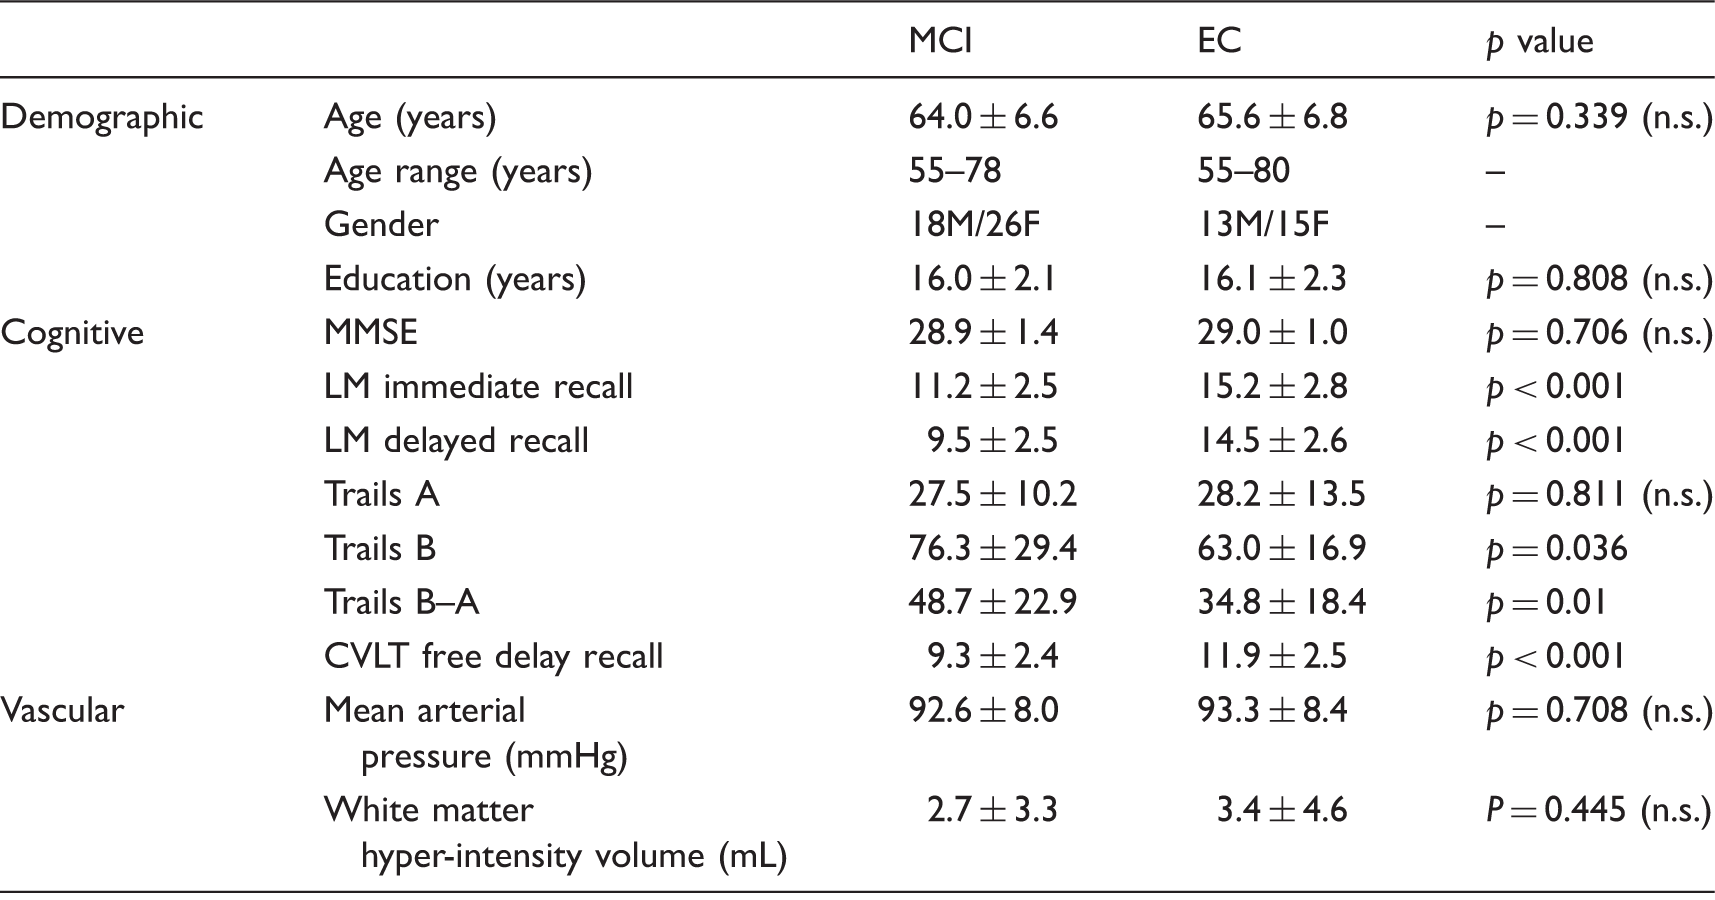
MCI: mild cognitive impairment (N = 44); EC: elderly control (N = 28); MMSE: Mini-Mental-State-Exam; LM: logical memory; CVLT: California Verbal Learning Test; n.s.: not significant. Values are mean ± standard deviation.
The diagnosis of amnestic MCI was based on the protocol described by the ADNI study (http://adni-info.org). Briefly, all MCI volunteers had a Clinical Dementia Rating (CDR) scale 27 score of 0.5 and a delayed logical memory (LM) of 1–1.5 SD below the population mean. All EC volunteers had a CDR score of 0. The Mini-Mental-State-Exam (MMSE) 28 scores did not differ between groups (p = 0.71) as shown in Table 1.
MRI experiment
Experiments were performed on a 3 Tesla MRI scanner using an 8-channel head coil (Philips Healthcare, Best, The Netherlands). A body coil was used for RF transmission. Foam padding was placed around the head to minimize motion during MRI scan acquisition.
The following functional MRI biomarkers were measured from all study participants: global CMRO2 and the associated OEF and CBF, and CVR to CO2 inhalation.
Global CMRO2
Global CMRO2 was measured based on the widely used Fick principle and was described previously.29–31 Briefly, CMRO2 (in unit of µmol O2/min/100 g brain tissue) was quantified based on arterio-venous difference in oxygen content
32
and can be written as

In this study, Ya was measured with a pulse oximeter, and the other two parameters were measured with MRI. The scan duration of a complete set of CMRO2 measurement was 4 min. The measurement of Yv is traditionally a bottleneck for MR techniques. In the present study, we used a recently developed and validated technique, TRUST MRI, to non-invasively measure the global venous oxygenation in the sagittal sinus. 22 The details of the technique have been extensively described previously.22,34 The main advantage of the TRUST method is that it accounts for partial voluming between blood and tissue by using the spin tagging principle, through which the static tissue signals are canceled out. Furthermore, structural changes in sinus size are not expected to affect the estimation because the oxygenation assessment in TRUST is based on T2 relaxation time rather than the signal strength itself. It used the following imaging parameters: single-shot echo-planar imaging acquisition in the axial plane, voxel size = 3.44 × 3.44 × 5 mm3, field-of-view (FOV) = 220 × 220 × 5 mm3, repetition time (TR) = 6800 ms, echo time (TE) = 3.6 ms, inversion time (TI) = 1022 ms, labeling slab thickness = 80 mm, gap between the imaging slice and labeling slab = 20 mm, and four different T2 weightings, with eTE = 0 ms, 40 ms, 80 ms, and 160 ms, corresponding to 0, 4, 8, and 16 refocusing pulses during the T2 preparation in the pulse sequence. Global CBF was determined by measuring the flux in the four major feeding arteries of the brain, left/right internal carotid and left/right vertebral arteries, using a PC MRI technique. Imaging parameters for the PC scan are as follows: single-slice acquisition, voxel size 0.45 × 0.45 × 5 mm3, FOV = 230 × 230 ×5 mm3, maximum velocity encoding = 80 cm/s, and scan duration = 30 s.
Global CMRO2 data were processed with in-house MATLAB (Math-works, Natick, MA, USA) scripts.29,35 For the PC data, four regions of interest (ROI) were drawn on the left and right internal carotid arteries and on the left and right vertebral arteries, on the magnitude image. Masks were then created for the arteries using the ROIs. This mask was then applied to the phase image (velocity map) to obtain whole-brain blood flow in the units mL/min. CBF in unit volume of brain tissue (mL/100 g/min) was obtained by normalizing the total CBF to the brain volume (sum of gray matter and white matter volume), which was obtained from the high-resolution T1-weighted magnetization-prepared-rapid-acquisition-of-gradient-echo (MPRAGE) image, using functions from the Functional Magnetic Resonance Imaging of the Brain (FMRIB) Software Library (FSL) (FMRIB, Oxford University, Oxford, UK).
TRUST data were processed using methods that were described previously. 22 Briefly, after pairwise subtraction of the control and label images, an ROI was drawn over the sagittal sinus and signal from over the four brightest voxels over the sagittal sinus are averaged to obtain the venous blood signal from the sagittal sinus for each of the four images acquired at separate echo times. The venous blood signals were then fitted using a mono-exponential function to obtain the T2 value. The T2 was then converted to the Yv using a calibration plot obtained from in vitro blood experiments performed under controlled conditions of oxygenation, temperature, and hematocrit, which relates the T2 value of venous blood to Yv.
CVR to CO2
CVR was measured with a hypercapnia challenge, in which participants inhaled 5% CO2 gas while BOLD MR images were continuously acquired. The details of the CVR measurement were described previously.36–38 Briefly, during the CVR scan, subjects were fitted with a nose clip, and breathed room air and the prepared gas in an interleaved fashion (60 s CO2, 60 s room air, repeated three times) through a mouthpiece. The prepared gas was a mixture of 5% CO2, 74% N2, and 21% O2 contained within a Douglas bag. The gas was delivered to the subject through a two-way non-rebreathing valve and mouthpiece combination (Hans Rudolph, 2600 series, Shawnee, KS). A research assistant was inside the magnet room throughout the experiment to switch the valve and monitor the subject. BOLD MR images were acquired continuously during the entire experimental period. The end-tidal CO2 (Et CO2), the CO2 concentration in the lung which approximates that in the arterial blood, was recorded throughout the breathing task using a capnograph device (Capnogard, Model 1265, Novametrix Medical Systems, CT). The total duration for the CVR scan was 7 min.
Other MRI measurements
A T1-weighted high-resolution image was acquired using the MPRAGE sequence (voxel size = 1 × 1 ×1 mm3, scan duration = 4 min).
To obtain white matter hyperintensities (WMHs), a Fluid-Attenuated-Inversion-Recovery (FLAIR) image was acquired. Imaging parameters of the sequence were as follows: TR/TE = 11,000/125 ms, TI = 2800 ms, FOV = 230 × 230 mm2, 24 slices, 5 mm thick with 1 mm gap, reconstruction matrix = 512, scan duration = 3 min, 40 s. The volume of WMHs was quantified from the FLAIR image, using a procedure described in detail elsewhere. 39 To account for individual differences in head size, total volume of WMH was normalized to the intracranial volume.
Statistical analysis
Global CMRO2, OEF, and CBF values were compared across subject groups using a linear regression model, in which the physiological parameter is the dependent variable, and diagnosis category (i.e., MCI or EC) is the independent variable. Age and sex were covariates. Potential impact of vascular risk factors, e.g., mean arterial pressure and WMH volume, on global CMRO2 was also assessed. The CVR maps were compared voxel-wise across groups using the two-sample t test in SPM. CVR voxel-wise data were considered significant at a family-wise error (corrected for multiple comparisons) threshold of p = 0.05.
Results
Demographic, neuropsychological, vascular risk factor data
Demographic data are summarized in Table 1. There was no difference in age, gender distribution, education, and MMSE between the MCI and EC groups. As expected, the Wechsler Memory Scale LM for immediate recall and delayed recall was poorer in MCI as compared to EC. There was also a significant group difference in Trails B (p = 0.036), California Verbal Learning Test (CVLT) free delay recall (p < 0.001), and Trails B–A (p = 0.01), but no difference in Trails A (p = 0.811). The MCI and EC groups had similar vascular risk factors in terms of blood pressure (p = 0.708) and WMH volume (p = 0.445). There was not a significant association between blood pressure and global CMRO2 or between WMH volume and global CMRO2. 36.4% and 42.9% of the MCI and EC participants, respectively, received antihypertensive medications. 20.5% and 32.1% of the MCI and EC, respectively, were taking cholesterol lowering drugs. Regression analysis revealed no association between antihypertensive medication and CMRO2 (p = 0.24) or between cholesterol lowering drug and CMRO2 (p = 0.93).
Cerebral metabolic rate of oxygen
Figure 1 shows a representative image of the CMRO2 scan. Group results of global CMRO2, CBF, arterial oxygen saturation, and OEF are plotted in Figure 2. Linear regression revealed a significant effect (p = 0.004) of diagnosis category on global CMRO2. Average CMRO2 for the MCI volunteers was 12.9 % lower compared to that in the EC group. The observed metabolic deficit in MCI volunteers could not be attributed to brain atrophy, as brain volume was accounted for in the CMRO2 calculation. In fact, whole brain volume was not different (p = 0.28) between groups; it was 1136.1 ± 118.9 (mean ± standard deviation) mL in MCI volunteers and 1167.5 ± 122.8 mL in EC volunteers. Gray matter volume was also measured and was not different (p = 0.46) between the groups.
A representative CMRO2 dataset. (a) Phase contrast MRI for the measurement of global absolute cerebral blood flow (CBF) and (b) TRUST MRI for the measurement of global venous oxygenation (Yv). Comparison of brain metabolism and associated physiological parameters between amnestic MCI patients and elderly controls. (a) Global CMRO2, (b) CBF, (c) Arterial oxygen saturation (Ya), and (d) Oxygen extraction fraction (OEF).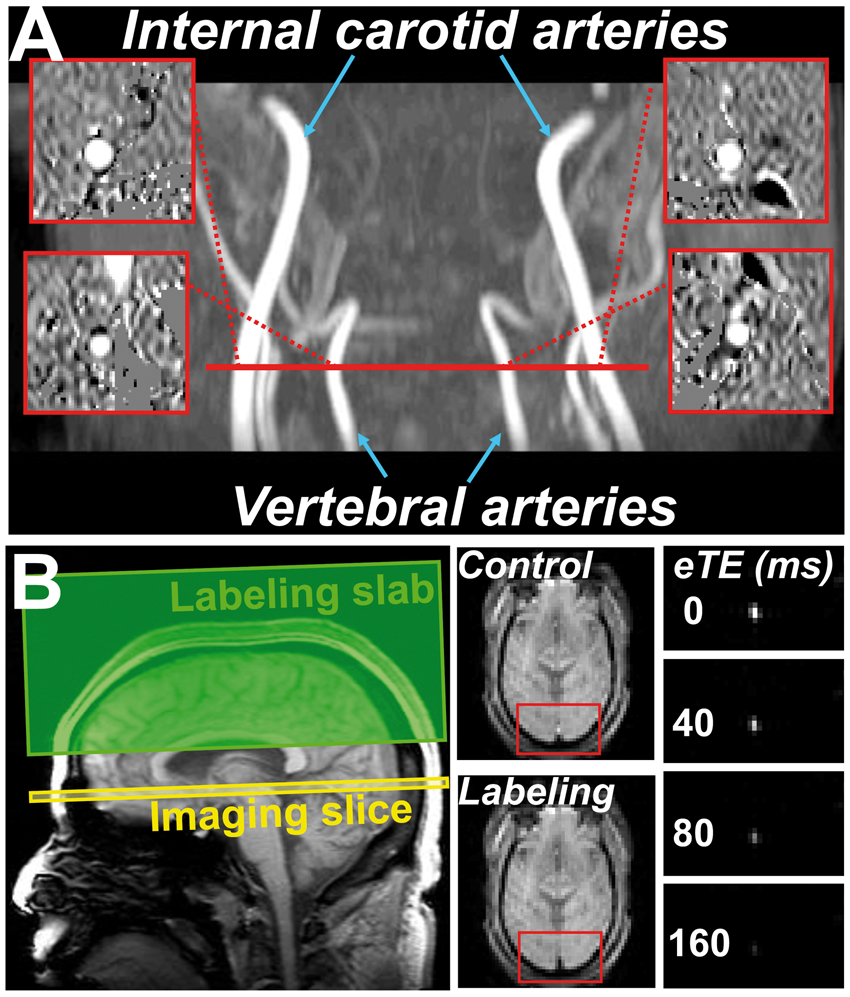
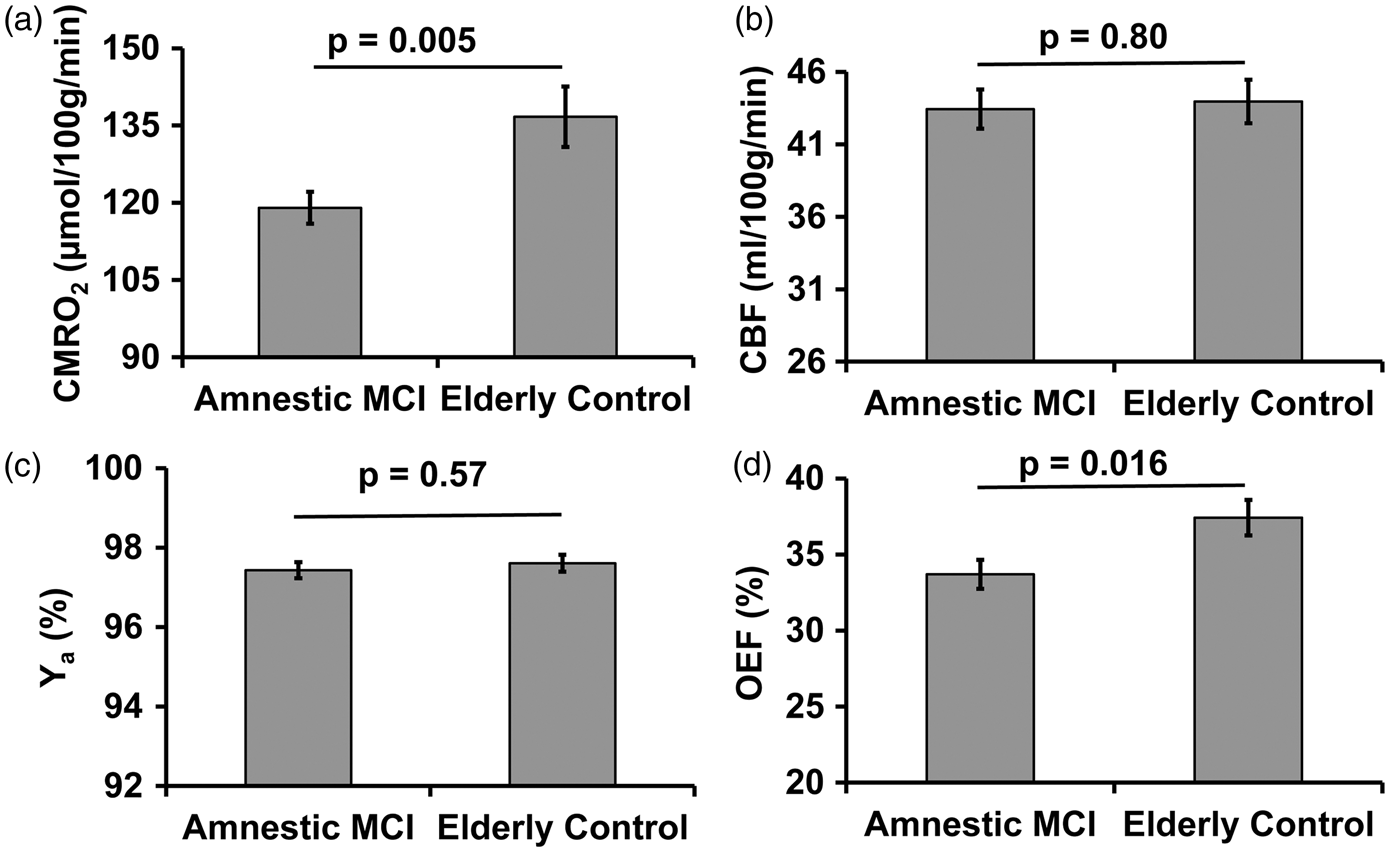
We further asked whether this reduction in oxygen metabolism is because there is insufficient supply of oxygen or because the neurons cannot extract oxygen from the blood stream effectively. Specifically, oxygen supply can be assessed by examining CBF and arterial oxygen saturation (Ya). Figure 2(b) and (c) shows these results. It can be seen that neither global CBF (p = 0.80) nor arterial oxygen saturation (p = 0.57) showed a significant difference between the MCI and control groups. In contrast, when comparing the OEF between the two groups (Figure 2(d)), a reduced OEF by 10% (p = 0.016) is observed in the MCI patients.
Global CMRO2 was found to be correlated (Pearson correlation, r = 0.256, p = 0.03) with LM-delayed recall scores across all participants (including both MCI and EC). Furthermore, within the MCI group, global CMRO2 showed a similar association with LM-delayed recall scores (r = 0.259), although not statistically significant due to a smaller sample size (p = 0.047, single-tailed test). The scatter plot between CMRO2 and LM scores for the MCI participants is shown in Figure 3.
Scatter plot between global CMRO2 and logical memory (LM) delayed recall scores in the MCI participants.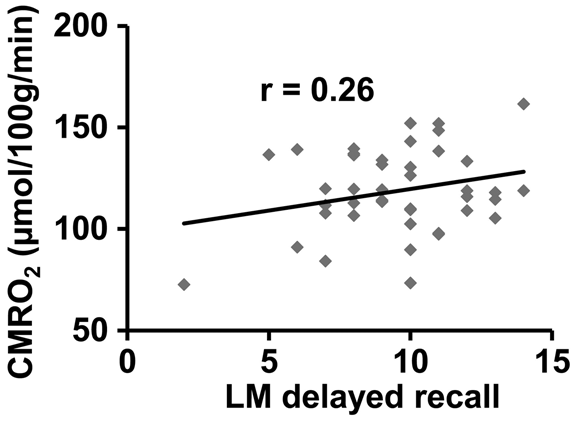
Cerebrovascular reactivity
Group-averaged CVR maps for the ECs and MCI volunteers are shown in Figure 4. Visual inspection suggests that CVR in both groups is similar. Quantitative comparison confirmed this result. Whole-brain gray matter CVR was 0.174 ± 0.04%BOLD/mmHg and 0.170 ± 0.03%BOLD/mmHg for the MCI and EC group, respectively, with no group difference (p = 0.74). Voxel-by-voxel comparison between the two groups similarly showed no significant differences.
Averaged CVR maps (a) Elderly control group and (b) Amnestic MCI group.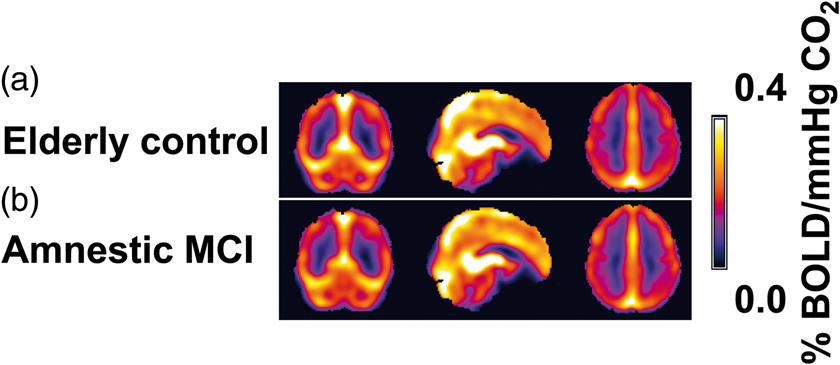
Discussion
In the present study, we evaluated brain tissue oxygen metabolism and CVR in MCI individuals using several advanced imaging techniques. The main novel aspects are (1) This study is distinctive from literature reports using FDG PET in that the present study provides absolute quantification of brain metabolism in MCI patients, and the validity of our results does not rely on the assumption that reference regions such as cerebellum or pons have normal metabolic rate. Our result extended previous PET findings and showed that the brain as a whole shows diminished oxygen utilization. The large amplitude (12.9%) of this change suggests that diminished brain metabolism is not restricted to the focal regions identified by PET, e.g., posterior cingulate cortex (PCC) and superior temporal cortex (although they may be the most pronounced regions), (2) a technical novelty is that these measurements are performed without using ionizing radiation or any exogenous agent, thus provide a great potential for translation to routine clinical screening, and (3) this study also provides some mechanistic insight as to the cause of the diminished metabolism in MCI. We found that global perfusion in MCI individuals is minimally affected when compared to that of ECs, and furthermore their blood vessels can dilate as well as those of EC when during vascular challenge (CO2 inhalation). Thus, the lower metabolic rate of the tissue is most likely attributed to dysfunction of neuronal tissue itself, the mitochondria of which cannot consume as much oxygen as that of an EC. When the condition of the patient advances to the stage of AD, vascular deficits are likely to become more apparent.17,40,41
Our findings of a reduction in brain tissue oxygen utilization in MCI cannot be attributed to a loss in brain volume,8,42 as neither gray matter nor whole-brain volume showed a difference between the two groups. Similarly, the volume of WMHs did not show a difference. A possible mechanism for the global reduction in CMRO2 observed in this study is elevated oxidative stress and reduced mitochondrial function, which has been previously reported in AD.43–46 Lower energy metabolism is consistent with findings that AD/MCI patients manifest reduced EEG rhythms,47,48 as neural synaptic potentials is the primary cellular process that consumes energy.
The findings of the present study have primarily revealed a metabolic deficit in patients with amnestic MCI, but did not found global changes in CBF. The lack of global CBF change was somewhat surprising, as prior research including our own has demonstrated a regional CBF deficit in PCC and related regions.15–18 However, it should be noted that PCC only represents about 1.14% of the whole brain volume, 49 thus a 27% reduction50,51 in PCC CBF would only translate to 0.3% in global CBF change, which is beyond the detectability of global MRI measurements (Note: PC global CBF measurement has a coefficient of variation of about 5% 52 ). Furthermore, deficits in PCC CBF as often observed in Arterial Spin Labeling (ASL) studies could be due to either a neural or a vascular deficit. In fact, the most common interpretation of the ASL findings is that it is a surrogate marker of glucose metabolism, thus is thought to reflect a neural rather than vascular effect. Thus, the fact that there is ASL deficit in MCI does not necessarily mean that there is vascular dysfunction in this population.
The CVR data provide additional insights on vascular function in MCI, as CVR is presumably not strongly dependent on metabolism and is thought to be more vascular-specific. In our study, neither voxel-by-voxel CVR comparison nor global CVR quantification revealed a significant difference between the MCI and EC participants, suggesting a minimal vascular deficit in the MCI cohort. Our findings of a lack of CVR difference between MCI and EC are consistent with a previous study in MCI patients by Richiardi et al., 19 who reported an absence of difference in CVR amplitude (although the response time was slower). One of our previous studies in Alzheimer’s patients found that CVR was significantly reduced in frontal lobe and insula. 17 One of the possible reasons for the discrepancy from the present study is that AD is at a later stage of the disease progression, thus vascular deficits may become more pronounced. Another possible reason is that the patients in that study had significantly greater cardiovascular risk factors, including having a higher fraction of participants taking antihypertensive and cholesterol lowering medications, compared to control participants (e.g., see Table 1 of Yezhuvath et al. 17 ). In the present study, on the other hand, the MCI and control participants had no difference in blood pressure, WMH volume, or antihypertensive or cholesterol lowering medications. Therefore, CVR difference in the previous study could be due to cardiovascular factors rather than Alzheimer’s pathology.
A previous study in a similar MCI cohort has also reported an 11% deficit in CMRO2, when evaluating CMRO2 using ultrasound and near infrared spectroscopy (NIRS). 53 There are several differences between that study and the present study. The most important one is that the NIRS method cannot separate the arterial vs. venous source in light absorption, thus its outcome, tissue oxygenation index, reflects a combined effect of arterial and venous oxygenation weighted by an unknown factor. A second difference is that it measures oxygenation in a local region (usually a location in the frontal lobe), and thus does not always reflect that whole-brain oxygenation. Therefore, the present study provides a more definitive examination of brain oxygen metabolism in MCI individuals without those confounding factors. We were also able to detect a difference in venous oxygenation which the previous study did not observe.
The findings from the present work should be interpreted in view of a few limitations. First, the sample size of our study is modest. Wu et al. 9 had a sample size of 196 MCI and 109 healthy controls participants from the ADNI cohort. Xekardaki et al. studied 75 cognitively stable and 73 deteriorating participants. The report of Viticchi et al. had a total of 117 subjects. Our sample size of 28 MCI and 44 control subjects is smaller than some of the previous reports, but is comparable to several FDG glucose metabolism studies, e.g., Mosconi et al. 10 (13 MCI, 11 controls), De Santi et al. 11 (15 MCI, 11 controls), Drzezga et al. 12 (22 MCI). Second, we did not include other factors such as ApoE genotype in our regression analysis, thus our observation of a CMRO2 difference, although unlikely, could be due to an ApoE effect. Finally, our assignment of MCI and EC was based on clinical (i.e., CDR) and neuropsychological (i.e., LM) scores, rather than neuropathology or amyloid imaging. Thus, the amyloid status of our participants is not known, and mis-categorization of participants is possible.
In conclusion, the present work suggests that global brain oxygen metabolism is diminished in MCI, which is primarily attributed to a reduced extraction fraction of oxygen by the tissue. Global blood flow and its reserve in MCI individuals showed no difference from EC. Imaging markers reported in this study may prove valuable in understanding neurobiological changes in the early stage of AD.
Footnotes
Funding
The author(s) disclosed receipt of the following financial support for the research, authorship, and/or publication of this article: NIH R01 AG033106, NIH R01 MH084021, NIH R01 NS067015, NIH R01 AG042753.
Declaration of conflicting interests
The author(s) declared no potential conflicts of interest with respect to the research, authorship, and/or publication of this article.
Authors’ contributions
BPT—MRI data acquisition, analysis, interpretation, first draft of manuscript, revised and approved the version to be published
MS—MRI data acquisition, analysis
BYT—MRI data acquisition
TT—report neuropsychology data, revision of manuscript
KM-C—neuropsychology data acquisition
KBW—study concept and design
MCC—neuropsychology data acquisition, analysis, input in writing the neuropsychology data in the manuscript
BDL—study concept and design
RZ—study concept and design, critical revision of manuscript
HL—study supervision, study concept and design, critical revision and approved the version to be published.