
Abstract
Blood pressure (BP) reduction after intracerebral hemorrhage (ICH) is controversial, because of concerns that this may cause critical reductions in perihematoma perfusion and thereby precipitate tissue damage. We tested the hypothesis that BP reduction reduces perihematoma tissue oxygenation. Acute ICH patients were randomized to a systolic BP target of <150 or <180 mm Hg. Patients underwent CT perfusion (CTP) imaging 2 hours after randomization. Maps of cerebral blood flow (CBF), maximum oxygen extraction fraction (OEFmax), and the resulting maximum cerebral metabolic rate of oxygen (CMRO2max) permitted by local hemodynamics, were calculated from raw CTP data. Sixty-five patients (median (interquartile range) age 70 (20)) were imaged at a median (interquartile range) time from onset to CTP of 9.8 (13.6) hours. Mean OEFmax was elevated in the perihematoma region (0.44±0.12) relative to contralateral tissue (0.36±0.11; P<0.001). Perihematoma CMRO2max (3.40±1.67 mL/100 g per minute) was slightly lower relative to contralateral tissue (3.63±1.66 mL/100 g per minute; P=0.025). Despite a significant difference in systolic BP between the aggressive (140.5±18.7 mm Hg) and conservative (163.0±10.6 mm Hg; P<0.001) treatment groups, perihematoma CBF was unaffected (37.2±11.9 versus 35.8±9.6 mL/100 g per minute; P=0.307). Similarly, aggressive BP treatment did not affect perihematoma OEFmax (0.43±0.12 versus 0.45±0.11; P=0.232) or CMRO2max (3.16±1.66 versus 3.68±1.85 mL/100 g per minute; P=0.857). Blood pressure reduction does not affect perihematoma oxygen delivery. These data support the safety of early aggressive BP treatment in ICH.
Keywords
INTRODUCTION
It has been recognized for some time that the perihematoma region in the primary intracerebral hemorrhage (ICH) is relatively hypoperfused.1, 23 Nuclear medicine,2, 3, 4, 5 perfusion-weighted MRI,6, 7 and CTP8, 9 studies have all demonstrated perihematoma oligemia in acute ICH patients. The measured CBF changes are transient and have shown not to be sufficiently severe to result in ischemic changes on the diffusion-weighted MRI.6, 7, 10 It has long been hypothesized that perihematoma oligemia results from vascular compression by the hemorrhage.2, 11 A positron emission tomographic (PET) study has indicated that the perihematoma region is hypometabolic, 12 but it remains unclear whether this finding reflect either or both severe hypoperfusion and reduced metabolic demands. Acute CBF changes, and any effect these may have on the local delivery of oxygen, are relevant to ongoing studies of blood pressure (BP) reduction, as such treatment has the potential to exacerbate hypoperfusion and precipitate ischemic damage.13, 14 In the ICH acutely decreasing arterial pressure trial, perihematoma CBF was demonstrated to be decreased. The absolute reduction in flow was moderate and also unaffected by BP lowering. 15 The effects of BP reduction on tissue oxygenation in ICH are unknown.
In ischemic stroke, severe CBF reductions can limit tissue oxygen metabolism. 16 Moderate reductions in CBF are initially compensated by an elevated oxygen extraction fraction (OEF), with no change in cerebral metabolic rate of oxygen—a condition termed ‘misery perfusion.’ 17
Although oxygen metabolism is ideally assessed with PET, it has been demonstrated that the extent to which local hemodynamics limit oxygen delivery to the tissue can be estimated by the heterogeneity of microvascular flows, as derived from raw perfusion-weighted MRI data.18, 19, 20 In a recent review, Østergaard et al 21 demonstrated how high heterogeneity of microvascular flows and changes in CBF, combined, can reduce the availability of oxygen in ischemia. In tissues experiencing ischemia, the heterogeneity of microvascular flow increases, most likely due to loss of vasoregulatory control, local edema (or in this case, hematoma) pressure, and pericyte constrictions.20, 21 The increased heterogeneity tends to increase the shunting of oxygenated blood through the capillary bed, reducing tissue oxygenation for a given CBF. Analysis of the shape of the tracer concentration time curves obtained as part of perfusion MRI or CTP makes it possible to quantify both CBF and the degree of microvascular heterogeneity and then to generate parametric maps of the maximum OEF and cerebral metabolic rate of oxygen permitted by local hemodynamics, dubbed OEFmax and CMRO2max, respectively.
The aim of this study was to quantify perihematoma tissue oxygenation using CTP in ICH patients. We tested the hypothesis that BP reduction results in reduced perihematoma oxygenation, as measured by OEFmax and CMRO2max.
MATERIALS AND METHODS
Patients
The ICH acutely decreasing arterial pressure trial protocol has been described previously. 22 The study was reviewed and approved by local Human Research Ethics Boards at each of the participating trial sites. Briefly, ICH acutely decreasing arterial pressure trial was a multicenter randomized trial consisting of two BP treatment targets (<150 mm Hg and <180 mm Hg) in ICH patients. Acute ICH patients >18 years of age diagnosed with CT scan within 24 hours of symptom onset without contraindications to CTP (e.g., iodinated contrast sensitivity and serum Cr >160 μmol/L) having more than two BP readings150 mm Hg were eligible. After randomization, intravenous labetalol or hydralazine was used to reduce BP to target levels within 1 hour, followed by a CTP scan 1 hour later. Patients were assessed clinically for neurologic deficits with National Institutes of Health Stroke Scale scores and functional disability with modified Rankin Scale at baseline, time of the CTP, 24±3 hours, 30 ±5 days, and 90±5 days after randomization.
Imaging Protocol
Two hours after randomization, all patients underwent a standard non-contrast CT brain scan. This consisted of 5 mm slices (120 kvp, 300 mA per slice) through the entire brain (l8 to 20 slices with a 512 × 512 matrix). A 38 to 80 mm thick section (slab thickness varied with scanner capabilities) was selected to assess perfusion, centered on the slice where the hematoma had the greatest diameter on the NCCT. Perfusion CT images were acquired with IV iodinated contrast (40 mL) given over 10 seconds, via an 18-guage angiocatheter in an antecubital vein with CT images acquired every 1 second for 50 seconds (80 kvp, 200 mA per image). All patients had a repeat NCCT scan at 24±3 hours.
Image Processing
Raw contrast-enhanced CT images were transferred to a PC workstation and analyzed using a custom designed research software package (Matlab, 2008). A singular value deconvolution algorithm was used to correct for bolus delay and bolus dispersion, using an arterial input function manually selected from the anterior cerebral artery contralateral to the hematoma. Quantitative perfusion maps including CBF and cerebral blood volume (CBV) were generated on a voxel-wise basis. Maximum oxygen extraction fraction maps were based on transit time parameters derived from voxel-wise tissue impulse response curves.20, 23 The approach permits the separation of contributions of MTT and capillary transit time heterogeneity to local tissue oxygenation 24 (Figure 1). The CMRO2max was calculated on a voxel-wise basis as follows: CBF × OEFmax × CaO2 (arterial concentration of oxygen). CaO2 was calculated using arterial blood gas from individual patients (CaO2=Hb × 1.34 × SaO2+PaO2 × 0.003).
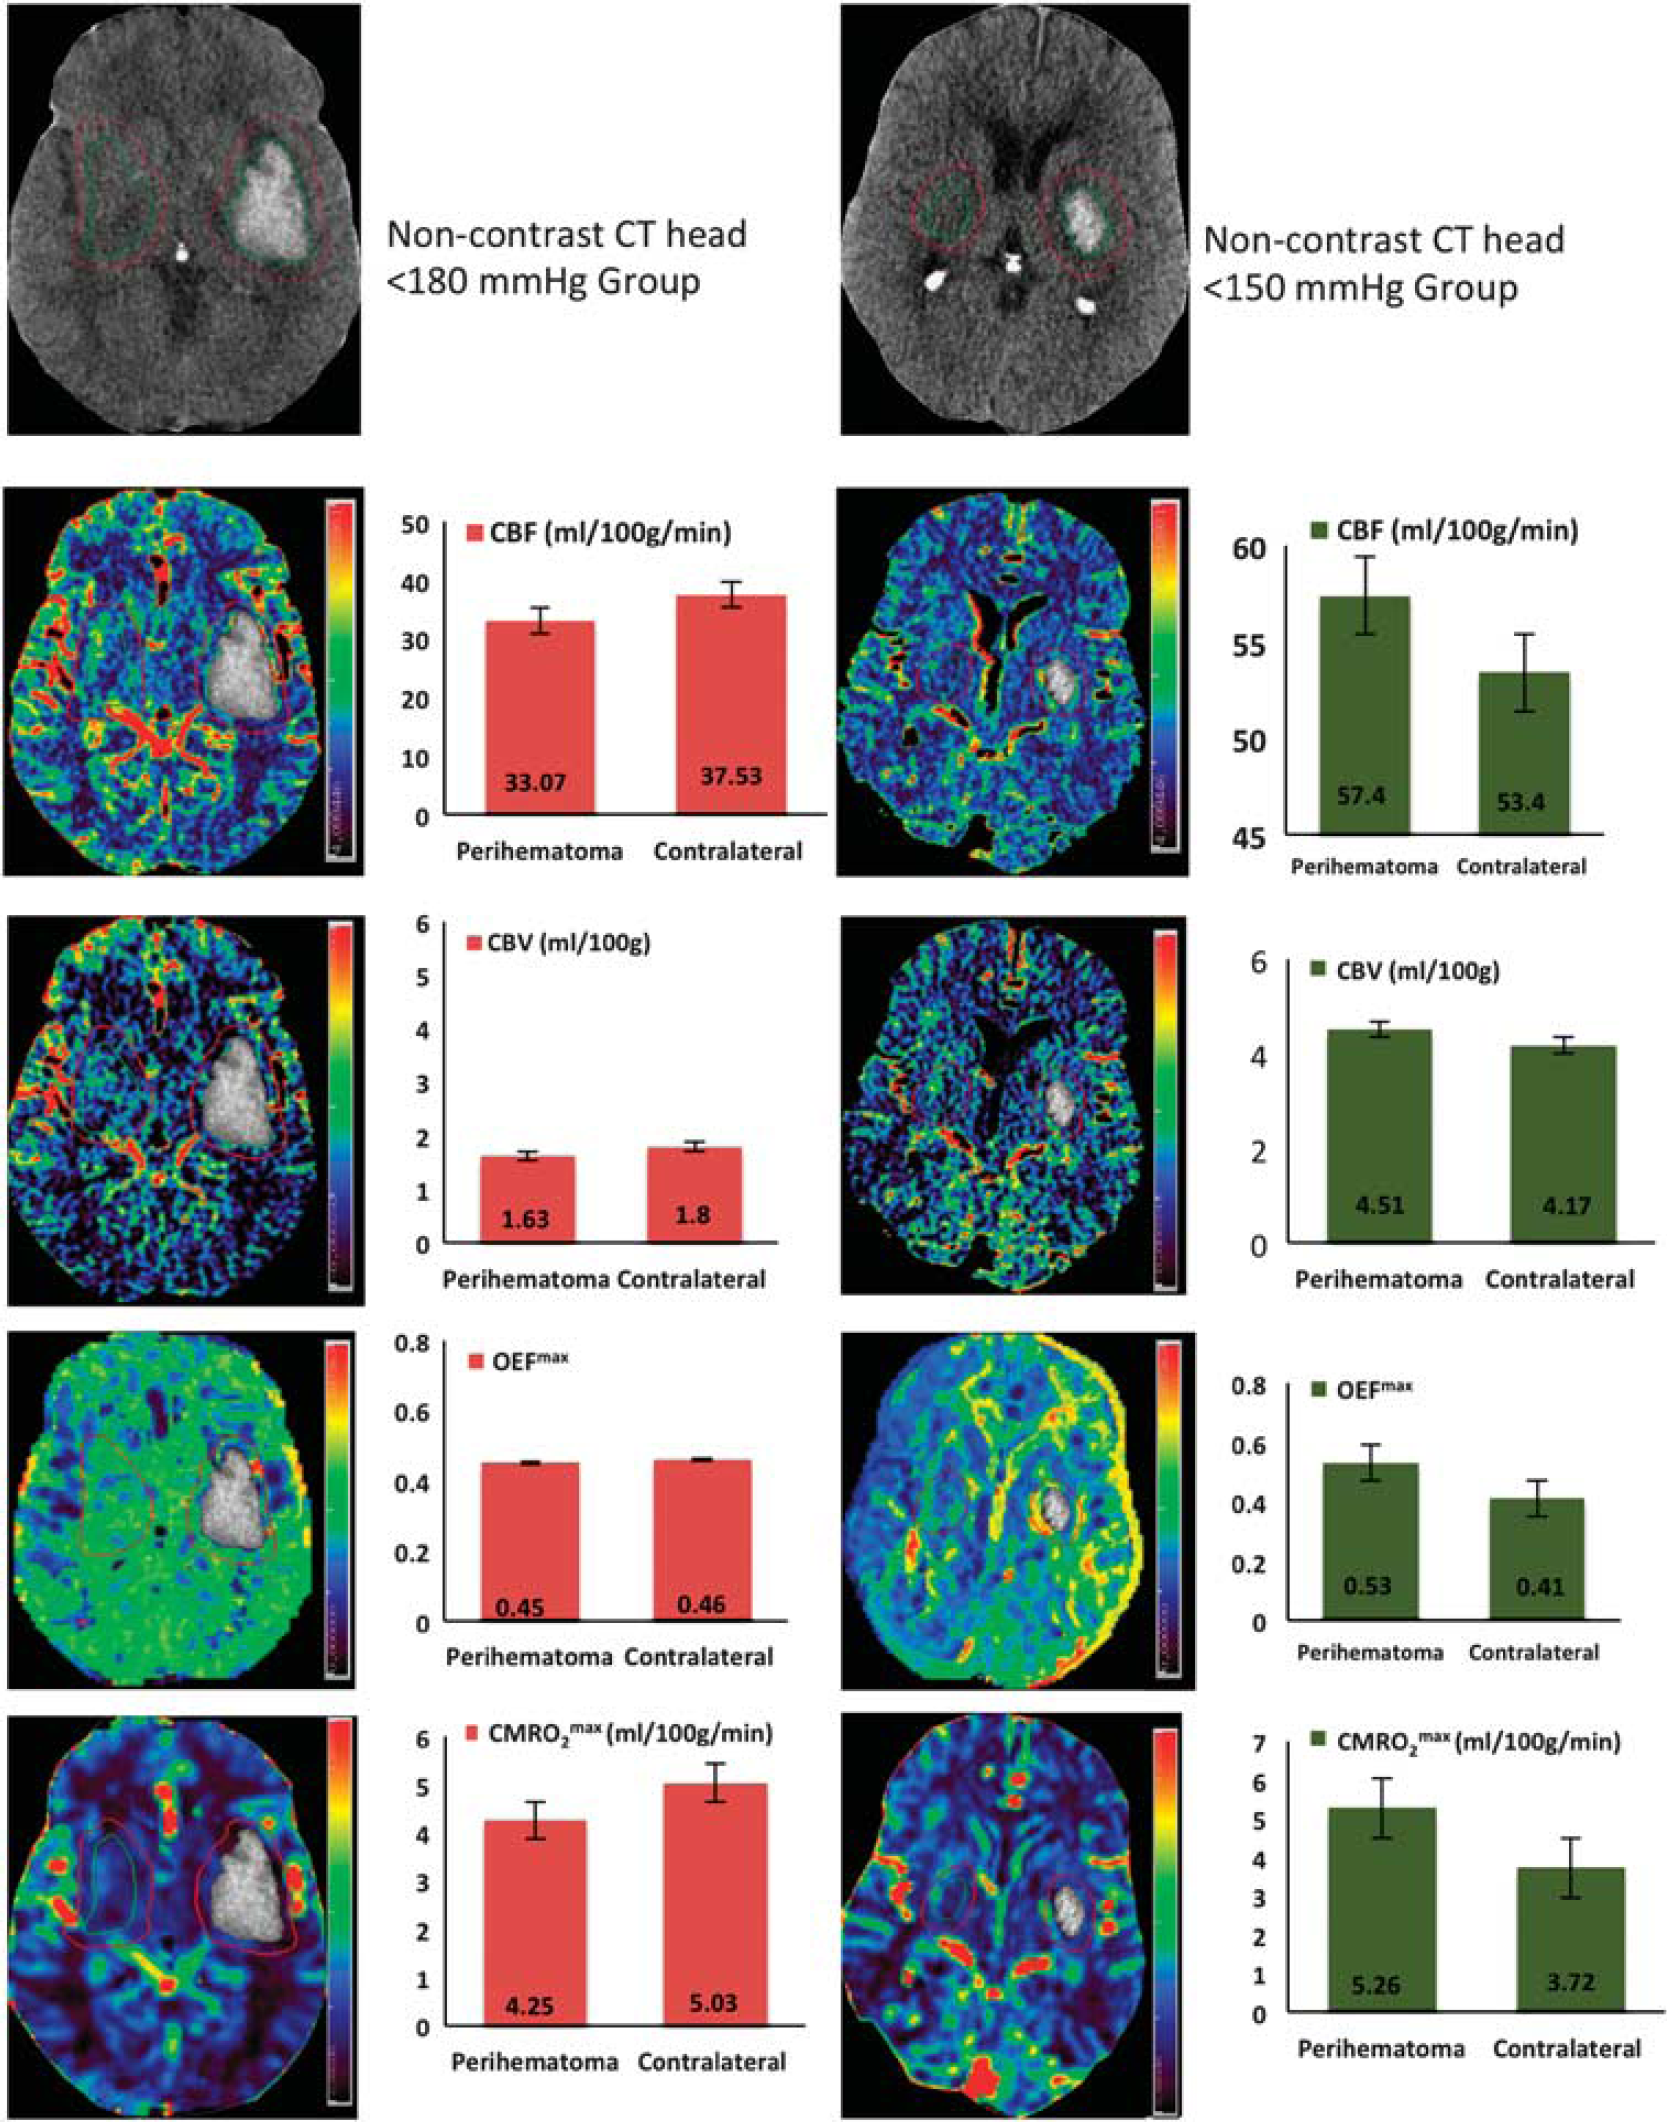
Examples of cerebral blood flow (CBF), cerebral blood volume (CBV), maximum oxygen extraction fraction (OEFmax), and cerebral metabolic rate of oxygen (CMRO2max) maps in patients randomized to <180 and <150 mm Hg blood pressure (BP) target groups. Histograms indicate mean±s.d. in the perihematoma and contralateral homologous regions.
Region of Interest Analysis
Postprocessed perfusion and oxygenation maps underwent region of interest (ROI) analysis using Analyze 11.0 software package (Biomedical Imaging Resource, Mayo Clinic, Overland Park, KS, USA). The hematoma perimeter was determined on the precontrast arrival CT source image using a semi-automated intensity threshold technique. The perihematoma ROI was drawn 1 cm away from the hematoma, as previously described. 6 The perihematoma ROI was also reflected onto the contralateral hemisphere. All voxels containing blood vessels (CBF >100 mL/100 g per minute or CBV >8 mL/100 g) were removed from the ROI using an intensity threshold function.25, 26, 27 Mean CBF, CBV, OEFmax, and CMRO2max were assessed in the perihematoma region and the contralateral homologous region.
Statistical Analysis
All statistical analyses were performed using SPSS 20.0 (IBM SPSS Statistics 2012, Armonk, NY, USA). A paired t-test was used to assess differences between perfusion parameters of the perihematoma and the contralateral homologous regions. An independent samples t-test was used to assess differences between perfusion parameters of the BP treatment groups. Linear regression was used to test the relationship between the magnitude of BP reduction and perihematoma CBF, OEFmax, or CMRO2max. Tissue with impaired oxygenation was defined a priori, as tissue with OEFmax values that were 2 s.d. greater than those of contralateral homologous regions. 12
RESULTS
Patients
A total of 75 patients were randomized in ICH acutely decreasing arterial pressure trial. 15 In 10 patients, raw CTP data was degraded by movement or was of insufficient quality to accurately estimate OEFmax. A total of 65 patients (72% men) were therefore included in the present analysis. Thirty-four and 31 patients were randomized to the <150 mm Hg and <180 mm Hg BP target groups, respectively (Table 1). All patients were hypertensive at presentation and treatment groups were balanced with respect to baseline BP. The median (interquartile range) time from symptom onset to CTP imaging was 9.8 (13.6) hours. Forty-two percent of patients underwent CTP within 6 hours of symptom onset. At the time of CTP imaging, systolic BP was significantly lower in the <150 mm Hg target group (139.9±18.7) than that in the <180 mm Hg target group (160.9±10.6, P<0.0001).
Baseline patient characteristics
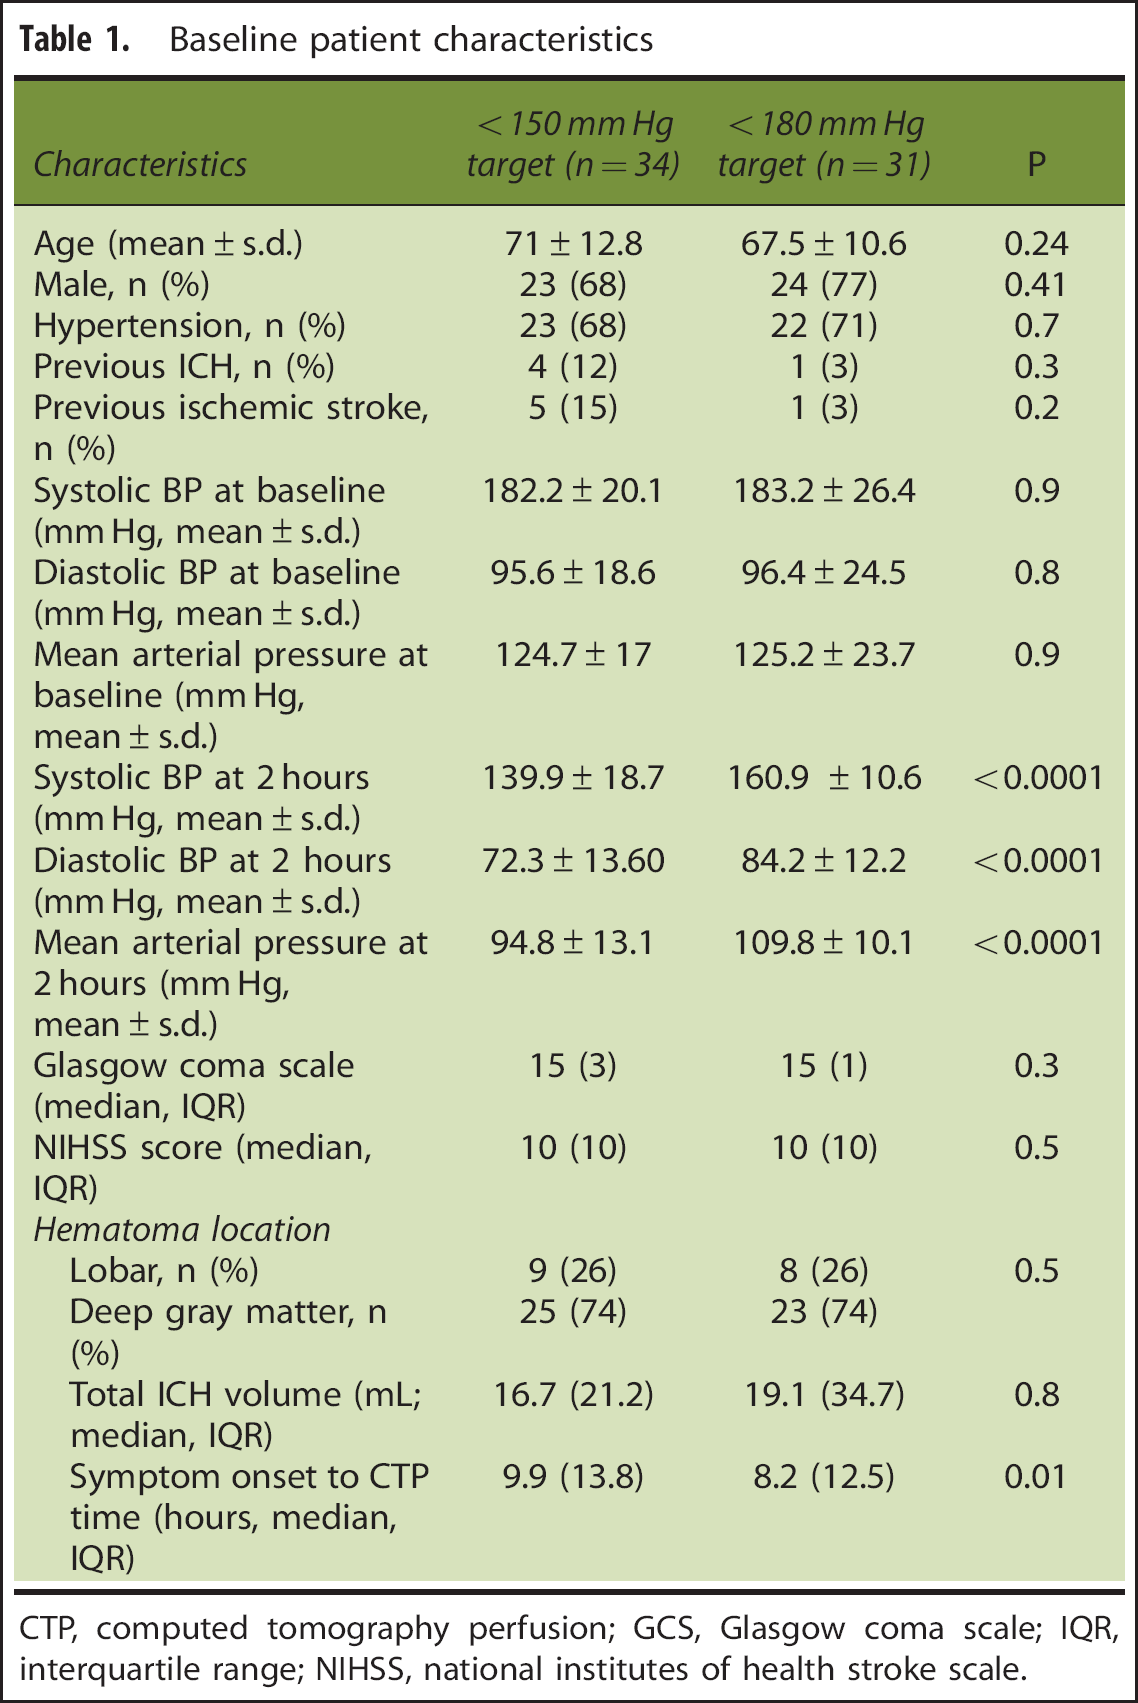
CTP, computed tomography perfusion; GCS, Glasgow coma scale; IQR, interquartile range; NIHSS, national institutes of health stroke scale.
Perihematoma Cerebral Blood Flow and Cerebral Blood Volume
The overall perihematoma CBF (37.1±10.8 mL/100 g per minute) was significantly lower than the contralateral homologous regions (44.8±10.3 mL/100 g per minute, P<0.001; Figure 1). Mean perihematoma CBF in the <150 mm Hg target BP group (37.2±11.9 mL/100 g per minute) did not differ from that in the <180 mm Hg group (35.8±9.6 mL/100 g per minute; P=0.307; Table 2). Similarly, perihematoma CBV did not differ between the two BP treatment groups (4.0±0.6 versus 3.6±0.7, P=0.872). The magnitude of systolic BP reduction did not predict perihematoma CBF (β=0.079, 95% CI (−0.015 to 0.174), P=0.097).
Mean perihematoma and contralateral homologous region oxygen metabolism in the two treatment target groups
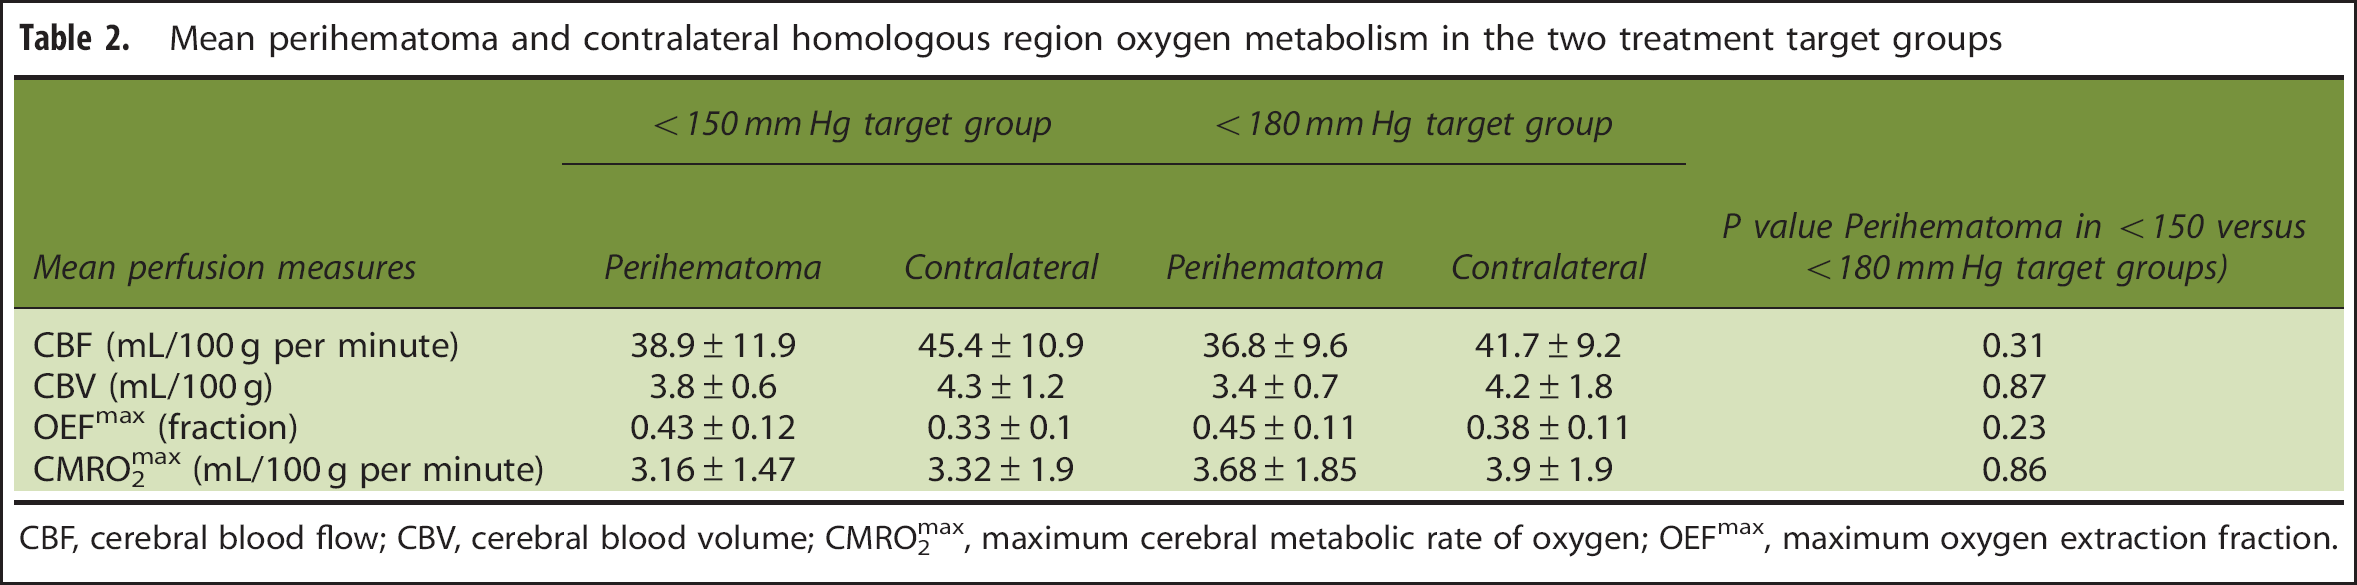
CBF, cerebral blood flow; CBV, cerebral blood volume; CMRO2max, maximum cerebral metabolic rate of oxygen; OEFmax, maximum oxygen extraction fraction.
Maximum Oxygen Extraction Fraction
Perihematoma OEFmax (0.44±0.12) was higher than in contralateral tissue (0.36±0.11, P<0.001). This 8.1%±5.6% elevation in perihematoma OEFmax did not meet the a priori criteria for impaired oxygenation. Acute BP treatment did not affect OEFmax in the perihematoma region (0.43±0.12 versus 0.45±0.11, P=0.232 in the<150 and <180 mm Hg target groups, respectively). In addition, the magnitude of systolic BP reduction did not predict perihematoma OEFmax (β=0.001, (−0.001 to 0.002], P=0.312). There was no correlation between hematoma volume and OEFmax (R2=0.01, P=0.34; Figure 2). Similarly, OEFmax was not related to perihematoma edema volume (R2=0.0002, P=0.24) or edema volume change 24 hours later (R2=0.02, P=0.46).
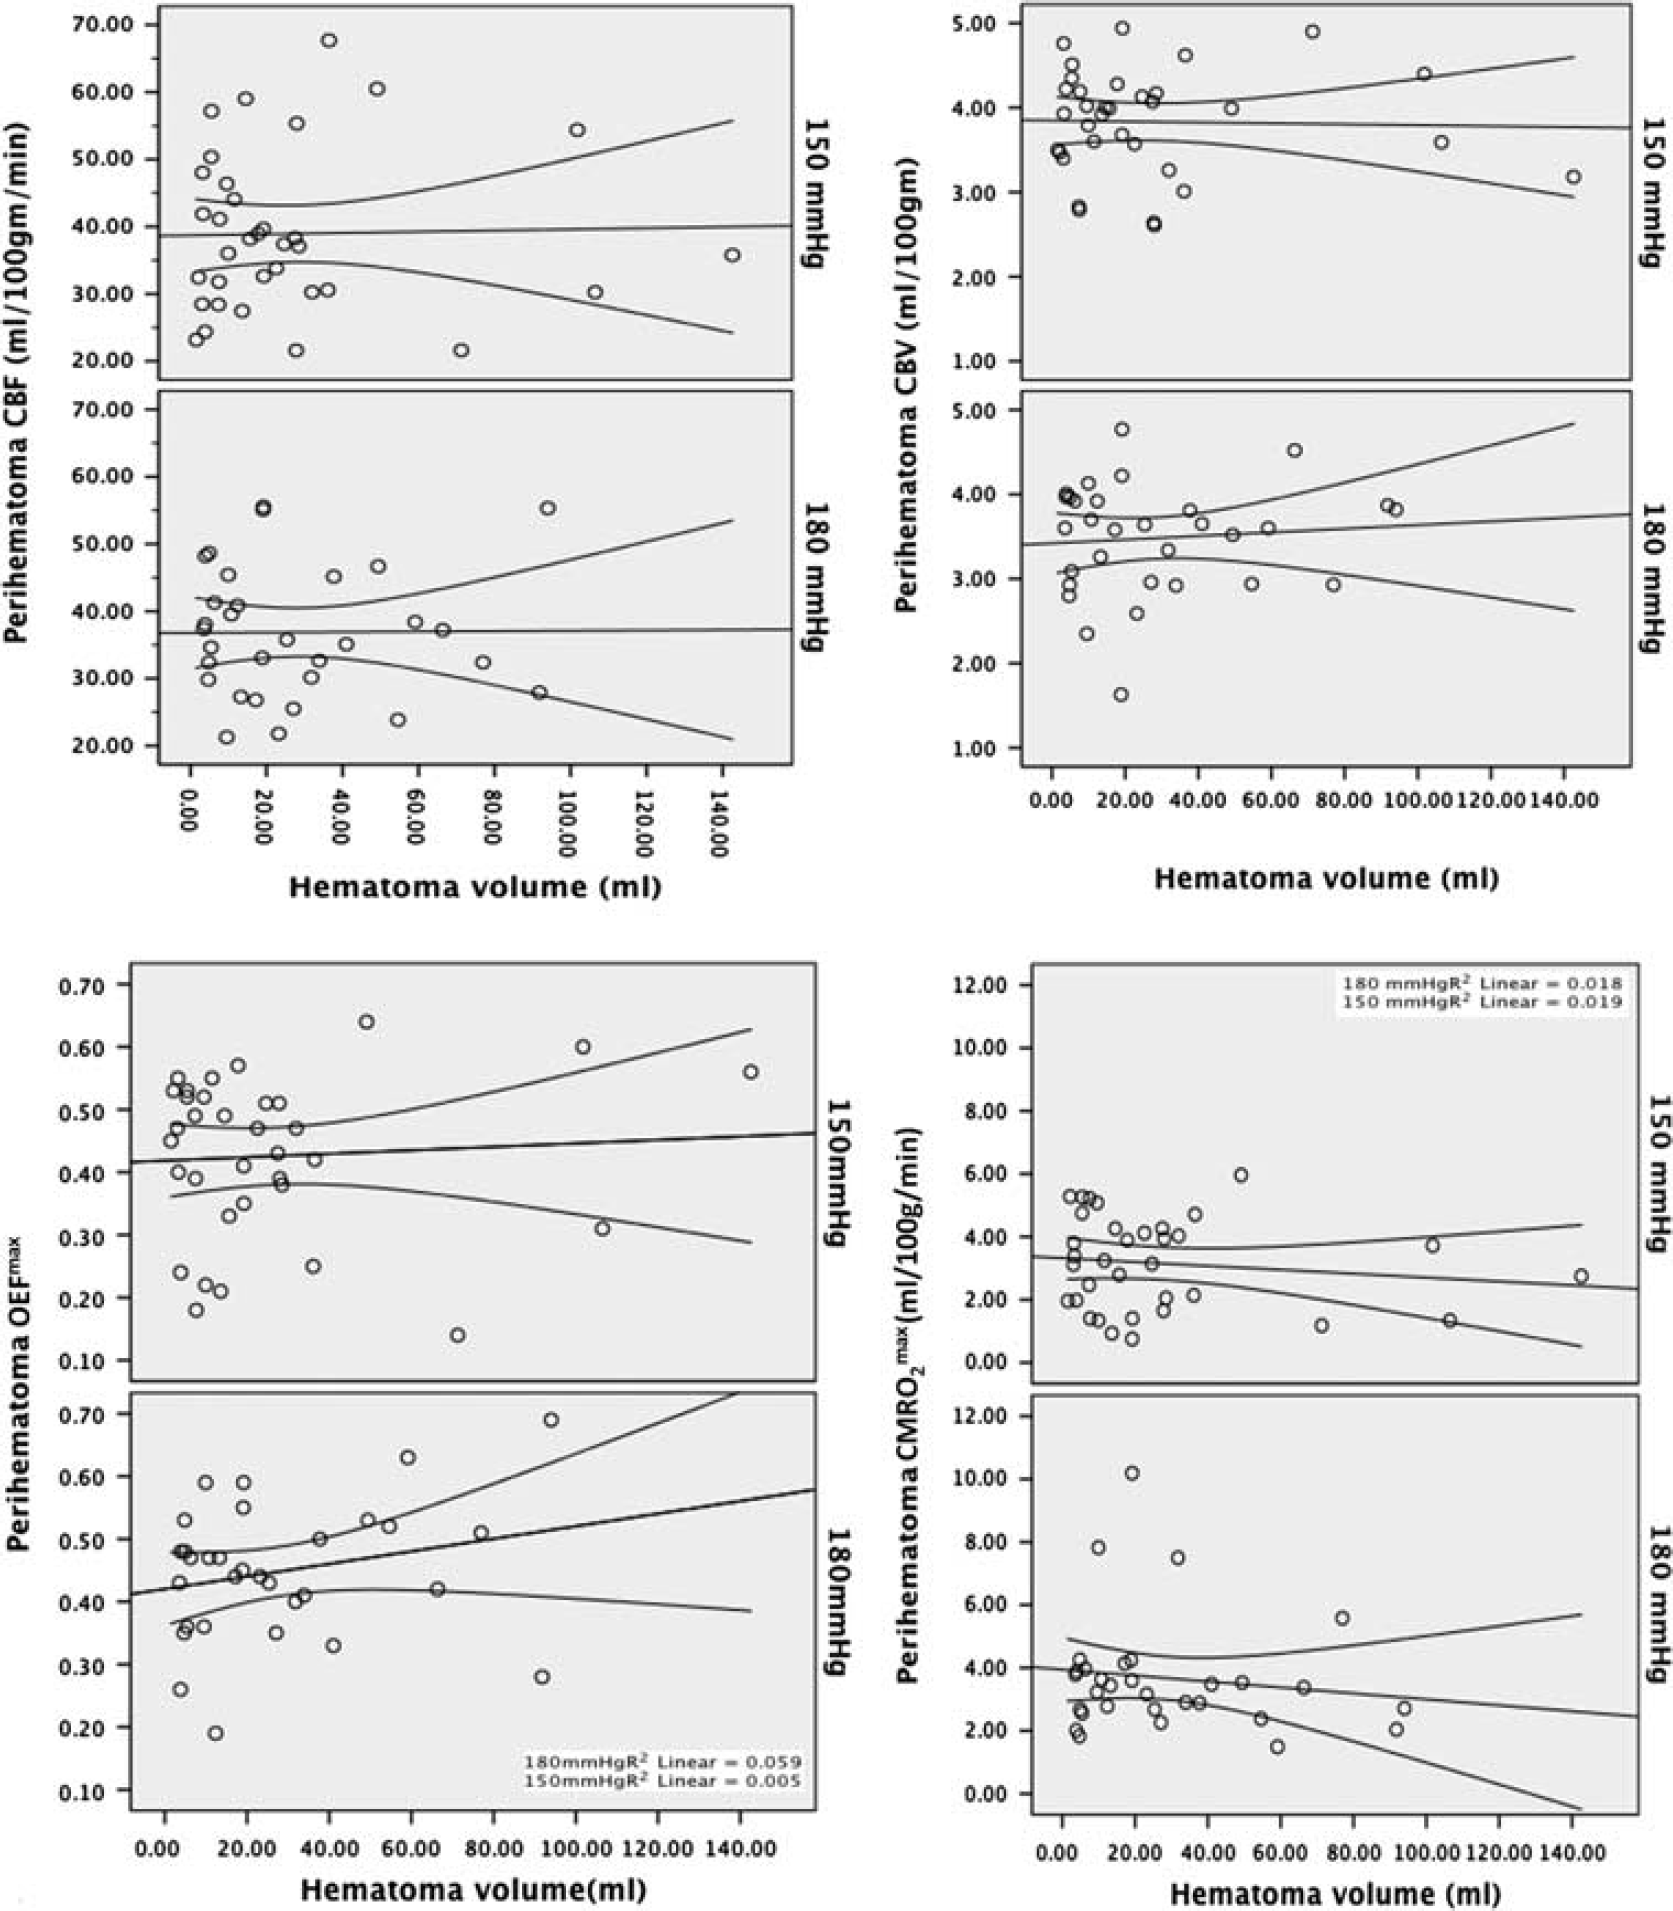
Linear regression plots demonstrating the lack of relationship between all perfusion parameters and hematoma volume in the two different blood pressure treatment target groups (<180 mm Hg and <150 mm Hg). CBF, cerebral blood flow; CBV, cerebral blood volume; OEFmax, maximum oxygen extraction fraction; CMRO2max, maximum cerebral metabolic rate of oxygen.
Net Tissue Oxygenation, Maximum Cerebral Metabolic Rate of Oxygen
Perihematoma CMRO2max was slightly lower than that in contralateral homologous regions (3.40±1.67 versus 3.63±1.66 mL/100 g per minute, P=0.025). Perihematoma CMRO2max did not differ between patients in the <150 mm Hg target BP (3.16±1.47 mL/100 g per minute) and the <180 mm Hg target group (3.68±1.85 mL/100 g per minute, P=0.857). In addition, the magnitude of systolic BP reduction did not predict perihematoma CMRO2max (β=0.011, (−0.003 to 0.026), P=0.125).
Serial Metabolic Changes
In nine patients, a CTP scan was performed before BP treatment, in addition to the two-hour post randomization study (Table 3). The mean perihematoma CBF was not significantly affected by BP treatment (33.03±10.35 pretreatment versus 30.21±5.24 mL/100 g per minute posttreatment, P=0.58). Similarly, mean perihematoma OEFmax and CMRO2max remained stable between the baseline (0.40±0.13, 2.5±1.07, P=0.45) and posttreatment scans (0.43±0.13, 2.55±1.1, P=0.9).
Serial perfusion assessment sub-study; before and 2 hours after blood pressure reduction (n=9 patients)
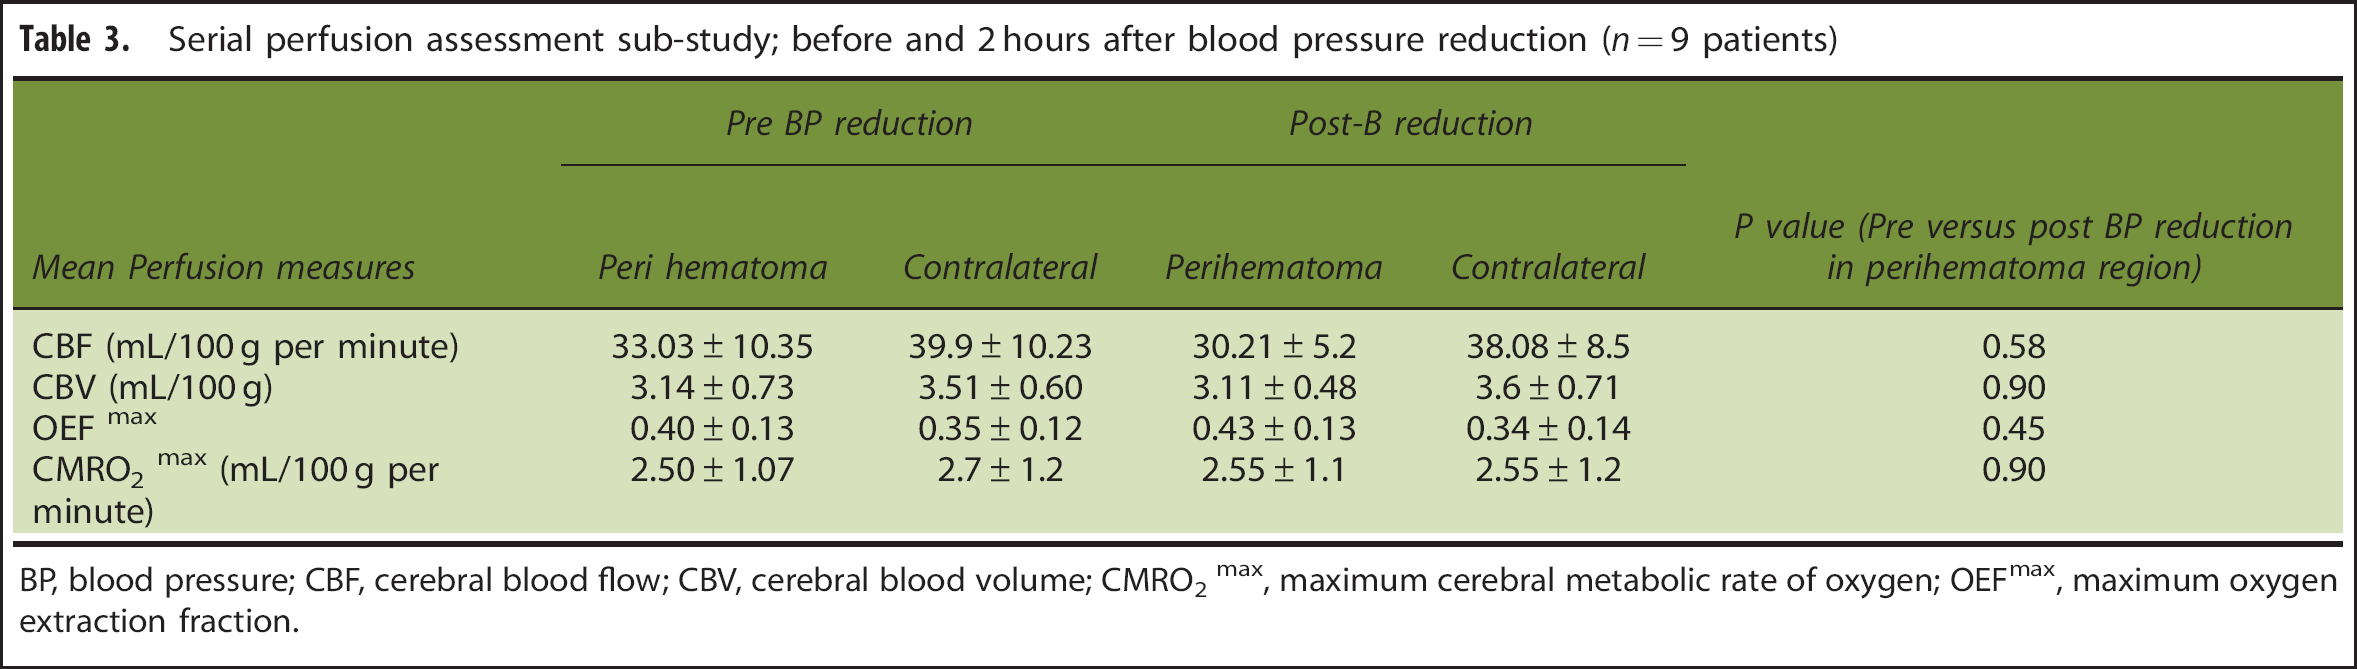
BP, blood pressure; CBF, cerebral blood flow; CBV, cerebral blood volume; CMRO2 max, maximum cerebral metabolic rate of oxygen; OEFmax, maximum oxygen extraction fraction.
DISCUSSION
This is the first analysis of perihematoma oxygenation changes in acute ICH patients randomized to two different BP treatment targets. The reduction in perihematoma CBF, without a marked increase in OEFmax does not suggest impaired oxygen delivery. Most importantly, from the perspective of patient management, neither OEFmax nor CMRO2max were affected by acute BP reduction. These data provide additional support for the safety of early BP lowering in ICH patients.
Perihematoma Region Metabolism
There are limited studies of metabolism in the perihematoma region. Zazulia et al 28 performed a 15 PET study in 19 ICH patients 5 to 22 hours after symptom onset and found reduced perihematoma OEF. These PET results reflect true reduced tissue consumption, by dysfunctional neurons. Our CT-based method measures oxygen availability, as derived from the hemodynamics of oxygenated blood, as opposed to the oxygen consumption measured by PET. Our results indicate preserved tissue oxygenation and are therefore consistent with those of Zazulia et al 28 . It is important to note that the magnitude of changes in both studies were relatively small. In the PET study, perihematoma OEF was 0.44±0.15 versus 0.47±0.13 (mean hemispheric value, superior to the hematoma). These OEF values and the OEFmax values reported in the present study are far smaller than the OEF values reported in severely hypoperfused tissue after acute stroke, i.e. misery perfusion. 29 These differences in perihematoma OEF are therefore unlikely to be clinically important.
The results of the study by Zazulia et al 28 and our own findings both confirm that CBF is relatively lower in the perihematoma region. The mean decrease in CBF was more marked in the Zazulia study (−16.1 mL/100 g per minute) relative to our results (−2.6 mL/100 g per minute). 12 This difference may be secondary to the inclusion of larger hemorrhages in the PET study, as hematoma volume has previously been shown to be predictive of perihematoma hypoperfusion. 6 More importantly, both studies indicated that the decrease in CBF is not severe enough to result in metabolic changes associated with ischemia. Zazulia et al 28 observed lower perihematoma cerebral metabolic rate of oxygen, whereas it was stable in our study. In both studies, it is clear that perihematoma cerebral metabolic rate of oxygen is not 0, which would indicate infarction, nor is it associated with markedly elevated OEF, or a misery perfusion pattern. It is likely that the metabolic rate of the perihematoma region does vary between patients and may be related to factors including hematoma volume and location. The higher spatial resolution of CTP relative to PET may also have contributed to differences between these two studies.
Other investigators have assessed oxygen metabolism in ICH patients using the PET ligand, 18 F-fluoromisonidazole, which is specific for tissue hypoxia. In the majority of patients studied, F-fluoromisonidazole PET revealed no evidence of hypoxia. 30 The same group of investigators later demonstrated limited regions of hypoxia (<1.5 mL) in two patients with very large (>50 mL) hematomas, again reflecting the heterogeneity of this region within and between individuals. 31 Perfusion-weighted MRI study results have also revealed oligemia within the 1 cm perihematoma region.6, 7, 10 Diffusion-weighted MRI studies have consistently shown elevated diffusion rates within the perihematoma region, with only small patchy areas of diffusion restriction seen in one study. 32 Taken together, the results of all of these studies and our own current results consistently indicate a lack of evidence for ischemia as a major pathologic mechanism of secondary neuronal injury in ICH.
Blood Pressure and Perihematoma Metabolism
The nature of perihematoma metabolism is most relevant to the question of acute BP management. Zazulia et al 12 did not systematically treat BP in their ICH patients imaged with PET, nor was BP at the time of OEF measurement reported. Our data are the first to indicate that perihematoma flow and oxygenation are unaffected by aggressive early BP reduction. In addition to similar OEFmax values in the two BP treatment groups, linear regression indicated no relationship between BP at the time of CTP imaging and perihematoma oxygen metabolism. These findings support the safety of early and aggressive BP reduction in ICH patients. They are also consistent with larger trials in ICH, which indicate that rapid BP reduction is not associated with worse clinical outcomes.33, 34
This study has a number of limitations. Estimation of OEFmax using CTP source data is an indirect measurement, based on the flow characteristics of iodinated tracer agent within the microvasculature. Direct measurement of the uptake rate of oxygen with 15 O-labeled water PET scan remains the gold standard for assessment of metabolic rate, and a more rigorous validation study of the flow heterogeneity technique in stroke patients remains outstanding. In addition, the maps generated in our study indicate that CBF and metabolism vary with tissue type. Thus, the relative measures will be affected by the selection of contralateral regions. We attempted to control this by reflecting our ROIs into homologous areas.
CONCLUSIONS
Perihematoma oligemia and metabolic changes are not consistent with misery perfusion. Acute aggressive BP reduction does not affect this metabolic pattern.
Footnotes
The authors declare no conflict of interest.