
Abstract
The purpose of this study was to assess whether calibrated magnetic resonance imaging (MRI) can identify regional variances in cerebral hemodynamics caused by vascular disease. For this, arterial spin labeling (ASL)/blood oxygen level-dependent (BOLD) MRI was performed in 11 patients (65±7 years) and 14 controls (66±4 years). Cerebral blood flow (CBF), ASL cerebrovascular reactivity (CVR), BOLD CVR, oxygen extraction fraction (OEF), and cerebral metabolic rate of oxygen (CMRO2) were evaluated. The CBF was 34±5 and 36±11 mL/100 g per minute in the ipsilateral middle cerebral artery (MCA) territory of the patients and the controls. Arterial spin labeling CVR was 44±20 and 53±10% per 10 mm Hg ΔEtCO2 in patients and controls. The BOLD CVR was lower in the patients compared with the controls (1.3±0.8 versus 2.2±0.4% per 10 mm Hg ΔEtCO2,
Keywords
INTRODUCTION
Severe steno-occlusive disease in the feeding arteries of the brain may result in a reduction of perfusion pressure in the vasculature distal to the obstructive lesion, and may change cerebral hemodynamics. 1 The first pathway to counteract the reduction in perfusion pressure involves lowering the resistance of the microvascular bed through vasodilatation. The ability of the vasculature to modulate its tone through dilation or constriction is called the cerebrovascular reserve capacity, which is typically evaluated by measuring the cerebrovascular reactivity (CVR). 2 Upon exhaustion of the cerebrovascular reserve capacity, further reductions in perfusion pressure are countered by increasing the oxygen extraction fraction (OEF) 3 from arterial blood. When these mechanisms are not sufficient, the cerebral metabolic rate of oxygen (CMRO2) will decrease and this can lead to tissue ischemia.1,3
Impaired CVR is a predictor for increased risk of ipsilateral stroke and transient ischemic attack (TIA) in patients with steno-occlusive carotid disease.4,5 Similarly, increased OEF has been shown to predict recurrent ischemic stroke in patients with symptomatic occlusive disease of the cerebral vasculature. 6 Furthermore, a higher stroke risk has been observed in patients with impaired CVR and increased OEF when compared with patients with impaired CVR only. 7
The current gold standard through which the full range of brain hemodynamic parameters can be investigated is triple oxygen positron emission tomography (O15-PET) imaging. The O15-PET provides quantitative estimates of cerebral blood flow (CBF), cerebral blood volume (CBV), OEF, and CMRO2.
8
This technique is invasive and relies on radioactive oxygen-15 (half-life: 2 minutes), which can only be produced in an onsite cyclotron. As an alternative, perfusion or flow techniques combined with a vasodilatory stimulus have been proposed to evaluate the CVR. Invasive techniques such as xenon-enhanced computed tomography
5
or noninvasive techniques such as Doppler ultrasonography,
4
blood oxygen level-dependent (BOLD) magnetic resonance imaging (MRI),
9
or arterial spin labeling MRI
10
have been suggested. A dualecho arterial spin labeling (ASL) sequence can acquire perfusion data (first echo) and BOLD data (from the second echo which has
The purpose of this study was to evaluate whether calibrated MRI techniques could be used to detect regional differences in quantitative hemodynamic parameters caused by vascular disease. If so, calibrated MRI techniques might be used in the future to recognize patients at risk for ischemic stroke, or to evaluate the effect of new drug therapies on cerebral hemodynamics. To evaluate the potential of calibrated MRI, we included patients with an occlusion of the internal carotid artery (ICA) as well as healthy controls. The results from clinical patients were compared against those of the healthy age-matched control group. Regional differences in hemodynamic parameters within the patients were evaluated and the success rate of the hemodynamic measurements (CBF, CBV, CVR, OEF, and CMRO2) was assessed.
MATERIALS AND METHODS
SUBJECTS
This study was approved by the medical ethical review board review board of the University Medical Center Utrecht (Utrecht, The Netherlands). The trial number was NL39070.041.11. The experiments were performed according to the guidelines and regulations of the WMO (Wet Medisch wetenschappelijk Onderzoek). Signed informed consent was obtained from all subjects included in this study. Fifteen asymptomatic (for 9±4 years) patients (14 male) with unilateral or bilateral ICA occlusion were included. The mean age of these patients was 65±7 years. Magnetic resonance imaging could not be completed in four patients due to claustrophobia (
Baseline characteristics of the patients with ICA occlusion
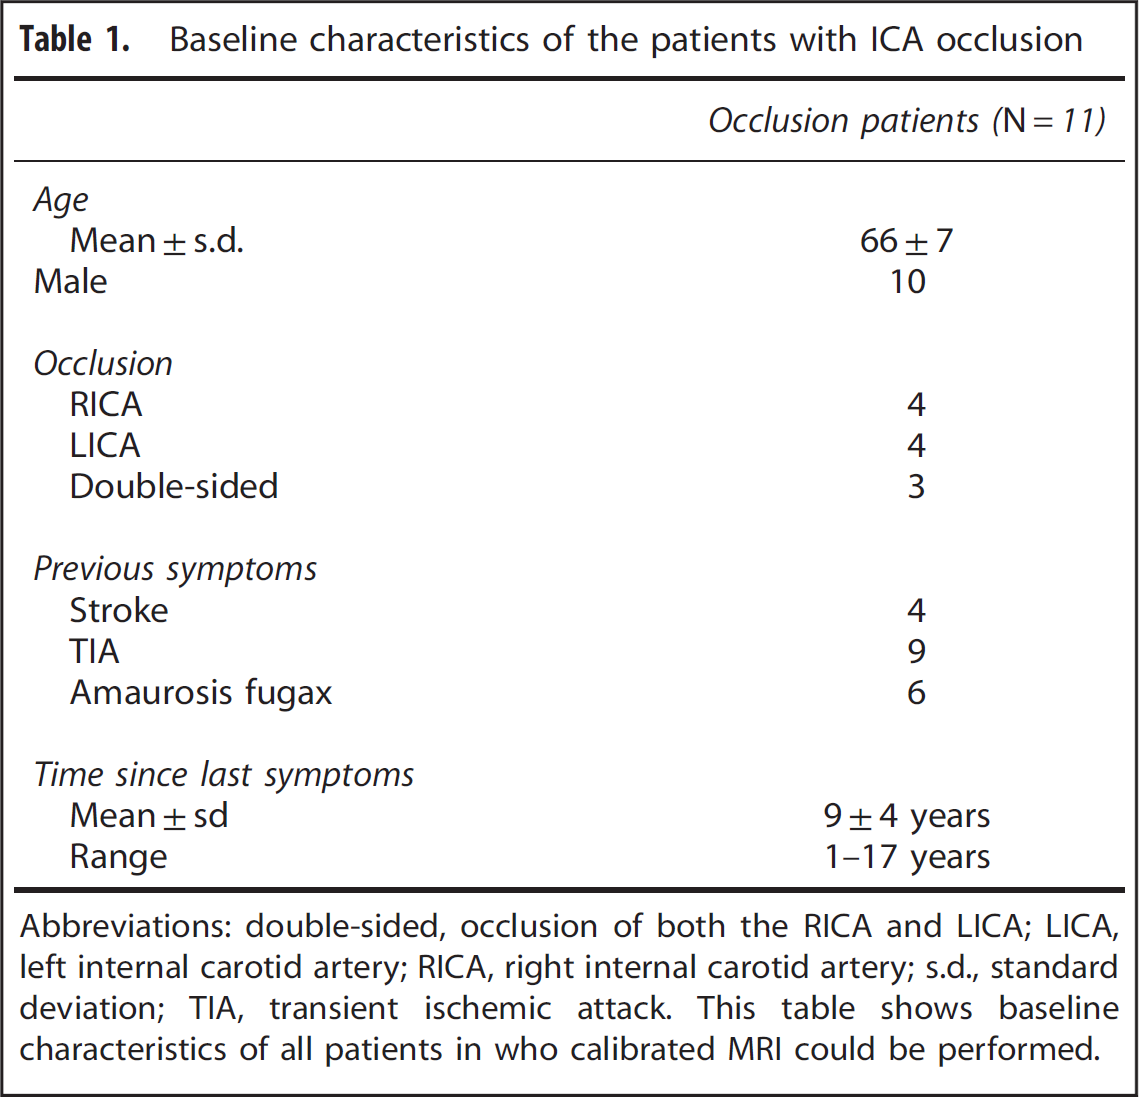
Abbreviations: double-sided, occlusion of both the RICA and LICA; LICA, left internal carotid artery; RICA, right internal carotid artery; s.d., standard deviation; TIA, transient ischemic attack.
This table shows baseline characteristics of all patients in who calibrated MRI could be performed.
Magnetic Resonance Imaging
Magnetic resonance imaging was performed on a Philips 3 tesla system using a quadrature body coil for transmission and an 8-channel receiver head coil (Achieva, Philips Medical Systems, Best, The Netherlands). The scan protocol consisted of a
Respiratory Paradigm
End-tidal partial pressures of oxygen and carbon dioxide (EtO2 and EtCO2) were targeted using a computer controlled sequential gas delivery system (RespirAct, Thornhill Research Inc., ON, Toronto, Canada). 18 The respiratory paradigm executed during the dual-echo pCASL sequence consisted of baseline breathing interleaved with two hypercapnic blocks of 105 seconds in which EtCO2 was targeted at 10 mm Hg above the individual subject baseline EtCO2 and one block of 180 seconds of hyperoxic breathing with a target of 300 mm Hg EtO2. Table 2 shows the EtO2 and EtCO2 values at baseline, at hypercapnic, and at hyperoxic breathing for the patients and the control subjects.
End-tidal partial pressures
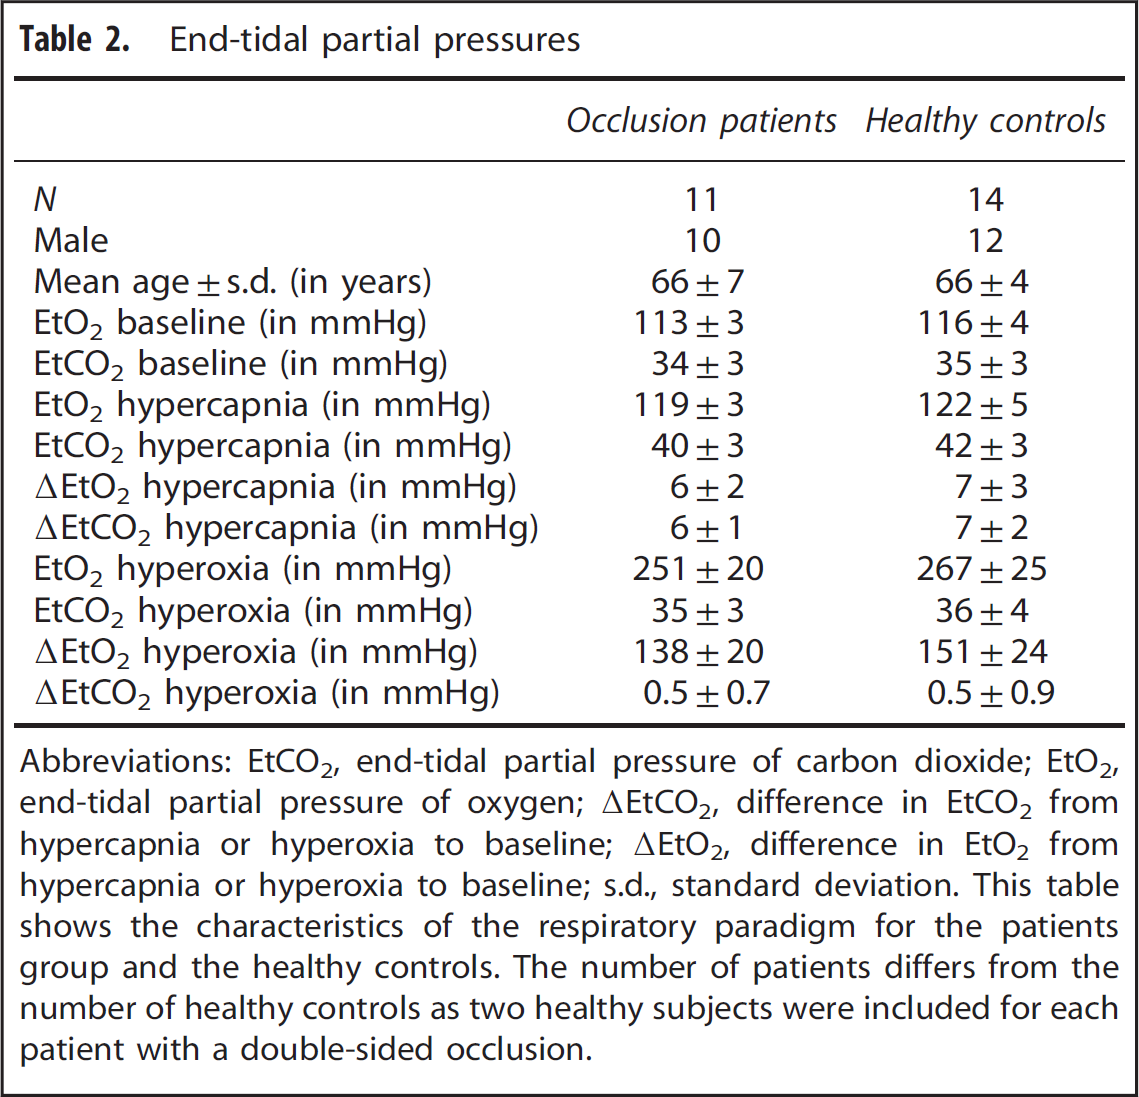
Abbreviations: EtCO2, end-tidal partial pressure of carbon dioxide; EtO2, end-tidal partial pressure of oxygen; ▵EtCO2, difference in EtCO2 from hypercapnia or hyperoxia to baseline; ▵EtO2, difference in EtO2 from hypercapnia or hyperoxia to baseline; s.d., standard deviation.
This table shows the characteristics of the respiratory paradigm for the patients group and the healthy controls. The number of patients differs from the number of healthy controls as two healthy subjects were included for each patient with a double-sided occlusion.
Postprocessing
The resulting transformation matrix was then applied to the second echo data. Echo label and control images were then surround subtracted to create ΔM images.
19
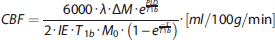
Data (AM images) obtained at baseline breathing, stable hypercapnic breathing, and stable hyperoxic breathing were averaged to create mean (baseline, hypercapnic, and hyperoxic) images. Perfusion was quantified on these ΔMtotal images using the following formula:
20
The BOLD signal time series was detrended to remove signal drift using a quadratic function to the baseline time points. Arterial spin labeling and BOLD CVR was determined by calculating the percent CBF and BOLD change and dividing these values by the magnitude of the individual's hypercapnic breathing challenge (ΔEtCO2) and then normalize this value to a change of 10 mm Hg ΔEtCO2.
Next, a general BOLD signal model was used to calculate the OEF and CMRO2 maps; first, the theoretical maximum BOLD signal change (M), that would emerge with a complete removal of deoxyhemoglobin, was estimated using the hypercapnia calibration model:
13
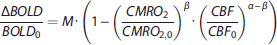
Next, relative changes in deoxyhaemoglobin (HHb) concentration were calculated using the hyperoxia calibration model proposed by Chiarelli 

The calculation of the OEF
13
and the CMRO2 (through the OEF and the Ca) rely on an assumed hemoglobin level of 15 g Hb per dL blood and a hematocrit value of 44%.
24
To evaluate the validity of this assumption, and to investigate potential differences within this parameter in between the patients and the controls, we estimated the hematocrit based on the 
Data Analysis
Data analysis of the processed calibrated MRI data was performed using FMRIB Software Library (FSL, FMRIB, Oxford, UK). For this, brain tissue voxels of the MP-RAGE images were isolated using the brain extraction tool.
26
The
Statistical Analysis
IBM SPSS statistics (version 19.0.1., SPSS Inc., Chicago, IL, USA) were used for statistical analysis. Before statistical analysis, the presence of delayed arrival artifacts (DAAs) on the ASL maps was scored by two readers in a consensus meeting. Delayed arrival artifact was scored positive when the following two signs were present. Sign one, part of the brain tissue did not receive inflow signal at the time of readout, and this part of the brain did not show any signs of ischemia on conventional MR images. Sign two, the labeled signal was still present in the vasculature at the time of readout. Hereafter, statistical analysis was performed both including and excluding the subjects with DAAs. For this analysis and for the values shown, it is important to realize that for each individual subject, the BOLD CVR and ASL CVR was normalized to the BOLD signal change and the percentage perfusion change that would occur as a response to a hypercapnic stimulus of 10 mm Hg. A
Values of the hemodynamic parameters obtained in the gray matter of the ipsilateral MCA territory of patients (ipsilateral to the occluded vessel) were compared with values obtained in healthy controls using Student's
The mean
Simulations
RESULTS
The Success Rate of the Hemodynamic Measurements and Patient Examples
Delayed arrival artifacts were apparent in the perfusion maps of three out of eleven patients. These artifacts propagated to the respective OEF and CMRO2 maps and analyses were performed including and excluding these patients.
Mean hemodynamic parameter maps were created. Figure 1A shows the mean maps of all subjects without DAA (left hemisphere) and the mean maps of their corresponding controls (right hemisphere). Figure 1B shows the mean maps of all subjects with DAA (left hemisphere) and the mean maps of their corresponding controls (right hemisphere).
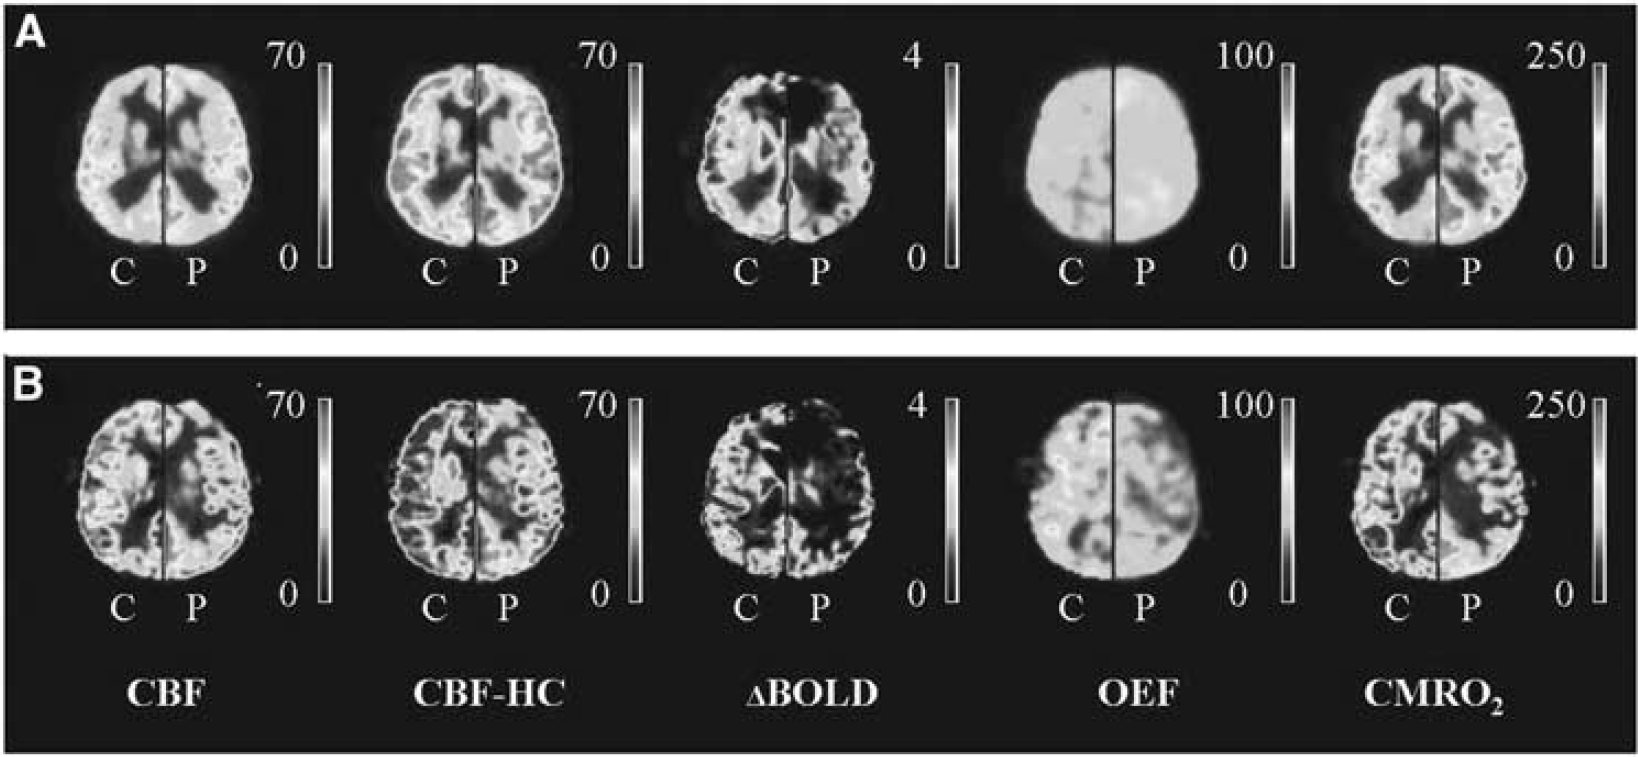
Hemodynamic maps. (
One 54-year-old male patient with a right-sided ICA occlusion showed increased OEF in both MCA territories. This patient had a TIA, a minor stroke, and amaurosis fugax in the clinical history, but was asymptomatic at the time of MRI for over 7 years. Quantitative data of the ipsilateral and contralateral MCA territory of this patient along with corresponding quantitative hemodynamic maps are shown in Figure 2A. In Figure 2B, quantitative data and hemodynamic maps of a 70-year-old male subject with bilateral occlusion of the internal carotid arteries are shown. This patient had a TIA and amaurosis fugax in the clinical history, but was asymptomatic at the time of MRI for over 10 years. In this patient, we found the OEF to be higher and the CMRO2 to be lower in the gray matter of the left MCA territory compared to the gray matter of the right MCA territory, which may suggest that the left MCA territory is more vulnerable to future ischemic events. 31
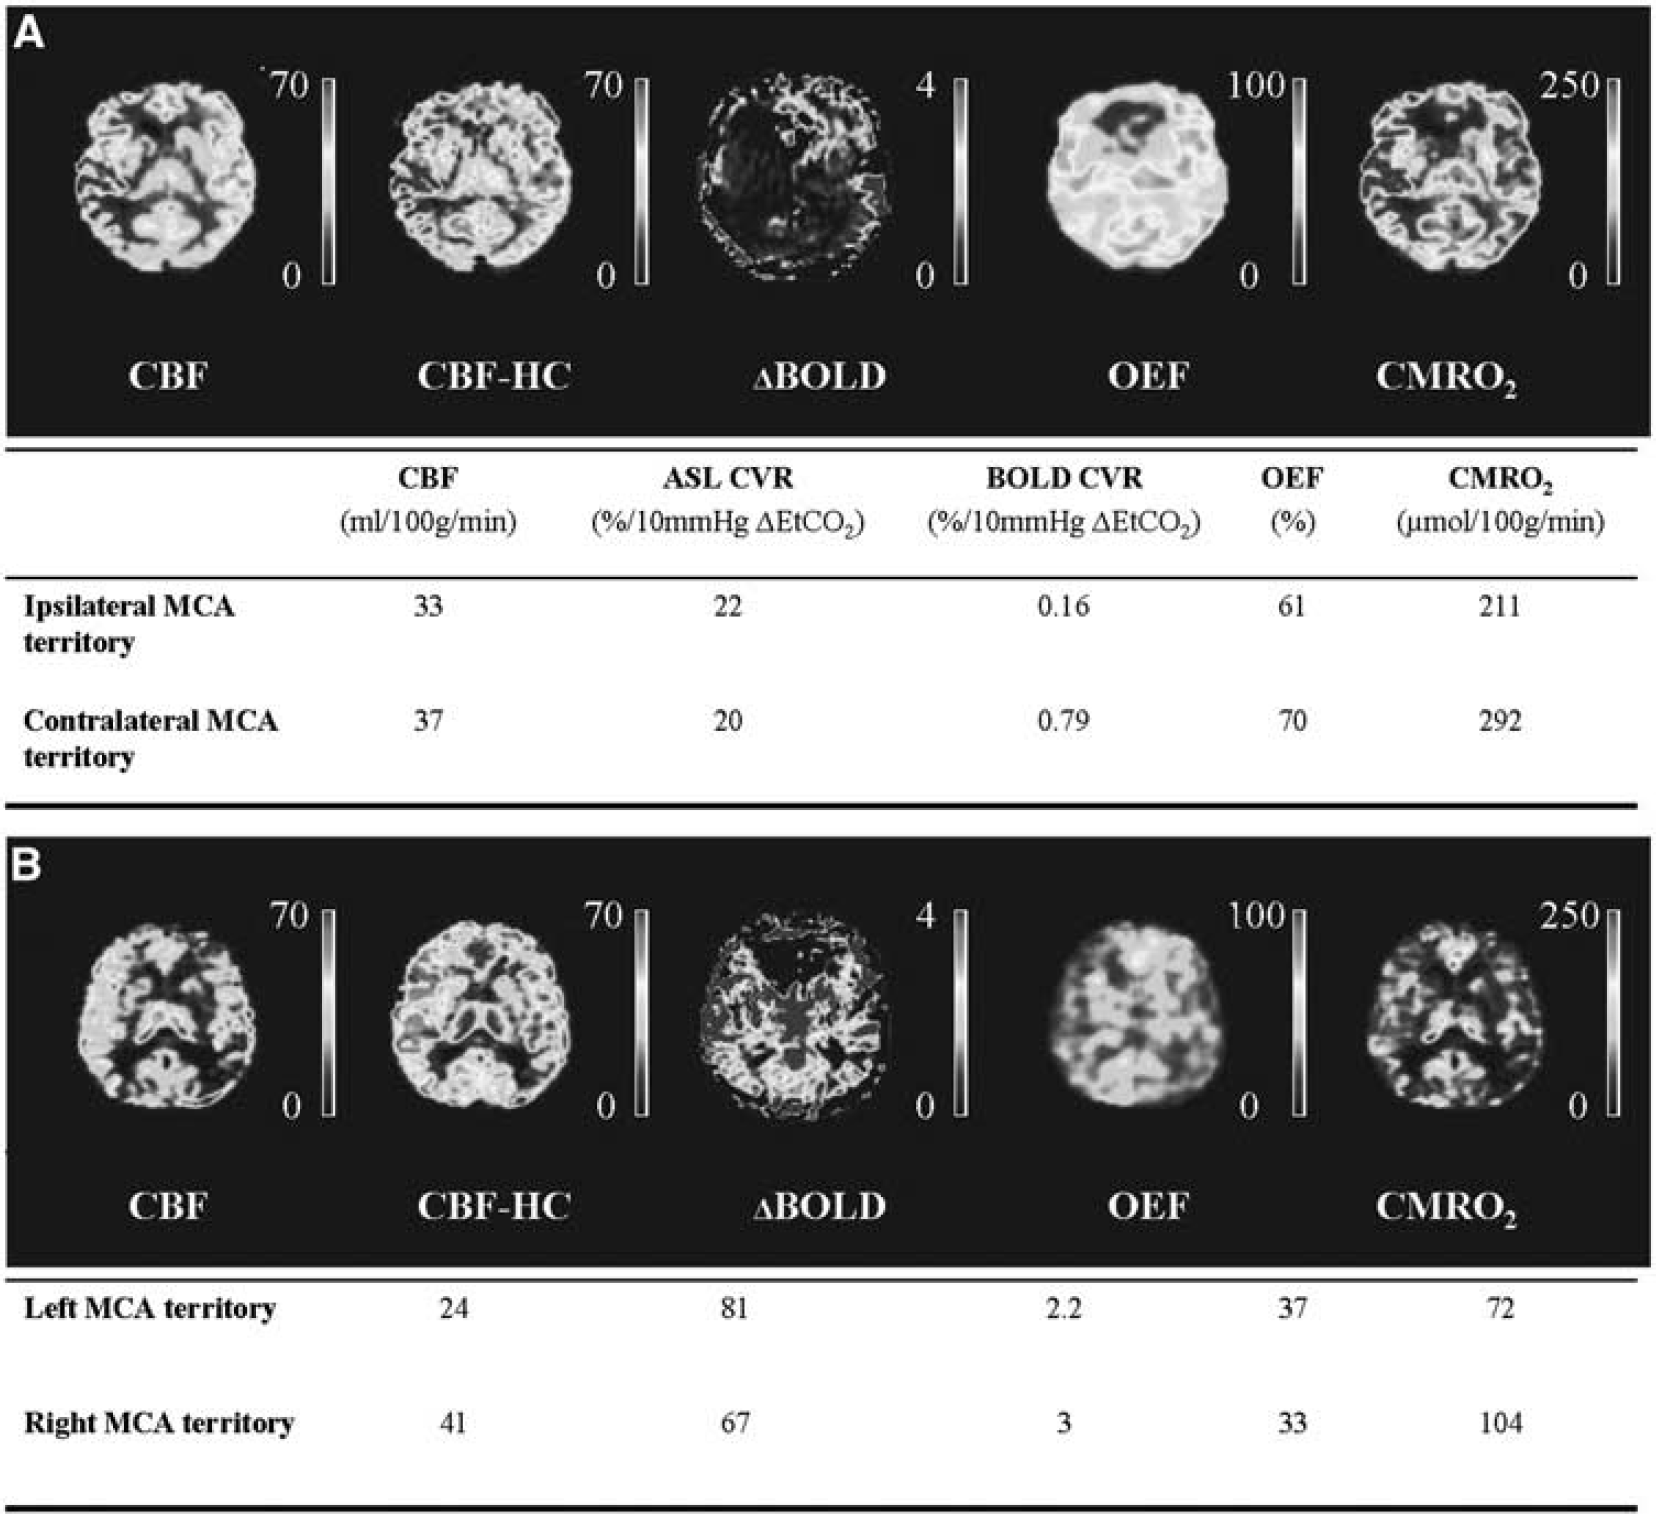
Patient example. (
Patients Versus Healthy Control Subjects
In the 11 patients with either one-sided or double-sided ICA occlusion, there were 14 MCA territories with an ipsilateral occluded ICA. Of these 14 MCA territories and 3 MCA territories showed DAA. The remaining 11 MCA territories (no DAA) were compared with a matched MCA territory of a healthy control subject. Mean BOLD CVR in the gray matter of the ipsilateral patient MCA territories was significantly lower than in the controls (1.3±0.8% versus 2.2±0.4% per 10 mm Hg ΔEtCO2). No significant differences in baseline CBF (34±5 versus 36±11 mL/100 g per minute), ASL CVR (44±20% versus 54±10% per 10 mm Hg ΔEtCO2), OEF (41±8% versus 38±6%) or CMRO2 (116±39 versus 111±40 μmol/100 g per minute) were found between the patients and the controls (Table 3).
Hemodynamic parameters in patients versus healthy controls
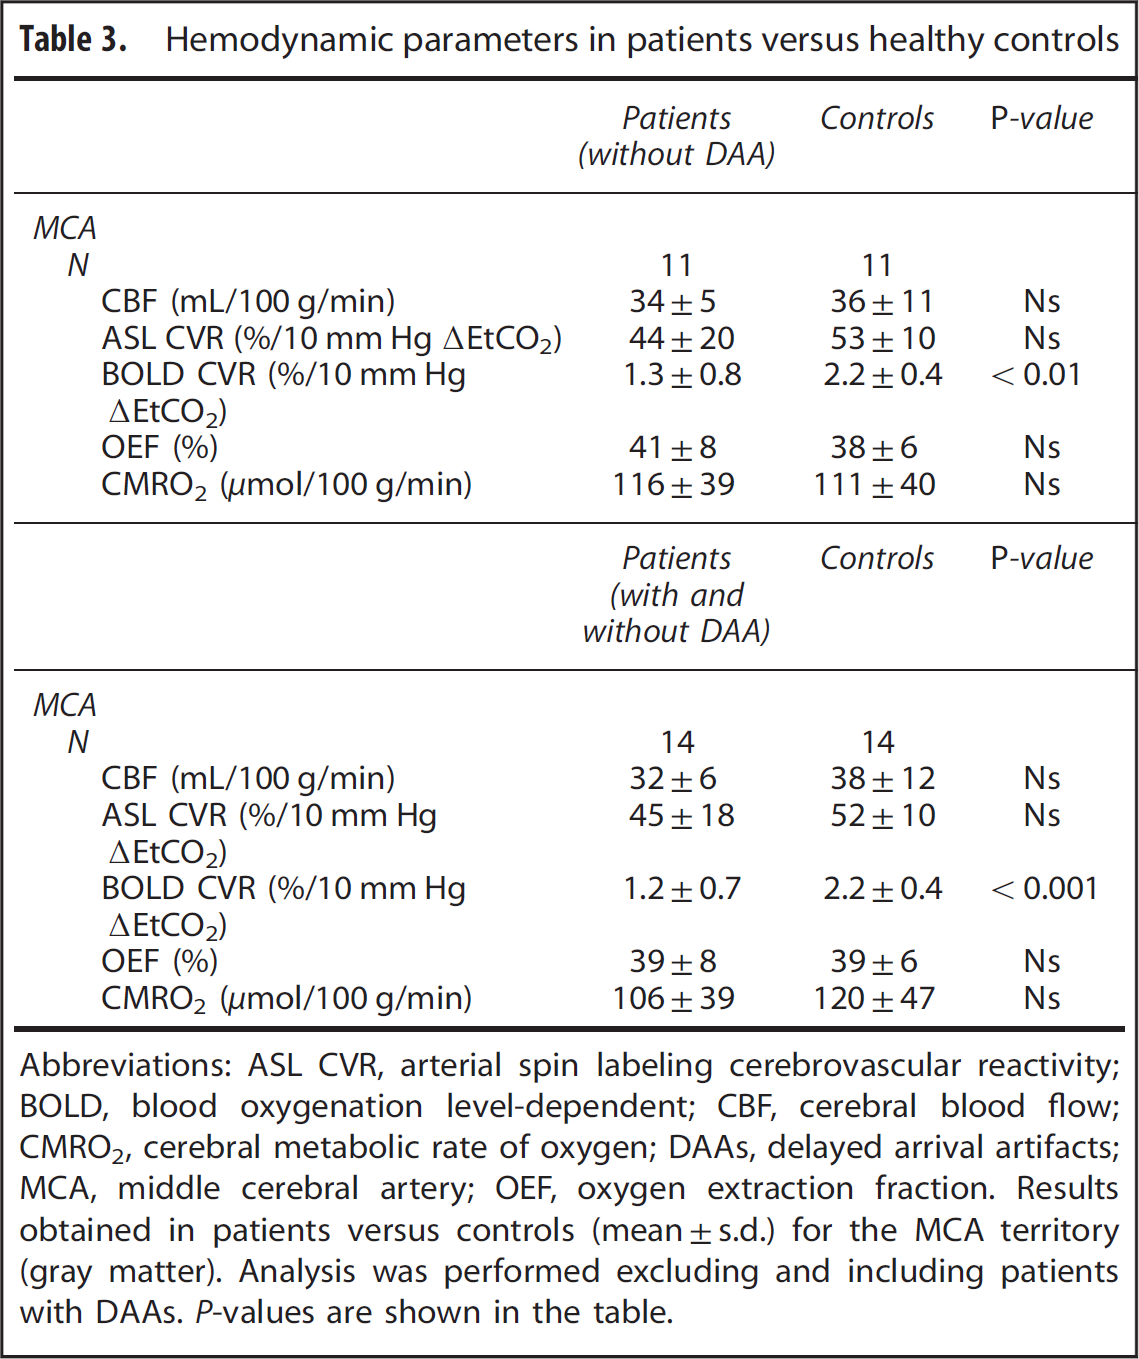
Abbreviations: ASL CVR, arterial spin labeling cerebrovascular reactivity; BOLD, blood oxygenation level-dependent; CBF, cerebral blood flow; CMRO2, cerebral metabolic rate of oxygen; DAAs, delayed arrival artifacts; MCA, middle cerebral artery; OEF, oxygen extraction fraction.
Results obtained in patients versus controls (mean±s.d.) for the MCA territory (gray matter). Analysis was performed excluding and including patients with DAAs.
When the patients showing DAA were included in the analysis, 14 MCA territories of patients could be compared with 14 MCA territories of healthy matched controls. Mean BOLD CVR was significantly lower in the gray mater of the ipsilateral MCA territories of the patient group (1.2±0.7% versus 2.2±0.4% per 10 mm Hg ΔEtCO2). No differences were found in CBF (32±6 versus 38±12 mL/100 g per minute), ASL CVR (45±18 versus 52±10% per 10 mm Hg ΔEtCO2), OEF (39±9% versus 39±6%), or CMRO2 (106±39 versus 120±47 μmol/100 g per minute) (Table 3).
Ipsilateral Versus Contralateral Middle Cerebral Artery Territory in Patients
Eight patients had a one-sided occlusion (Table 1). Of these eight patients, five patients did not show DAA. When comparing the gray matter of the ipsilateral with the gray matter of the contralateral MCA territory of these five patients, BOLD CVR was significantly lower in the ipsilateral versus contralateral MCA territories (1.2±0.6% and 1.6±0.5% per 10 μm Hg ΔEtCO2, see Table 3). No significant differences in CBF (34±4 versus 39±7 mL/100 g per minute), ASL CVR (44±17% versus 47±20% per 10 mm Hg ΔEtCO2), OEF (44±10% versus 48±13%), or CMRO2 (130±48 versus 168±78 μmol/100 g per minute) were found between either territories (Table 4).
Ipsilateral MCA territory versus contralateral MCA territory
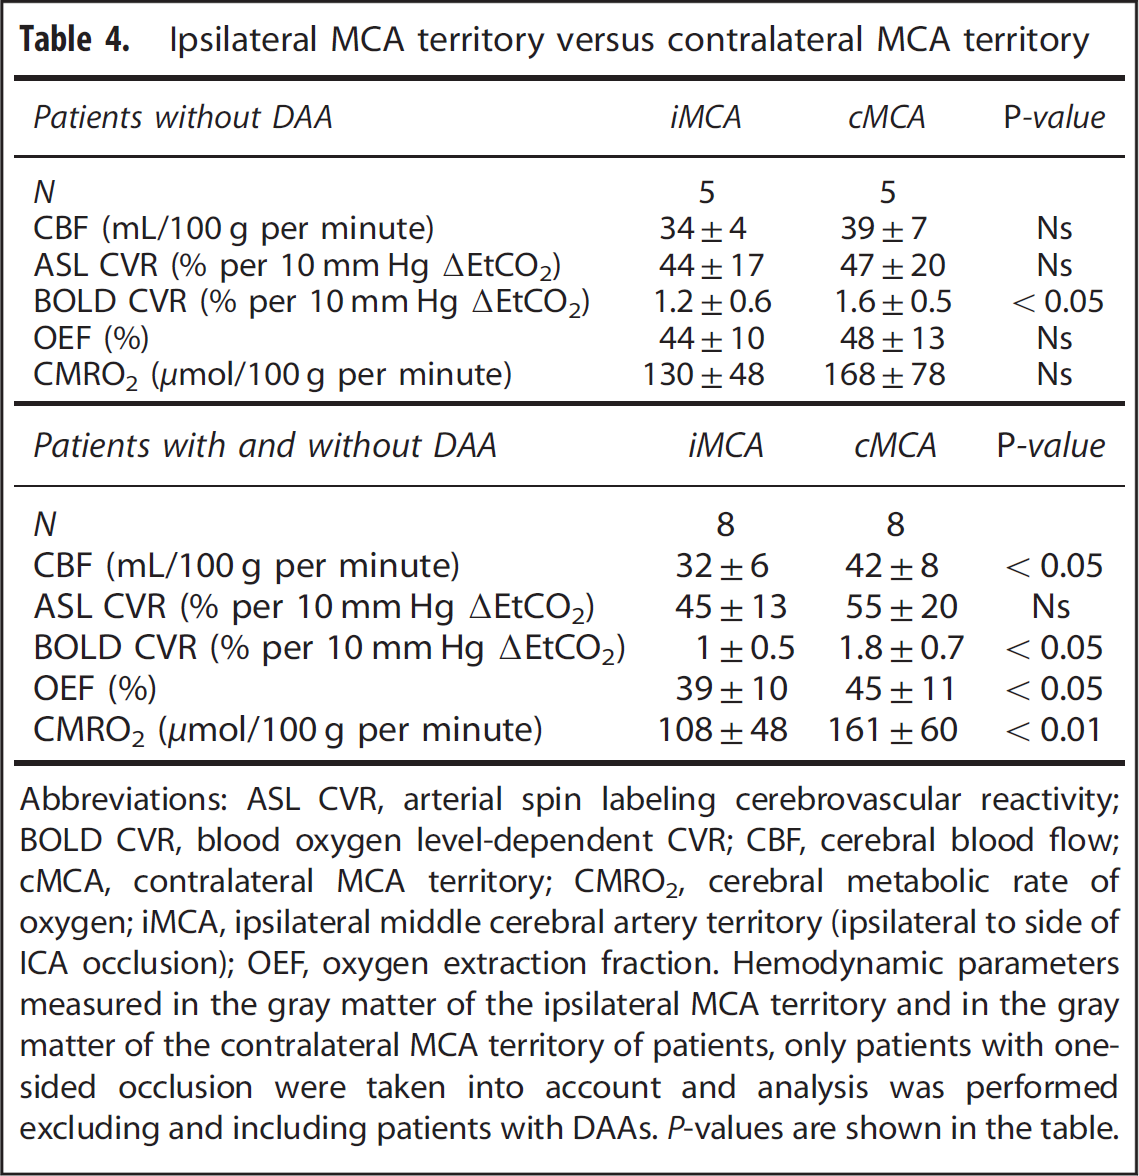
Abbreviations: ASL CVR, arterial spin labeling cerebrovascular reactivity; BOLD CVR, blood oxygen level-dependent CVR; CBF, cerebral blood flow; cMCA, contralateral MCA territory; CMRO2, cerebral metabolic rate of oxygen; iMCA, ipsilateral middle cerebral artery territory (ipsilateral to side of ICA occlusion); OEF, oxygen extraction fraction.
Hemodynamic parameters measured in the gray matter of the ipsilateral MCA territory and in the gray matter of the contralateral MCA territory of patients, only patients with one-sided occlusion were taken into account and analysis was performed excluding and including patients with DAAs.
When including the patients with DAA, eight ipsilateral MCA territories could be compared with their contralateral counterparts. Cerebral blood flow (32±6 versus 42±8 mL/100 g per minute), BOLD CVR (01±0.5% versus 1.8±0.7% per 10 mm Hg ΔEtCO2), OEF (39±10% versus 45±11%) and CMRO2 (108±48 versus 162±60; μmol/100 g per minute) were significantly lower in the ipsilateral than in the contralateral MCA territory (Table 4). There was no difference in ASL CVR between the ipsilateral and contralateral MCA territory (45±13% versus 55±20% per 10 mm Hg ΔEtCO2).
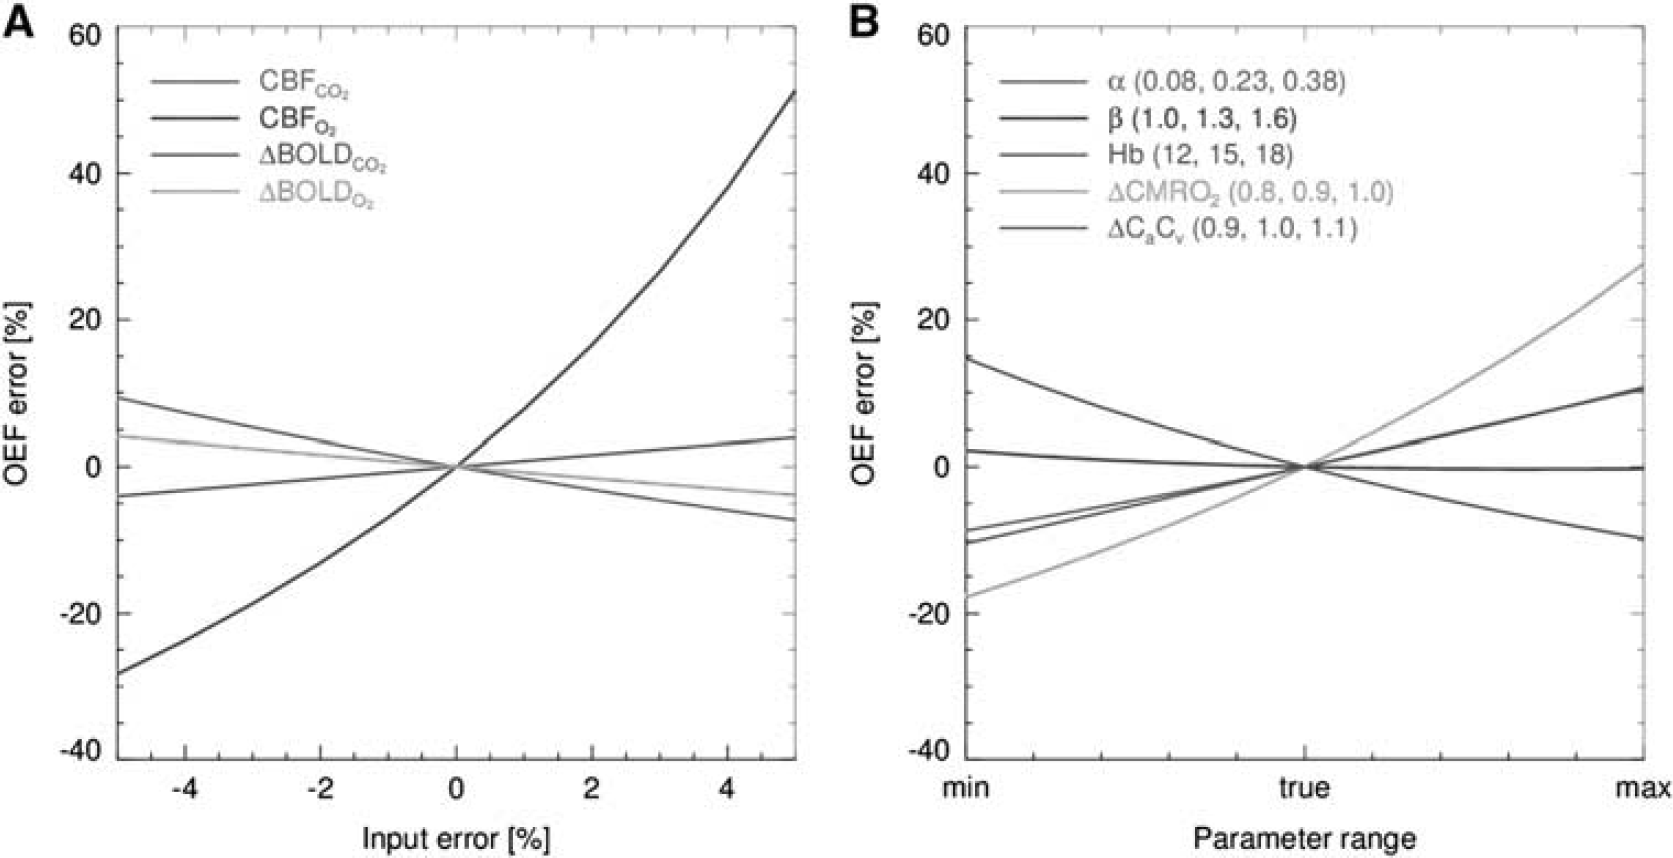
Reliability of Assumptions and Simulations Data of the blood
In Figure 3A, the OEF error induced by errors in the measured CBF and BOLD data is shown. From this figure, it can be seen that small errors within the CBF measurements performed at hyperoxia level, potentially can cause large errors in the order of 50% on the OEF estimate. In Figure 3B, the effect of errors in
(
DISCUSSION
We set out to investigate whether calibrated MRI can detect variances in hemodynamic parameters caused by vascular disease.
This information could potentially be used in the future to evaluate the risk of stroke recurrence or effectiveness of new drug therapies. One of our patients did in fact show increased OEF corresponding to misery perfusion, which supports the feasibility of calibrated MRI to detect variations in hemodynamic parameters. When performing group analysis, we found a significantly lower BOLD CVR in the gray matter of the ipsilateral MCA territory of patients with cerebrovascular occlusive disease as compared with their contralateral MCA territory. We observed a significantly lower BOLD CVR in the gray matter of the ipsilateral MCA territory of patients compared with the healthy controls. Thus, we showed that calibrated MRI can identify regional differences in quantitative hemodynamic parameters, which can be related to vascular disease. However, the success rate of calibrated MRI in the clinical patients was limited due to anxiety in more than 10% of the patients and due to the presence of DAAs of the pASL perfusion method in 27% of the patients.
A Comparison to Literature Values Obtained by Arterial Spin Labeling and Blood Oxygen Level-Dependent Magnetic Resonance Imaging
To the best of our knowledge calibrated MRI has not been used to investigate hemodynamic changes related to vascular disease. Arterial spin labeling and BOLD MRI have been used separately to evaluate the CBF and the CVR. Previous studies showed that baseline whole brain CBF was decreased in symptomatic patients with a high-grade arterial stenosis compared with healthy controls (42.3 versus 55.7 mL/100 g per minute).
32
We could not confirm this, possibly due to our selection of patients having a long asymptomatic period. This is in agreement with an earlier study which confirmed that patients with a normal CBF have a good prognosis independent of their CVR.
33
Similar to an earlier study, we found slightly lower (but not significant) ASL CVR in the gray matter of the ipsilateral MCA territory (44% per 10 mm Hg ΔEtCO2) compared with the gray matter of the contralateral MCA territory (47% per 10 mm Hg ΔEtCO2). Bokkers
A Comparison to Literature Values Obtained by Positron Emission Tomography
The gold standard to evaluate the brain's hemodynamic parameters (CBF, CVR, OEF, and CMRO2) is PET. Yamauchi
Patients Versus Controls
Interestingly, when comparing quantitative hemodynamic measurements in the gray matter of the ipsilateral MCA territory of the patients with the values measured in the MCA territory of the healthy controls we only found a significant difference in BOLD CVR. No differences in baseline CBF, ASL CVR, OEF, or CMRO2 were found. This may have been caused by the large intersubject variability in CBF, OEF, and CMRO238,39 measurements and our relatively small sample size. For instance, the study performed by Coles
Although, in this respect, we should also mention that the data of an earlier study performed by Mandell
Reliability of the Assumptions and Errors Introduced by the Assumptions
When processing calibrated MRI data a number of assumptions are adopted. In this study, we evaluated the validity of two assumptions; the
Limitations
In our patient group, 2 out of 15 patients experienced anxiety during hypercapnic breathing and the MRI measurements had to be stopped. This anxiety occurred despite a test run with hypercapnic breathing. We hypothesize this anxiety to be caused by both the hypercapnic breathing itself, but as well by our means of delivering the hypercapnic gas. The system we used is very good at creating complex breathing paradigms but it requires the breathing mask to be sealed to the subjects face and it makes use of a rebreathing phase. These two things create some resistance to breathing that may induce anxiety in some subjects. Future studies could try to make use of another system and can try to minimize anxiety by adapting the respiratory paradigm. For instance, the change in EtCO2 from baseline to hypercapnia can be attenuated. However, lower concentrations of CO2 will also decrease the strength of the effect on which the calibrated BOLD experiments are based. 42 Alternatively, the hypercapnia period can be shortened as a recent study demonstrated that a 1-minute paradigm performed equally well as a 4-minute paradigm and at the same time was more comfortable and tolerable for the subjects. 43 Nevertheless, care should be taken as it has been shown that BOLD changes have a delayed response with respect to changes in EtCO2. 43 In addition, one has to secure enough ASL signal averages to obtain sufficient signal-to-noise ratio.
A second limitation is delayed arrival that presents itself as ASL label still present in the arterial vasculature instead of the tissue. This is a known problem of ASL imaging in patients with collateral supply 44 and was seen in 3 out of the 11 patients. In calibrated MRI, DAAs propagate from the CBF to the OEF and CMRO2 maps and therefore preclude analysis of the OEF and the CMRO2 data. When the presence of delayed arrival is not recognized, this would lead to a falsely reduced CMRO2 via the incorrect (lower) measured CBF. The DAAs can potentially be reduced by increasing the PLD, or by using a separate multiple inversion times (multi-TI) sequence to obtain the ‘true’ CBF value. 45 In this study, we used a PLD ranging from 1,550 to 2,185 ms. This is in line with the PLD recently recommended by the ASL community. 20 However, we should keep in mind that transit times can be up to 2.5 seconds or even longer in patients with collateral blood supply. 44 It is not preferable to increase the PLD even more as there is a concurrent decrease in signal-to-noise ratio. 46 This would be in particular problematic with regards to obtaining a reliable CBF estimate during hyperoxia as we showed that an error within this measurement jeopardizes the accuracy of the OEF estimate the most (Figure 3A).
A promising alternative for CBF measurements in patients with large vessel disease is the velocity selective ASL method, 47 which is insensitive to transit times. Although the general signal-to-noise ratio is lower than in pCASL, due to the saturation rather than the inversion of blood, it has the advantage that the labeling takes place within the imaging region and therefore the PLD can be reduced at the same time reducing the bolus decay. 20
CONCLUSION
Calibrated MRI performed in patients with occlusive cerebrovascular disease can identify variances in CBF, CVR, OEF, and CMRO2. Thus, this noninvasive technique can potentially be used to identify patients at risk for recurrent stroke and to evaluate the effect of new drug therapies on cerebral hemodynamics.
DISCLOSURE/CONFLICT OF INTEREST
The authors declare no conflict of interest.