
Abstract
Prolonged translation arrest correlates with delayed neuronal death of hippocampal CA1 neurons following global cerebral ischemia and reperfusion. Many previous studies investigated ribosome molecular biology, but mRNA regulatory mechanisms after brain ischemia have been less studied. Here we investigated the embryonic lethal abnormal vision/Hu isoforms HuR, HuB, HuC, and HuD, as well as expression of mRNAs containing adenine and rich uridine elements following global ischemia in rat brain. Proteomics of embryonic lethal abnormal vision immunoprecipitations or polysomes isolated from rat hippocampal CA1 and CA3 from controls or following 10 min ischemia plus 8 h of reperfusion showed distinct sets of mRNA-binding proteins, suggesting differential mRNA regulation in each condition. Notably, HuB, HuC, and HuD were undetectable in NIC CA1. At 8 h reperfusion, polysome-associated mRNAs contained 46.1% of ischemia-upregulated mRNAs containing adenine and rich uridine elements in CA3, but only 18.7% in CA1. Since mRNAs containing adenine and rich uridine elements regulation are important to several cellular stress responses, our results suggest CA1 is disadvantaged compared to CA3 in coping with ischemic stress, and this is expected to be an important contributing factor to CA1 selective vulnerability. (Data are available via ProteomeXchange identifier PXD004078 and GEO Series accession number GSE82146).
Keywords
Introduction
Inhibition of protein synthesis, or translation arrest (TA), occurs following brain ischemia and reperfusion (I/R).1–7 TA is now understood to be a physiological response of cells against pathological insults. TA is a quiescent period in which cells transcribe genes to protect against and repair ischemia-induced damage. 8 Stress-induced transcripts escape TA by selective translation initiation.9–11 Resumption of normal translation occurs as cells recover from injury. However, in neurons fated to die by I/R, selective translation is obstructed, normal translation never resumes, and delayed neuronal death occurs days after the initial ischemia. 12
We previously showed that poly-adenylated mRNAs form granular structures we termed “mRNA granules,” whose presence correlated precisely with depressed translation rates. 13 The mRNA granules colocalized with eukaryotic initiation factor (eIF) 4E, eIF4G, and poly-A-binding protein (PABP) but not with ribosomal subunit markers or organelle markers.13–15 The embryonic lethal abnormal vision (ELAV) proteins colocalized with mRNA granules immediately in resistant neurons, but was delayed substantially in vulnerable neurons after global brain I/R, 13 suggesting that ELAV proteins contribute to outcome after brain I/R.
In mammals, ELAV proteins are multifunctional mRNA-binding proteins (RBPs). 16 There are four isoforms: HuR, HuB, HuC, and HuD. 17 All four bind adenine and uridine rich elements (ARE) in the 3′-untranslated region (3′-UTR) of ARE-containing mRNAs (ARE-mRNAs).18,19 HuR has ubiquitous tissue expression, but HuB, HuC, and HuD are neuron specific.20–22 HuR stabilizes ARE-mRNAs, such as cfos, 23 against degradation. HuB and HuC function in neuronal differentiation. 24 HuD mediates selective translation of ARE-mRNAs 25 and participates in nucleocytoplasmic transport of ARE-mRNAs. 26 In general, the ELAV proteins are members of a class of diverse trans-acting elements that regulate mRNAs in a combinatorial fashion 27 and are often found in subcellular aggregates complexed to other RBPs.28,29
Here we characterized RBPs that copurified with ELAV proteins or polysomes and assessed polysome-associated ARE-containing mRNAs in ischemia-vulnerable hippocampal CA1 and resistant CA3 after global brain I/R in rat. Our main findings were the absence of HuB, HuC, and HuD in control CA1, and a corresponding decrease in polysome-associated ARE-mRNAs in CA1 compared to CA3. Additionally, sets of RBPs showing only minor overlap copurified with ELAV proteins or polysomes in control and reperfused hippocampal CA1 and CA3, suggesting differential mRNA regulation in each region. Understanding stress gene regulation after brain I/R will aid efforts to develop effective neuroprotection against I/R-induced neuron death.
Materials and methods
Materials
HuR (sc-5261), hnRNP M (sc-20001), hnRNP K (sc-25373) antisera were from Santa Cruz Biotechnology, Inc. (Santa Cruz CA, USA). According to the manufacturer specifications sheet, antiserum sc5261 detected all four isoforms of the rat ELAV/Hu proteins which we confirmed below and therefore refer to sc5261 as “anti-ELAV” antiserum (αELAV). Antisera for histone H3 (ab1791), hnRNP D (ab61193), PABP (ab21060), pyruvate dehydrogenase (PDH) (ab110330), COX IV (ab16056), and cytochrome C (ab13575) were from Abcam (Cambridge, MA, USA). Antisera for small ribosomal subunit protein S6 (S6) (2217) was from Cell Signaling Technology (Beverly, MA, USA). Antiserum for ribosome P antigen (RPA) (HPO-0100) was from ImmunoVision (Springdale, AR, USA). Antiserum for PDI (MA3-019) was from Thermo Scientific (Rockford, IL, USA). Antiserum for NeuN (MAB377) was from Merk Millipore (Billerica, MA, USA). SYBR Gold, TRIzol, RNaseZap, and GlycoBlue were purchased from Life technologies (Carlsbad, CA, USA). RNeasy Mini Kit was purchased from Qiagen (Valencia, CA). GeneChip Rat Gene 2.0 ST microarrays were from Affymetrix (Santa Clara, CA). Protease inhibitor cocktail (P8340), diethyl pyrocarbonate (DEPC) (40718), and all secondary antibodies and sera were purchased from Sigma Aldrich (St. Louis, MO, USA). Mass spectrometry chemicals were MS grade. All other chemicals were reagent grade.
Global brain ischemia by bilateral carotid artery occlusion with hypotension
All animal experimental protocols were approved by the Wayne State University Animal Investigation Committee and were conducted following the Guide for the Care and Use of Laboratory Animals (National Research Council, revised 2011). Experiments have been reported in compliance with the ARRIVE guidelines. All efforts were made to reduce animal suffering and minimize the total number of animals used. Normothermic global forebrain ischemia in male Long Evans rats, weighing 275–300 g, used the two-vessel bilateral carotid artery occlusion and hypovolemic hypotension (2VO/HT) model of Smith et al., 30 as we previously described.13,14,31–33
Experimental designs
The study consisted of six separate experiments, E1–E6, shown graphically in Supplemental Figure 1, including the experimental groups, n per group, sample pooling, replicates, and mortality. Experimental groups were as follows: (1) nonischemic controls (NIC), (2) 10 min ischemia and 8 h reperfusion (8R), and (3) 10 min ischemia and 72 h reperfusion (72R). A total of 148 rats were used: 71 NICs and 77 surgeries (nine died; survival = 88.8%; Supplemental Figure 1). Exclusion criteria were as follows: (1) frank seizures (n = 2), or (2) died before the predetermined reperfusion time (n = 7). Three brain regions were utilized: hippocampal CA1, CA3, and cerebral cortex (CTX). Experiment E1 assessed cell death by toluidine blue staining in coronal slices at the level of dorsal hippocampus in NIC, 8R, and 72R groups. E2 assessed the purity of polysome pellets by Western blotting and RNA agarose electrophoresis in NIC CTX, CA1, and CA3. E3 performed LC–MS/MS proteomics on polysome pellets comparing CA1 to CA3 in NIC to 8R groups. E4 performed LC–MS/MS proteomics on ELAV immunoprecipitations (IP) comparing CA1 to CA3 in NIC to 8R groups. E5 performed Western blot after ELAV IP to validate LC–MS/MS studies in E4. E6 assessed total and polysome pellet RNAs by microarrays comparing CA1 to CA3 in NIC to 8R groups.
Bright field photomicrographs (20X) of toluidine blue staining of hippocampal CA1 and CA3 in nonischemic controls and following 10 min ischemia and 8 h (8R) or 72 h (72R) reperfusion. Scale bar applies to all panels.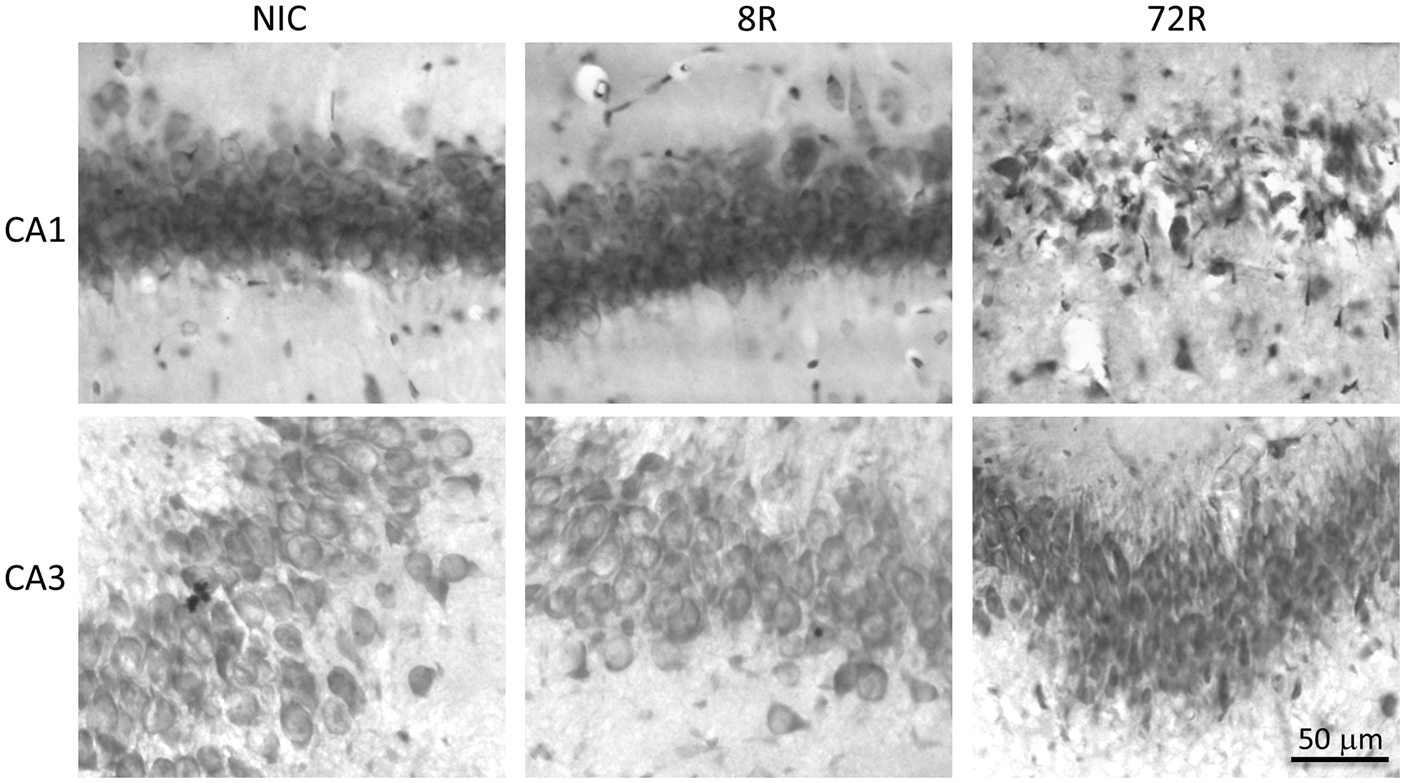
Toluidine blue staining of brain slices
Rats were perfusion fixed, 50 µm slices taken, and toluidine blue staining performed as previously described.32,34
Dissection of brain regions
Microdissections of hippocampal CA1 and CA3 in RNAse-free conditions were as previously described.31,33 CTX was taken from −2.44 mm posterior to Bregma to the rostral extent of the forebrain. Brain regions were weighed in RNAse-free Eppendorf tubes, immediately frozen in dry ice-ethanol bath, and stored at −80℃ until used.
Polysomes pellets
The polysome pellet method was based on Khandjian et al., 35 scaled down to accommodate gradient volumes of 700 µl, and performed on ice using RNAse-free conditions. Microdissected CA1 and CA3 from n = 4 or 5 rats per experimental group (NIC or 8R) were randomly pooled to give one replicate of 70 mg wet wt. Pooling was required to obtain enough protein (10 µg) for proteomic analysis and enough RNA (1 µg) for microarray analysis. To avoid disrupting nuclei, tissue was hand-homogenized using only pestle A in a glass dounce homogenizer at 1:8.5 (w/v) in cold buffer A (50 mM Tris, pH 7.4, 25 mM NaCl, 5 mM MgCl2, 300 mM cycloheximide, 1 mM DTT, 5.2 µl/ml protease inhibitor cocktail, and 80 U/ml RNase inhibitor) adjusted to 340 mM sucrose. Homogenate was centrifuged 9000 × g for 15 min at 4℃ to give postmitochondrial supernatant (PMS). PMS was adjusted to 1% NP-40, 350 µl of which was loaded onto a 350 µl sucrose pad containing 20% w/v sucrose in Buffer A in an 800 µl Beckman ultracentrifuge tube and centrifuged 29,400 r/min, 1.5 h, 4℃ (Beckman SW55 rotor with SW55 rotor adapters). The supernatant was carefully removed and discarded. The polysome pellet was resuspended overnight in Buffer A by gentle rocking at 4℃.
For Western blots, aliquots of resuspended polysome pellets were taken for protein determination and the remainder were boiled in SDS-PAGE loading buffer and stored at −20℃ until used. For liquid chromatography tandem mass spectroscopy (LC–MS/MS), polysome pellets were acetone precipitated in 6 vol of −20℃ chilled acetone, incubated overnight at −20℃, centrifuged 13,500 r/min, 10 min, 4℃, washed with cold acetone, air dried by inverting under a laminar flow hood for 1 min, then stored at −80℃ until used for LC–MS/MS as described below.
Assessment of polysome pellets by Western Blot
Western blots assessed polysome pellet purity using 5 µg per lane unfractionated homogenate, PMS, supernatant over sucrose pad, and resuspended polysomes pellet. Samples were run on 10% SDS-PAGE then electroblot transferred to nitrocellulose. The buffer for Westerns was 50 mM Tris, pH 7.4, 0.05% Tween-20, 125 mM NaCl (TTBS). Primary antibody conditions were as follows: antiribosomal P antigen (RPA; 60S marker: 1/300, 5% milk, overnight, 4℃), antiribosomal protein S6 (S6; 40S marker: 1/1000, 5% milk, overnight, 4℃), anti-ELAV (1/200, 1 h, room temperature), anti-polyA-binding protein (PABP; 1 µg/ml, overnight, 4℃), anti-NeuN (nuclear marker: 1/1000, 5% milk, overnight, 4℃), antiprotein disulfide isomerase (PDI; endoplasmic reticulum marker: 1/1000, 2% milk, overnight, 4℃). Mitochondrial markers were as follows: anti-PDH (1/1000, overnight, 4℃), anticytochrome C (cyt C; 1/1000, overnight, 4℃), and anticytochrome c oxidase subunit IV (COX IV; 1/1000, 5% milk, overnight, 4℃). All antisera were previously validated for single band reactivity on Western blot. 14 Western blot procedures were as previously described. 31
ELAV-protein IP
To prevent contamination of IP eluents by antisera, primary antisera were covalently linked to magnetic Dynabeads as per manufacturer's instructions. One milligram Dynabeads were coupled to 5 µg of either mouse αELAV (sc5261), mouse antihistone (ab1791) (negative control), or mouse serum (no antibody control).
Pooled CA1 and CA3 from NIC or 8R experimental groups (n = 5/replicate, 100 mg total wet wt.) were dounce homogenized with pestle A on ice at 9:1 v/w in extraction buffer B (1X IP buffer from Dynabeads co-IP kit, 200 mM NaCl, 2 mM MgCl2, 1 mM DTT, 5.2 µl protease inhibitor cocktail/ml, 80 U/ml Rnase I, and 160 U/ml Superase Rnase I). PMS was prepared as above, and each pooled sample was used as input for one IP reaction. For each IP reaction, 1.5 mg of coated Dynabeads was washed with extraction buffer B, then incubated with PMS for 10 min on a rotator at 4℃. IP reactions were placed on a magnet for 1 min, and supernatant was discarded. Beads were washed x3 in ice cold extraction buffer B, and x1 in kit-provided LWB buffer containing 0.02% Tween 20. Dynabeads were eluted with 60 µl of kit-provided EB buffer. Eluates were acetone precipitated as above.
Western blot of IP reactions
IP eluents were Western blotted to identify RBPs that coeluted with ELAV. Primary antisera incubation conditions were as follows: anti-ELAV (1/200, 1 h, room temperature), hnRNP K (1/100 in TTBS, 2 h, room temperature), hnRNP M (1/250 in TTBS, 2 h, room temperature), hnRNP D (1/250 in TTBS, 2 h, room temperature). Secondary antisera were at 1:2500 at room temperature, 1 h. The membrane was stripped between stainings at 55℃, 30 min, in 100 mM 2-mercaptoethanol, 2% SDS, 62.5 mM Tris–HCl, pH 6.7. After all Western blots, ELAV-reactive bands were excised, eluted from nitrocellulose, and analyzed by LC–MS/MS.
LC–MS proteomics
LC–MS/MS was used to analyze polysomes pellets and ELAV-protein IPs. Acetone pellets were resuspended in 100 mM triethylammonium bicarbonate, protein concentration measured with Bradford assay, reduced with tris (2-carboxyethyl)phosphine, cysteines blocked with methyl methanethiosulfonate, and then trypsin digested at 37℃ overnight.36,37 The tryptic digests of each sample were fractionated on SCX MicroSpin columns with sequential elution in five salt steps. Salt fractions were analyzed by LC–MS/MS in the reversed-phase C18 chromatography coupled to tandem mass spectrometry using an Ultimate nano-LC system and a QSTAR XL mass spectrometer. Reversed-phase chromatography was performed using a PepMap100 C18 analytical column (flow rate = 150 nl/min). The QSTAR XL was operated in acquisition mode with 1 s MS scans (400–1600 m/z) followed by 4 s product ion scans (100–1580 m/z). QSTAR raw files were processed using Mascot.dll added to the Analyst software and searched in Mascot against NCBI and SWISS-Prot databases. Peptides were scored as “present” if the following criteria were met for a given peptide fragment: (1) had an ions score > 5 (ion score = −10*log(P), where P is the probability that the observed match is a random event); (2) was detected with a significance threshold p < 0.05; and (3) was detected in at least two of three replicates per experimental group. To determine RBPs specifically coeluting with ELAV IPs, all proteins detected by LC–MS/MS for the no-antibody and negative controls were subtracted from those detected by ELAV-IP.
For peptides identified by elution from nitrocellulose after SDS-PAGE/ELAV Western blot, the peptides identified in MASCOT were further filtered in a BLAST search limiting the peptide identification to the rat and to the molecular weight of the band as determined by SDS-PAGE, ± 2.5 kDa. RBPs were determined by comparing detected proteins against the RNA-Binding Protein Database (Cook et al., 2011) as well as by manual search in the Universal Protein Resource (Uniprot; http://www.uniprot.org/).
RNA isolation
Total RNA was extracted from PMS of CA1 (CA1T) and CA3 (CA3T), and polysomal RNA was extracted from resuspended polysome pellets of CA1 (CA1p) and CA3 (CA3p) as previously described.31,33 PMS was used to obtain total RNA to avoid nascent transcripts from nucleus and mitochondria. All samples had A260/A280 > 1.8 and were shipped overnight on dry ice to Genome Explorations (Memphis, Tennessee) who performed all microarray procedures. RNA integrity was assessed by capillary electrophoresis using an RNA 6000 Nano Lab-on-a-Chip kit and Bioanalyzer 2100 (Agilent Technologies, Santa Clara, CA) as per manufacturer's instructions.
Oligonucleotide array hybridization and analysis
Microarrays were performed as previously described 31 with two major differences. First, the present study used polysome pellets to obtain polysomal RNA. Second, the present study used the Affymetrix GeneChip Rat Gene 2.0 ST Arrays, containing 28,407 probe sets covering 23,586 genes (16,771 annotated) and 818 noncoding transcripts.
Microarray analysis pipeline
PMCG background correction, PLIER probe summation, and quantile normalization of raw chip intensities were carried out in Affymetrix Expression Console. The normalized microarray data were analyzed in BRB Array Tools from NCBI. 38 Class comparison between groups of arrays was conducted using a permutation-based F test of multiple group comparisons (threshold p < 0.01; univariate p < 0.01, 100,000 permutations). Four comparisons were studied: NIC versus 8R for (1) CA1p, (2) CA3p, (3) CA1T, and (4) CA3T. Results were expressed as x-fold 8R/NIC for each group. Gene ontology (GO) was conducted using the Panther GO classification system (http://pantherdb.org), using Panther pathways for Rattus norvegicus as the ontology system. 39 A given pathway was accepted if > 3 genes were present from a given pathway. GO results are depicted as pie charts where 100% represents the total number of genes included in the final pie chart. 40
ARE-containing mRNAs were identified by checking differentially expressed probe sets against three sources: (1) all rat ARE-containing transcripts listed in the ARE Database, (2) rat transcripts that bound known ARE-binding RBPs identified by the GO terms “GO:0035925 mRNA 3′-UTR AU-rich region binding” and “GO:0017091 AU-rich element binding” and, (3) the large set of ARE-containing transcripts recently identified in mouse olfactory bulb in Shum et al. 41 The corresponding rat orthologous transcripts were tested for ARE sequences using Find Individual Motif Occurrences (http://meme-suite.org/doc/fimo.html) 42 with significance threshold set to p ≤ 0.01. Of the 364 mouse transcripts with ARE sequences matching significant hits in our microarray data, 236 of the orthologous rat transcripts also contained 3′-UTR ARE sequences. The final list of candidate ARE-mRNAs in rat, against which the microarray results were screened, consisted of 1592 transcripts (∼6% of the entire rat genome) containing either verified or putative ARE sequences.
Results
Outcome
At 72R, > 90% of CA1 neurons died, whereas there was no detectable cell death in CA3 at 72R (Figure 1). Therefore, the following studies compared 10 min ischemia-vulnerable CA1 to 10 min ischemia-resistant CA3.
Polysome pellets
Polysome pellets concentrated 40S (S6) and 60S (RPA) ribosome subunit markers and polysome-binding proteins PABP and ELAV,
43
all of which were present in unfractionated homogenates, and only PABP was detected at the top of the sucrose pad (Figure 2(a)). RNA agarose electrophoreses of polysome pellet RNA showed intact rRNA (Figure 2(b)). Markers of endoplasmic reticulum (PDI), mitochondria (PDC, COX IV, cyt C), and nuclei (NeuN) were absent from polysome pellets, but present in unfractionated homogenates, and PDI was detected in PMS (Figure 2(c)). Thus, polysome pellets contained translation markers but organelle contamination was not detected. LC–MS/MS of polysome pellets isolated from CA1 and CA3 detected 19.6 ± 4.8% ribosomal subunit proteins as a percent of all proteins detected with no differences between CA1 and CA3 (ANOVA p = 0.8).
(a) Western blot of polysome pellets for translation markers. (b) Agarose electrophoresis of polysomal RNA. (c) Western blot of polysome pellets for organelle markers. Homogenate, unfractionated homogenate; PMS: postmitochondrial supernatant; pp: polysome pellet; pad S: supernatant over sucrose pad. Molecular weight markers in kDa indicated at right of Western blots. Antigen abbreviations as used in the text.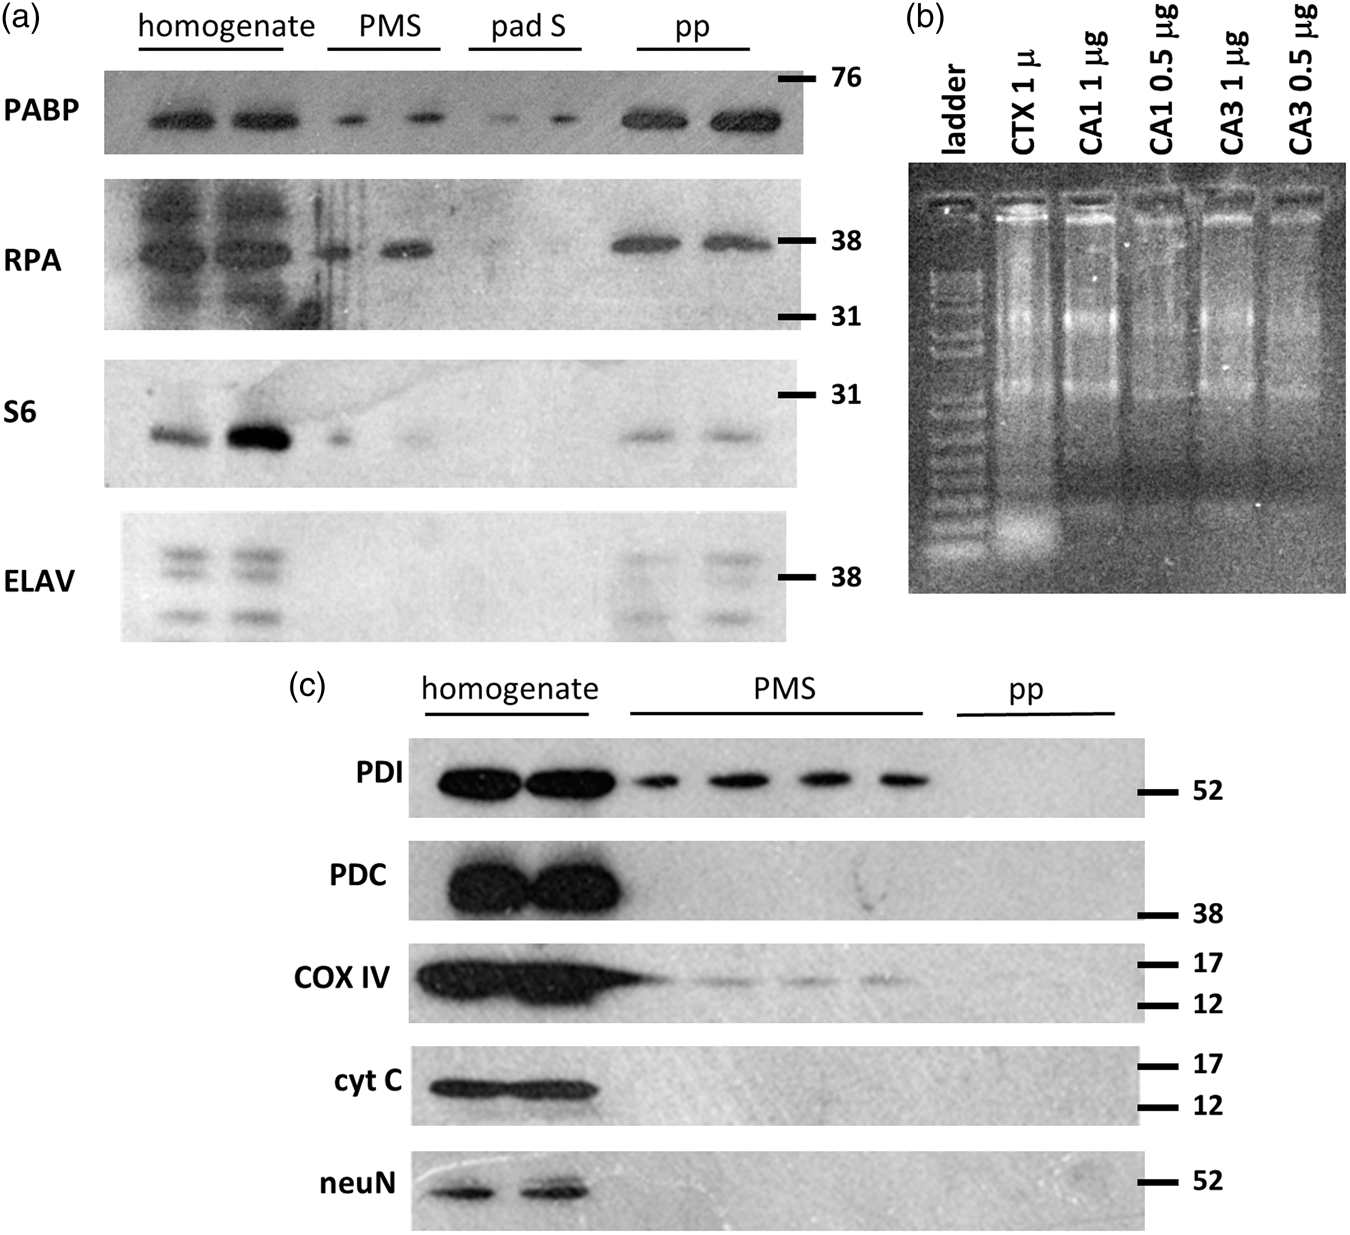
LC–MS/MS of polysome-associated RBPs
RNA-binding proteins detected in polysome pellets.
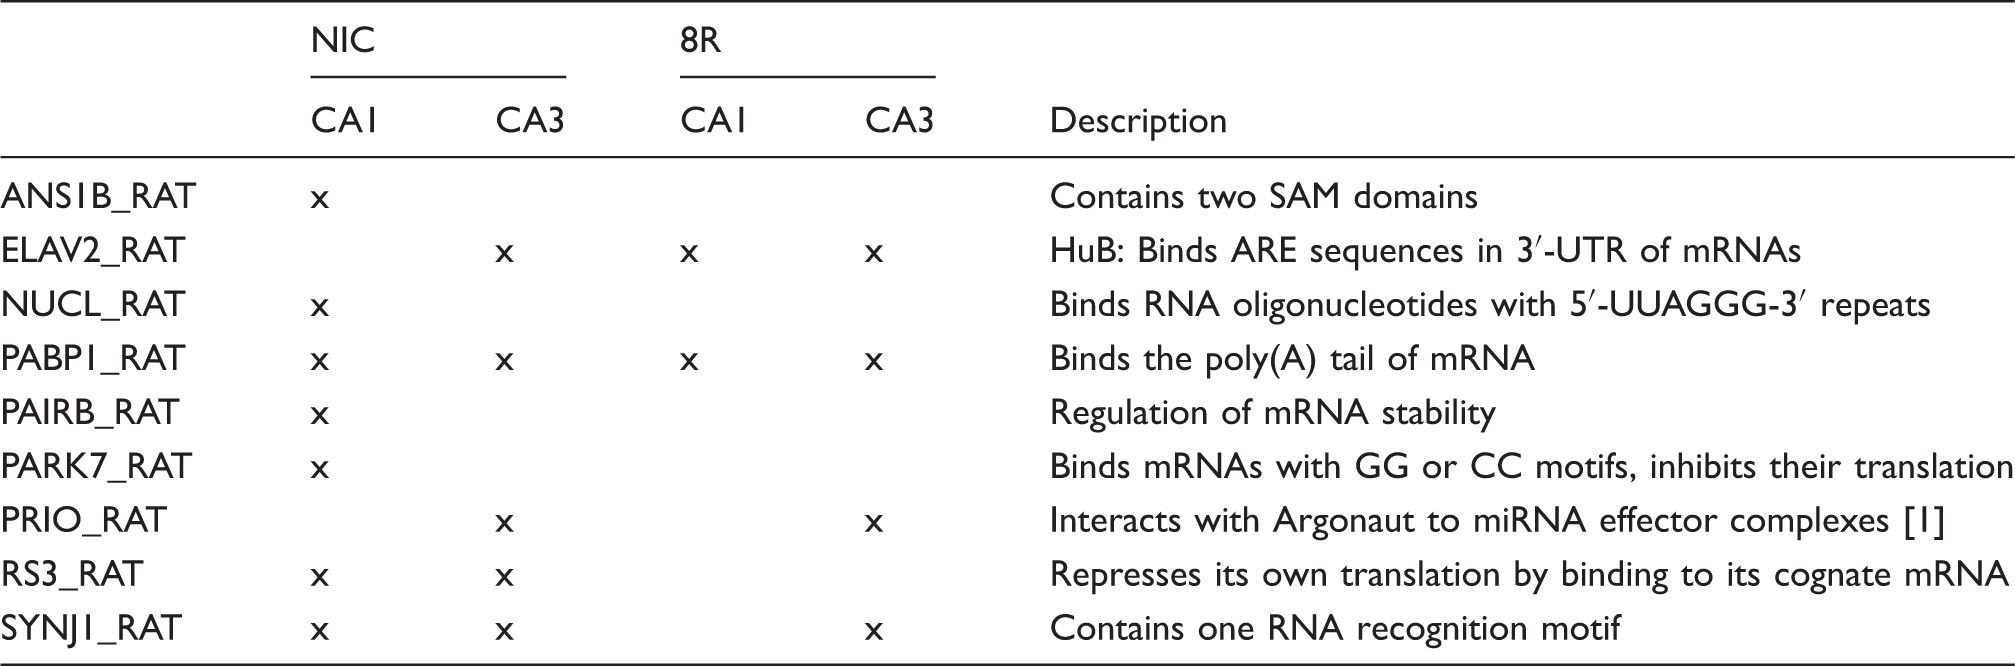
Thus, the sets of polysome-associated RBPs detected in all four experimental groups were different from each other. HuB was absent from NIC CA1 but not the other groups. This minimal overlap of RBPs suggests differential mRNA regulation in each group.
ELAV IP
Five ELAV-reactive bands were consistently observed following ELAV IP/Western in both CTX and in whole hippocampal dissection (Figure 3(a)). Identification of ELAV bands by LC–MS/MS is described in the next section. Since quantities of hippocampal tissue were limiting, CTX was used for the remaining ELAV IP control studies (Figure 3(b) to (d)). αELAV-reactive bands were not detected when an unrelated antiserum, histone H3, was used (Figure 3(b)), or when αELAV antiserum was omitted from the IP reaction (Figure 3(c), last two lanes). Use of Dynabeads eliminated IgG bands, making this procedure more suitable for subsequent LC–MS/MS than using protein A agarose beads (Figure 3(d)).
(a) Multiple bands detected by ELAV antiserum following ELAV immunoprecipitation (IP) and ELAV Western in cortex (C) or hippocampus (H). Band identities on right. (b) ELAV Western after IP with ELAV or histone H3 on cortical postmitochondrial supernatants. (c) ELAV Western after ELAV IP on cerebral cortex controls (N) and 8 h reperfusion after 10 min ischemia (8R). p: polysome pellet; u: unfractionated homogenate. (d) ELAV IP/Western where ELAV antisera was linked to Dynabeads (DB) or protein A agarose (PA) was used to pull down IP reactions. Molecular weight markers in kDa indicated at right. ELAV: embryonic lethal abnormal vision.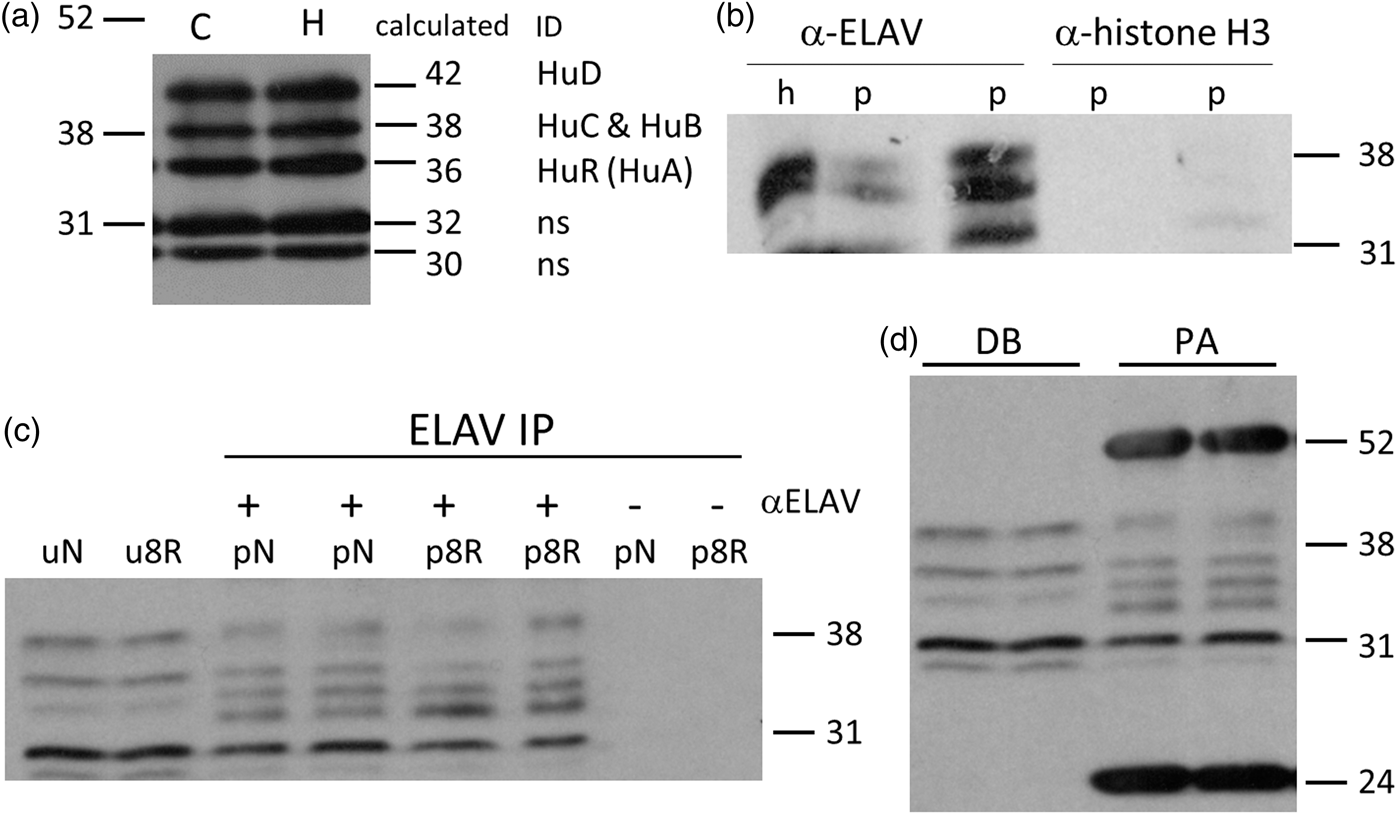
Proteomic identification of ELAV IPs
The five ELAV-reactive bands were excised and then eluted from the nitrocellulose and analyzed by LC–MS/MS. The identified peptides along with the isoforms and bands they identify are provided in Supplemental Figure 2. For the 30 and 32 kDa bands in Figure 3(a), no ELAV digestion fragments were detected and we took these as “nonspecific binding” of the ELAV antisera (ns, Figure 3(a)). However, LC–MS/MS-detected peptides identified the 36, 38, and 42 kDa bands as HuR, HuB plus HuC (HuB/HuC), and HuD, respectively. Since HuB and HuC both have MW ∼38 kDa their fragments were detected in the same band, HuB and HuC cannot be distinguished by Western blot, and we therefore refer to the 38 kDa band as “HuB/HuC.”
Proteomics of ELAV IP from control and reperfused CA1 and CA3
RNA-binding proteins detected in ELAV immunoprecipitations.
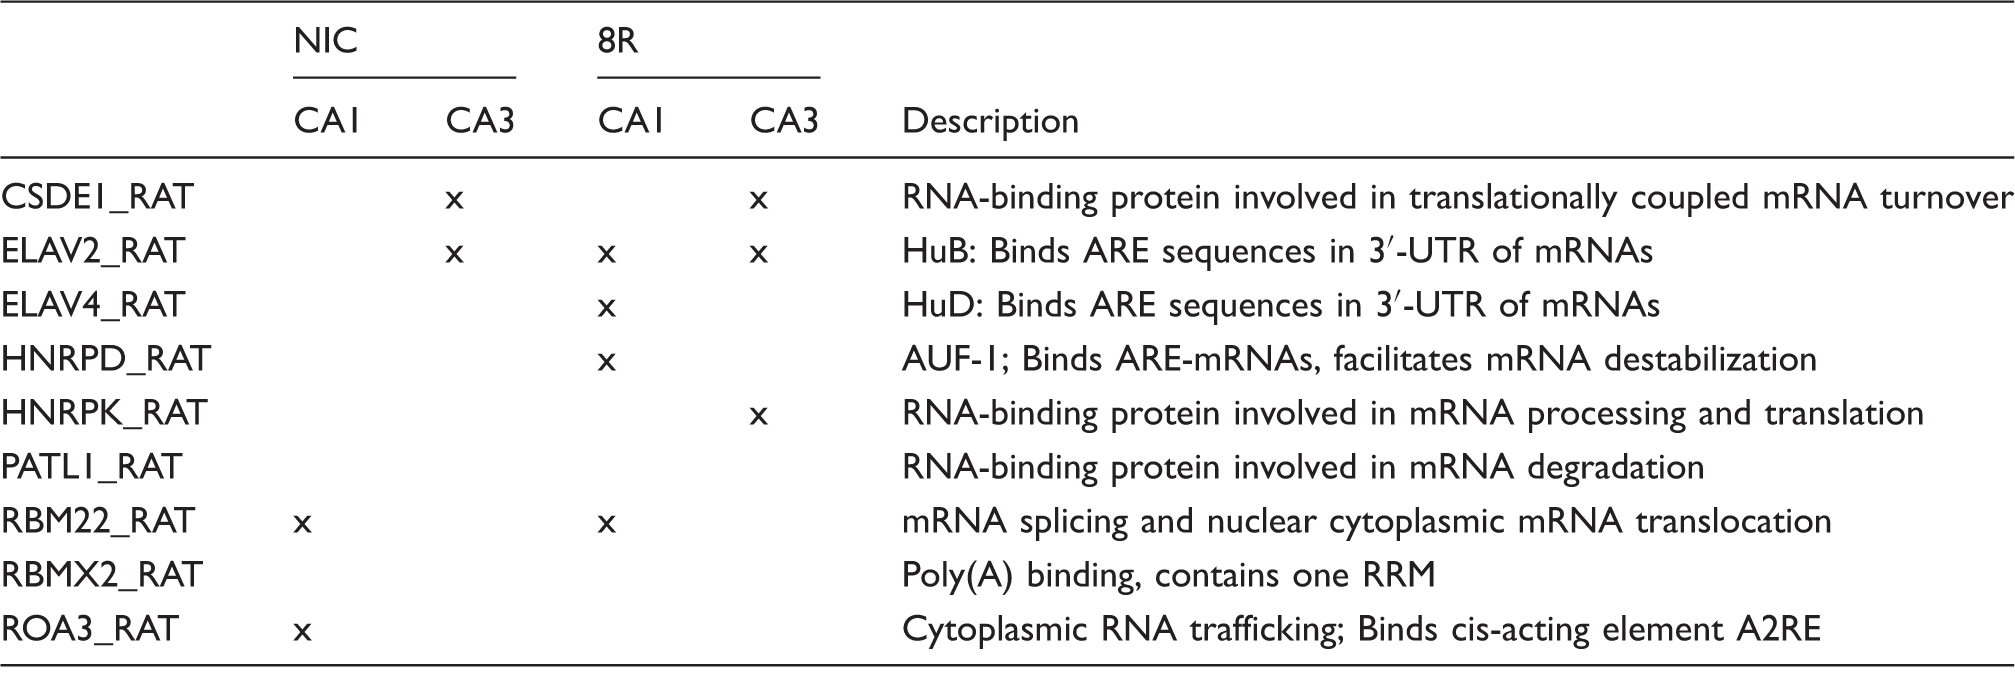
ELAV: embryonic lethal abnormal vision.
IP-Western of ELAV proteins
To validate the LC–MS/MS results, we performed ELAV IP on microdissected CA1 and CA3 followed by Western blot for a variety of RBPs (Figure 4). We attempted to Western blot for several of the RBPs in Table 2 but had success detecting only hnRNP K. Therefore, we performed Western blot for two additional RBPs with relations to ELAV proteins: AUF149,50 and hnRNP M.
51
(a)–(d) are Western blots after ELAV IP, and (e)–(h) are corresponding densitometry for, respectively, ELAV, AUF1, hnRNP K, and hnRNP M. For ELAV and AUF1 that displayed multiple bands, ANOVAs were performed for each band separately. Only the 36 kDa ELAV band was not significant by ANOVA. For all other bands, ANOVA p < 0.05 and * indicate differences by Tukey post hoc. For panels (g) and (h), ANOVA p < 0.05 and * indicate Tukey post hoc differences. Molecular weight markers in kDa are on right. ELAV and AUF1 band MWs are also indicated. ELAV: embryonic lethal abnormal vision.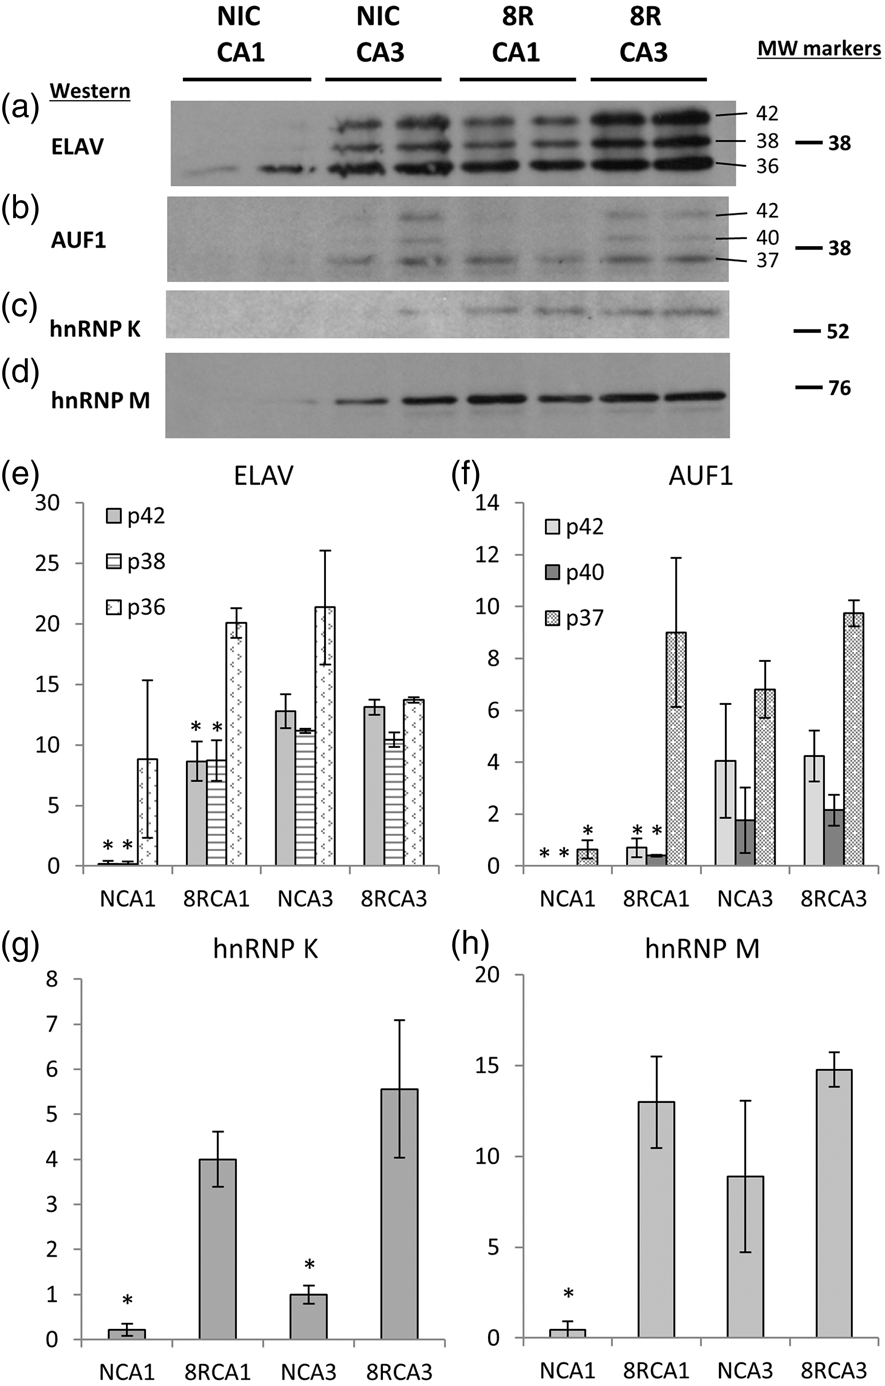
ELAV Western after ELAV IP revealed decreased signal in both NIC and 8R CA1 compared to CA3 (Figure 4(a) and (e)). NIC CA1 showed a 50 ± 37% decrease in the 36 kDa HuR band that did not clear statistically due to the large variance, and a statistically significant 99 ± 1% decrease in the 38 kDa HuB/HuC and 42 kDa HuD bands (ANOVA p < 0.01; Figure 4(e)). The 8R CA1 38 and 42 kDa bands were decreased ∼50% compared to the corresponding NIC and 8R CA3 bands. The very low HuB/HuC and HuD band signals were consistent with the inability to detect ELAV fragments by mass spec after IP/Western in NIC CA1.
AUF1 has been detected complexed with ELAV proteins. 50 AUF1 runs as a triplet at 37, 40, and 42 kDa. 52 The AUF1 triplet was observed only in CA3 samples (Figure 4(b) and (f)). Only 37 kDa AUF1 was detected in 8R CA1. In NIC CA1 where HuB/HuC and HuD were absent, the 40 and 42 kDa AUF1 bands were also absent. The 37 kDa band densitometry in NIC CA1 was ∼5% of the other groups (ANOVA p < 0.01). This result suggests AUF1 coeluted with HuB/HuC and/or HuD.
hnRNP K was ∼20-fold higher in 8R CA1 versus NIC and sixfold higher in 8R CA3 versus its NIC. This is consistent with detection of hnRNP K by LC–MS/MS in 8R CA3 (Table 2). Thus, hnRNP K is enhanced in the reperfused groups (Figure 4(c) and (g)), suggesting a reperfusion-specific interaction with HuB/HuC or HuD. The hnRNP M signal was present in all groups except NIC CA1 (Figure 4(d) and (h), ANOVA p < 0.01), again suggesting that hnRNP was bound to HuB/HuC and/or HuD.
The IP/Western results validated the absence of HuB/HuC and HuD in NIC CA1 and support the notion that differential combinatorial mRNA regulation occurs in CA1 and CA3 across the NIC and 8R states.
Microarrays
We attempted to extract RNA from the ELAV IPs of CA1 and CA3 for microarray analysis. However, the amount of coprecipitating RNA was too low to be detected and RNA amplification did not produce a detectable RNA signal (data not shown). We therefore studied total and polysomal RNA to ascertain if the changes in ELAV proteins described above correlated to changes in ARE-containing mRNAs on polysomes, an important functional step in the regulation of ARE-mRNAs.
Microarray quality control
Microarrays demonstrated suitable quality control. Capillary electrophoresis showed intact rRNA, and intensity histograms and box plots showed consistency of chip signals (Supplemental Figure 3).
Microarray quantitative results
Microarray quantification.
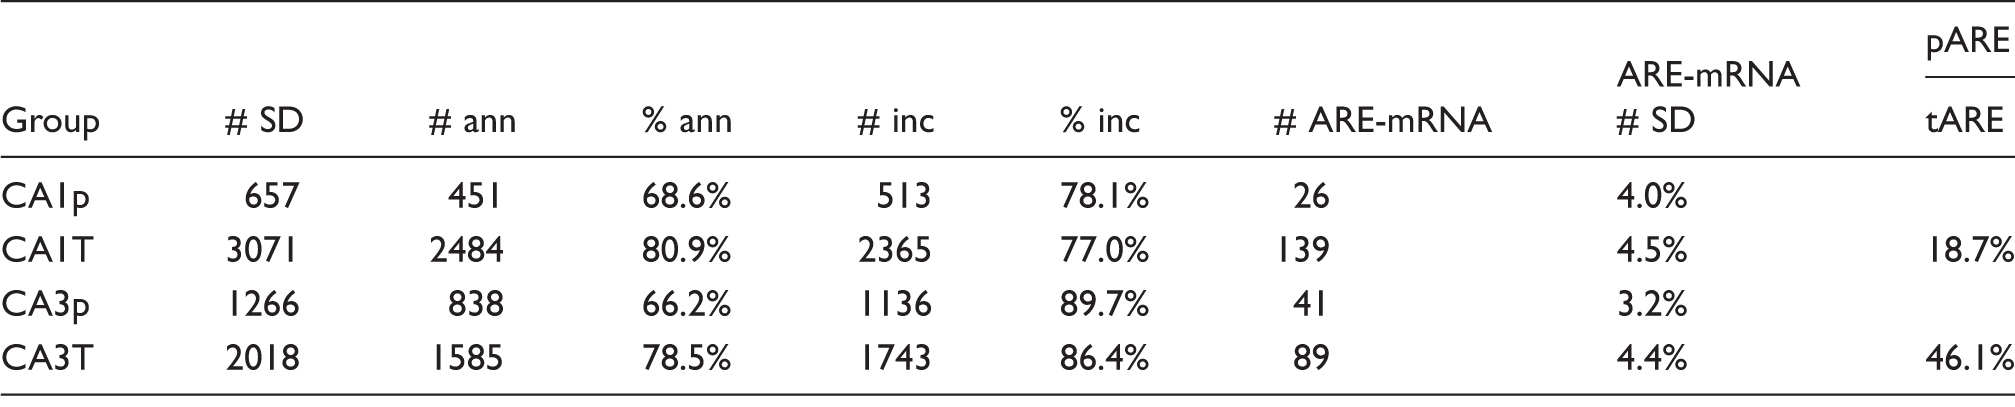
Ann: annotated probe sets; inc: probe sets that increased at 8R compared to NIC; SD: statistically significant differentially expressed probe sets.
Consistent with our previous finding, 31 only a percentage of altered transcripts were polysome bound. The percent of polysome-bound transcripts was 63% in CA3 and only 21% in CA1, of the respective total changed probe sets.
GO of microarrays
Venn diagram analysis showed only 10–20% direct overlap of probe sets between CA1 and CA3 (not shown). However, GO analysis showed ∼75% of transcripts belonged to overlapping pathways, and the overall functional expression was similar between the two regions (Supplemental Figure 4(a) and (b)). Some of the overlapping pathways included angiogenesis, apoptosis signaling, RHO, EGF, and GRH pathways, Parkinson's and Huntington's disease pathways, and a number of immune system pathways. Pathways unique to CA1 included B cell activation, oxidative stress, p53, Ras, VEGF, and Toll pathways. Pathways unique to CA3 included presenilin, cadherin, dopamine, FGF, G-proteins, acetylcholine, ubiquitin-proteosome, and Wnt signaling, along with purine metabolism and T-cell activation.
ARE mRNA content of polysome-bound mRNAs
The differentially expressed probe sets from CA1 and CA3 were matched against a list of 1592 ARE-containing rat mRNAs. Table 3 lists quantification of ARE-mRNAs in each group. Lists of the detected ARE-mRNAs are provided in Supplemental File 4. For CA1, 26 and 139 ARE-mRNAs were detected in polysome and total RNA, respectively. For CA3, 41 and 89 ARE-mRNAs were detected in polysome and total RNA, respectively. Only six ARE-mRNAs were common to CA1 and CA3 polysomes transcripts: Chic2, Dusp2, Hspa1a, PVR, Plk3, and Stat3. These results indicate heterogeneity of ARE-mRNAs in both the total population of changed transcripts and those associated with polysomes.
Table 3 quantifies ARE-mRNAs as a percentage of polysome and total transcripts. For both CA1 and CA3, the percent of ARE-mRNAs constituting the polysome and total fractions was on order 4%. However, the percent of total ARE-mRNA that was also polysome bound was 18.7% CA1 and 46.1% for CA3. Thus, there was a 2.5-fold greater concentration of ARE-mRNAs on CA3 polysomes compared to CA1. GO analysis of ARE-mRNAs in CA1 and CA3 (Supplemental Figure 4(c) and (d), respectively) showed that 80% of the CA1 ARE-mRNAs were in the same pathways as 60% of the CA3 ARE-mRNAs. The GO categories were subsets of those detected for total RNA given above.
In spite of the similarity of GO pathway assignments, the decrease in percentage of ARE-mRNAs detected on CA1 polysomes compared to CA3 indicates ARE-mRNAs have less access to polysomes in CA1 than CA3. This finding is consistent with the lack of detection of HuB/HuC and HuD in NIC CA1 and suggests an impediment of loading ARE-mRNAs on CA1 polysomes.
Discussion
We reported here: (1) a substantial decrease in HuB/HuC and HuD in control CA1 compared to CA3, (2) a decrease in ARE-mRNAs bound to polysomes at 8 h reperfusion in CA1 compared to CA3, and (3) heterogeneity of ELAV and polysome-associated RBPs in experimental groups. These results suggest differential mRNA regulation in CA1 and CA3 after brain I/R and that CA1 is at an inherent disadvantage compared to CA3.
mRNA dysfunction after brain I/R
The original description of TA after brain reperfusion 7 described a defect in translation initiation. Subsequent studies of initiation factors showed these were generally acute changes that did not correlate with the long-term TA of CA1. 53 We showed that mRNA granules correlated with long-term TA but that colocalization of ELAV proteins with mRNA granules correlated with the survival of CA3 neurons and translation of the stress protein HSP70, 13 suggesting a defect in postischemic mRNA regulation. A defect in mRNA regulation is also consistent with lack of translation of HSP70 protein in CA1 in spite of its copious transcription,33,54–59 which was also observed for stress mRNAs induced by the unfolded protein response.60–62 Differences in mRNA handling by CA1 and CA3 are supported by our observation that HuB, HuC, and HuD are absent in CA1, but not CA3, control neurons.
ELAV proteins in CA1
All ELAV proteins are known to shuttle between nucleus and cytoplasm.16,20 We previously showed HuR was unchanged between CA1 and CA3 in PMS of rat CA1 and CA3 using conventional Western blot, 31 a result repeated here using IP/Western detection (Figure 4(a), Tukey HSD p > 0.05). It was therefore surprising that HuB, HuC, and HuD were absent in NIC CA1 but present at 8R. An early study from the Keene laboratory found HNel 2 (HuB) mRNA undetectable in CA1. 18 We confirmed this here at the protein level, and our results suggest it has functional significance in the setting of brain I/R injury.
However, HuB, HuC, and HuD were detected in 8R CA1 suggesting they are either: (1) translated during reperfusion or (2) are in an undetectable form in NIC CA1 and convert to a detectable form at 8R. Inspection of our microarray data showed no increase in the ELAV mRNAs at 8R compared to NIC (data not shown). Thus, if the proteins are de novo translated, they utilized existing transcripts. LC–MS/MS digests all proteins to fragments, and SDS-PAGE denatures protein complexes, so it is unlikely that the HuB, HuC, and HuD were present but undetectable. The two alternatives can be resolved in future studies using tracer amino acids and ELAV IP/Western to determine if de novo synthesis of ELAVs occurs.
Lack of HuB, HuC, and HuD in NIC CA1 is expected to disadvantage CA1 compared to CA3. Various stress responses utilize ARE-mRNA regulation including heat shock, 63 Wnt signaling,64–66 and immune system pathways.67,68 Regulation of such transcripts by HuB, HuC, or HuD can begin immediately in CA3 whereas similar regulation will be delayed in CA1. Lack of HuB, HuC, and HuD in control CA1 may also account for decrease in polysome-bound ARE-mRNAs from ∼20% in CA1 compared to ∼ 50% in CA3 at 8R. The 20% achieved in CA1 may be due to the action of HuR or combined action of HuB, HuC, and HuD that is present in 8R CA1.
Polysome binding and translation
Our aim in the present set of studies was to characterize ELAV proteins and the ARE-mRNAs associated with polysomes. The polysome pellet method used here isolates translating polysomes as well as translationally inactive RNA granules.69,70 Inspection of the LC–MS/MS proteomics showed components of translationally inactive complexes such a synaptojanin and other components of clathrin-coated vesicles. 71 Therefore, we cannot equate polysome binding to translation with the studies described here. Instead, our results demonstrate differential distribution of ARE-mRNAs between CA1 and CA3, as well as quantitative differences in ARE-mRNA levels.
Comparison to previous studies
The microarray results are consistent with previous gene expression studies.72–74 It was not our intent to evaluate gene expression per se, but to study polysome mRNAs and characterize ARE-mRNAs. We previously showed that 28 and 58% of changed transcripts were polysome bound in CA1 and CA3, respectively. 31 We confirmed this finding here with 21 and 63% of changed transcripts in CA1 and CA3, respectively, being polysome bound. In addition, because we here used: (1) a more extensive microarray platform, and (2) a larger sources of ARE-mRNAs was used to screen the microarray data, we showed that 18.7% of ARE-mRNAs are polysome bound in CA1 versus 46.1% in CA3, indicating a quantitative difference in ARE-mRNA handling between the two regions that correlated with the changes in ELAV proteins described above.
mRNA combinatorics
There is growing appreciation that mRNA regulation, like DNA transcription, is controlled by the combinatorial binding of diverse trans-acting elements to cis-acting mRNA sequences.16,27,75 While we studied rat here, the ubiquity of cell stress responses indicates our findings should generalize across mammals. For polysome pellets and ELAV IPs, we showed that each experimental group had a unique set of RBPs. The lists of RBPs we obtained provide targets of focus for future studies. In particular, the IP/Western results (Figure 4) suggest that AUF1 and hnRNPs K and M were dependent on the binding of either HuB, HuC, or HuD, and reinforce that mRNA combinatorics differentially occurred in the conditions studied here.
Technical considerations
The input to our assays, microdissected brain regions, contained many different cell types. Our results are thus the composite average of all the cell types in the tissue. For example, the GO analysis (Supplemental Figure 4) shows evidence of endothelial, glial, and immune system gene expression. We acknowledge this mixing and do not insinuate our comments apply exclusively to neurons. Additionally, techniques like co-IP work best on in vitro molecular reconstructed systems. It is likely that the small number of consistent hits obtained by LC–MS/MS is due, at least in part, to the use of brain tissue. Further, we cannot rule out formation of nonphysiological complexes during IP incubations. 76 However, the group-specific correlations between ELAV signal and known binding partners shown in Figure 4(a) to (d) alleviate this concern to some extent. Finally, we note that it appears that all four ELAV isoforms were not identified in polysome pellet and HuR IPs. However, there is, on average, ∼75% identity among ELAV isoforms. The protein identifications (Tables 1 and 2) based on MASCOT search do not account for this fact, and so the specific isoforms identified should be taken as a minimum identification and not a complete identification.
Summary and conclusions
HuB, HuC, and HuD were absent, or at undetectably low levels in NIC CA1, which correlated with only 18.7% of AREs being polysome bound in CA1, compared to 46.1% in CA3 at 8 h reperfusion. However, HuB, HuC, and HuD were present in 8R CA1 at levels ∼50% of those of 8R CA3 (Figure 4(e)). Therefore, some additional process, most likely translation, must occur in CA1 that is expected to retard stress responses dependent upon HuB-, HuC-, and HuD-mediated ARE mechanisms in CA1. Thus, the observed differences in the control state between CA1 and CA3 can plausibly contribute to outcome following brain I/R. Therefore, in addition to inhibition of damage, and bolstering injury-induced stress responses, accounting for intrinsic differences in the control state of neurons adds a third dimension to developing successful neuroprotection.
Footnotes
Funding
The author(s) disclosed receipt of the following financial support for the research, authorship, and/or publication of this article: This work was supported by NIH Grants No. NS057167 (D.J.D.) and NS081347 (D.J.D.).
Acknowledgements
Special thanks to Professor Roger Pique-Regi of the Wayne State University Center for Molecular Medicine Genetics for his helpful advice on searching for ARE sequences in rat transcripts. We thank Jie Wang for performing all the rat brain I/R surgeries.
Declaration of conflicting interests
The author(s) declared no potential conflicts of interest with respect to the research, authorship, and/or publication of this article.
Authors' contributions
All authors contributed to experimental designs. HW, XC, and FTA performed the experimental studies. DJD, HW, and XC analyzed the data. DJD drafted the manuscript which was edited and approved by all authors.
Supplementary material
The mass spectrometry proteomics data have been deposited to the ProteomeXchange Consortium (http://proteomecentral.proteomexchange.org) via the PRIDE partner repository
77
with the dataset identifier PXD004078. Microarray data have been deposited in NCBI's Gene Expression Omnibus
78
and are accessible through GEO Series accession number GSE82146 (![]() ).
).
References
Supplementary Material
Please find the following supplemental material available below.
For Open Access articles published under a Creative Commons License, all supplemental material carries the same license as the article it is associated with.
For non-Open Access articles published, all supplemental material carries a non-exclusive license, and permission requests for re-use of supplemental material or any part of supplemental material shall be sent directly to the copyright owner as specified in the copyright notice associated with the article.