
Abstract
Herein, we present a theoretical framework and experimental methods to more accurately account for transit effects in quantitative human perfusion imaging using endogenous magnetic resonance imaging (MRI) contrast. The theoretical transit time sensitivities of both continuous and pulsed inversion spin tagging experiments are demonstrated. We propose introducing a delay following continuous labeling, and demonstrate theoretically that introduction of a delay dramatically reduces the transit time sensitivity of perfusion imaging. The effects of magnetization transfer saturation on this modified continuous labeling experiment are also derived, and the assumption that the perfusion signal resides entirely within tissue rather than the arterial microvasculature is examined. We present results demonstrating the implementation of the continuous tagging experiment with delay on an echoplanar scanner for measuring cerebral blood flow (CBF) in normal volunteers. By varying the delay, we estimate transit times in the arterial system, values that are necessary for assessing the accuracy of our quantification. The effect of uncertainties in the transit time from the tagging plane to the arterial microvasculature and the transit time to the tissue itself on the accuracy of perfusion quantification is discussed and found to be small in gray matter but still potentially significant in white matter. A novel method for measuring T1, which is fast, insensitive to contamination by cerebrospinal fluid, and compatible with the application of magnetization transfer saturation, is also presented. The methods are combined to produce quantitative maps of resting and hypercarbic CBF.
Since magnetic resonance imaging (MRI) scanners are widespread in both clinical and research environments, the availability of a quantitative MRI perfusion imaging technique would help to increase the use of perfusion imaging as a diagnostic tool. Additionally, MRI methods do not require a radioactive tracer, are directly superimposable onto high resolution anatomic images acquired within the same imaging session, and can potentially achieve spatial resolution that is orders of magnitude better than that of radionuclide methods. MRI methods based on the injection of a magnetic contrast agent have yielded excellent images of cerebral blood volume (CBV) (Belliveau et al., 1990), but quantification of perfusion with these methods is more challenging (Weisskoff et al., 1993). The need for bolus injection of a contrast agent also dramatically reduces the number of repeated measures possible within a single examination and decreases the advantage of MRI over positron emission tomography (PET) flow techniques.
MRI measurements of perfusion may also be obtained using an endogenous tracer. In this approach, arterial water is tagged proximal to the brain using spatially selective excitation or inversion pulses. Effects of arterial tagging on distal images can be quantified in terms of tissue perfusion since the regional changes in signal intensity are determined by blood flow and T1 relaxation. Several types of tagging strategies have been employed. Repeated saturation (Detre et al., 1992) and continuous adiabatic inversion (Dixon et al., 1986, Williams et al., 1992) both approximate a continuous tagging of blood as it flows across a plane located proximal to the slice location. Using the adiabatic inversion technique, alterations of blood flow due to modulation of blood PaCO2 (Williams et al., 1992), seizures (Williams et al., 1993), cold injuries (Williams et al., 1992), and amphetamine stimulation (Silva et al, 1995) in rats have been reliably quantified. The alternative to these continuous labeling techniques is single-pulse tagging of an extended slab of tissue containing a sizable volume of arterial blood (Edelman et al., 1994, Kwong et al., 1995); current methods for quantifying single-pulse experiments are less well developed (see below).
Implementation of the above perfusion imaging strategies for human studies presents several challenges. Humans are typically studied at field strengths lower than those used for small animals, thus resulting in lower signal-to-noise ratios and shorter T1 relaxation times. Transit times from proximal arteries are also longer in humans. Long transit times greatly reduce the sensitivity of the perfusion measurement. Since longer transit times affect the observed signal intensity, uncertainty in the transit time will also result in inaccuracies in flow quantification. Another problem, always present in human studies, is subject motion and associated artifacts. Because perfusion imaging must detect small percentage changes in an image, motion effects can easily degrade the perfusion images. Rigid fixation of the head and paralytic agents, both of which are frequently used in animal perfusion studies, cannot be used to prevent motion of human subjects without substantial discomfort.
Several groups have made first steps towards quantitative perfusion imaging in humans, but the problems outlined above have not all been addressed. One group (Roberts et al., 1994) reported human perfusion images employing an adaptation of the adiabatic inversion technique to fast gradient echo imaging. Although quantitative perfusion values in agreement with literature values were obtained, the imaging technique was highly sensitive to the arterial transit time assumed and did not suppress or account for the large contribution of intraluminal spins. A second group (Edelman et al., 1994) reported a slab inversion technique that highlights the effects of transit time in the human arterial tree by tagging a bolus of blood whose transit through the arterial system is observed in images obtained at different delays between inversion and image acquisition. Their method incorporated echoplanar imaging to reduce motion by obtaining tagged and control images spaced only a few seconds apart. The signal intensity in this method can be highly dependent on transit time. Fitting of multiple images acquired with different delays has been suggested as a route towards quantification (Buxton et al., 1995), but assumptions about the distribution of velocities and transit times in the tagged arteries are required. An alternative spatial inversion tagging scheme, based on a method developed earlier for detecting brain activation (Kwong et al., 1992) has been proposed, (Kwong et al., 1995). This tagging method has also been used for mapping brain activation (Kim, 1995). The flow-dependent signal change is identical to that of the other pulsed method (Edelman et al., 1994).
Herein, we present a theoretical framework and experimental methods to more accurately account for transit effects in quantitative human perfusion imaging. We begin by deriving the transit time sensitivity of both the continuous and pulsed inversion spin tagging experiments and demonstrating that by introducing a delay following continuous labeling, transit effects are markedly reduced without sacrificing sensitivity. The continuous tagging experiment is then implemented on an echoplanar scanner and used for imaging of normal volunteers. By varying the delay, we estimate transit times in the arterial system, values that are necessary for assessing the accuracy of our quantification. A novel method for measuring T1 that is fast and insensitive to contamination by cerebrospinal fluid (CSF) is also presented. Finally, the methods are combined to produce quantitative maps of resting and hypercarbic CBF.
THEORY
Continuous labeling experiments
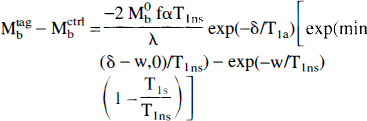
The signal intensity change observed in the continuous labeling experiment, as illustrated in figure 1a, was derived previously (Williams et al., 1992).
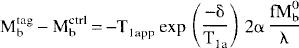
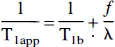
where f is the blood flow in ml/g−1 s−1; λ is the brain-blood partition coefficient (defined as ml of water per gram tissue / ml water per ml blood); δ is the arterial transit time from the tagging plane to the imaged slice; T1b is the T1 of brain tissue; T1a is the T1 of arterial blood; α is the inversion efficiency (Williams et al., 1992), which should be one for perfect inversion and 0.5 for perfect saturation; Mbtag is the brain tissue magnetization in the tagged experiment; Mbctrl is the brain tissue magnetization in the control experiment; T1app is the equilibrium brain tissue magnetization; and T1app is given by
Notice that the observed signal is exponentially dependent on the arterial transit time, α. In the rat experiments, the short transit times of the cerebral vasculature and the long T1 of blood at the high (4.7 Tesla) field strength reduced the importance of transit time measurement (Williams et al., 1993). For human perfusion, however, transit time dependence of the measured CBF is significant and represents a major obstacle to accurate quantification. Measurement of vascular transit time to accompany each perfusion measurement would reduce the sensitivity and temporal resolution of the method.
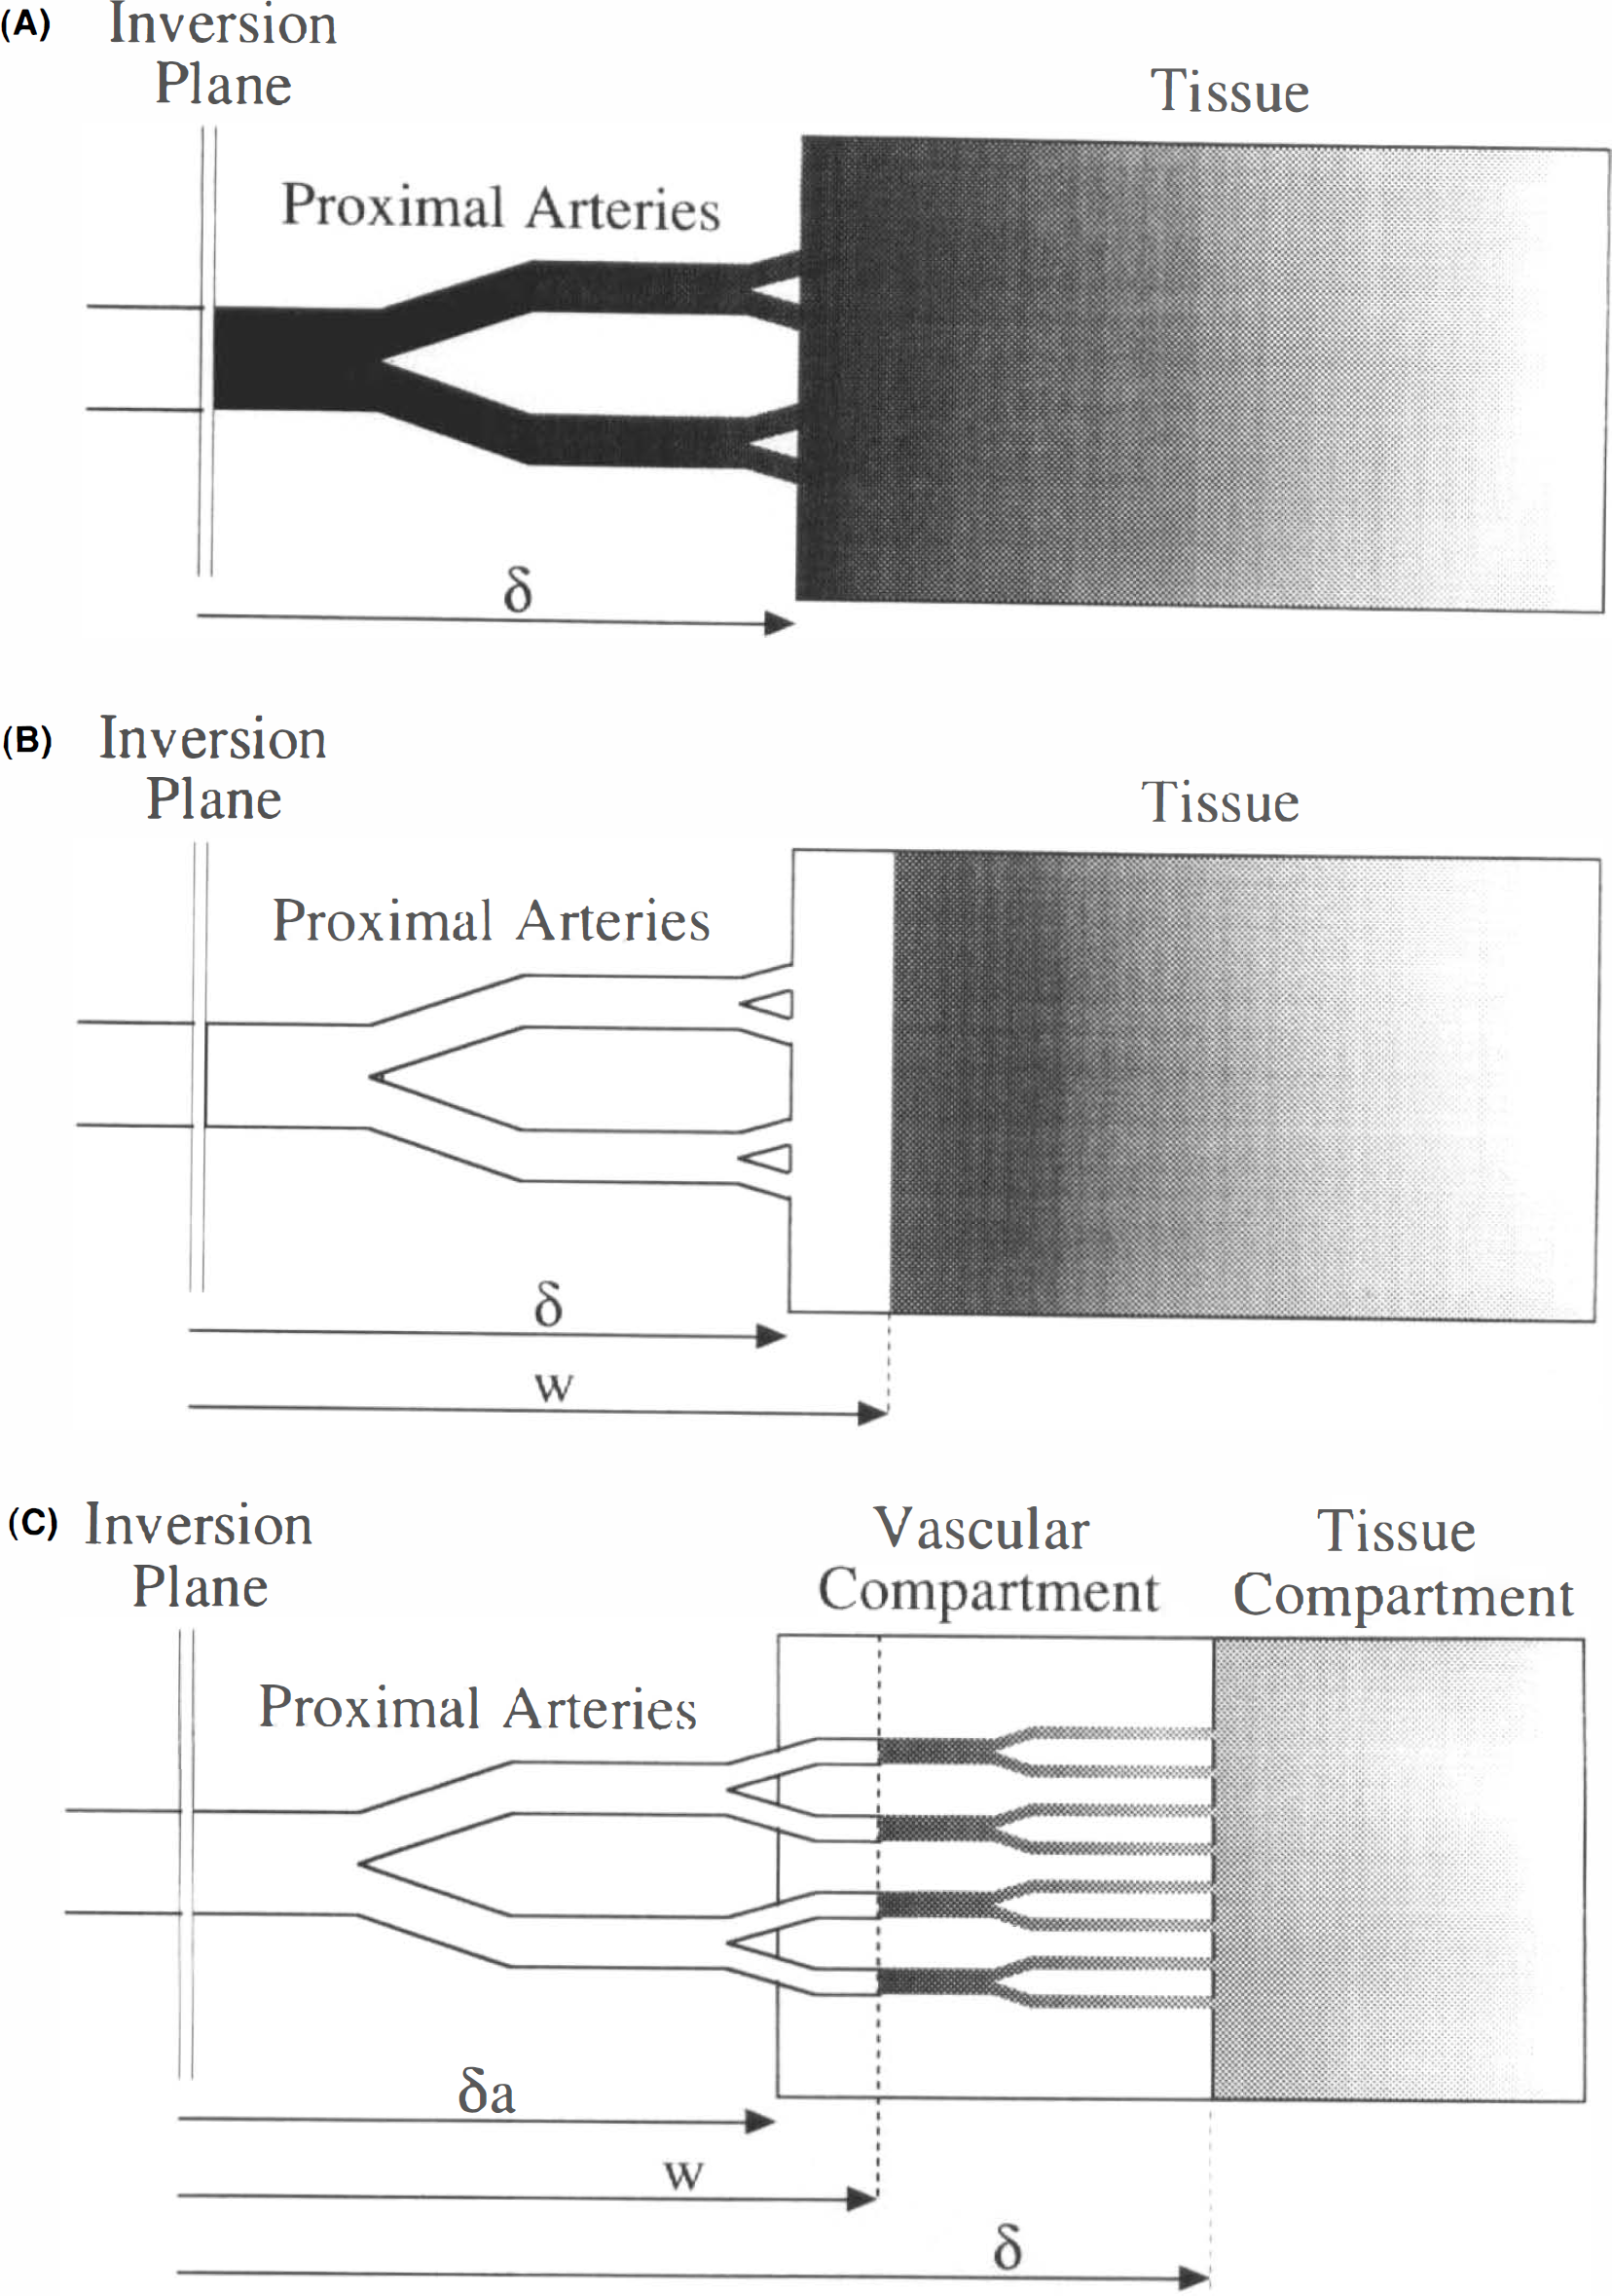
Schematic diagrams of the continuous arterial tagging perfusion imaging models.
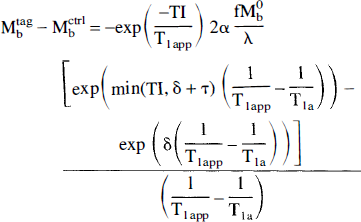
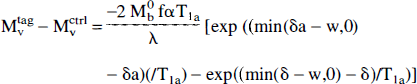
One approach to reducing the transit time sensitivity of continuous spin labeling experiments is to introduce a delay of duration, w, between the end of tagging and image acquisition (Fig. 1B). If w is less than δ, the delay has no effect but if w is longer than δ, the signal is given by (see Appendix)
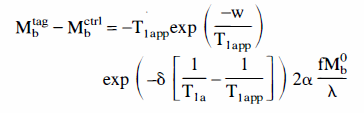
Notice that the flow now depends on δ times the difference between the tissue and arterial blood relaxation rates. Fortunately, the T1 in gray matter and arterial blood are within 10% of each other at 1.5 Tesla, so the transit time sensitivity of the expression is markedly reduced. For white matter, which has a shorter T1, the delay is only partially effective at reducing transit time sensitivity.
In the above theory, we have ignored the effects of magnetization transfer on image intensity. This is correct if a separate tagging radiofrequency coil is used (Silva et al., 1995), since power deposition at the imaging slice is minimal. In the present study, a single coil was used for both tagging and imaging, so magnetization transfer effects are significant. Magnetization transfer can alter the observed signal in two ways (Zhang et al., 1992). First, application of the tagging pulse causes a decreased signal from the imaged slice even in the absence of perfusion. We will assume that the control experiment also experiences this attenuation so that subtraction of the two images is predominantly dependent on perfusion. The presence of the off-resonance saturation also causes a decrease in the T1app. Although theoretical expressions for saturated T1app have been reported (Zhang et al., 1992), we choose to assume only that the decay during the application of a tagging pulse is characterized by a single T1app, T1s which may be different from T1ns, T1app in the absence of off-resonance radiofrequency (RF) saturation (Yeung and Swanson, 1992). If magnetization transfer saturation is present, the solution becomes (see Appendix)
where the min () function returns the smaller of its two arguments.
Pulsed tagging experiments
The signal change in the pulsed tagging experiments depends primarily on the geometry of the tagged slab. The signal is given by (see Appendix)
where TI is the time between tagging and imaging, δ is now the transit time from the most distal portion of the slab to the tissue, and τ represents the duration of the bolus. If TI is greater than δ + τ, then absolute perfusion quantification is problematic, (see Appendix). If TI is less than δ + b, and T1app is comparable to T1a, the expression can be approximated as
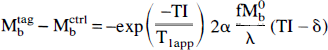
TI must be large compared to δ in order to achieve insensitivity to transit time. Since the signal intensity decays with T1, increasing TI to much greater than δ wiill significantly reduce the sensitivity of the measurement.
Comparison of tagging techniques
In Fig. 2, we compare the signal intensity observed with the two tagging techniques. Figure 2A shows the theoretical signal intensities in gray matter for a flow of 60 ml 100 g−1 min−1 assuming a T1app of 1,000 ms (Larsson et al., 1988; Steen et al., 1994), and T1a of 1,100 ms (Bryant et al., 1990). The continuous inversion experiment with no delay gives the highest signal intensity of all the techniques. As the delay, w, is increased, the maximum signal intensity decreases but the signal becomes very insensitive to the transit time for transit times shorter than w. The signal in the pulsed inversion experiment is smaller and more sensitive to transit time than the continuous inversion experiment with a delay. Figure 2B shows the signal intensities calculated for white matter. Because the T1 of white matter, 600 ms, is considerably smaller than that of blood, the signal from continuous labeling experiments increases with transit time. The pulsed inversion experiments retain their sensitivity to transit times.
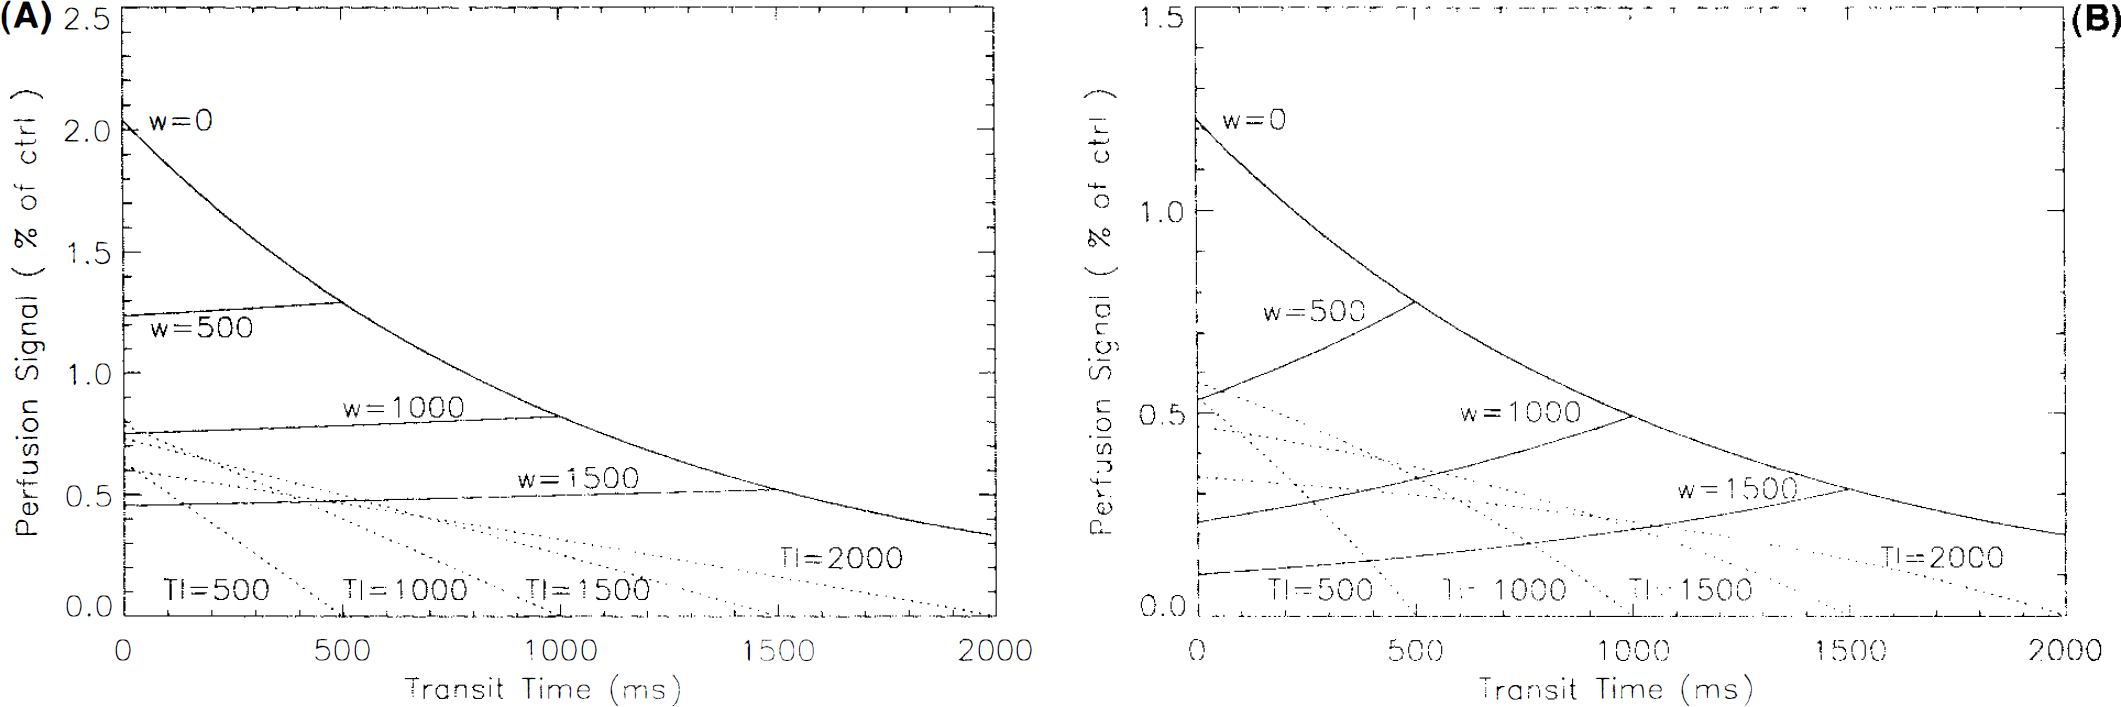
Theoretical image signal intensity for a flow of 60 ml 100 g−1 min−1 as a function of tissue transit time calculated for both continuous and pulsed inversion experiments in gray matter
Figure 2 suggests that continuous inversion is superior to pulsed inversion, but other factors may influence the success of the experiment. If only a single slice is being imaged, the transit time can be reduced slightly in pulsed inversion experiments by moving the inverted slab closer to the slice. Nevertheless, continuous labeling with a delay appears to be an attractive perfusion imaging strategy and we have pursued it exclusively in the remainder of this study.
Contribution of intraluminal spins
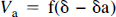
Intraluminal spins have been ignored in the past, partly because bipolar gradients were applied to attenuate the signal from flowing spins (Williams et al., 1992). Recent theoretical calculations (Henkelman et al., 1994) have demonstrated, however, that a substantial fraction of the blood signal is not attenuated by these gradients. This has several implications for perfusion imaging. First, it is nearly impossible to accurately measure the transit time to the tissue, δ, with magnetic resonance (MR) since it is difficult to discriminate spins in the tissue from spins in the microvasculature. Second, if the arterial blood volume is large enough, the signal from blood may dominate the signal from the tissue. This is especially true in white matter where short T1app reduces the observed perfusion signal from tissue. In order to assess the contribution of these two uncertainties to the quantification of perfusion, we expanded our model to include an arterial vasculature compartment. We divide the signal from the image into a brain tissue compartment and a vascular compartment. The signal from the tissue compartment was calculated above. We define a second transit time, δa, which represents the time required for blood to flow from the tagging slice to the arteries within the vascular compartment, illustrated in Fig. 1C. The division between the vascular compartment and larger feeding arteries located within the slice is somewhat arbitrary. If bipolar gradients are applied, some estimate of the minimum size of vessels experiencing attenuation is required. Otherwise, the division can be defined by the requirement that the length of blood vessels within the vascular compartment should not exceed the size of a voxel so that spatial resolution is not compromised. The signal from the vascular compartment is given by
where Mv represents the magnetization in the vascular compartment. Notice that for δa less than w, δa completely disappears from the equation and the signal is perfectly independent of arterial transit time. Since the division between the vascular compartment and the feeding vessels is vague, this independence is fortunate. By defining δa, f, and δ, we have implicitly defined the volume of the vascular compartment, Va, because it is given by
It is this relationship that implicitly determines the relative weighting given to the signals from the vascular and tissue compartments. Some other effects of the intraluminal spins were neglected because they were presumed small. First, we neglected the contribution of the vascular compartment spins to the equilibrium tissue magnetization, Mb0, because the arterial blood volume should be less than a few percent. We have also ignored magnetization transfer effects within the arterial blood because they are much smaller than those in tissue (Morrison and Henkelman, 1995).
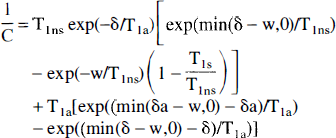
Calculation of flow
To obtain quantitative images of CBF, the above expressions must be inverted, i.e.,
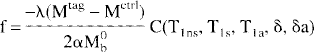
where
METHODS
All imaging was performed in a GE SIGNA 1.5 T scanner (General Electric, Milwaukee, WI, U.S.A.) equipped with a prototype three-axis whole body gradient system capable of echoplanar imaging. Subjects lay prone on the scanner table with their heads within the commercial quadrature RF head coil. Sagittal T1 weighted images were obtained prior to selection of an axial slice near the top of the thalamus. This slice was chosen since it included a diversity of tissue types, including white matter, ventricles, cortical gray matter, and deep nuclei. Gradient echo echoplanar images were acquired with a FOV of 24 cm, a flip angle of 90°, a 5-mm slice thickness, an effective spin echo-time (TE) of 31 ms, and a 64 × 64 matrix. Prior to the echoplanar acquisition, fat saturation and perfusion tagging were applied.
Adiabatic inversion was performed following the theory described in Williams et al. (1992). A constant axial gradient of 0.25 G/cm was applied simultaneously with constant RF of 35 mG amplitude. The frequency offset was set at 4,000 Hz resulting in an inversion plane 4 cm from the slice location, approximately midpons. At this level, both carotid and vertebral arteries are oriented in a superior-inferior direction. Echoplanar images were acquired with a repetition time of 4s. The inversion RF and gradient were applied constantly between the image acquisitions except for a variable delay between the end of the tagging and the acquisition of the image. The sign of the frequency offset was alternated to acquire both a proximal inversion image and distal inversion image, the latter of which is used as the unlabeled control. In addition, alternate pairs of proximal and distal inversion images were acquired with tagging gradients of opposite sign in some of the subjects. Changing both the frequency of the RF and the sign of the gradient has been suggested to reduce imperfections in the subtraction of the tagged and control images (Pekar et al., 1996). From 15 to 30 pairs of images were acquired and magnitude averaged for each delay and frequency offset.
Seven normal volunteers, five men and two women, 20–40 years of age were studied. In four of the subjects, images were obtained with posttagging delays of 10, 75, 150, 300, 450, 600, 900, and 1,200 ms. These images were used to assess the vascular transit times. Five of the subjects were imaged with the alternating gradient strategy at a fixed delay of 900 ms. Two of the subjects for this second experiment also participated in the transit time study. T1 maps were obtained in these five subjects, as described below. In two of these subjects, an additional perfusion image was acquired during mild hypercapnia produced by voluntary hypoventilation.
To quantify the perfusion images, T1s and T1ns were measured by applying off-resonance RF pulses while the perfusion gradient was turned off. The off-resonance pulses caused changes in the signal amplitude due to magnetization transfer. A repetition time (TR) of 8 s was used to assure an equilibrium condition existed prior to RF pulse changes. T1s was measured by obtaining images with 0 delay while the tagging pulse was set to each of 0, 50, 100, 200, 300, 500, 800, 1,000, and 3,500 ms durations. T1ns was measured by applying a long tagging pulse with delays before imaging spanning the same range of durations. The resulting signal decay curves were fit to exponential functions using a nonlinear least squares algorithm. Pixels in which the signal did not change more than 10% when the tagging pulse was applied were assumed to be primarily CSF, which is not attenuated by magnetization transfer, and T1 was not calculated. Although this method of T1 measurement is not standard, it is fast, compatible with applied saturation pulses during relaxation, and free from contamination by CSF, which has a much longer T1 than does gray or white matter.
Quantitative perfusion images were calculated using the formula presented in the previous section, the T1 maps, and assumptions for the vascular transit times which will be described below. Images were segregated into gray and white matter regions based on T1, and the gray matter was then manually subdivided into cortical and subcortical regions. Subcortical gray matter included regions of caudate, putamen, and thalamus. Quantitative flows were calculated in each of the five subjects.
RESULTS
A representative set of difference images (control — arterial spin tagging) are displayed in Fig. 3. The first image, obtained with a tagging delay time of only 10 ms, shows a strong perfusion-related signal, but the spatial distribution deviates from the expected cortical gray matter distribution. Except for the ventricles, which are totally dark, both gray and white matter are bright. Extremely bright foci, probably representing large vessels, are readily apparent and account for a considerable part of the total intensity in the image. As the tagging delay is increased, the entire image begins to fade, but the vascular signal decays much more rapidly than does the tissue signal. At delay times of ≤600 ms, the perfusion image takes on an intensity distribution that follows the cortical structure. Elevated flow relative to white matter is also apparent in the deep nuclei. The bright diagonal linear structures at the medial borders of the thalamus likely represent choroid plexus.
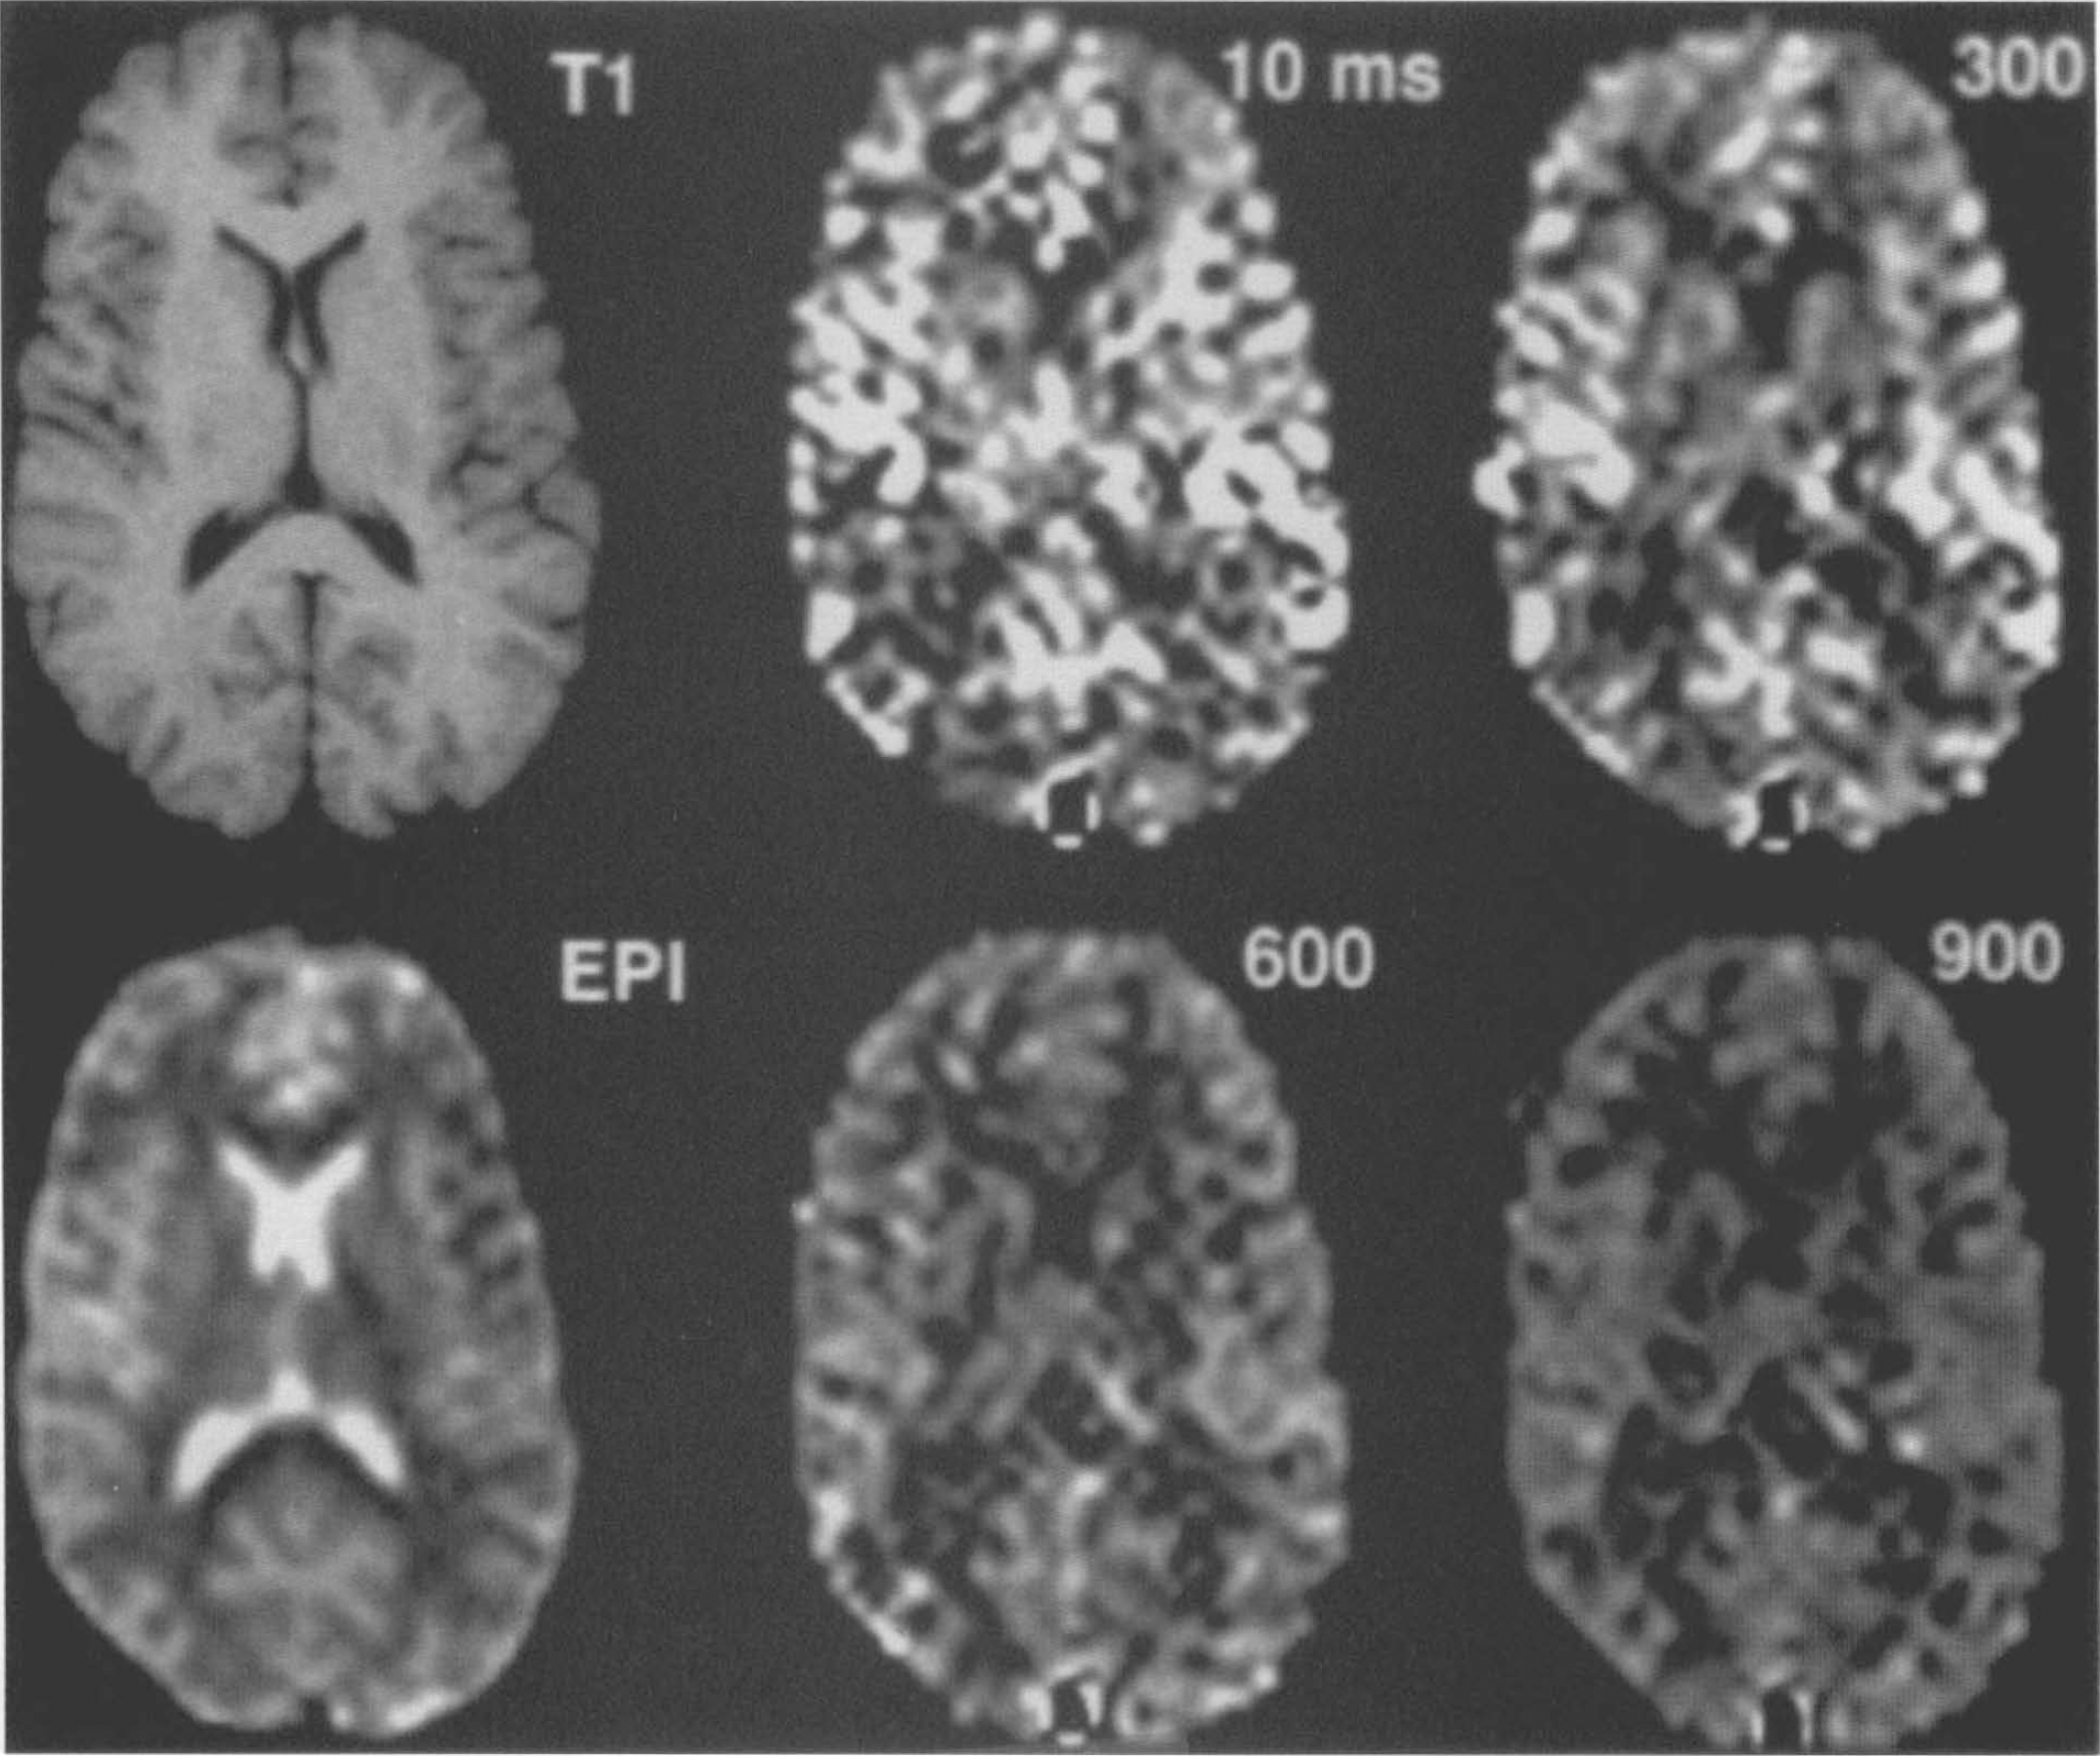
Difference images (control — arterial spin tagging) acquired with post tagging delays from 10 to 900 ms. A high resolution T1,-weighted image (top left) and an echoplanar image (bottom left) are shown to demonstrate the anatomy. Bright intravascular spins are apparent when short delays are used, but longer delay images show primarily gray and white matter contrast consistent with lower white matter perfusion.
Approximate transit times can be inferred from the properties of the signal as a function of tagging delay. As can be seen in Fig. 3, large arterial structures completely disappear only when a 600 ms delay is used. Figure 4 shows this signal decay with delay in several types of regions averaged over four subjects. The signal from the first region, large arterial structures, begins to decay rapidly with delay except for an initial plateau at the earliest delays indicating an average transit time to these vessels on the order of 200 ms. The signals from these arterial structures, all within gray matter, only decrease to the level of other gray matter regions at ˜600 ms delay. Signal from large gray matter regions, including some bright signal regions that probably represent smaller arterial structures, show a longer initial plateau indicating an average transit time of ˜400 ms. Finally, gray matter regions selected for the absence of bright structures show very little change with delay. These values of transit times can be used to help constrain the transit times of the model, δa, and δ. δa can readily be constrained to <600 ms based on these results. δ must be >600 ms, but the upper limit is not well constrained by our observations.
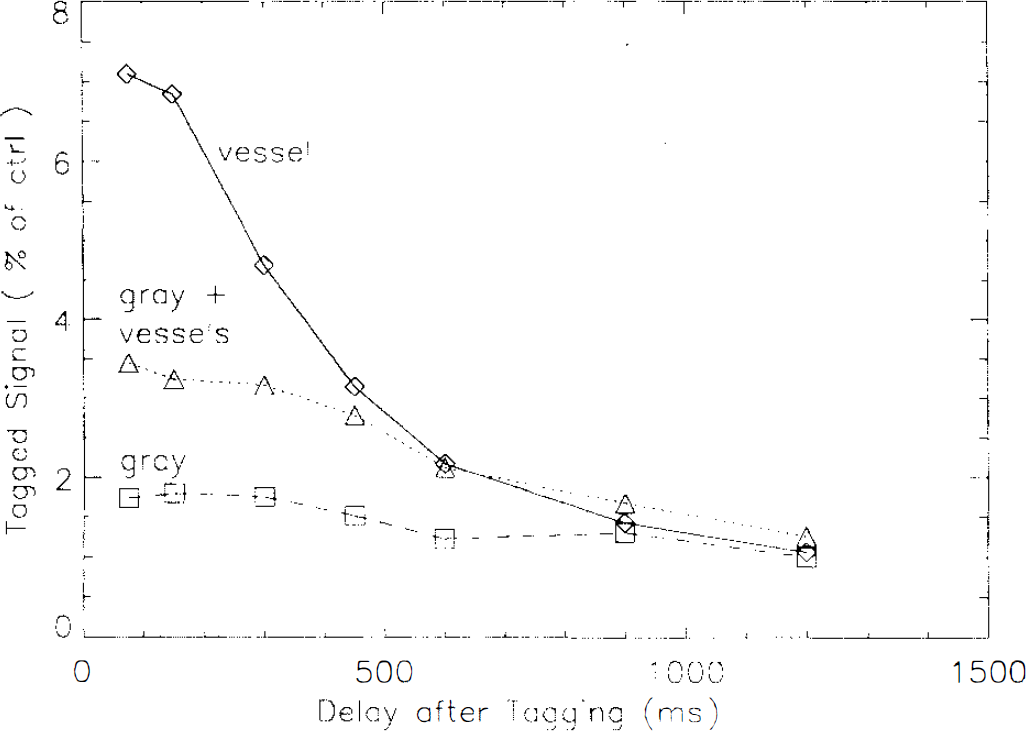
Mean signal intensities in three types of gray matter regions, averaged across four subjects. Signal from regions containing only bright vessels on early delay images decays rapidly with delay. Signal from gray matter regions, which include some smaller bright vessels, decays more slowly. Finally, signal from gray matter regions selected for the absence of bright vascular structures remains virtually constant with delay. All three regions have similar signals at long delay times.
T1ns and T1s were successfully measured for both gray matter and white matter. Representative T1ns and T1s images are shown in Fig. 5. T1ns is noticeably >T1s in both gray and white matter regions. T1s was 746 ± 18 ms in gray matter and 525 ± 36 ms in white matter averaged across five subjects. T1ns was longer in both cases, 1151 ± 12 ms for gray matter and 770 ± 11 ms for white matter, in reasonable agreement with other measurements of T1 at 1.5T (Bottomley et al., 1984; Larsson et al., 1988; Steen et al., 1994).
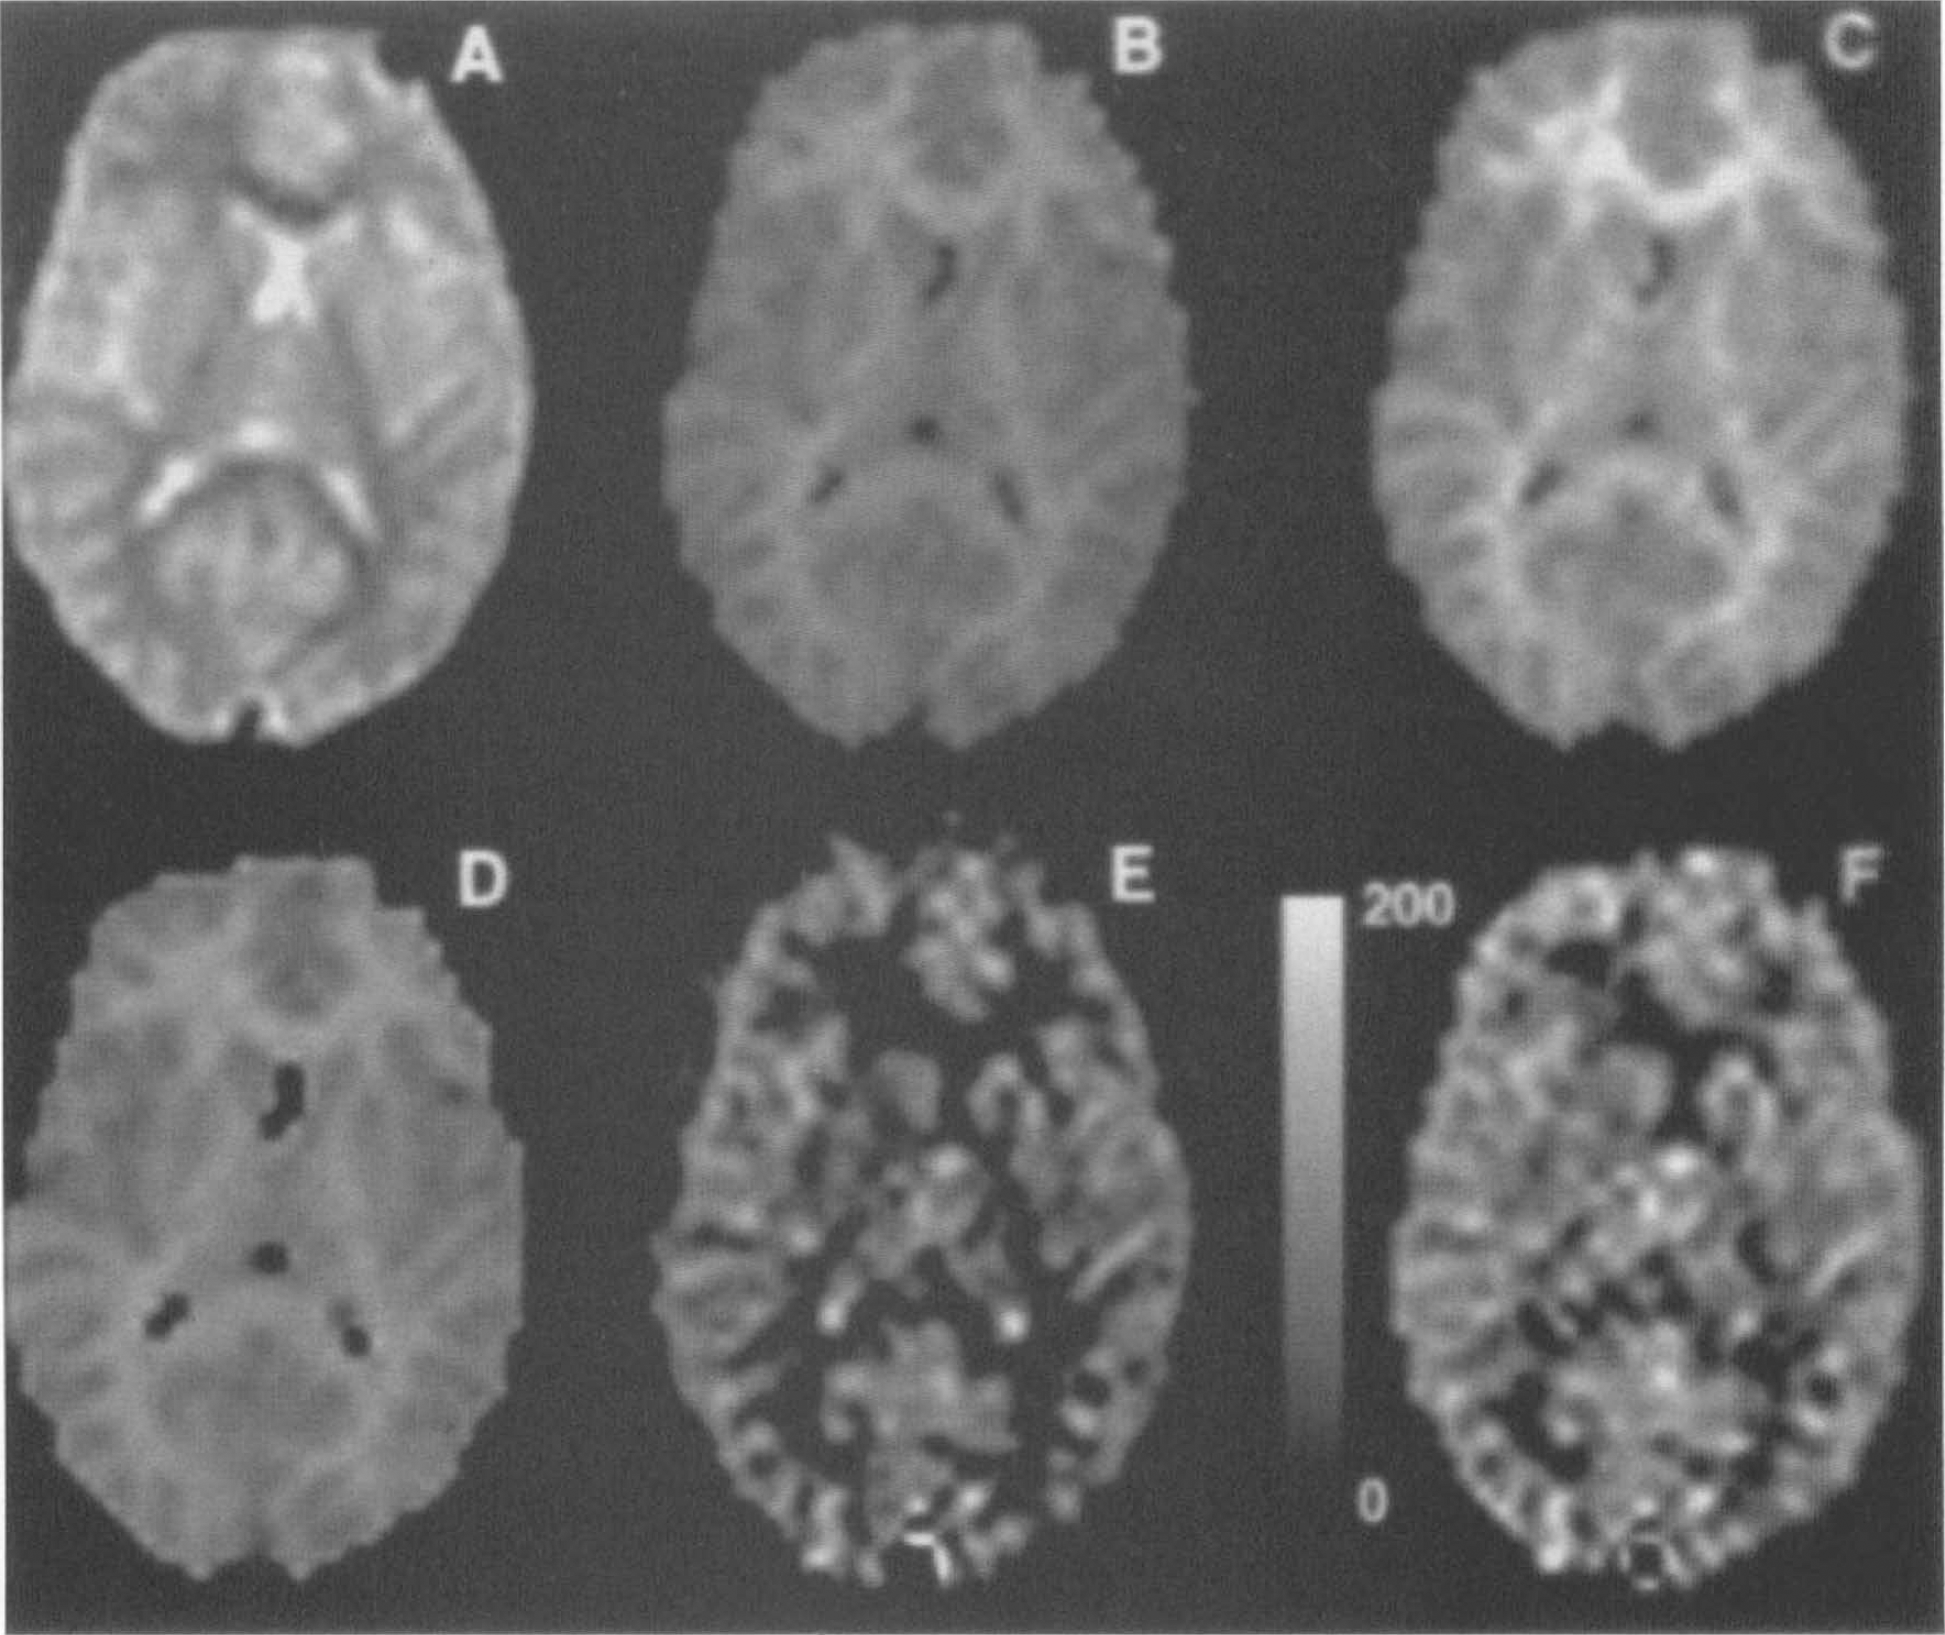
Calculated images from a representative subject. Echoplanar images
In five of the subjects, the sign of both the frequency and the gradient were alternated in a four-step cycle (Pekar et al., 1996). When the images with opposite gradient sign were averaged separately, the two resulting perfusion-weighted images sometimes differed in intensity. Subtraction of the two perfusion images yielded an error image with no contrast between gray and white matter, suggesting that the error was not related to perfusion. The basis for this difference, which varied from subject to subject, is uncertain; however, the amplitude never exceeded 20% of the gray matter perfusion signal in any subject.
Quantitative perfusion values for five of the subjects are shown in Table 1. We assumed a tissue transit time, δ, of 1,500 ms, a T1 for blood of 1,100 ms (Bryant et al., 1990), and a brain-blood partition coefficient of 0.98 for gray matter and 0.82 for white matter (Herscovitch and Raichle, 1985). Mean gray matter flow was found to be 91, mean white matter flow was 36, and average flow was 71 ml 100 g−1 min−1. Representative images calculated for one subject are shown in Fig. 5. Voluntary hypoventilation in two subjects caused a 40% increase in perfusion relative to rest (Fig. 6).
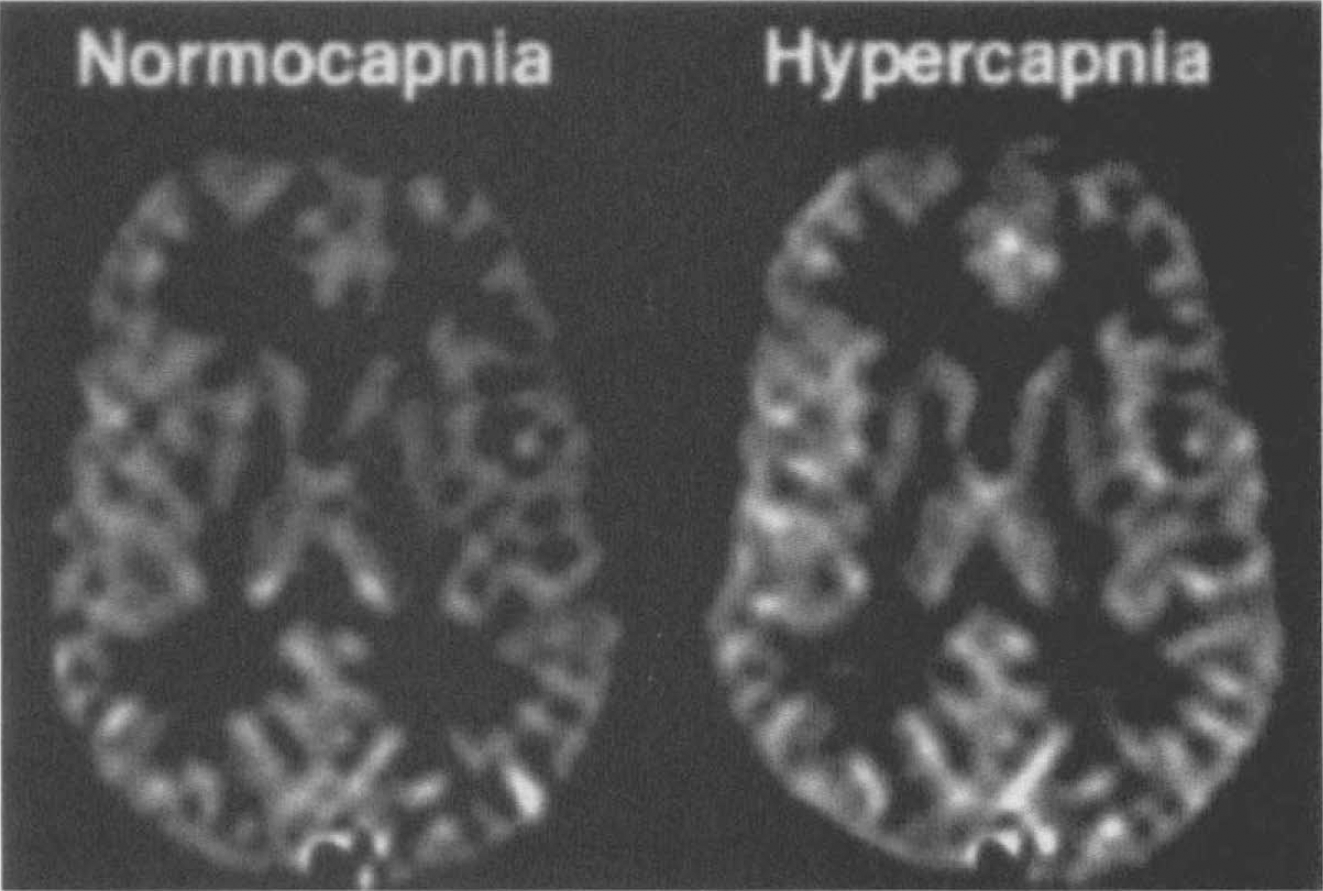
Difference images (control — arterial spin tagging) from a subject during rest (left) and during voluntary hypoventilation (right). Cerebral perfusion increased by 34% during the hypercapnia induced by the hypoventilation.
Quantitative perfusion values obtained during rest (n = 5) and during voluntary hypoventilation (n = 2).
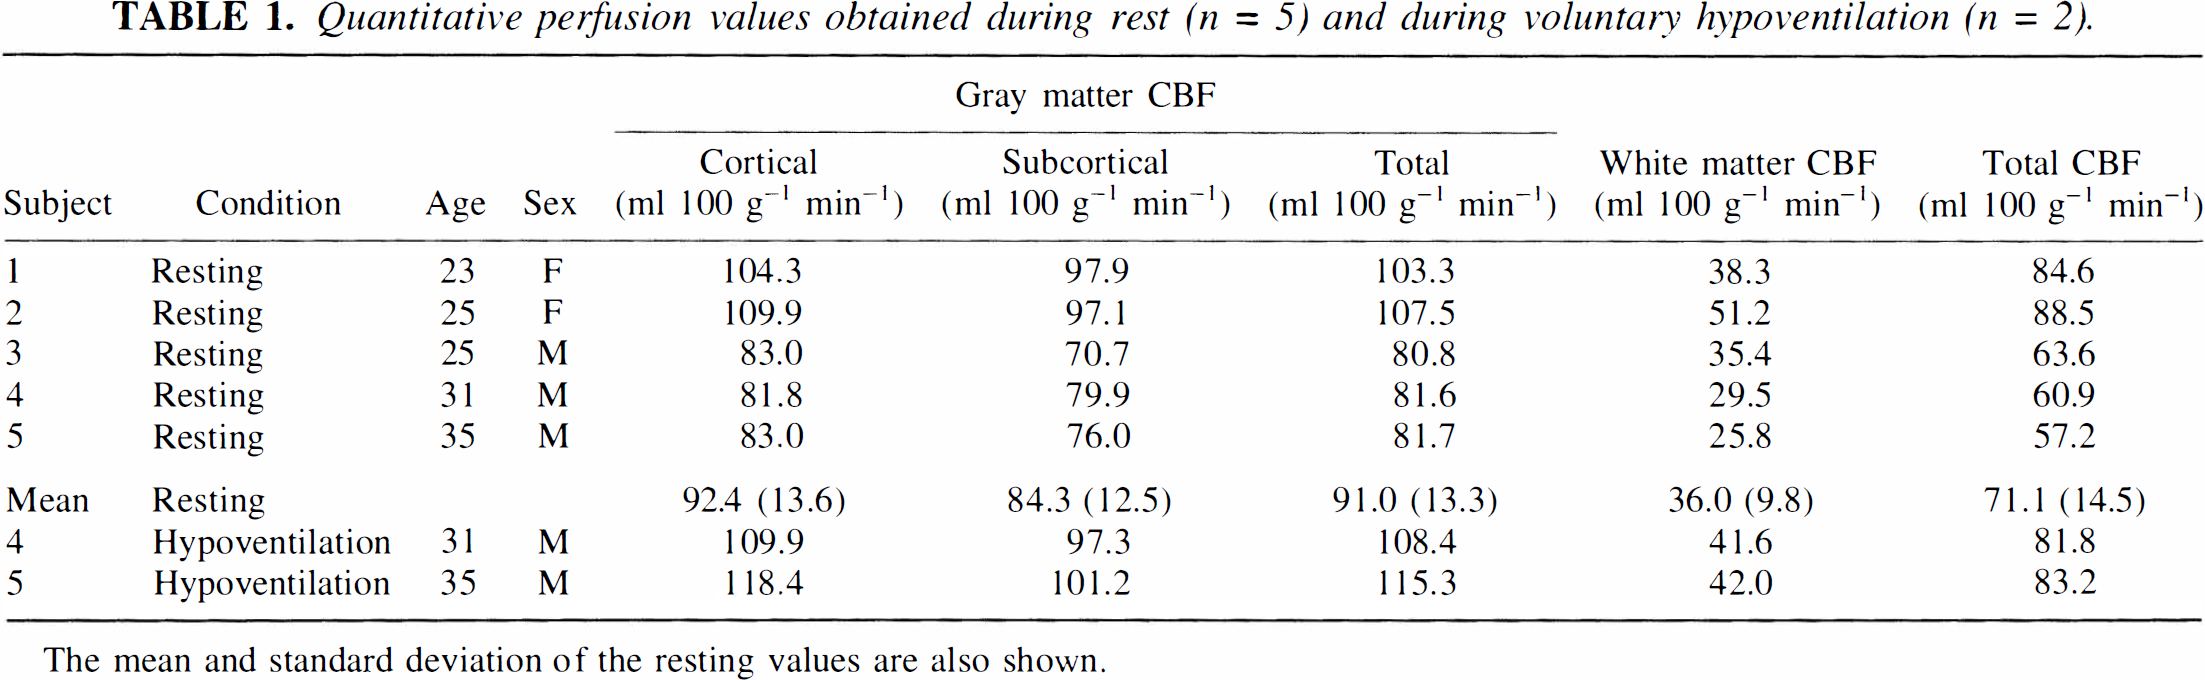
The mean and standard deviation of the resting values are also shown.
DISCUSSION
These results demonstrate the feasibility of obtaining high resolution, quantitative perfusion images of the human brain without exogenous tracers or arterial or venous blood sampling. Using the present technique, high quality perfusion images could be obtained from a single slice through the human brain in <5 min. Our results represent a major improvement in resolution relative to other techniques, except those obtained from the highest quality positron emission tomography (PET) studies. Since the resolution of the MR technique is limited only by the signal-to-noise ratio, further improvement in resolution should be obtainable with optimization of acquisition parameters, increased imaging time, more sensitive RF receiving coils, and higher field strength magnets.
Sensitivity of the perfusion images, motion insensitivity of results, and flexibility of scan timing were all enhanced by the use of echoplanar imaging. Interleaved subtraction essentially eliminated the need for subject constraint as proven by the perfusion images obtained in seven subjects that had no indication of motion artifact. Echoplanar imaging also improved the speed with which T1 maps could be obtained. While echoplanar imaging is probably not essential for this technique—since interleaved acquisition and delay are compatible with standard spin warp spin and gradient echo sequences—echoplanar perfusion images will serve as a benchmark of motion insensitivity and image quality against which other acquisition methods must be compared.
Acquisition of images using different posttagging delays made it possible to estimate, δa, the arterial blood transit time. Measurement of the true tissue transit time is difficult and may be beyond the capabilities of MR techniques. Measurements of arterial transit time using other techniques are rare in the literature and subject to similar inaccuracies (Nagata and Asano, 1990). Introduction of a posttagging delay also eliminated the intense signal from large vessels, which, clearly, do not reflect tissue perfusion. This effect is a by-product of choosing w longer than δa. Bipolar gradient pulses may still be used but are unnecessary unless δa is longer than w. The presence of bright vessels in perfusion images acquired without bipolar gradients is an indication that a longer delay is necessary to achieve transit time insensitivity.
Perfusion images acquired with opposite signs of tagging gradient demonstrated small differences representing subtraction error. It has been suggested that the magnetization transfer spectrum may be asymmetric, resulting in subtraction errors when perfusion tagging is applied (Pekar et al., 1996; Stein et al., 1994). In our study, subtraction errors varied considerably from subject to subject, which argues against the existence of a fundamental asymmetry in the magnetization transfer spectrum. These small differences may simply be caused by slight offsets in the magnetic field due to variations in subject geometry, eddy currents, or other instrumental imperfections. Averaging the perfusion images obtained with opposite gradient sign dramatically decreases sensitivity to such errors, resulting in improved quantification.
An adequate quantification method for our images must take into account the presence of a considerable volume of tagged water in small arterial vessels, in addition to that in the tissue itself. Results of varying w suggest that the transit time to visible arterial structures is on the order of 200 ms while the transit time to the smaller vessels, which feed white matter and smaller gray matter structures, is on the order of 600 ms. Even when a 900–ms delay is employed, it is unlikely that all of the tagged blood reaches the tissue. Although this blood signal could be eliminated by increasing the delay time, at the cost of sensitivity, theoretical estimates indicate that the signal in the small vessels compromises neither resolution nor quantification. Image signal intensity for our experimental parameters is plotted as a function of tissue transit time in Fig. 7, assuming a δa of 600 ms. Although the image intensity is sensitive to tissue transit time, the dependence is very weak in gray matter and fairly weak in white matter. As the tissue transit time exceeds the tissue T1, transit time sensitivity disappears because most of the signal is actually within the vascular compartment. Although we have selected a 900–ms delay for our studies of normal volunteers, a longer delay may be necessary to ensure transit time insensitivity in patients suffering from vascular disease, who frequently have longer arterial transit times.
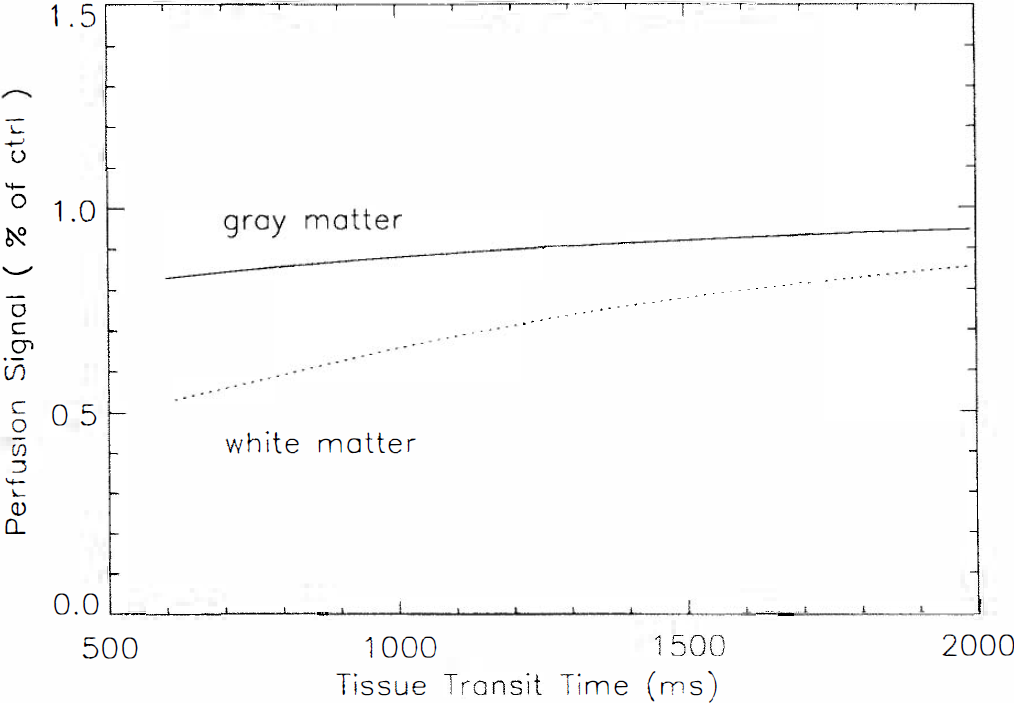
Calculated signal in gray and white matter as a function of δ for blood flow of 60 ml g−1 m−1, δa of 600 ms, w of 900 ms, and T1s for gray and white matter as measured in the text. The calculation includes the effects of magnetization transfer and intraluminal spins. Results are largely independent of δ, suggesting that an accurate measure of δ is not necessary.
Accurate quantification of perfusion requires knowledge of longitudinal tissue relaxation. The effects of magnetization transfer, due to the tagging pulse, must be considered in the measurement of T1. We have measured T1 of tissue both in the presence and absence of the tagging pulse. T1 is measurably shorter during the tagging, and the fractional change in T1 is roughly equal to the fractional change in signal intensity caused by magnetization transfer.
Zhang et al. (1992, 1995), have reported detailed theoretical and experimental studies of the relationship between T1, magnetization transfer, and perfusion quantification that support this relationship. Their work assumes that the macromolecular spins are fully saturated during tagging while the free spins are unaffected except by transfer. If this full saturation of macromolecular spins were accomplished, however, the observed signal intensity would be independent of tagging amplitude (Grad and Bryant, 1990). This situation is almost never observed in vivo since sufficiently high saturation power is rarely used. A more appropriate assumption would be that the exchange between the two or more water compartments is very fast compared to that of T1. Under this assumption, the relative concentration of spins in all compartments remains unchanged when saturated (Caines et al., 1991). The relationship between T1 change and signal saturation derived by Zhang et al. (1992) remains true under this new assumption. Both assumptions can be avoided if T1s and T1ns are measured directly, as in this study. Except for short transient effects, the longitudinal relaxation of tissues can be well characterized by these two time constants (Adler and Yeung, 1993; Yeung and Swanson, 1992). During the fitting of the T1 decay curves, an accurate measure of magnetization transfer is also obtained. Since magnetization transfer is much greater in tissue than in CSF, the measured magnetization transfer could be used to estimate the amount of tissue in each voxel. Using this approach, gray matter perfusion values could be corrected for partial volume effects, which are particularly severe when atrophy is present.
Quantitative perfusion values obtained with our method were in agreement with those measured by other techniques. Gray matter perfusion values of 91 ± 13 ml 100 g−1 min−1 and white matter values of 36 ± 10 ml 100 g−1 min−1 are slightly higher than PET measurements of resting perfusion (Lammertsma et al., 1990; Matthew et al., 1993; Quarles et al., 1993). Several factors may contribute to this difference. First, our volunteers were relatively young. CBF has been shown to be higher than average in young adults (Pantano et al., 1984) and in women (Gur et al., 1982, 1994). Excluding the two younger female subjects would have shifted the mean CBF values more towards literature values. Finally, the comparatively high resolution of our method as compared to that of PET may have more correctly separated gray from white matter, resulting in higher gray matter flows. Although arterial or end-tidal CO2 levels were not measured, voluntary hypoventilation produced easily detectable changes in measured perfusion, consistent with the expected effects of hypercapnia on CBF. Literature values for CO2 reactivity (Levine et al., 1991), 5% / mm Hg, suggests an increased PaCO2 of 8 mm Hg would achieve the observed 40% increase in flow.
Our theoretical model indicates that the fortuitously similar T1s of blood and gray matter make quantification of gray matter flow virtually independent of transit time to the tissue, δ, when a sufficiently long tagging delay is employed (Fig. 2A). Images are perfectly independent of transit time to the vascular compartment, δa, for both gray and white matter as long as the transit time is shorter than the delay time. The need to account for transit time represented one of the major obstacles to quantification of perfusion, particularly in humans where the transit time is comparable to T1. The shorter T1 of white matter leads to a greater dependence of signal intensity on tissue transit time (Fig. 2B); however, this dependence is still markedly weaker than the exponential dependence of signal on transit time when no tagging delay is employed. When perfusion values are calculated assuming δ of 750 instead of 1,500 ms, white matter perfusion increases 32% but gray matter perfusion increases by only 8%. The remaining sensitivity of white matter flow to transit time still requires that a fairly accurate transit time value be used for accurate flow quantification.
The availability of a high resolution, quantitative cerebral perfusion imaging method requiring no injections, no arterial or venous sampling, and no ionizing radiation should contribute to a better understanding of cerebrovascular physiology and improve the diagnosis and treatment of stroke, trauma, neoplasms, seizures, degenerative disease, and other cerebral disorders. It is also readily combined with a variety of other techniques such as angiography, spectroscopy, or blood oxygenation-sensitive brain activation imaging. Adaptation of this technique to other body organs should also be possible with clear applications to a variety of circulatory disorders.
Footnotes
APPENDIX
The theory of spin tagging experiments is based on the modified Bloch equation (Detre et al., 1992),
where f is the blood flow in ml/gm/s, λ is the brain-blood partition coefficient defined as the ml of water per gram tissue/ml water per ml blood, T1b is the T1 of brain tissue, Mb is the brain tissue magnetization,
The observed signal intensity difference can then be derived by direct integration once the arterial spins are defined.
Abbreviations used
Acknowledgment:
This work was supported in part by a grant from the National Institutes of Health, NS01668 (J.A.D.). The authors acknowledge helpful discussions with Drs. Rahim Rizi, David Roberts, Joseph McGowan, Ruben Gur, Abass Alavi, and Martin Reivich.