
Abstract
Arterial spin labeling (ASL) is an MRI technique that was first proposed a quarter of a century ago. It offers the prospect of non-invasive quantitative measurement of cerebral perfusion, making it potentially very useful for research and clinical studies, particularly where multiple longitudinal measurements are required. However, it has suffered from a number of challenges, including a relatively low signal-to-noise ratio, and a confusing number of sequence variants, thus hindering its clinical uptake. Recently, however, there has been a consensus adoption of an accepted acquisition and analysis framework for ASL, and thus a better penetration onto clinical MRI scanners. Here, we review the basic concepts in ASL and describe the current state-of-the-art acquisition and analysis approaches, and the versatility of the method to perform both quantitative cerebral perfusion measurement, along with quantitative cerebral angiographic measurement.
Introduction and historical perspective
Magnetic resonance imaging (MRI) has a long history of measuring blood flow in large vessels. This includes the development of time-of-flight angiography 1 to visualize the brain's vasculature, as well as more quantitative measurements of luminal blood velocity via phase contrast methods. 2 However, none of these methods measures delivery of blood to the tissue itself, and therefore the health of the brain at the level of the capillary bed. Methods such as xenon-computed tomography 3 (CT), 15O positron emission tomography4,5 (PET), and CT perfusion were available at this time but these methods all involved exposure to ionizing radiation. An early MRI method to attempt capillary-level perfusion measurement was intravoxel incoherent motion (IVIM) developed by Le Bihan et al. 6 For this, blood flow at the microscopic level was modeled as a pseudo-diffusion process, with the blood displacements in the capillary bed having a relatively large apparent diffusion coefficient relative to water in tissue. It was hypothesized that perfusion could be extracted from a two-compartment fit of signal versus increasing diffusion encoding (b-value), with the blood compartment showing strong signal attenuation at low b-values. However, in practice, the low blood volume fraction in brain tissue, along with difficulties obtaining clean model separation between blood and tissue compartments, meant that IVIM never succeeded in its goal of measuring cerebral perfusion (although it has found success in other organ systems and in certain pathologies).
Another MRI approach to measuring cerebral perfusion is dynamic susceptibility contrast (DSC). This is more invasive, requiring injection of a bolus of gadolinium chelate contrast agent and subsequently imaging the bolus passage through the tissue bed.7,8 Gadolinium contrast agents lead to microscopic magnetic field inhomogeneities in the surrounding tissue as they pass through the capillary bed, and hence to a faster signal decay. Although theoretically possible to measure tissue perfusion, DSC suffers from a variety of practical limitations, not least the need to accurately de-convolve a local arterial input function (AIF). 9 As such, it has found application in the measurement of relative cerebral blood volume, and in assessing ischaemia via arrival time delays, but although able to measure relative cerebral perfusion, it has struggled to offer a truly absolute measurement of perfusion. 10 A final method worth mentioning is that of perfusion mapping using 17-oxygen water, which can yield quantitative perfusion measurements, 11 but is hard to scale up to human use due to the expense of the labeled agent.
The approach of arterial spin labeling (ASL) for imaging cerebral perfusion was first demonstrated in the early 1990s, 12 although the overall principles can be traced back to 1959. 13 Inspired by spectroscopic tracer kinetic methods,14–16 (and utilizing flow-driven adiabatic fast passage to invert the blood spins, contrasted with an image in which the blood spins are left un-inverted – already successfully used for angiographic purposes previously by Dixon et al. 17 ), the detection of magnetically labeled blood in rat brain was used to extract quantitative measures of perfusion. 18 Initially, blood saturation was used, rather than inversion (yielding lower signal-to-noise ratio (SNR)), 19 but later a flow-driven adiabatic inversion principle was used in human brain, 20 and the field of ASL MRI was born.
Subsequent papers demonstrated other variations of the underlying principles. As well as flow-driven adiabatic inversion, that establishes a ‘continuous ASL’ (CASL) steady-state delivery of inverted blood water spins to the tissue, it was shown that a slab of inverted spins could also be used to provide ASL contrast. One such ‘pulsed ASL’ (PASL) method is the EPI signal targeting with alternating RF (EPISTAR) method, 21 yielding qualitative perfusion by taking the signal difference between an image acquired following a proximal slab inversion of blood spins, versus one acquired with no inversion pulse. A later variant of this method was the PICORE method of Wong et al. 22 This used an off-resonance control pulse, rather than no control RF pulse (as in the original EPISTAR method) or a distal slab inversion (as in subsequent EPISTAR implementations). The advantage is that only proximal arterial blood is labeled, rather than both proximal arterial and distal venous blood. Another form of PASL is the flow-sensitive alternative inversion (FAIR) method.23–25 This takes difference images acquired after a slice-selective versus non-slice-selective inversion, again enabling difference images that reflect perfusion.
A difficulty with these early methods is that they do not lend themselves to multi-slice acquisition. In the case of CASL methods, a control RF pulse is needed with matched magnetization transfer (MT) 26 effects, and the frequency condition for this matching could only be achieved for a single slice location. Likewise, PASL methods suffered either from unwanted direct perturbation of the imaging slices by the labeling pulse, or due to a limited amount of blood labeled in the region proximal to the imaging slices. A significant step forward was made by Alsop and Detre 27 with a CASL scheme that matched MT effects across multiple slices. More recently, the invention of pseudo-continuous labeling, 28 involving a train of multiple low angle selective RF pulses, has allowed the higher SNR of CASL to be implemented on a modern clinical scanner (on which a ‘true’ continuous RF pulse is challenging in practice).
Physical principles of ASL
The principal sub-categories of ASL are PASL and CASL. More recently, further forms of ASL have been described, such as velocity-selective ASL (vsASL) and pseudo-continuous ASL (pCASL). Indeed, the latter method offers many attractive features and has become the accepted ‘standard’ acquisition strategy. As such, the pCASL method will be summarized first, with a briefer mention made of the original CASL method and the PASL method.
pCASL
The main clinically relevant method in the ASL armoury for clinical deployment is pCASL.
28
This offers relatively good SNR and can be deployed using standard clinical MRI hardware. This has made it the labeling method advocated by the ISMRM Perfusion Study Group and the European Consortium for ASL in Dementia.
29
The basic principle is shown in Figure 1(a). Adiabatic inversion of the blood magnetization as it passes through the labeling plane is achieved via a mechanism different from the original CASL method. Figure 1(a) shows a train of closely spaced low flip-angle slice-selective RF pulses, in conjunction with suitable gradients orientated in the direction of flow. The time-averaged values for the RF pulses and gradient pulses for pCASL are similar to the values needed for standard CASL. However, in the case of pCASL, the transition of the spins from alignment along +z to −z is most easily thought of in terms of the off-resonance magnetization profile familiar from steady-state free precession pulse sequences.
30
Part (a) shows the pulse sequence preparation elements for pseudo-continuous ASL (pCASL), consisting of a train of selective RF pulses (of low flip angle α and zero phase) in combination with suitable gradients in the direction of flow. The pulse train used as the control, which has pulses with the same flip angle but alternating phase, and which is substituted for the labeling RF pulse train, is also shown. Part (b) shows the repeating modulation of M
z
as a function of the phase accumulated between RF pulses that is imposed on the flowing spins by the gradient shown in (a). Since the rate of accumulation of phase is proportional to the distance of the spins from the labeling plane, the x-axis is equivalent to distance. Note that since selective RF pulses are used, the flowing spins only experience the transition region shown in red, which causes their magnetization vectors to invert as they pass through the labeling plane (i.e. left to right in the figure). The dashed lines show the parts of the modulation pattern (locations) for which the spins are outside the influence of the selective RF pulses used.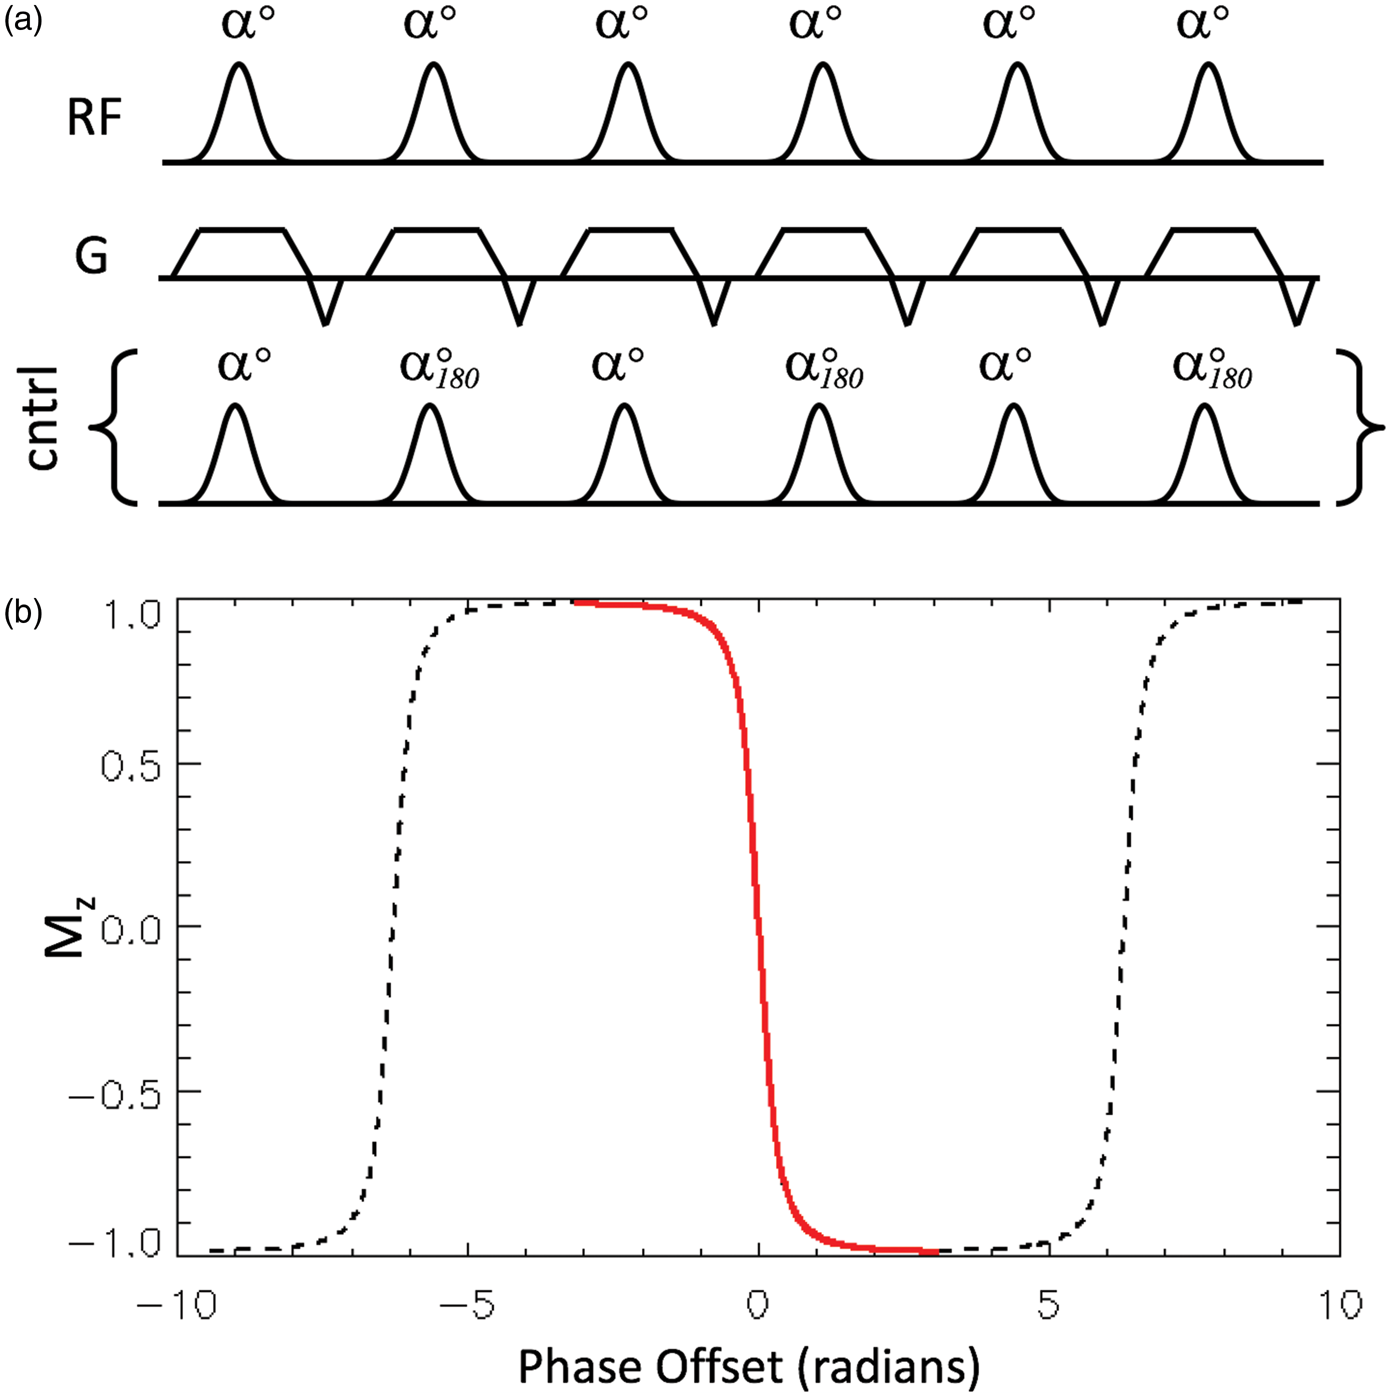
For a steady-state train of RF pulses, with a phase evolution of φ between consecutive pulses, the steady-state longitudinal (M
z
) profile (neglecting T1 and T2 effects) is given by
31
This function is shown in Figure 1(b) for an RF flip angle, α, of 20°, displaying a repeating pattern of modulations in M z as a function of φ (which can also be thought of as phase accumulated due to the spin being off-resonance). Considering now a moving spin that is initially off-resonance with respect to the RF pulses (i.e. at the far left of Figure 1(b)), its M z will be modulated by the steady-state pulse train. Under appropriate conditions of flow velocity to achieve adiabatic conditions, and RF pulse bandwidth such that only the central M z transition (shown in red) in Figure 1(b) exerts influence on the moving spins, the magnetization will invert as it passes through the labeling plane. For the control condition, the phase of consecutive RF pulses needs only to be advanced by 180° (shown in Figure 1(a)). This ensures that the steady-state is not established, since the net flip angle in the pulse train becomes zero.
One source of error for pCASL is caused by poor shim, when the assumed phase evolution between the labeling RF pulses, φ, may not hold true. This results in a shift of the effective labeling plane location, and for a large enough shift, this will reduce the RF field experienced at the new labeling plane location to such an extent that adiabatic inversion is compromised, or possibly extinguished. Strategies to mitigate this are either: (i) to ensure that the labeling region is well shimmed or in a region of inherently good shim (e.g. the region of the neck where the two internal carotid and two vertebral arteries run approximately perpendicular to the transverse plane); or (ii) to run the experiment multiple times, with progressively greater phase shift added between the RF pulses, 32 for example by running n repeats, with Δφ=2π/n; or (iii) by incorporating transverse gradient blips into the pCASL train to spatially compensate for erroneous phase shifts 33 (the same principle used for vessel-encoded pCASL, as described later).
CASL
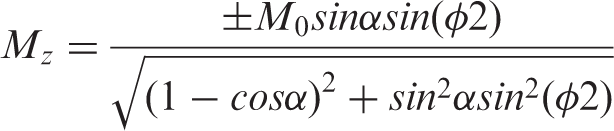
The original CASL method also relied on flow-driven adiabatic inversion of moving blood, but using a true (or near-true) continuous RF pulse. Figure 2(a) shows the typical labeling strategy used for CASL acquisition. The inversion time (TI, also known as the post-label delay or PLD) allows time for labeled blood water to arrive at the slice of interest. As blood water spins approach the labeling plane, they initially are too off-resonance to be affected by the RF pulse, and so experience an effective field that is simply a property of being off-resonance (directed predominantly along z). When closer to the labeling plane, the off-resonance approaches zero, and the spins experiences a progressively ‘on-resonance’ radiofrequency field (now predominantly in the x-y plane). Then, as they pass though the labeling plane and move towards the imaging slice, the effective field once more becomes off-resonance and is directed along −z. Under appropriate ‘adiabatic’ conditions, the blood water magnetization vector is ‘locked’ to the effective field, and is tipped from (equilibrium) M
z
= M0 into an inverted M
z
= −M0 state as it pass through the labeling plane.
Schematic of some of the principal flavours of ASL pulse sequence. In each case, the green box shows the region of the label and the blue box shows the region of the control pulse. (a) shows a ‘conventional’ CASL pulse sequence and its accompanying label/control locations. (b) shows a PICORE PASL pulse sequence, in which the control pulse is an off-resonance pulse (not actually location specific). (c) shows an FAIR pulse sequence and labeling figure, in which the label is created with a non-slice-selective inversion pulse, and the control is a slice-selective inversion. Finally, (d) shows the QUIPSS-II PASL sequence, in which a saturation (red box) is added at time TI1 to the labeling region to better control the temporal duration of the bolus of labeled blood.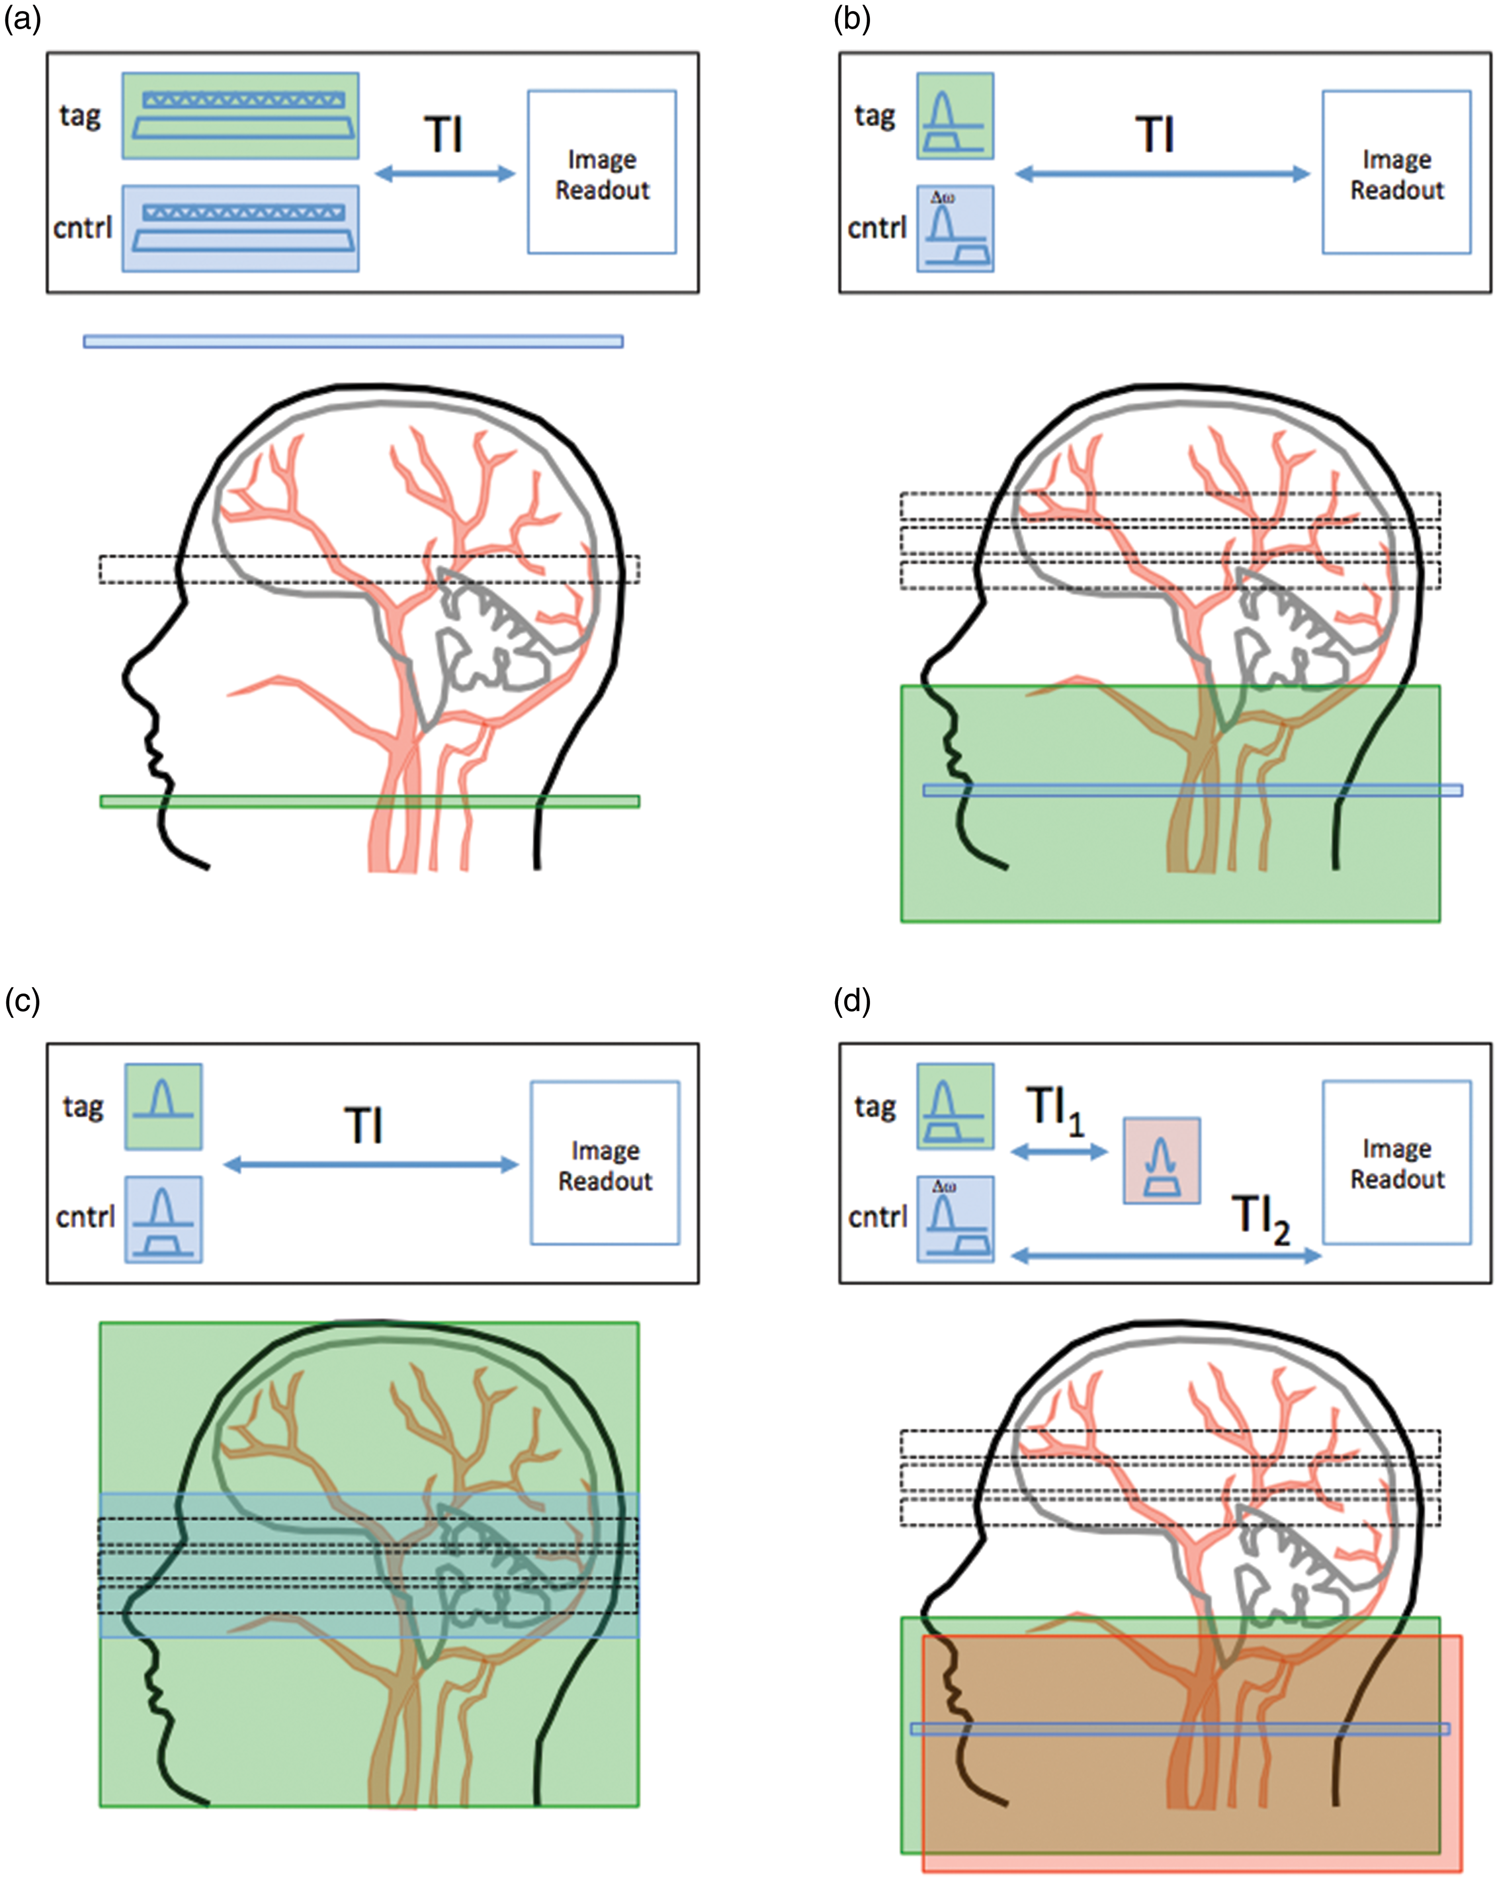
A suitable combination of field gradient and RF field strength can be found that satisfies the required adiabatic conditions, given typical carotid artery blood velocities and NMR relaxation times. Indeed, theoretical and experimental measurements 34 of the labeling efficiency have yielded values of over 90%.
A number of practical obstacles prevent the original CASL method being clinically useful, however. One is that the RF amplifiers of most clinical MRI scanners cannot deliver a continuous RF pulse (even at low power). Another issue is that the conventional CASL method is inherently single-slice, since it is strongly affected by MT effects. To counter this, a control acquisition is needed with an RF pulse played out equidistant but distal to the imaging plane. However, only one slice location satisfies this condition. A solution is to use a separate small labeling coil positioned against the neck,35,36 so that MT effects are not experienced by the imaging slices, although this is cumbersome to implement on a clinical scanner. Another solution is to modify the control pulse by cosine-modulating the ‘continuous’ RF signal, such that a ‘double’ inversion profile is achieved, 27 while ensuring that MT effects are matched to the labeling pulse. The second inversion plane has the effect of un-inverting the spins from the first inversion plane, although labeling efficiency and SNR are lost.
Pulsed arterial spin labeling
The principles of PASL are shown in Figure 2(b) and (c), showing two variants of PASL (PICORE 22 and FAIR 24 ), respectively. PICORE has the advantage of labeling only proximal arterial spins, whereas FAIR labels both proximal and distal spins. Both have potential difficulties with the slab profile being non-ideal, leading to slice-to-slice systematic artifacts.
A further extension to the PICORE method is the QUIPSS II sequence of Wong et al. 37 in which an additional saturation pulse is added a time TI1 after the inversion pulse (see Figure 2(d)). Having the same spatial profile as the inversion, and played out for both the labeling images and the control images, its purpose is to curtail the labeled bolus and provide a well-characterized temporal duration, given by the time TI1. Indeed, provided the time, TI2–TI1 (see Figure 2(d)) is sufficiently long that all labeled blood has been delivered to the tissue (i.e. TI2-TI1>δt, where δt is the arterial transit time (ATT)), a quantitative image of perfusion can be obtained using a single QUIPSS II acquisition.
Additional pulse sequence considerations
A variety of image readout strategies have been used, with a preference for ‘snap-shot’ methods that acquire the data rapidly, and allow some signal-averaging to be adopted. Echo planar imaging 38 (EPI) has been widely used, with its well-known advantages (speed, SNR) and disadvantages (geometric distortion). One issue that must be borne in mind with multi-slice approaches is that the effective post-labeling delay varies for different slice positions, and this must be accounted for in the analysis. Snap-shot 3D acquisitions39,40,41 overcome this issue, although slice coverage and image resolution are limited using such methods. Segmenting the readout across different acquisition can help to provide more coverage, although is more prone to artifacts from subject motion, but is the optimal solution advocated in the ISMRM/EU consensus paper. 29
ASL is an inherently low SNR method, since the accumulation of labeled magnetization due to the delivery of tagged blood is small compared to the static tissue magnetization. One particularly helpful strategy to improve sensitivity is to use background suppression of static spins. In theory, the signal from static tissue should subtract when taking the difference between the control and the labeled images. However, any mis-registration or physiological noise present in the raw data can risk swamping the ASL signal. For this reason, it is desirable to null the static signal, without affecting the blood signal. This can be accomplished using additional, strategically placed, global inversion pulses,42–44 known as the ASSIST method. ASSIST saturates the magnetization in the imaging plane at the time of the initial label inversion, and then includes subsequent non-selective inversion pulses during the inversion delay period that are timed to ensure the static tissue is passing close to its signal null point at the time of image acquisition. An additional advantage of including the initial spatial saturation of the imaging slices is that any direct excitation effects of the labeling inversion pulse on the imaging slices is minimized. The ASSIST method is particularly useful for 3D acquisitions, where a single readout excitation pulse is used, but is also useful in 2D multi-slice acquisitions and for segmented acquisitions.
A problem common to all ASL methods is their sensitivity to motion due to the subtraction of label and control images. Motion-induced static tissue signal changes cause imperfect subtraction and result in artefact appearing in the perfusion maps. Post hoc motion correction can be helpful, although intra-volume motion will still result in residual artifacts. Efficient background suppression, such as ASSIST, reduces static tissue signal and therefore motion artifacts, although some residual tissue signal is useful for post hoc motion correction. Prospective motion correction techniques using navigators to estimate and correct for subject motion show some promise.45,46 In addition, there are a number of approaches for identifying problematic raw data, allowing its filtering or rejection.47–50
Advanced labeling schemes
Following description of the main variants on the ASL theme, some additional ‘flavours’ deserve mention, with further advances described recently in a related review. 51
Multi-delay and time-encoded preparations
Conventional ASL protocols acquire multiple label and control images at a fixed delay after labeling, which are then averaged in post-processing. In order for the subtraction images to have signal intensity proportional to tissue perfusion, all labeled blood must reach the tissue prior to image acquisition. 52 However, the ATT for blood arrival is not known a priori and may be prolonged in patients with vascular disease. Use of a very long delay mitigates this problem to some degree, 53 but also degrades image quality due to the increased T1 decay of the labeled blood, and hence poorer SNR.
An alternative approach is to acquire images at a range of different delays, allowing visualization of the dynamics of blood flow into the tissue. A kinetic model can be fitted to the data to estimate ATT and perfusion (see below) without the assumption that all labeled blood has reached the tissue at a particular delay time. Although the number of signal averages at any particular delay time is reduced in this approach, all of the information across delays can be pooled during the model fitting process to enable accurate perfusion estimates to be derived. Also, the necessity to sample only at long delay can be dropped, allowing the signal to be sampled closer to its peak intensity, which can increase SNR efficiency. However, the post-processing required for multi-delay approaches is considerably more complex than single-delay methods. At present, the approach recommended in the ISMRM/EU consensus paper 29 is to use a fixed delay of 2000 ms, unless there is reason to measure the ATT.
If ATT is desired, there are various strategies for multi-delay ASL, as shown in Figure 3. The simplest involves the separate acquisition of label and control images at different delay times.
52
An alternative approach
54
utilizes a readout scheme in which labeled blood is imaged at multiple time points following a single label pulse,55,56 generating images at different effective delays. However, the reduced readout flip angle also reduces the SNR and the number of slices achievable is limited by the desired temporal resolution, restricting spatial coverage.
Multi-delay ASL strategies: in order to sample the dynamics of labeled blood flowing into the tissue to allow for arrival time estimation and kinetic model fitting, multiple label and control images can be acquired with different post-labeling delays (top). Alternatively, a Look-Locker strategy can be employed consisting of multiple low-flip angle readouts following each label or control preparation to sample the blood signal at different times after labeling (middle). In time-encoded CASL or PCASL, the labeling period is split up into a series of blocks. If these blocks are alternated between label and control states in different ways across different imaging cycles according to a Hadamard encoding matrix, then the perfusion signal arising from each of these separate labeling blocks can be ‘decoded’ in post-processing, yielding multiple images with different effective post-labeling delays (bottom). (Figure originally published in ‘Introduction to Perfusion Quantification using Arterial Spin Labeling’ by Michael Chappell, Bradley MacIntosh and Thomas Okell, Oxford University Press, and reproduced with permission).
Another promising technique is time-encoded (‘Hadamard-encoded’) ASL.57–60 Here the ASL labeling period is split into a series of blocks prior to image acquisition. These blocks are alternated between label and control states in different combinations across a series of imaging cycles according to a Hadamard encoding matrix. The perfusion signal arising from each individual block can be calculated in post-processing using a matrix inversion, yielding a series of images at different effective delay times. In this way N perfusion images can be derived from N + 1 measurements, rather than the 2N required by standard multi-delay protocols. Additionally, the combination of signals across all imaging cycles results in improved noise averaging, although the perfusion signal arising from each block is generally reduced due to the shortened effective labeling duration. This can be partially compensated for by using variable block durations which trade off temporal resolution for improved signal strength. 60
vsASL
A potential problem with the ‘standard’ forms of ASL described above is that if blood flow is severely delayed, or if there is significant collateral flow, the label may have decayed by T1 processes before it arrives at the imaging plane, and hence a perfusion absence may be concluded despite there actually being perfusion present. An intriguing alternative form of label preparation that may help address this deficiency, albeit a method that is still under development, is the concept of velocity-selective ASL. 61 The idea is to label spins on the basis of their velocity profile, rather than their spatial position. In the original vsASL sequence, spins above a critical velocity, vc, are labeled. Then, during the subsequent readout, spins above vc are crushed. The goal is to target spins that decelerate from above vc to below vc in a velocity regime that corresponds to small arteries and arterioles. It is assumed that these would be physically close to their destination capillary bed, and would therefore have a small ATT from label location to image slice (indeed, they could be within the destination imaging voxel when they are labeled). So far, however, vsASL has not been widely adopted, for a variety of reasons. These include an SNR penalty since the method is based on saturation rather than inversion of spins (although approaches to improve SNR have recently been proposed62,63); also not all blood spins can be labeled (only those moving predominantly along the gradient direction of the velocity-selective preparation module); and the method can be confounded by diffusion and eddy current effects, making quantification challenging.64,65 The preparation module can even be made more sophisticated by directly labeling spins on the basis of acceleration (deceleration), so-called accASL. 66
Vessel-selective labeling
While the techniques described above provide vital information on total blood flow to a given region, the relative contributions from different feeding arteries cannot be known. Normal-appearing perfusion could be the result of efficient collateral flow, masking the presence of underlying vascular disease. Variation in vascular territories across subjects can also lead to incorrect assignment of an infarct to a particular feeding artery. 67 The ability to separately image flow arising from different feeding arteries can help avoid these problems as well as improve kinetic model fitting in regions of mixed blood supply. 68 Additionally, knowledge of the arterial supply to lesions such as tumors or arteriovenous malformations can help in treatment planning. 69 Below, some of the different methods for obtaining vessel-selective information with ASL are explored.
Single artery selective methods
Early vessel-selective methods relied on restricting the region over which inversion of the blood water was achieved, either using a transmit coil to produce a limited excitation field,70–72 or by using appropriately orientated labeling slabs.73–76 These approaches allowed some vessel-selectivity, but accurate targeting was limited by the coil geometry and/or vascular anatomy. Repeated pencil beam 2D RF pulses to target specific arteries was also proposed, 77 although this has difficulties with achieving a well-defined bolus of labeled blood, and may partially label other arteries. Methods that continuously rotate the labeling plane can induce adiabatic inversion at a single point in space, with reduction in inversion efficiency away from this point,78,79 thus providing the ability to target individual vessels.
Similar selective excitation approaches are possible using pCASL, where gradient blips (orthogonal to the main labeling gradient) are applied between consecutive RF pulses.80,81 The blip direction is either rotated within the transverse plane80,81 or is pseudo-randomized. 81 This leads to efficient labeling at only one location, whereas at other locations there is a phase mismatch, resulting in low labeling efficiency. In the control condition, the RF phase is further modulated by 180° every other RF pulse. These techniques avoid the difficulties of the CASL techniques, but partial labeling of nearby arteries may sometimes lead to ambiguity in the source of the blood signal.80–83 Reduction in the size of the labeling ‘spot’ by increasing the gradient blips can improve the vessel-selectivity, but is accompanied by a reduction in labeling efficiency. 81
Single-artery selective methods have the advantage of being relatively straightforward to prescribe and post-process. However, 2N images must be acquired (label and control) to encode N arteries, but with only two images being used to calculate the signal from any given artery. Compared to non-selective ASL, where all 2N images contribute signal from that artery, the SNR efficiency is therefore substantially reduced.83,84
Vessel-encoded methods
In vessel-encoded ASL, multiple arteries are labeled in different combinations across different images (Figure 4), and the contribution of each artery to the resulting signal is ‘decoded’ in post-processing. Labeling subsets of arteries can be achieved using a PASL labeling slab84,85 or by using a modified selective pCASL approach with an elliptical labeling spot.
86
Alternatively, transverse gradient blips can be applied between pCASL RF pulses in a consistent direction,
87
which creates a periodic modulation in inversion efficiency along the specified axis. It is this latter method that has been the focus of most development and perhaps offers the greatest potential for clinical deployment.
Schematic of vessel-selective ASL for labeling the four main brain-feeding arteries: vessel-selectivity can be achieved by targeting individual arteries of interest, using a labeling slab or spot, before moving on to the next artery to build up individual maps of the vascular territories by simple subtraction of label and control images (top). Alternatively, different combinations of vessels can be labeled or controlled across multiple imaging cycles, uniquely encoding the signal from each artery that can then be decoded in post-processing (bottom). Although more complex to process, the vessel-encoded approach results in perfusion signal from all arteries across all cycles, boosting SNR when the images are combined.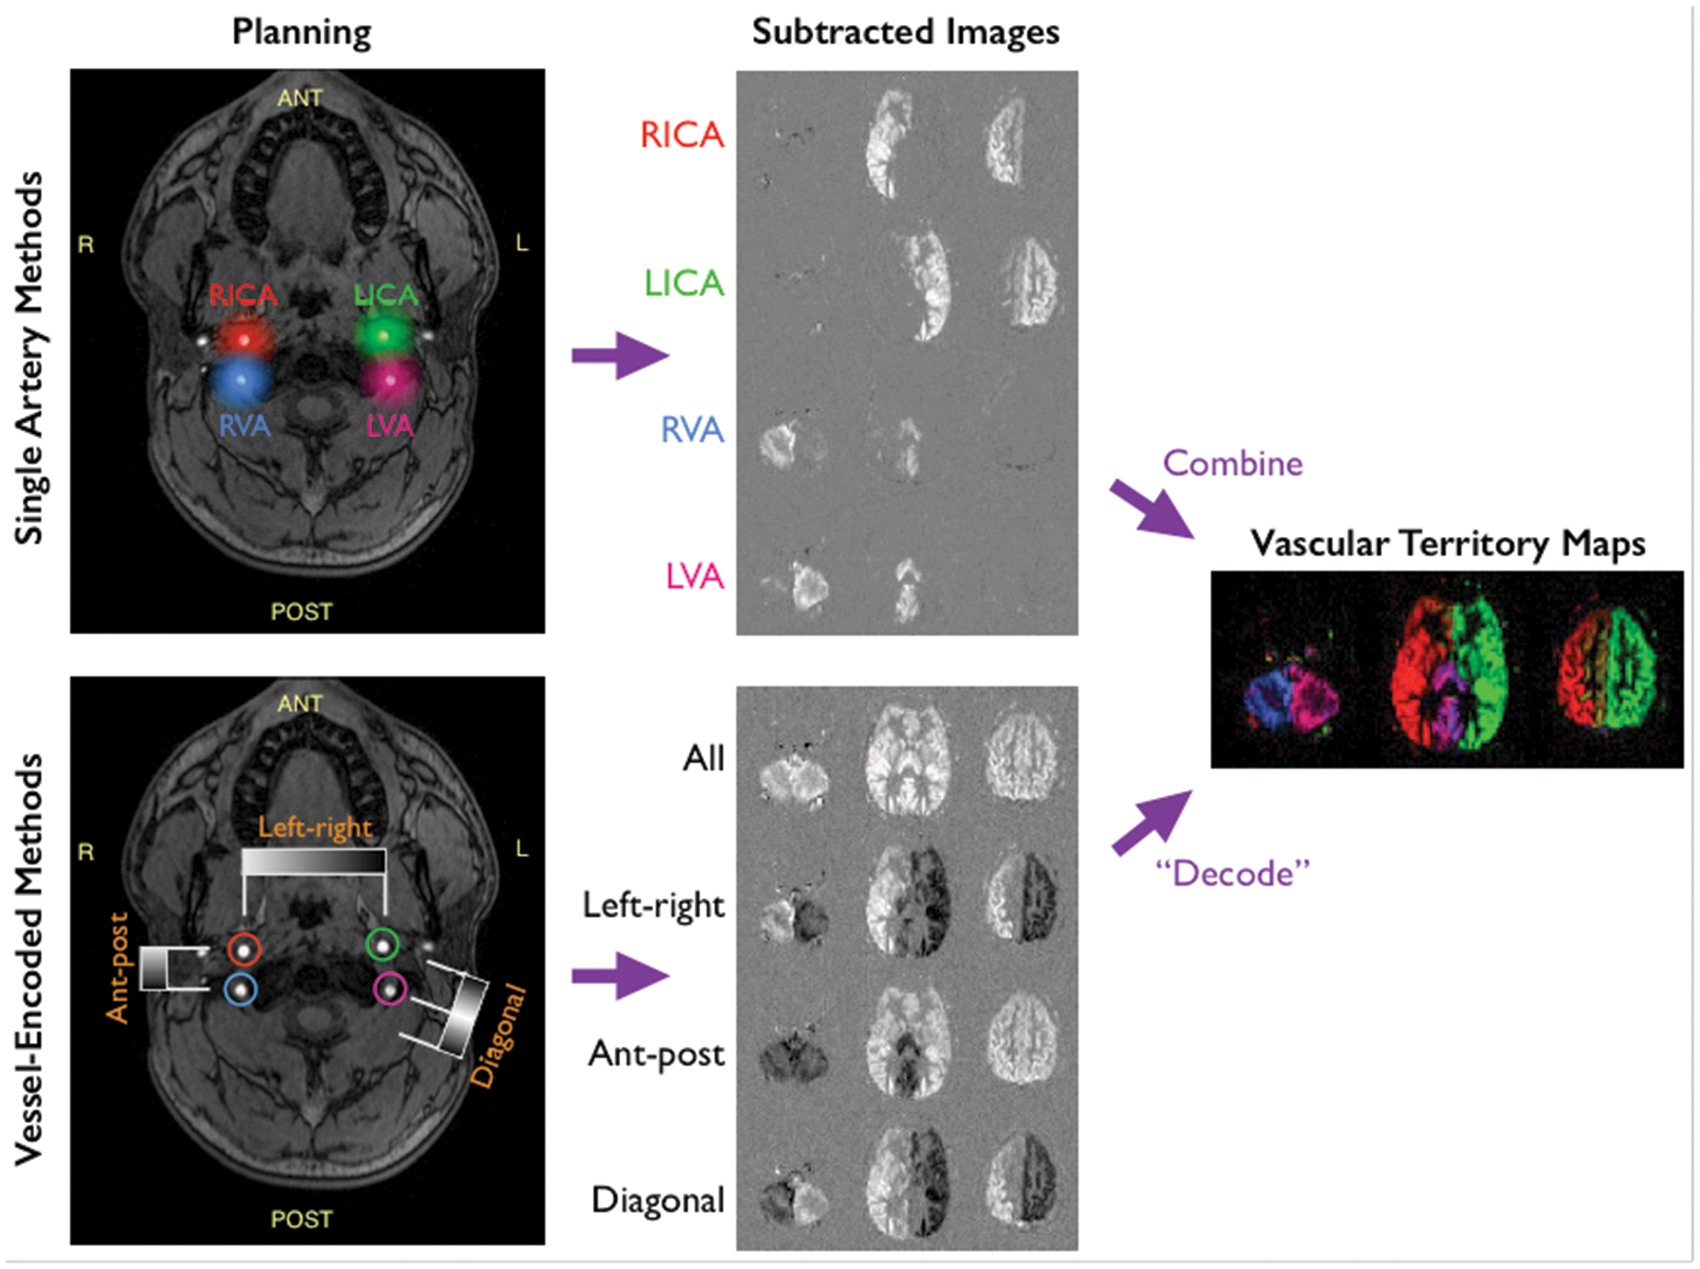
Using a limited number of encoding steps and a simple series of additions and subtractions85,86 or clustering methods,88,89 it is possible to isolate the signals from different feeding arteries. However, these simple approaches implicitly assume that voxels do not receive blood supply from multiple feeding arteries, limiting their use in clinical scenarios where overlapping vascular territories may be present.
If the number of encodings equals or exceeds the number of arteries (plus static tissue) then the separate arterial signals can be recovered by constructing an encoding matrix, then taking the (pseudo)inverse, and applying it to the acquired images.87,90,91 With this approach, if the encoding matrix corresponds to a Hadamard-type encoding, then the SNR efficiency is equivalent to conventional ASL, even allowing for overlapping vascular territories.84,87 This has been demonstrated experimentally, showing equivalence of CBF estimation 68 and negligible labeling of nearby arteries, 92 giving this method a considerable advantage over single-artery selective techniques where multiple arteries are of interest.
Nevertheless, to be successful, all vessels within the labeling plane must be encoded, making irregular arrangements or large numbers of arteries more challenging. One solution is to use many ‘random’ encodings.
93
This avoids the need for careful planning, although large numbers of encodings may not be feasible for angiographic applications and SNR efficiency is expected to fall by a factor of
Kinetic modeling
Perfusion quantification relies on a description of labeled blood water delivery to the voxel, and traditionally this has been based on the theory of tracer kinetics. The most general description of the kinetic model for ASL data was provided by Buxton et al.,
52
building on the previous modified Bloch equation formalism introduced by Williams et al.
18
Following the principles taken originally by Kety and Schmidt,
95
they described the signal arising from labeled water within a voxel as the convolution of an AIF and a residue function
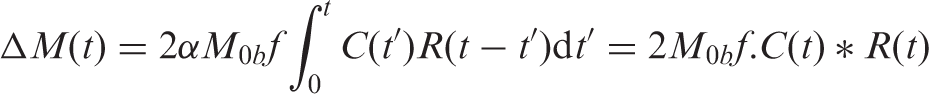
AIF
It is normally assumed that the ASL labeling process creates a well-defined bolus of labeled blood water in the labeling region. This travels to the brain accumulating a delay: the ‘ATT’, during which the label decays with the T1 of the blood. This gives rise to the major difference between pCASL and PASL labeling as seen in Figure 5, the overall effect being that a higher signal is theoretically possible from pCASL due to the availability of a larger total inverted magnetization that can be delivered. Additionally, dependent upon the acquisition, the AIF bolus duration may be unknown a priori for PASL, motivating the QUIPSS-based modifications discussed above.
Example time series plots from the ‘standard’ model for ASL kinetics comparing PASL and pCASL. Unless otherwise specified arterial transit time (Δt) = 0.7 seconds (PASL) or 0.9 s (pCASL), T1 = 1.65 s, bolus duration = 0.8 s (PASL), 1.8 s (pCASL) following Alsop et al.
29
The plots show arterial input functions with varying arterial transit time (a,b), residue function for varying T1 (c), voxel magnetization for varying arterial transit time (d,e) and varying T1 (f,g).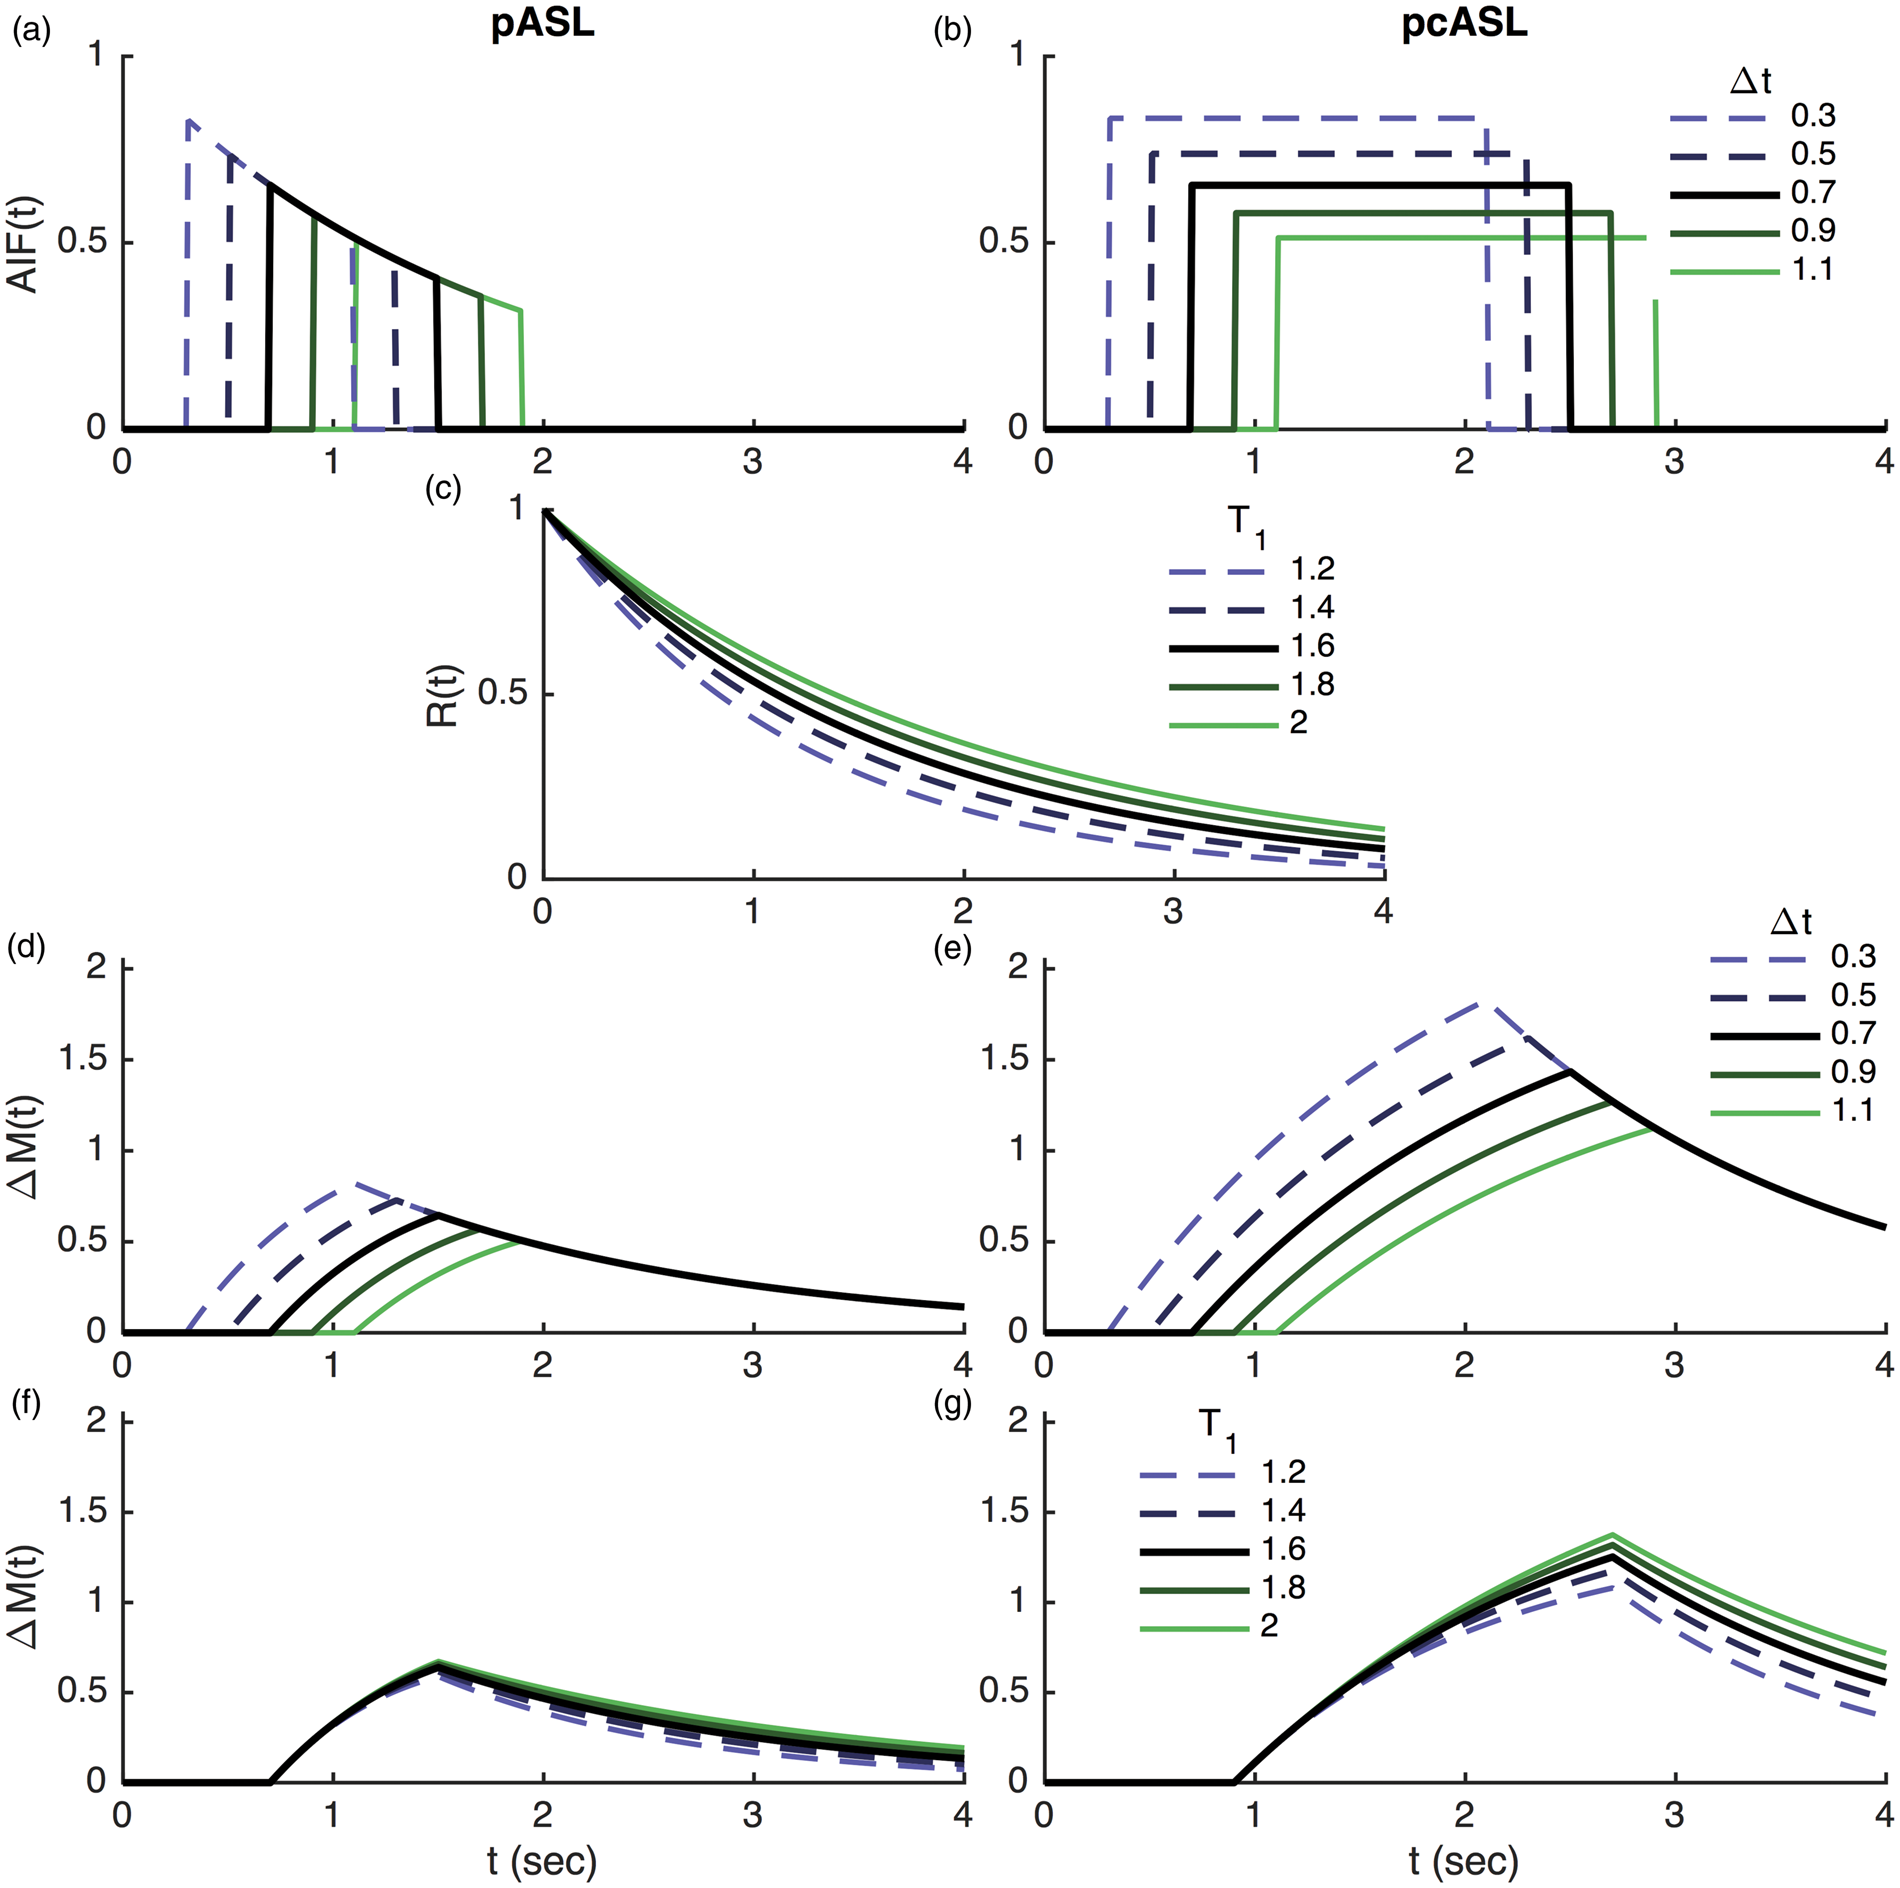
Residue function
The residue function describes what happens to the labeled blood water once it has arrived in the voxel: for a unit of labelled water spins, it specifies the quantity that remains. Thus, it starts at unity at time zero and decreases monotonically thereafter, reflecting the fact that label is gradually being lost. The dominant process that reduces the label is further T1 decay of the inverted spins. The residue function may be separated into two components: R(t) = m(t).r(t). Where m(t) represents the T1 decay and r(t) captures other physical effects such a clearance of label into the venous vasculature.
The simple model
The simplest model for the quantification of ASL perfusion, as advocated in the consensus paper by the ISMRM Perfusion Study Group and the European Consortium for ASL in Dementia, 29 assumes that all label arriving in the voxel remains there. This presumes that the majority of labeled blood water exchanges rapidly from the blood compartment into tissue, and clearance of label directly through the vasculature or via back-exchange from tissue to blood is negligible. The simple model also assumes that the T1 decay of label in tissue and arterial blood is the same.
The standard model
Earlier ASL kinetic models53,96 made fewer simplifying assumptions, as captured in the work of Buxton et al. 52 In this ‘standard’, model a different (lower) T1 of tissue relative to blood was assumed, and clearance of labeled blood water to the venous circulation occurred at a rate determined by the perfusion and the equilibrium tissue/blood partition coefficient.
Dispersion
As noted by Buxton et al., 52 the complete delivery of blood to the voxel may occur with a range of ATTs, causing smoothing of the AIF. This could arise from the flow profile within the arteries and the effect of label arriving via different vascular paths, the overall effect being described as dispersion. A number of models have been proposed to account for dispersion effects, including use of a vascular transport function,97,98 or by modeling dispersion from an assumed flow profile and vascular geometry.99,100 These refinements are, however, rarely used in the process of quantification.
Exchange
A central assumption of the standard models is that labeled water remains almost entirely in the voxel, treating the voxel as a single well-mixed compartment. In practice, this assumes high permeability of the vascular walls to water so that the labeled water exchanges into tissue where it will remain for the duration of the volume acquisition. Various models have been proposed that include an exchange process via two compartments separating capillary blood and extravascular space.101–103 However, hindrances to water exchange are not readily observable from ASL data since effects rely on T1 differences between blood and tissue, which are not sufficiently large. A number of techniques have been explored that attempt to enhance the effect, allowing permeability to be measured, for example by using diffusion weighting (akin to flow suppression)104,105 or via T2 measurements.106–108
Macrovascular component
While possible to mitigate contamination from labeled blood water within large arteries through application of flow-crushing gradients during the readout, 109 the additional gradients necessitate longer echo times, thus reducing SNR, and only magnetisation flowing in the same direction as the crusher gradients is dephased, potentially leaving significant macrovascular signal. 110 An alternative is to incorporate macrovascular effects into the model. A separate component can be included that follows the form of the AIF, scaled by the arterial blood volume, to represent signals arising from the macrovasculature. This has been used to separate the macrovascular contribution in multi-delay PASL data, 110 where a residual macrovascular component was observed even after readout-based flow suppression. In practice, the macrovascular component will exhibit dispersion, whose effect is more noticeable than dispersion effects in the tissue signal. 98 This has been exploited to measure the local AIF by using a combination of flow-suppressed and non-suppressed data. 56
Model inversion
The simple model affords an analytical relationship between ASL difference signal and perfusion that can be inverted for single post-label delay perfusion quantification. 29 Multi-delay data allow measurement and correction for the ATT by fitting a kinetic model to the data, for example using non-linear fitting methods. Bayesian model inversion has also been proposed, that permits incorporation of prior information about the model parameters, improving robustness in the face of the low SNR commonly seen with ASL.111,112 Alternatively, a ‘model-free’ deconvolution analysis can be used for ASL data (similar to that used in DSC perfusion MRI analysis) if separate information about the AIF can be obtained. 56 Comparisons with model-based analyses56,113 suggest that, as in other perfusion modalities, the ‘model-free’ methods tend to underestimate perfusion. 114
Quantification and calibration
The attraction of ASL is that it is theoretically a quantitative method, yielding values in accepted units (ml blood/100 g tissue/min, although strictly speaking the units measured are ml blood/100 ml tissue/min – a conversion to standard accepted units can be made if a value for tissue density is used). To obtain truly quantitative numbers there are, however, some caveats. One is that the inversion efficiency must either be assumed, or must be calibrated.115,116 In practice the value is not measured in individual subjects, but rather a sensible estimate is used. Theory and experiments have shown that values of 85%–98% can be used, depending on the ASL technique. 29
Another factor in quantification is the need to reference the signal differences measured in the ASL experiment to a normalization factor. Ideally, this normalization should be against a voxel of fully relaxed blood, but this is not practically possible. Some studies have advocated a CSF-filled voxel for normalization, although this approach requires further correction for the bias field of the receive RF coil(s) and factors to account for differences in the T2 and proton density between blood and CSF. As such, an expedient strategy is to simply use a proton-density image, slightly blurred to account for possible mis-registration. This consists of an image acquired under full T1 relaxation conditions (long TR) and minimal T2 weighting (minimum TE), having the benefit of accounting for the receive coil bias, and also ensuring that the reference image is well registered to the ASL data if the same readout sequence is used. However, care should be taken to minimize noise propagation and edge/partial volume effects. A correction should also be made to account for the brain–blood partition coefficient of water (along with a caution that its value may not be truly constant across the brain).
In addition to determining the factors directly appearing in the equation relating the ASL signal to tissue perfusion (see above), there are a number of other artifacts and physiological effects that can hamper accurate quantification. Magnetic field inhomogeneity induces signal dropout and distortion or blurring artifacts in many commonly used readout schemes, leading to loss or mis-localization of the perfusion signal. Shorter echo times and spin-echo readout can reduce signal dropout, although more robust readout methods may be necessary to improve image quality at higher field.117,118 Static field inhomogeneity can also be problematic for pCASL labeling, since it relies on particular increments in the phase of the magnetization between RF pulses. A number of approaches have been proposed to counter such effects, including measurement of the ASL signal at a range of RF phase increments 32 or by using pre-scans to estimate and correct for field offsets at the labeling plane.33,119,120
Attempts to validate the quantitative capability of ASL against the accepted gold standard of 15-oxygen PET have shown a good agreement, especially when the interval between ASL and PET measurements is minimized. 121 However, some biases have been observed between different acquisition approaches, with the recommended approach of pCASL often showing an over-estimation of perfusion relative to PET. The recent availability of combined PET-MR scanners will hopefully allow more direct validations in patients to be made.
Partial volume effects
The central assumption of perfusion quantification using ASL is that we are measuring the delivery of blood to the capillary bed and thus a property of the tissue. It is also assumed that the tissue within a voxel can be treated as a single homogenous unit for which it is valid to quote a single perfusion value. Where a voxel contains a mixture of tissues with different perfusion properties, the measured value will be a weighted mean of those contributions. This is particularly common in the brain where voxels are likely to contain a mixture of grey matter, white matter and cerebrospinal fluid (CSF). CSF should contribute no ASL perfusion signal, and white matter has substantially lower perfusion than grey matter. Additionally, the longer ATTs observed in white matter may further lower the signal from white matter.
This has important implications when quoting mean grey matter perfusion values, as is common in the literature. The resolution of typical ASL data (∼3 mm voxel dimensions) makes it almost impossible to find voxels with 100% grey matter in the perfusion image. Thus, a grey matter mask must be defined at a much lower threshold, including partial voluming with both WM and CSF in the final calculation, potentially explaining why quoted GM perfusion values from large studies 122 are in the range 30–40 ml/100 g/min despite the accepted value of GM perfusion being closer to 60 ml/100 g/min.
Several approaches have been proposed to correct for partial volume effects using independently derived estimates of the different tissues. The simplest approaches fix the ratio of GM to WM perfusion,
123
albeit unlikely to be constant everywhere in the healthy brain, let alone in disease. An alternative method used a linear regression-based approach that simultaneously estimates the GM and WM perfusion contributions in a voxel using information from local groups of voxels within a spatial region of predefined size.
124
A disadvantage of this approach is the degree of spatial smoothing introduced into the final perfusion images. Further refinements have been introduced to increase the robustness and limit spatial smoothing.
125
Additionally, spatial priors within a Bayesian model fitting method have been exploited to achieve partial volume correction in multi-delay ASL data
126
showing better preservation of detail than linear regression methods. Figure 6 illustrates the result of various correction methods.
Partial volume effects in ASL and methods for correction illustrated in simulated data created using PV estimates from structural data in an individual and different spatial distributions (a–c) of GM CBF (‘True’). ‘Standard’ refers to the estimated CBF map using standard quantifications, Spatial PV refers to the spatial method of Chappell et al.
126
and LR corresponds to the linear regression method of Asllani et al.
124
with different kernel sizes. Figure reproduced with permission from Chappell et al.
126
(Figure 2).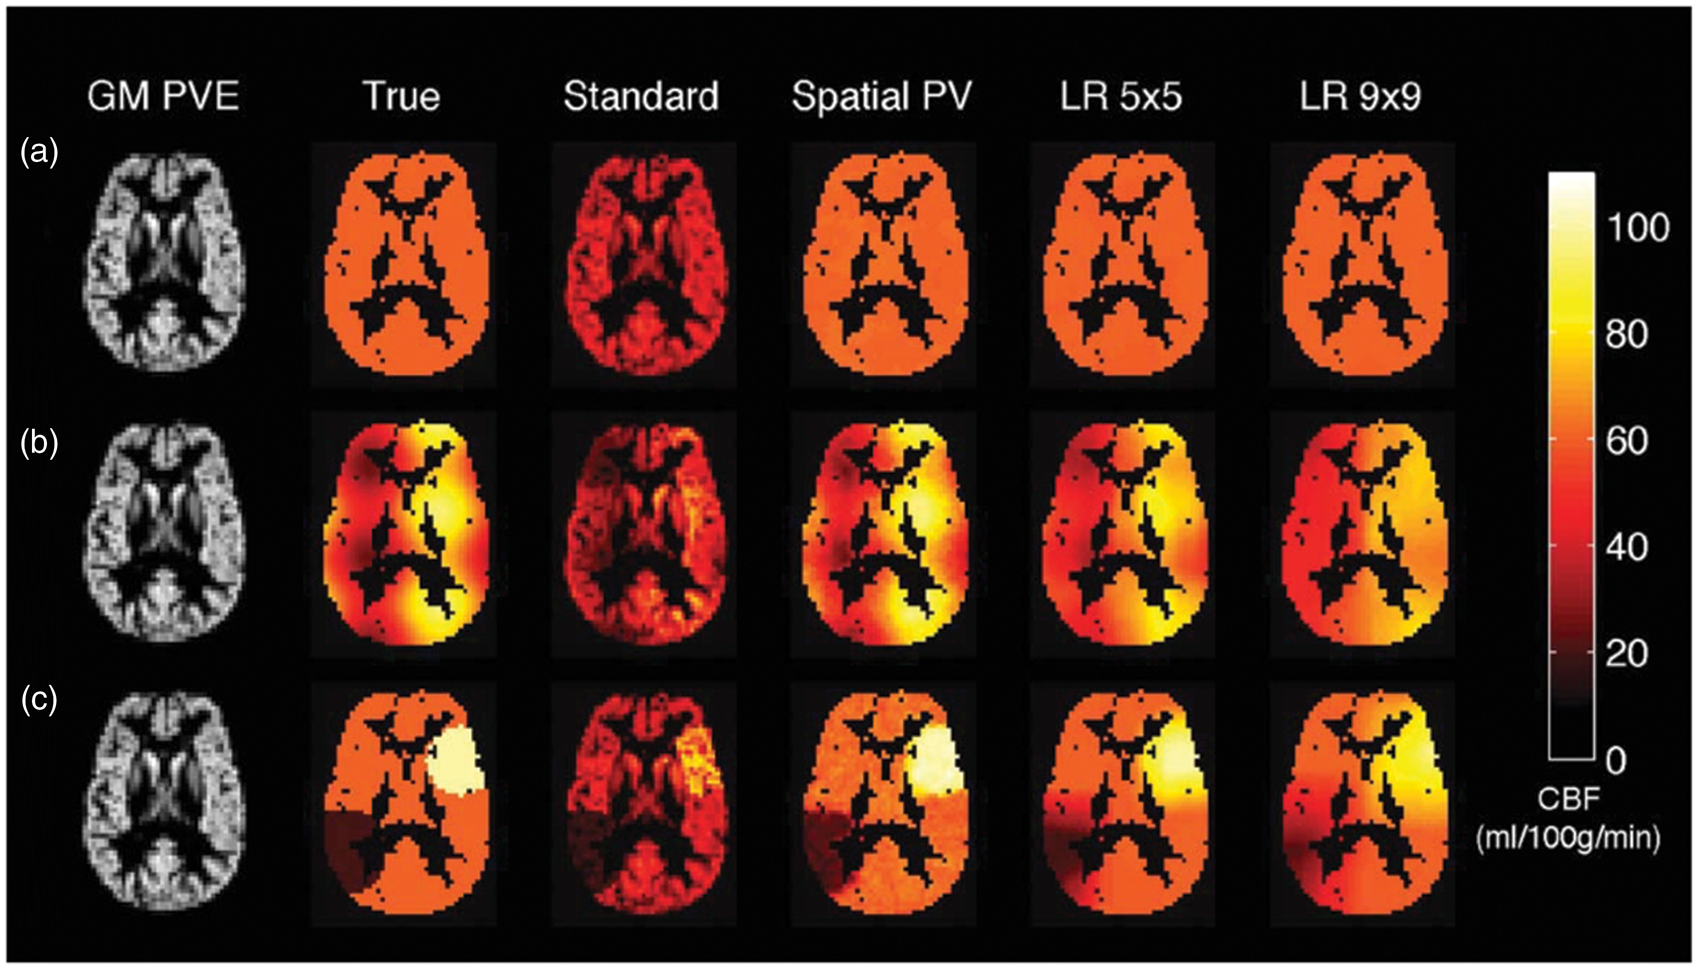
ASL angiography
Rather than using a long post-labeling delay to visualize tissue perfusion, images can also be acquired soon after an ASL preparation, while the labeled blood is still within the arteries, giving angiographic contrast. Indeed, some of the earliest examples of ASL were angiographic.17,127,128 These images give crucial information about the structure and function of the arterial system, such as the presence of stenoses or occlusions, without venous contamination that can be present in contrast-enhanced methods. As with all ASL techniques, static tissue is subtracted out, preventing it from obscuring smaller or lower contrast vessels, and allowing rapid 2D projection acquisitions without overlying tissue signal and partial volume effects. The high concentration of labeled blood within arterial voxels, and the minimal time delay between labeling and imaging, has the result that the SNR of ASL angiography is considerably higher than that of ASL perfusion imaging, important since higher spatial and temporal resolution are required to accurately delineate small vascular structures and dynamics of blood flow that occur within arteries.
Labeling approaches
As with perfusion imaging, any ASL preparation can be used with an angiographic readout, including CASL,
17
PASL127,129,130 and pCASL.
131
Single-artery-selective74,82,132–134 and vessel-encoded92,135 preparations can also be used to produce vessel-selective angiograms similar to invasive X-ray digital subtraction angiography (see Figure 7). Velocity- or acceleration-selective ASL angiograms have also been proposed.136–138 The choice of the optimal labeling scheme depends somewhat on the intended application.
Example transverse maximum intensity projection from a 4D vessel-encoded ASL angiogram with bSSFP readout.
92
Color represents the arterial origin of the blood signal: right/left internal carotid artery (red/green), right/left vertebral artery (blue/magenta).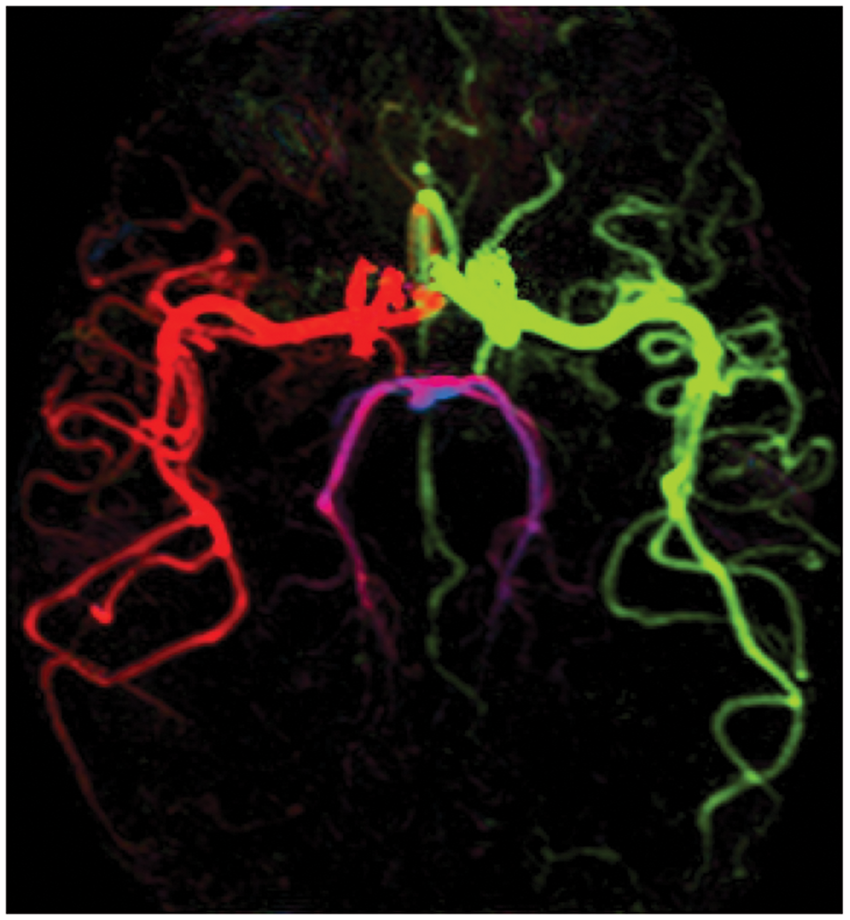
For static angiography, in which a single image of the arterial system is desired, a PASL preparation can be used with the inversion time chosen to allow sufficient delay for labeled blood to enter the imaging region before image acquisition. 127 Alternatively, sufficiently long pCASL labeling 139 or hybrid approaches82,131,140 can be applied to fill the vasculature with labeled blood. Velocity- or acceleration-selective preparations potentially eliminate delayed transit artifacts,136–138 but suffer from reduced SNR and inefficient labeling of blood flowing orthogonally to the applied labeling gradients. 136
Dynamic (time-resolved) angiograms give both anatomical and hemodynamic information that may be of additional clinical benefit,
141
and are shown schematically in Figure 8. One advantage of PASL in this context is the ability to start imaging soon after labeling, such that inflow of the labeled blood can be visualized with a time-resolved readout.129,130,142 In the case of pCASL, the arterial system can be filled with labeled blood prior to image acquisition. However, timing information can still be extracted by observing the outflow of the blood.
135
Indeed, ‘inflow subtraction’ can be used to give the appearance of inflow rather than outflow,92,143,144 or can be simulated after fitting a kinetic model.
145
Another approach relies on varying the labeling duration to build up a series of images showing wash-in of the labeled blood.82,146
Schematic of strategies for dynamic ASL angiography: For PASL (top row), labeling (orange block) occurs quickly, so the addition of a time-resolved readout, in which the same set of k-space lines are repeatedly acquired (green blocks), allows the generation of images showing the inflow of labeled blood. Since only a subset of k-space lines can typically be acquired per ASL preparation, this process is repeated until all lines of k-space have been acquired for both label and control conditions. For CASL or pCASL, one method to obtain temporal resolution is to acquire a single image after labeling the blood, but to vary the label duration (middle row), which in turn varies the distance into the vascular tree that the labeled blood has travelled. Alternatively, a single long label duration can be used followed by a time-resolved readout. In this case, the first image shows the vascular tree filled with labeled blood and subsequent images show washout of the bolus. However, ‘inflow subtraction’, in which each subsequent image is subtracted from the first, results in images showing inflow rather than outflow for a more intuitive visualization. Images are shown in inverted contrast and control cycles are omitted for clarity.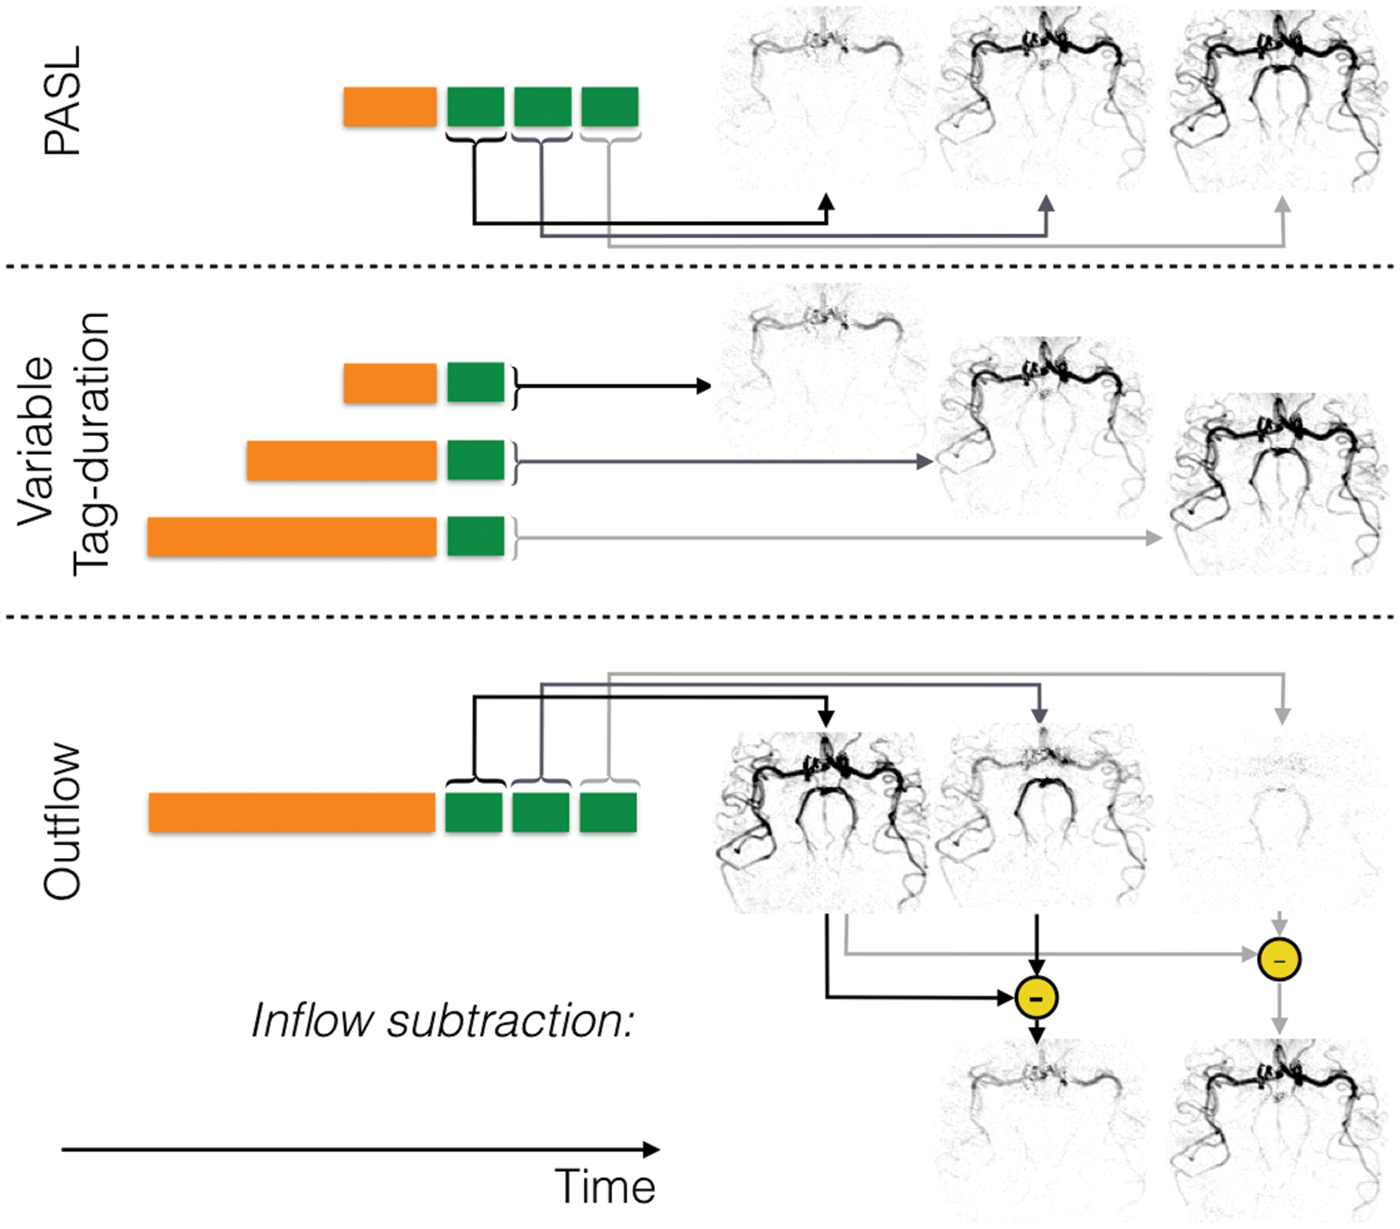
Readouts
In contrast to perfusion imaging, angiographic readouts typically acquire a single line of k-space (i.e. only a subset of the data needed to reconstruct an image) following each excitation pulse to minimize signal loss from flowing spins and to enable higher spatial resolution. Multiple lines of k-space can be acquired after each ASL preparation to reduce scan time, although too wide an acquisition window risks significant motion of the bolus of labeled blood during imaging, resulting in artifact. Staggered acquisition of the same lines of k-space after each ASL preparation allows time-resolved images to be reconstructed (see Figure 8).
ASL angiography has been demonstrated with various fast gradient-echo MRI sequences (including balanced steady-state free precession, bSSFP,140,147–150 and spoiled gradient echo, SPGR130,131,133–135,142,144). Of these readout methods, bSSFP is considerably more SNR efficient, since transverse magnetization is recycled from one excitation to the next. 30 However, it suffers from signal loss in regions with poor magnetic field homogeneity,92,151 limiting its use at higher field strengths and over larger fields of view. SPGR does not suffer from these artifacts and may provide more accurate depiction of stenoses, 152 but each excitation pulse destroys some of the remaining ASL signal, limiting the flip angle and TR that can be used and thus its SNR efficiency. The choice of the optimal readout scheme is therefore likely to be application dependent.
Another challenge of time-resolved 3D angiography is its acquisition time due to the high spatial and temporal resolution required. As well as conventional acceleration techniques such as parallel imaging,153,154 the relatively high SNR and sparsity of angiographic images make them suitable for undersampled non-Cartesian trajectories, which have shown excellent image quality and a considerable scan time saving while maintaining high isotropic resolution.131,140,146 Reduced sensitivity to motion artifacts and improved vessel delineation has also been demonstrated in coronary angiography. 155
Modeling and quantification
Despite using an identical preparation, angiographic signal evolution differs considerably from the standard Buxton model (described above). Specifically, blood does not accumulate in the arteries as it does in tissue, so the signal intensity depends mostly on arterial blood volume rather than blood flow. The PASL signal can be described empirically with a gamma function, 141 and a pCASL model that includes the effects of dispersion, T1 decay and attenuation has also been proposed. 145 The model fits provide useful markers of disease but do not provide direct measures of blood flow through the arterial system. However, such estimates may be derived from signals summed across an arterial region of interest, either by comparison with a separately measured AIF 132 or by fitting a kinetic model extrapolated to a very short labeling duration. 156 More work is required in this area to further validate and improve the robustness of such methods.
Applications of ASL
ASL has been deployed as a tool in basic research studies since its earliest days, but its clinical impact has been rather modest, largely due to the delay in its appearance on clinical scanners. Now that ASL is available on clinical scanners, 157 and there are clearer consensus protocols agreed, its use is growing, further prompted by the increasing move away from gadolinium-based contrast agent approaches. 158 Due to its non-invasive nature, ASL offers the benefit over competitor methods of being able to be used in longitudinal assessment of perfusion or vessel status, as well as in patients who are contraindicated for gadolinium-based contrast agents. This makes ASL an attractive candidate for monitoring disease progression or treatment response, since regular non-invasive measurements are possible.
One use of ASL has been in the study of brain function, analogous to blood-oxygenation level-dependent (BOLD) functional MRI. In some circumstances, ASL-based fMRI is preferred over BOLD-based fMRI, despite its poorer SNR, especially for task paradigms longer than a few minutes 159 (e.g. in the study of tonic pain 160 ), or where only minimal task cycling is possible (such as pharmacological studies where only a single transition in neurological state may be possible). The ability of ASL to withstand long or sparse paradigms is due to its subtractive nature, making it insensitive to slow signal drifts that affect BOLD data. Perfusion measurement is also a key component of MRI methods seeking to measure the metabolic rate of oxygen consumption (CMRO2) using hypercapnia or hyperoxia to induce flow or metabolic changes, and can also offer a measure of cerebrovascular reserve in response to a blood flow challenge.161,162
Clinically, ASL has mainly been used in the assessment of cerebrovascular disease. The principal areas have been in stroke,163–165 steno-occlusive disease,166,167 arteriovenous malformation,168,169 and Moyamoya disease.170,171 A number of studies have used ASL in the characterization of dementia (including Alzheimer's disease,172,173 and vascular dementia174,175). In Alzheimer's disease, ASL has shown similar patterns of hypo-perfusion to FDG-PET, suggesting that it can be used in place of PET for metabolic assessment. Differences in perfusion patterns have also been observed between Alzheimer's patients and fronto-temporal dementia.
176
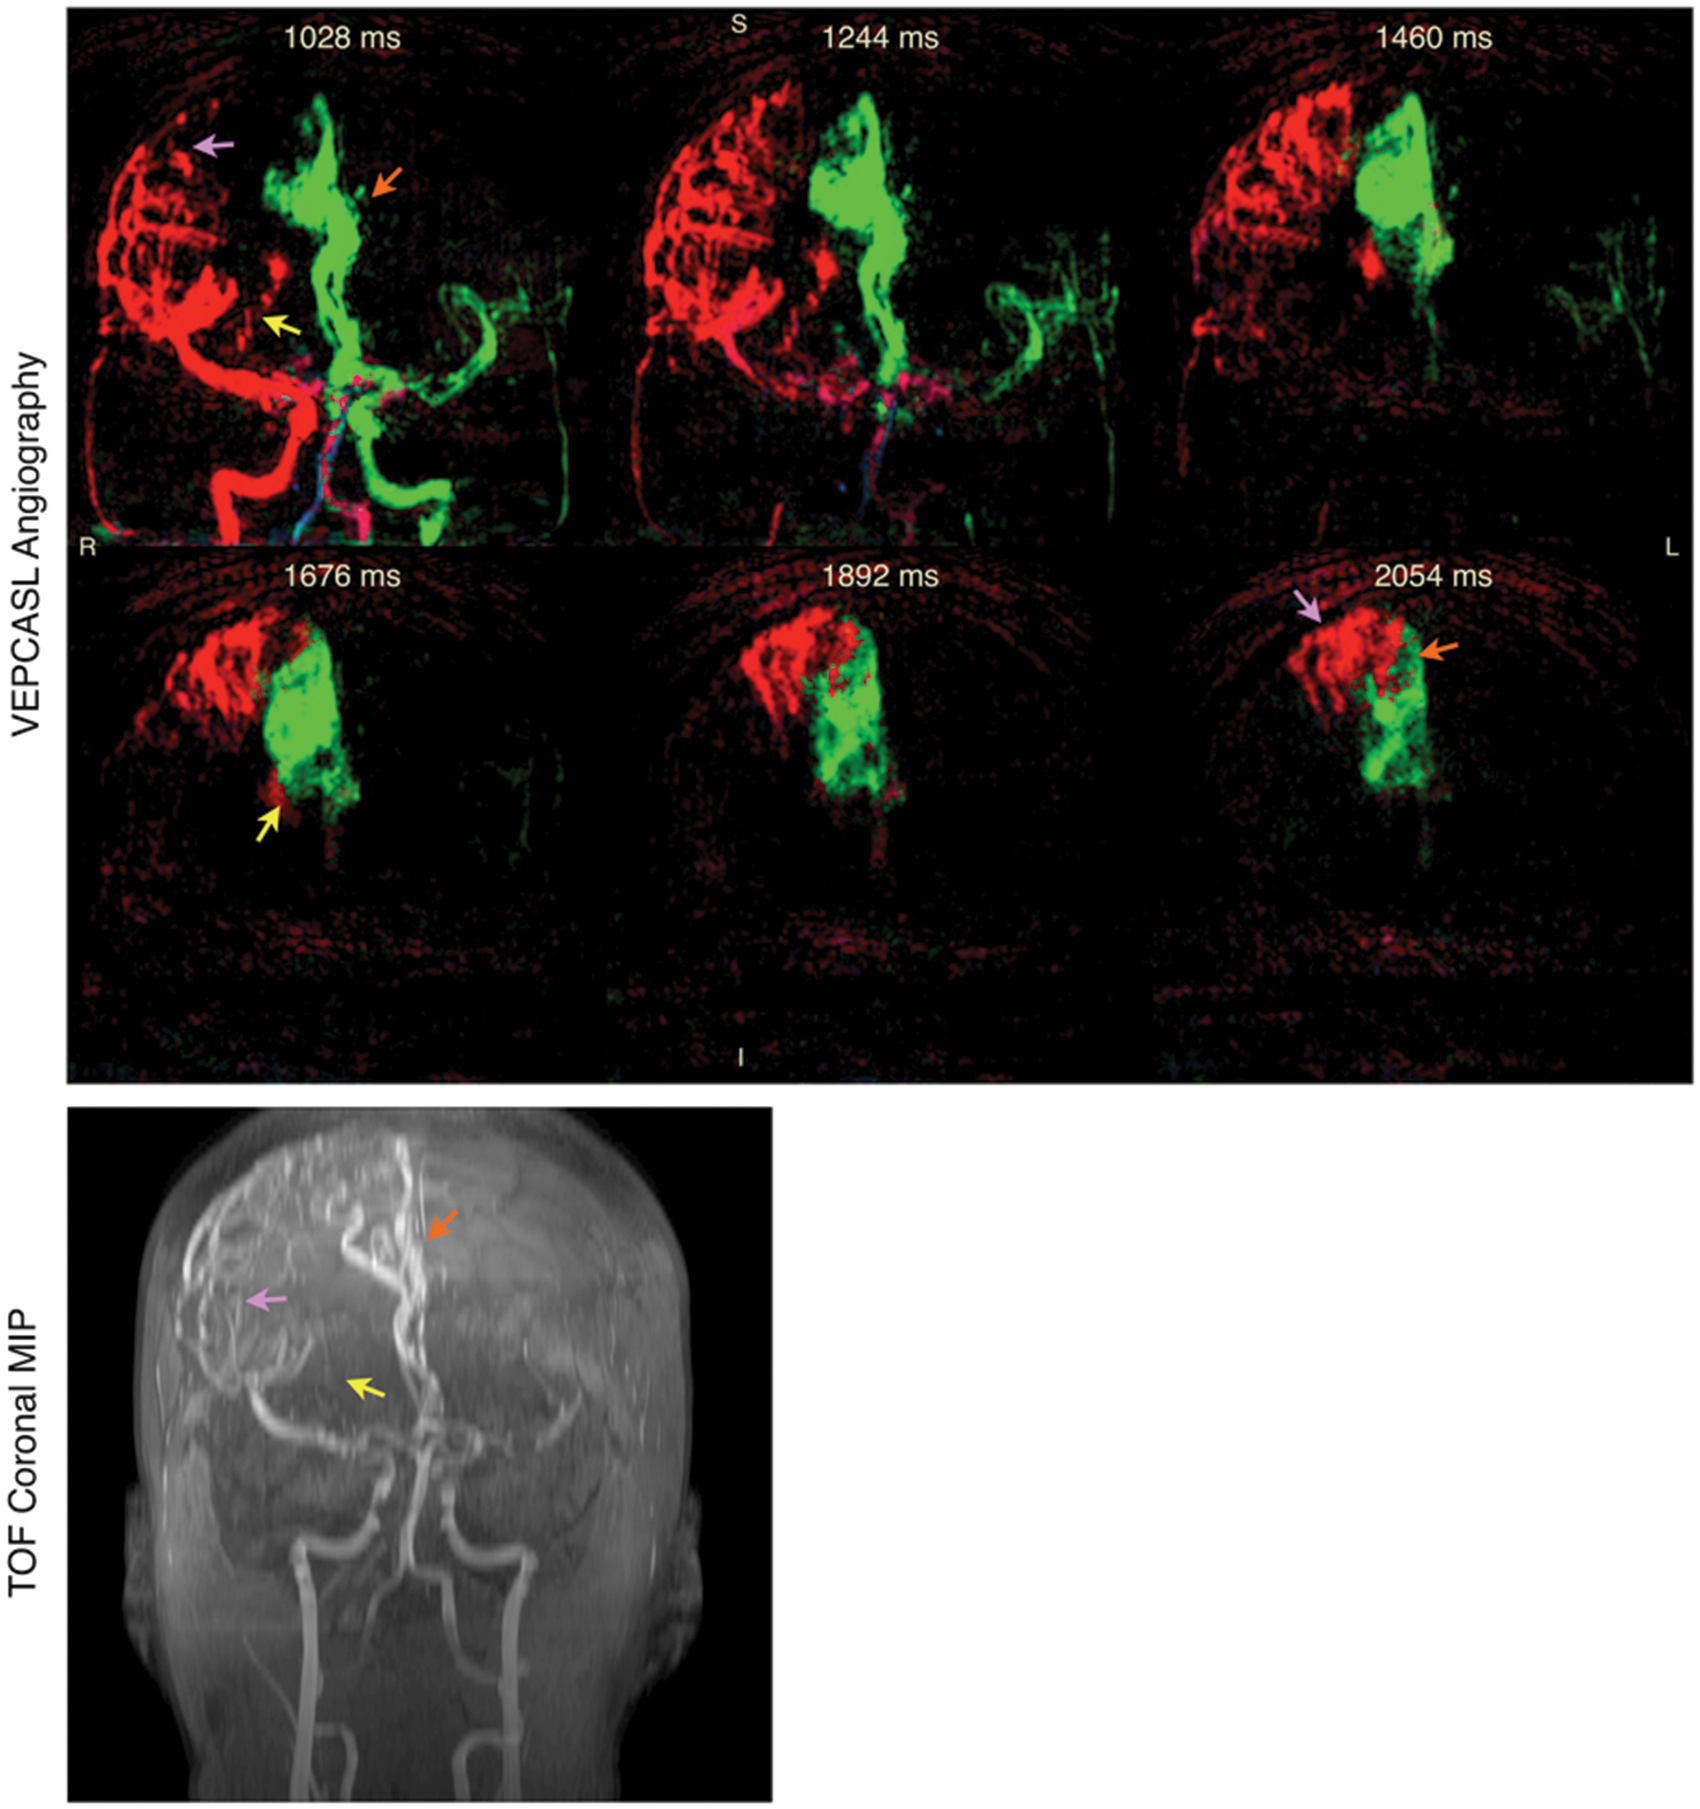
An example of application of ASL to steno-occlusive disease is shown in Figure 9, demonstrating evidence of collateral flow compensating for disrupted blood supply through one of the proximal arteries in a patient suffering from transient ischemic attack. Another example application to cerebrovascular disease is shown in Figure 10, demonstrating ASL's potential in characterization of arteriovenous malformations. In this case, vessel-selective ASL angiography was used to visualize arterial branches supplying the AVM, with relevance to pre-intervention assessment.
Preliminary data showing vessel-encoded pCASL perfusion imaging (top left) and angiography (bottom) in a patient with a history of transient ischaemic attack, alongside time-of-flight angiography data (top right) for comparison. Color represents the arterial origin of the blood signal as per Figure 7, with one example perfusion slice shown separately for each artery in grayscale for clarity. Reduced blood flow is apparent in the left vertebral artery (LVA, orange arrows). Significant collateral flow from the right internal carotid artery (RICA) through the posterior communicating artery to the right posterior cerebral artery is also observed (yellow arrows), and to a lesser extent on the left side (white arrows), perhaps to help compensate for the limited blood supply arising from the LVA. Adapted from Okell.
190
Data were acquired in collaboration with Dr Ursula Schulz. Vessel-encoded pCASL dynamic angiography (top) and a time-of-flight (TOF) angiography maximum intensity projection (MIP, bottom) in a patient with arteriovenous malformation (AVM). Color represents the arterial origin of the blood signal as per Figure 7. Selected frames are shown demonstrating the major feeding vessels to the AVM from both the RICA via lateral (purple arrows) and medial (yellow arrows) branches of the right middle cerebral artery, and the LICA via the anterior cerebral arteries (orange arrows). The times shown are relative to the start of the VEPCASL labeling. Similar features can be observed in the TOF MIP, although some vessels are obscured due to overlying static tissue that is subtracted away in the VEPCASL data. Further work is required to separate the blood signals arising from smaller arterial branches, as has been demonstrated with super-selective ASL techniques,
169
and to better visualize venous drainage. Adapted from Okell.
190
Data were acquired in collaboration with Dr Natalie Voets.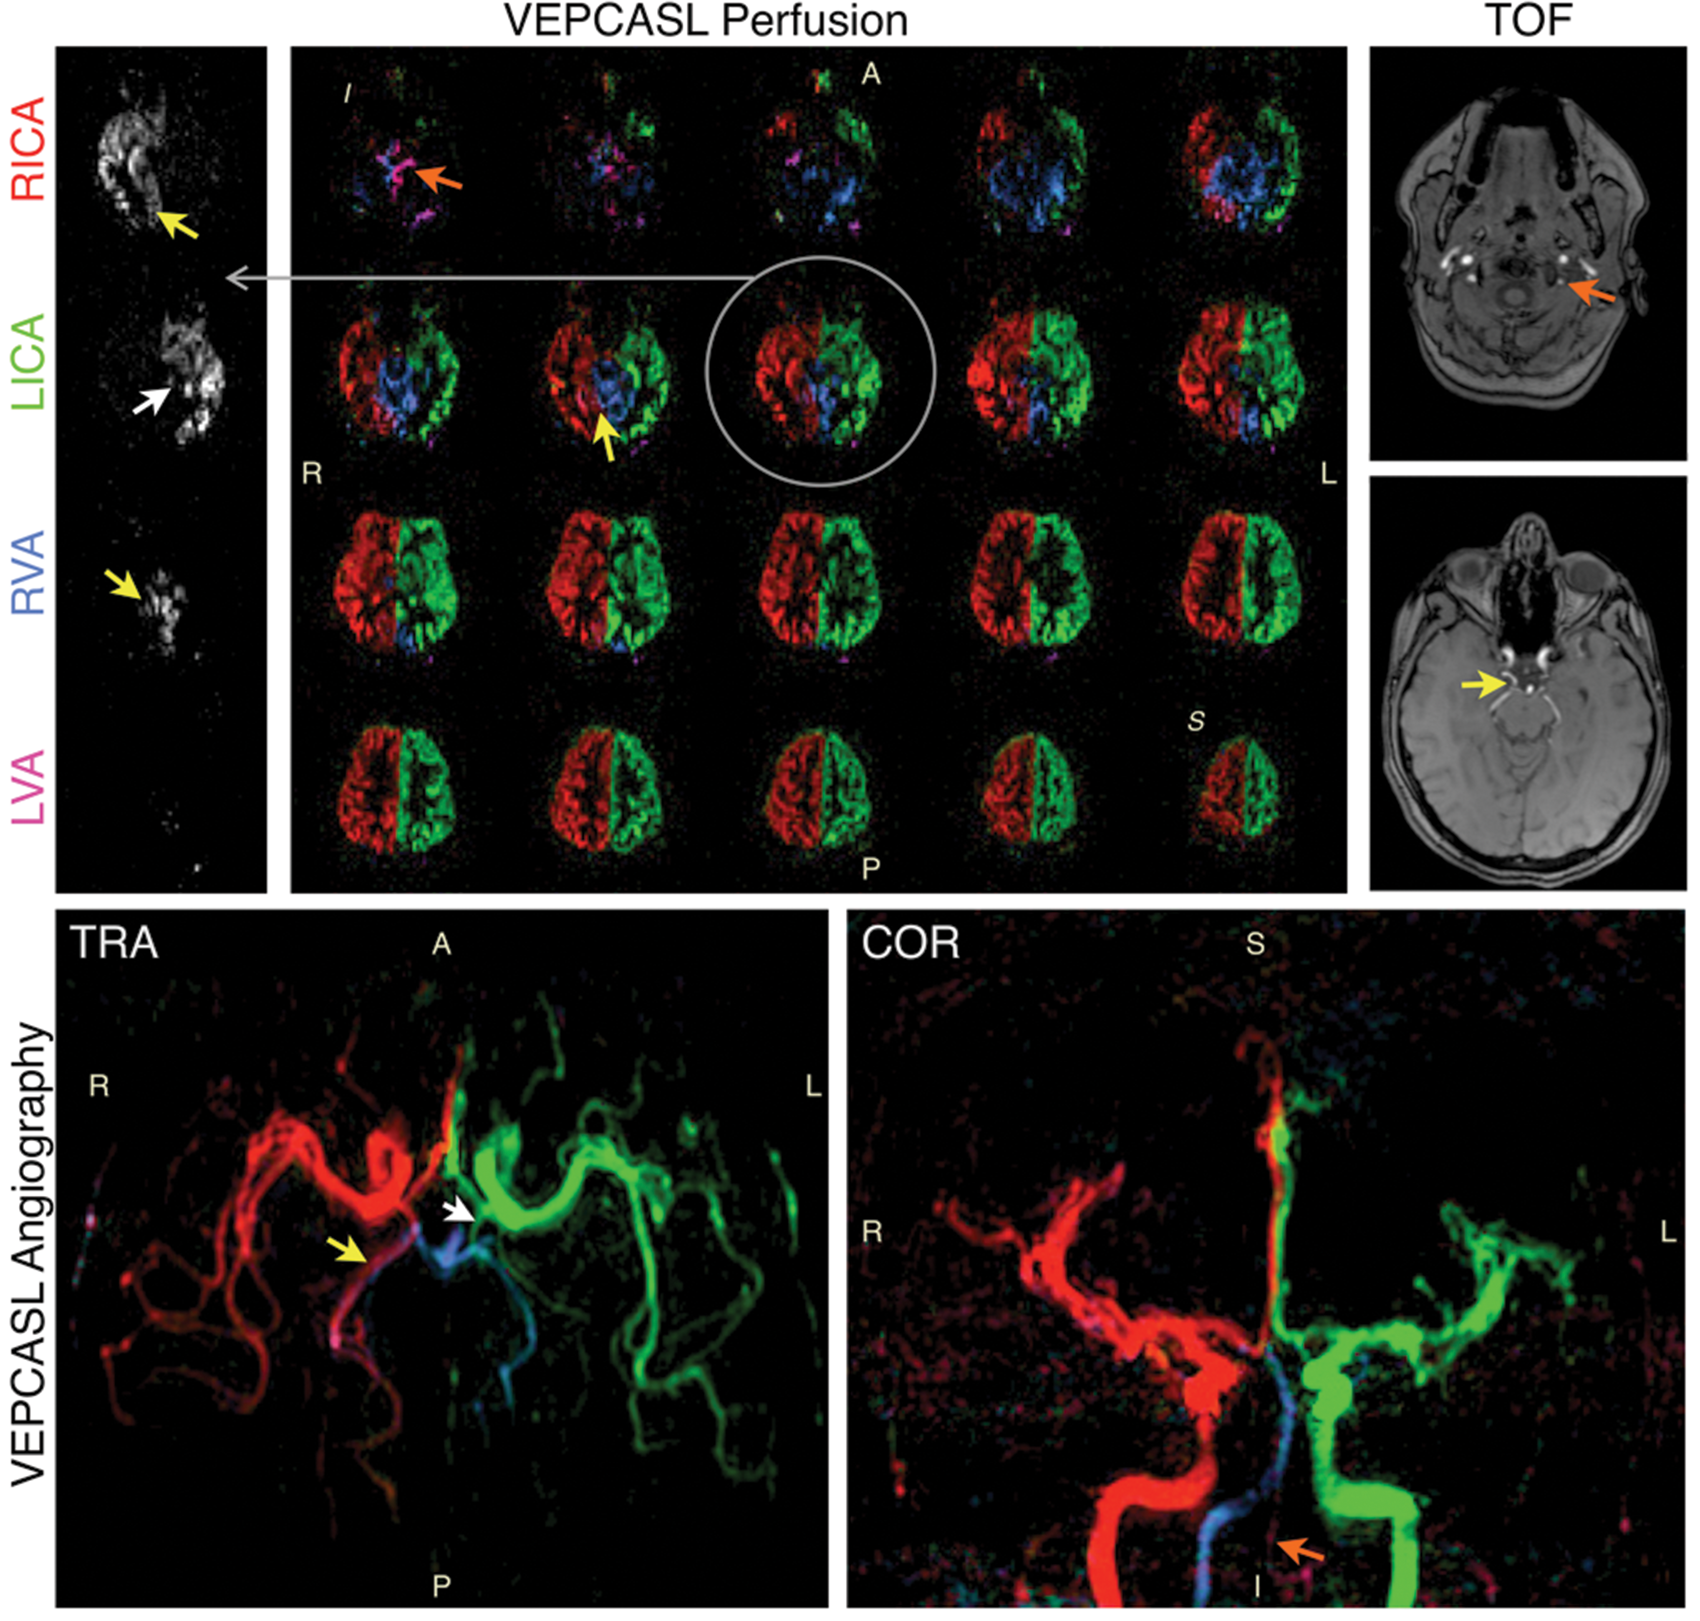
ASL has also been deployed extensively in neuro-oncology, both to aid diagnosis177,178 and therapy monitoring, 179 and to assist pre-surgical planning. 180 Higher grade tumours tend to show higher perfusion and vascularity, and ASL is also able to help distinguish tumourous progression from contrast-enhancing mimics and radiation necrosis. ASL has also found application in epilepsy181,182 to aid detection of epileptogenic focus by monitoring peri-ictal CBF increases. There is also hope that ASL will have a role in multiple sclerosis,183–185 where correlations have been found between ASL measures and lesion burden and disability. Another emerging use is in head trauma, 186 where ASL has shown specific patterns of perfusion abnormality. This includes the category of mild traumatic brain injury (e.g. following concussion) where structural changes may be too subtle to measure, but CBF changes can be detected. Finally, ASL has been used to study a number of mental health disorders, predominantly depression, 187 schizophrenia, 188 and post-traumatic stress disorder. 189 Patterns of hypoperfusion have been seen in frontal areas in depressed patients, along with hypoperfusion in regions associated with the default mode network. In post-traumatic stress disorder, regions of elevated CBF in parietal and temporal cortices have been found.
Conclusions
ASL is now a well-established MRI method for assessing cerebral perfusion in a quantitative manner. However, due to its complexity, challenging SNR characteristics, and slow translation into a clinically available tool, it has still not realized the impact that it promises. Now that there is a growing consensus on the imaging strategies and analysis methods to use, it is likely to become an increasingly valuable tool in the armoury of MRI methods, with utility in a variety of neurological and psychiatric diseases. Its ability to map the large vessels in an angiographic mode, with an associated improvement in SNR due to the improved partial volume fraction, also offers an exciting new tool for non-invasive assessment of the cerebrovasculature. By adding specificity to the arterial labeling, it should see application in collateral flow assessment, intervention planning for arteriovenous malformation treatment, and possibly also tumour surgery planning.
Footnotes
Funding
The author(s) disclosed receipt of the following financial support for the research, authorship, and/or publication of this article: We thank the Dunhill Medical Trust (grant OSRP1/1006), the EPSRC (grant EP/P012361/1) and the Royal Academy of Engineering (TWO). The Wellcome Centre for Integrative Neuroimaging is supported by core funding from the Wellcome Trust (203139/Z/16/Z).
Acknowledgements
We acknowledge our clinical collaborators, Dr Ursula Schulz and Dr Natalie Voets, and the facilities provided by the Oxford Acute Vascular Imaging Centre.
Declaration of conflicting interests
The author(s) declared the following potential conflicts of interest with respect to the research, authorship, and/or publication of this article: The authors hold patents on perfusion and angiography analysis methods that have been licensed to Siemens Healthineers.