
Abstract
Cerebrovascular reactivity measures vascular regulation of cerebral blood flow and is responsible for maintaining healthy neurovascular coupling. Multiple sclerosis exhibits progressive neurodegeneration and global cerebrovascular reactivity deficits. This study investigates varied degrees of cerebrovascular reactivity impairment in different brain networks, which may be an underlying cause for functional changes in the brain, affecting long-distance projection integrity and cognitive function; 28 multiple sclerosis and 28 control subjects underwent pseudocontinuous arterial spin labeling perfusion MRI to measure cerebral blood flow under normocapnia (room air) and hypercapnia (5% carbon dioxide gas mixture) breathing. Cerebrovascular reactivity, measured as normocapnic to hypercapnic cerebral blood flow percent increase normalized by end-tidal carbon dioxide change, was determined from seven functional networks (default mode, frontoparietal, somatomotor, visual, limbic, dorsal, and ventral attention networks). Group analysis showed significantly decreased cerebrovascular reactivity in patients compared to controls within the default mode, frontoparietal, somatomotor, and ventral attention networks after multiple comparison correction. Regression analysis showed a significant correlation of cerebrovascular reactivity with lesion load in the default mode and ventral attention networks and with gray matter atrophy in the default mode network. Functional networks in multiple sclerosis patients exhibit varied amounts of cerebrovascular reactivity deficits. Such blood flow regulation abnormalities may contribute to functional communication disruption in multiple sclerosis.
Introduction
Cerebrovascular reactivity (CVR) is a measure of the vascular regulation of blood flow capacity in response to vasoactive stimuli via changes in cerebral artery resistance. CVR is part of the autoregulation of the brain and plays a role in neurovascular coupling. Previous studies have shown the strong coupling between cerebral metabolic rate of oxygen consumption (CMRO2), an index of energy utilization, and cerebral blood flow (CBF) in response to stimulus. 1 There is a temporal uncoupling between the increase of oxygen metabolism and greater increase of local CBF 2 during stimulus, such mismatch, however, is evidence that the normal and prompt regulation of blood flow is critical to guarantee enough oxygen supply to meet metabolic needs during regional neuronal activity. Since CVR serves to modulate and maintain the distribution of CBF during the neuronal task and resting state, MRI-based CVR measures have recently emerged as a new tool for evaluation of vascular function integrity. Using MRI, one way to assess CVR is to apply a vasoactive stimulus such as carbon dioxide (CO2, a potent vasodilator) and to measure the change in CBF per unit change in blood CO2 concentration. The disruption of this autoregulation mechanism in a disease state can cause transient states of hypoxia due to disrupted neurovascular coupling resulting in suboptimal blood delivery during neuronal activities, which may eventually lead to neuronal dysfunction and degeneration in a chronic state, which is evident in other neurodegenerative diseases, as well, such as Alzheimer’s disease.3,4
Multiple sclerosis (MS) is a chronic autoimmune inflammatory disease which exhibits progressive neurodegeneration causing patients to experience a wide range of cognitive deficits. The observed neuronal death may be attributed to the decreased global CVR that has been identified in these patients. 5 One hypothesis for this global deficit in MS is the presence of chronically elevated nitric oxide levels, 6 which is secondary to repetitive vascular inflammatory cascades. Nitric oxide is a highly lipophilic and diffusible gas, 7 which acts as a vasodilator. Its overproduction may cause vascular habituation leading to a decrease in vasodilatory capacity and thus hypoxia during enhanced neuronal activity. This may be responsible for low CBF or perfusion in MS 8 and for the disruption of neurovascular coupling or blood flow regulation in MS. 5 Recently, a number of studies9–12 using resting state functional MRI have reported connectivity changes in functional networks in MS patients compared to healthy controls. Impaired CVR may not only promote neurodegeneration but may also disturb the ability to maintain efficient communication between spatially distinct areas. For example, weaker resting state connectivity was found within the default mode, motor, sensorimotor, visual, and working memory networks9–11 in MS patients, but there were also reports of increased functional coupling found in areas of the executive control and auditory network.9,10,12 Furthermore, studies have shown reorganization of the motor network in MS patients. 13 Therefore, beyond global CVR deficits and neurodegeneration found in MS, the integrity of specific functional networks may be more affected than others, which may offer insights into the neurophysiological underpinnings of the symptoms generally experienced by these patients.
The goal of the current study is to identify CVR deficits within various functional networks in MS patients compared to healthy controls, in order to better understand the underlying mechanisms which may contribute to the integrity of communication within the brain. We also investigate the relationship between the impaired CVR of networks and lesion load as well as neuronal loss measured with brain atrophy.
Materials and methods
Participants
Twenty-eight patients with clinically definite MS (26 relapsing-remitting and 2 secondary progressive patients with mean age of 43.1 ± SD 10.8 years: 18 females and 10 males) and 28 healthy control volunteers (mean age of 36.4 ± SD 12.9 years: 14 females and 14 males) participated in this study after providing written consent. This protocol was approved by the Institutional Review Board Human Protection Program and the informed consent was obtained from each subject, according to the Declaration of Helsinki 1975/1983, and ethical approval was obtained from the institutional ethical review board, New York University School of Medicine, New York, USA.
All patients had varied symptoms that included, but were not limited to, visual disturbances, numbness and tingling, weakness or fatigue, pain or sensitivity to heat, dizziness, bowel or bladder problems, or cognitive difficulties. Patients with prior diagnosis of cardiovascular, pulmonary, cerebrovascular, or other neurological diseases were excluded. The patients had a mean disease duration of 9.84 ± 7.7 years (range 1.3–29 years, available from 21 subjects) and a mean expanded disability status scale (EDSS) of 2.9 ± 1.6 (range 1–6, available from 23 subjects). All patients have received one or more immunosuppressive or immunomodulatory drugs in the three years prior to the exam. Among them eight patients received Tysabri, six patients received Copaxone, four patients received Betaseron, three patients received Rebif, seven patients received Gilenya, one patient received Avonex, three patients received Tecfidera, two patients received Rituxan, and two patients did not take any medications. None of these medications are known to cause any changes in vascular function. All the controls and patients who have history cardiovascular, pulmonary, cerebrovascular, or other neurological diseases were excluded from the study, which includes hypertension and diabetes. All subjects were also instructed to not use caffeine, alcohol and nicotine 6 h prior to the MRI study.
MR imaging
MRI data was acquired on a 3 Tesla MR scanner (Tim Trio, Siemens Healthcare, Erlangen, Germany) using a 12-channel-phased array head coil. CBF was measured using a pseudo-continuous arterial spin labeling (pCASL) perfusion MRI 12 covering the entire brain, which was based on single-shot gradient-echo echo planar imaging with the following parameters: repetition time/echo time: 3950/17 ms; labeling duration: 1470 ms; post-labeling delay: 1230 ms; slice thickness: 5 mm; 32 transverse slices; field of view: 22 cm2; in-plane matrix = 64 × 64, voxel size = 3.4 × 3.4 × 5 mm3 total of 52 measurements with 26 pairs of label and control images. Labeling was performed at 97 mm below the center of imaging volume such that it was approximately perpendicular to the internal carotid and vertebral arteries. We used generalized autocalibrating partially parallel acquisition (GRAPPA) factor of 2 with a scan duration of 3 min and 35 s. In addition, a non-enhanced T1-weighted (repetition time /echo time: 600/14 ms), fluid-attenuated inversion recovery (9010/134 ms; inversion time: 2500 ms), and T2-weighted (TR/TE = 3400/119 ms) images were acquired to cover the whole brain. A three-dimensional magnetization-prepared rapid acquisition with gradient-echo (MPRAGE) high-resolution T1-weighted imaging was also acquired for brain tissue segmentation (repetition time/echo time: 2300/2.98 ms; inversion time: 900 ms; isotropic voxel size: 1 × 1 × 1 mm3), as well as a post contrast T1-weighted imaging (TR/TE = 600/14 ms) to evaluate enhancing lesions.
CBF was first acquired under normocapnia, where the patient breathed room air, and subsequently under hyperacpnia, where the patient breathed a 5% CO2 gas mixture (5% CO2, 21% O2, and 74% N2) from a Douglas bag. Subjects were introduced to the experimental setup prior to the start of the scan and were tightly fitted with a nose clip to restrict breathing to the mouth. During both sequences, end-tidal CO2 (EtCO2) was monitored and recorded at a sampling rate of 2 s using the Medrad 9500 Multi-gas capnography monitor (Medrad Inc., Indianola, PA). After the normocapnia pCASL sequence, the hypercapnia gas was switched on and a 1 min and 18 s T1-weighted anatomical imaging (repetition time/echo time: 320/2.42 ms) with the same imaging orientation, slice thickness, and slice number as that of the pCASL was acquired for optimal image registration with pCASL images. This time interval allowed the EtCO2 levels to reach a new hypercapnic steady state, which was needed to run the second pCASL sequence.
Image processing and evaluation
Processing of the images was completed following a previously described method. 5 Statistical parametric mapping (SPM, University College London, UK) software was used to perform motion correction for both pCASL sequences and registration of the resulting images to the geometrically matched 2D T1-weighted anatomical image and 3D high-resolution MPRAGE anatomical images. 14 CBF (ml/100 g/min) was calculated as the difference between the average labeled and average control image and corrected for the difference in the acquisition delay time for the different slices.14,15 The CBF maps generated for the normocapnic and hypercapnic state were transformed into Montreal Neurological Institute (MNI) 52 template space. The CBF maps generated for the normocapnic and hypercapnic state were transformed into MNI 52 template space. This was completed by first registering the T1-weighted image to the MPRAGE anatomical image, and then normalizing it to MNI space. This same transform was then applied to the pCASL images and brain only regions were masked. The difference CBF map (hypercapnia minus normocapnia) underwent gray matter (GM) partial volume correction, by assuming that perfusion to GM is 2.5 times higher than white matter (WM) per unit volume. 16 Further normalization by individual EtCO2 increases resulted in the CVR map, which represents the change in CBF per unit of EtCO2 (mmHg) change at each voxel. Previously defined resting state templates were used to define functional networks, 17 including the visual, somatomotor, dorsal attention, ventral attention, limbic, frontoparietal, and default mode networks (DMN). GM network CBF values were computed for each condition by calculating the mean value of the unsmoothed CBF map within the overlaid template, which also fell into the GM segmentation of the subject, on the normalized normocapnic and hypercapnic CBF maps. The relative difference in CBF percentage was normalized by EtCO2 (mmHg) increase between the hypercapnia and normocapnia conditions, to calculate network CVR values (% CBF/ mmHg EtCO2).
The 3D high-resolution T1 MPRAGE image was used to obtain GM, WM, and cerebrospinal fluid (CSF) regions and tissue volumes using the Brain Extraction Tool and the Automated Segmentation Tool from the FMRIB Software Library.18,19 Segmentation results were manually corrected. The fractional brain parenchymal volume (fBPV), an index of brain atrophy, was computed as the ratio of brain parenchymal volume (GM + WM) to the total intracranial volume (GM + WM + CSF). Fractional gray matter volume (fGM) was computed as the ratio of GM volume to the total intracranial volume. Lesion load quantification was completed using the Firevoxel software (https://files.nyu.edu/hr18/public/). 20 Lesions were visually inspected and all misclassifications were manually corrected.
Statistical analysis
Statistical analysis was performed with SPSS software (SPSS Inc., Chicago, III). Between-group differences in network CVR mean values between patients and controls were estimated by using a two sample t-test design with a significance threshold of 0.05 and by fitting analysis of covariance (ANCOVA) controlled for age. False discovery rate (FDR) correction was applied to correct for multiple comparisons. Pearson correlation coefficients were used to evaluate associations between CVR values and fGM and lesion load in patients with MS.
Results
All subjects were able to complete the study. The EtCO2 level (mmHg) increase from normocapnia to hypercapnia was not significantly different between the control group (9.39 ± 2.7) and the MS group (8.64 ± 3.0, p = 0.3). The fBPV showed a significant decrease in the MS group compared to the control group (0.79 ± 0.04% vs. 0.82 ± 0.02%, p = 0.0003), as did the fGM (0.42 ± 0.03% vs. 0.43 ± 0.02%, p = 0.004), indicating brain atrophy in MS. The average lesion load of the MS group was 14.34 ± 12.7 cm3. No enhanced lesions were visible in the post contrast T1-weighted image. There was no significant difference between average breathing rate or heart rate between the control and MS group during the normocapnic or the hypercapnic pCASL run.
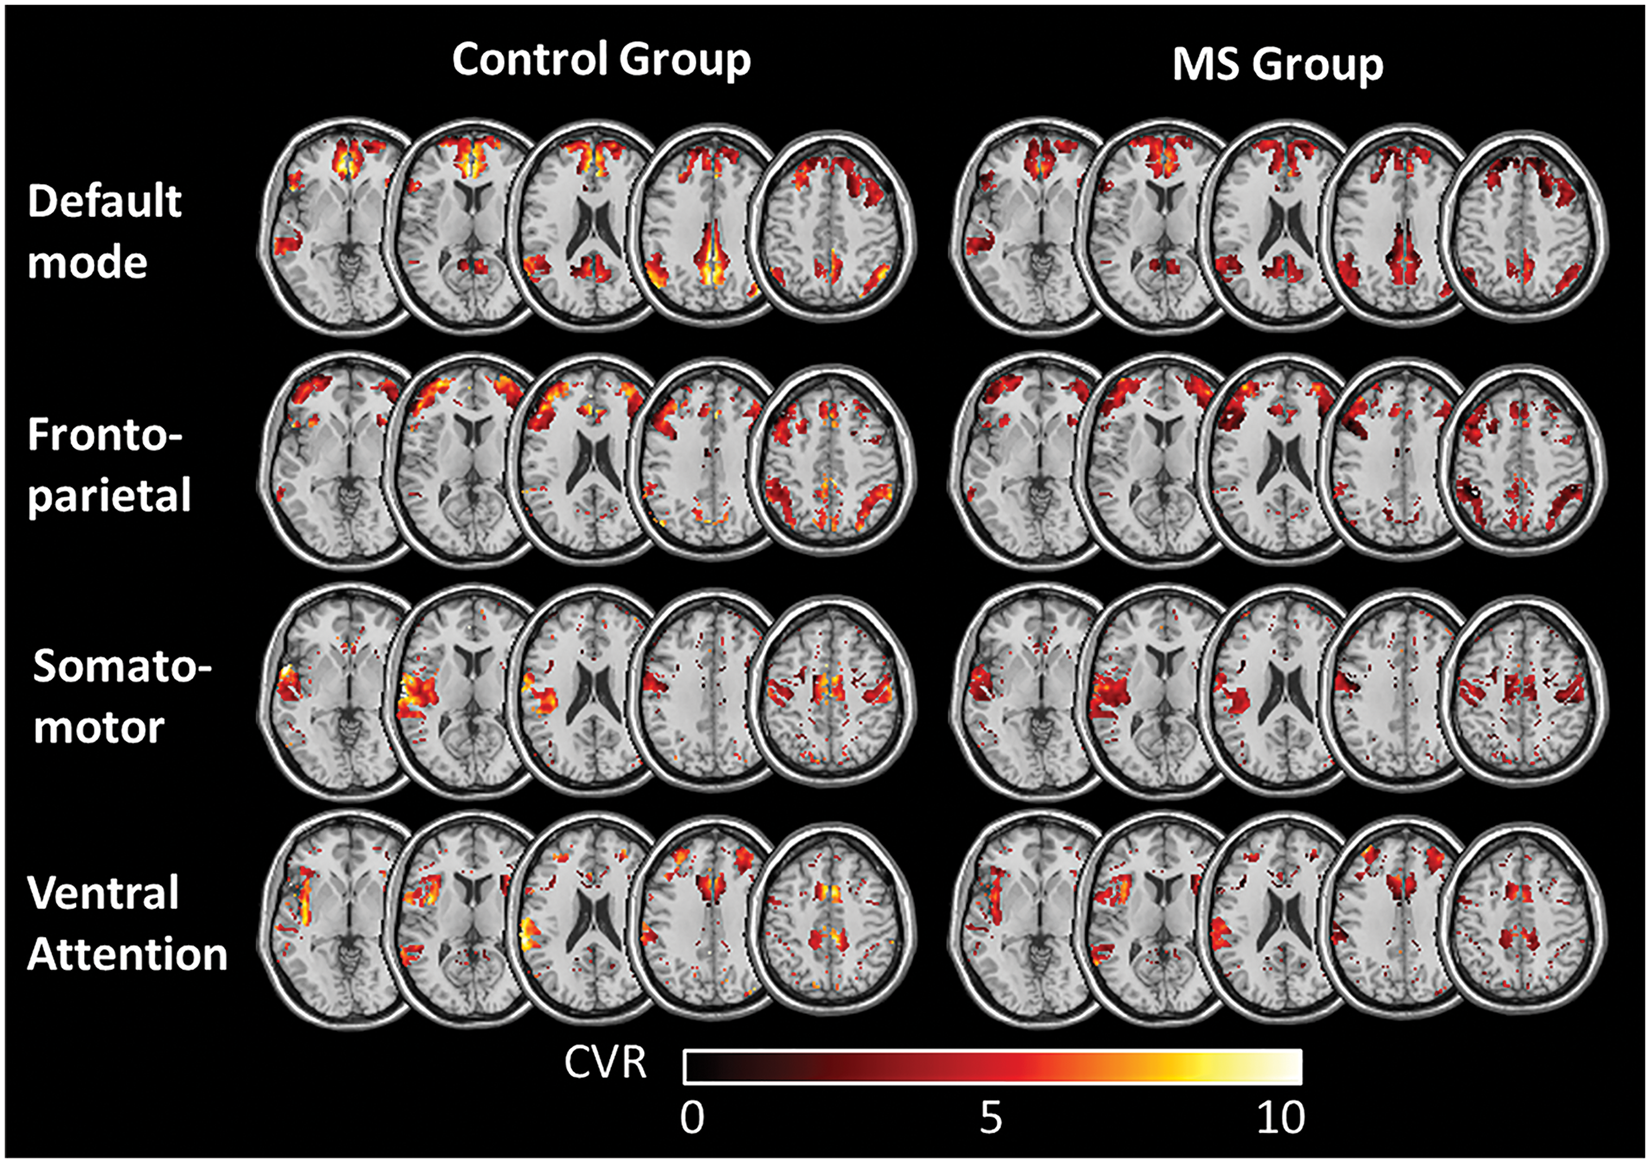
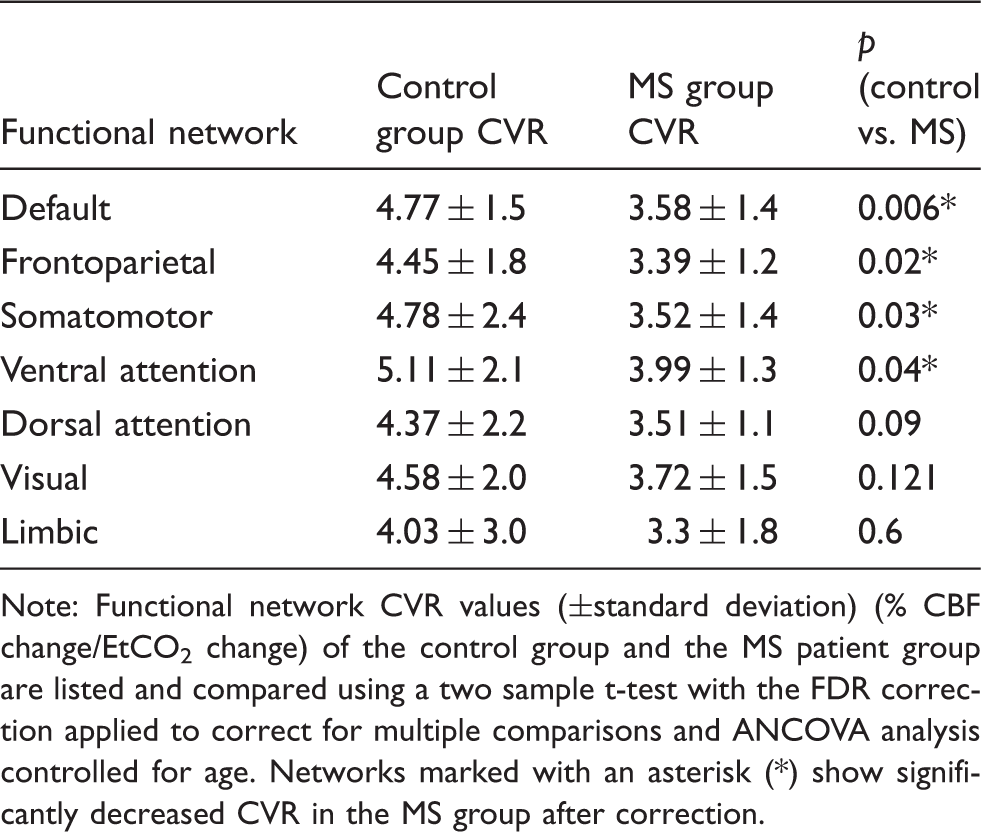
A decrease in CVR values in the MS group compared to those of the controls was found in all networks (Table 1); however, four out of the seven networks showed a significant decrease (Figure 1). These networks included the DMN (NC: 4.77 ± 1.5%/mmHg, MS: 3.58 ± 1.4%/mmHg, p = 0.006), frontoparietal (NC: 4.45 ± 1.8%/mmHg, MS: 3.39 ± 1.2%/mmHg, p = 0.02), somatomotor (NC: 4.78 ± 2.4%/mmHg, MS: 3.52 ± 1.4%/mmHg, p = 0.03), and ventral attention networks (NC: 5.11 ± 2.1%/mmHg, MS: 3.99 ± 1.3%/mmHg, p = 0.04). The dorsal attention networks (NC: 4.37 ± 2.2%/mmHg, MS: 3.51 ± 1.1%/mmHg, p = 0.09), visual (NC: 4.58 ± 2.0%/mmHg, MS: 3.72 ± 1.5%/mmHg, p = 0.1), and limbic network (NC: 4.03 ± 3.0%/mmHg, MS: 3.30 ± 1.8%/mmHg, p = 0.6) did not show a significantly decreased CVR in the MS patients. As shown in Table 1, after we controlled for age by performing an ANCOVA analysis, the results remained significant in the DMN, frontoparietal, somatomotor, and ventral attention networks. Average CVR maps of the control and patient groups demonstrate evident CVR impairment in the MS group, as shown in Figure 2.
(a) Functional network classification as described by Yeo et al.
17
: visual (green), somatomotor (light blue), dorsal attention (yellow), ventral attention (magenta), limbic (gold), frontoparietal (dark blue) and default (red). (b) Comparison of average CVR values (% CBF change/EtCO2 change) with the functional networks of the control group and the MS patient group. Error bars show standard deviation. Significance calculated as a two sample t-test with FDR correction applied to correct for multiple comparisons. Networks marked with an asterisk (*) show significantly decreased CVR in the MS group after correction. Average CVR maps of the functional networks of the control group and the MS group, which show a significantly decreased CVR in patients. Color bar shows the range of CVR values in % CBF/mmHg EtCO2. Summary of average cerebrovascular reactivity (CVR) in the control and multiple sclerosis (MS) in the seven functional networks. Note: Functional network CVR values (±standard deviation) (% CBF change/EtCO2 change) of the control group and the MS patient group are listed and compared using a two sample t-test with the FDR correction applied to correct for multiple comparisons and ANCOVA analysis controlled for age. Networks marked with an asterisk (*) show significantly decreased CVR in the MS group after correction.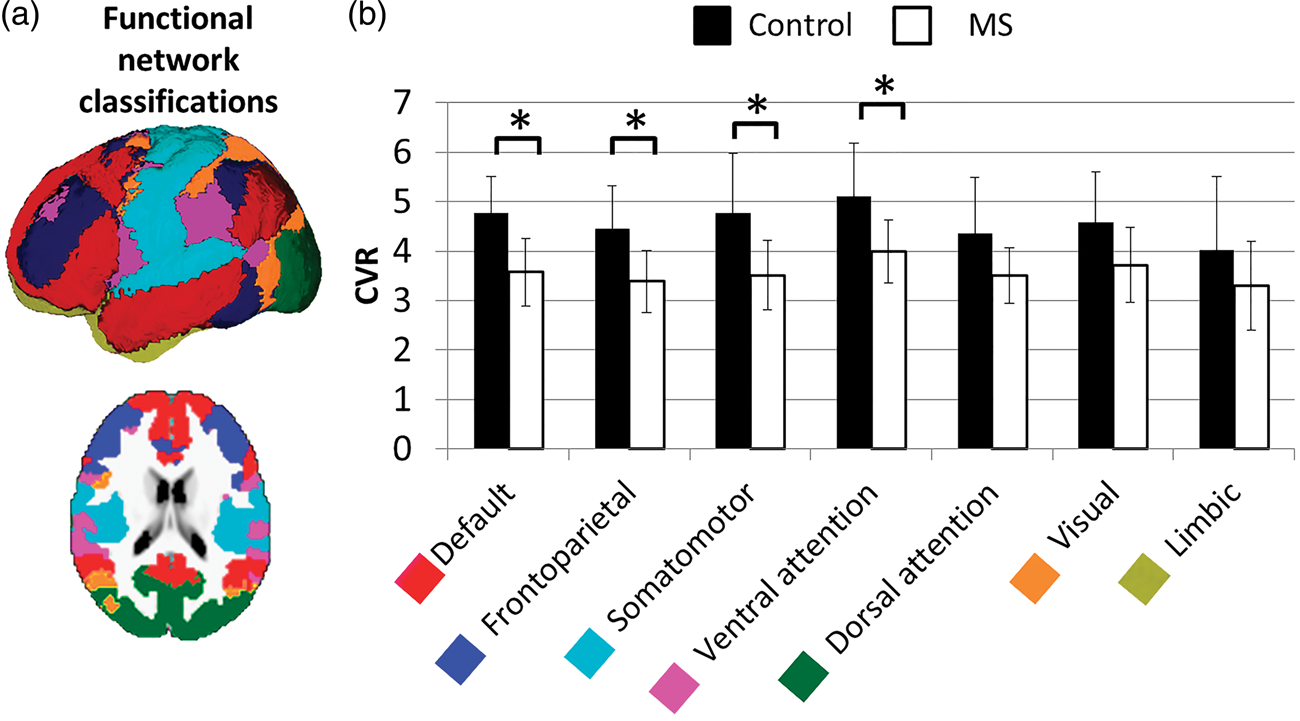
A significant negative correlation between CVR values and lesion load was observed in the DMN (R = 0.51, p = 0.005) and frontoparietal network (R = 0.24, p = 0.02). In addition, a moderate positive correlation was also observed between CVR values and fGM in the DMN in the MS patient group (R = 0.44, p = 0.02) (Figure 3).
Correlations in the default mode network of (a) cerebrovascular reactivity (CVR) with lesion volume (R = 0.51, p = 0.005) (b) and with fractional gray matter volume (fGM) (R = 0.44, p = 0.02) in the MS patient group.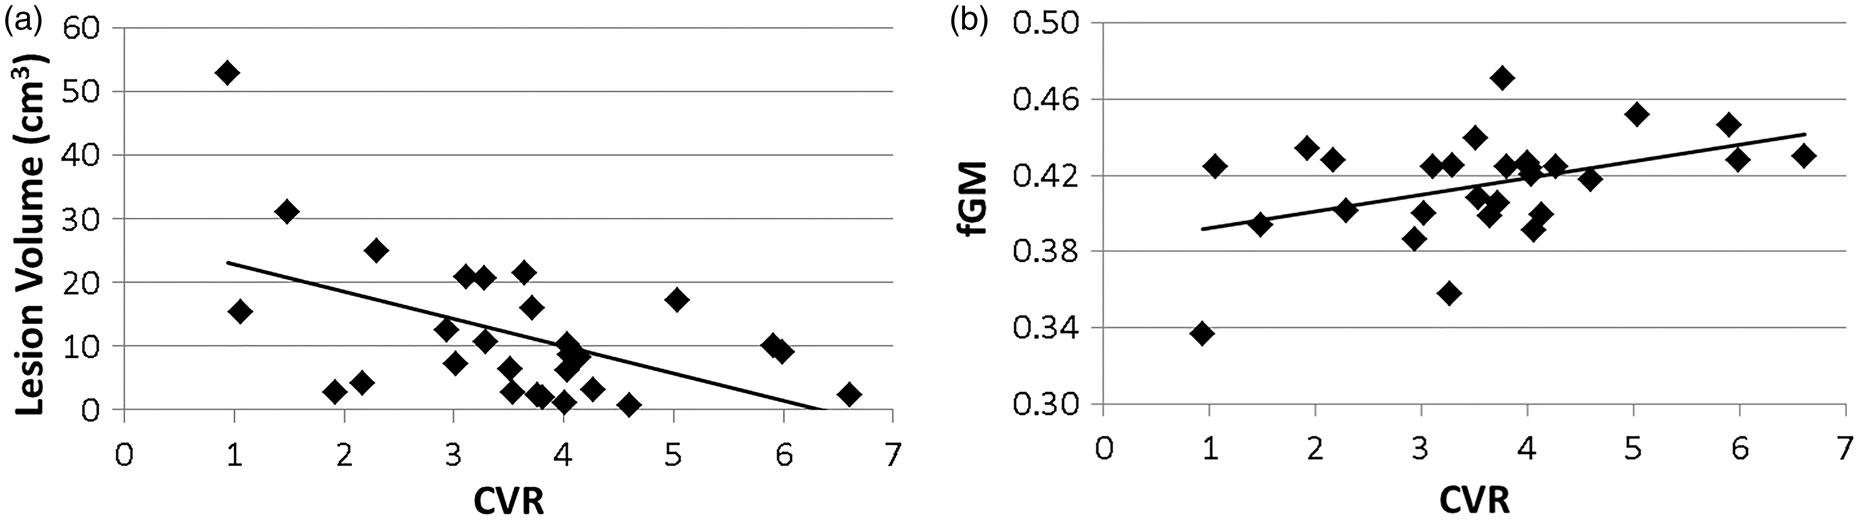
Discussion
CVR is an essential mechanism to ensure healthy neuronal function as it is responsible for fulfilling the immediate energy demand following neurovascular coupling. Impaired CVR may affect the integrity of proper neuronal networks due to the disrupted regulation of blood flow, while the integrity of these networks is critical in maintaining normal baseline cognitive functioning. Although disruptions and alterations in resting state networks are widely reported in MS, the mechanism driving these changes is still poorly understood. The current study is designed to investigate a possible explanation for connectivity changes through deficits in CVR in MS patients. CVR deficits affect local neuronal activity by insufficient blood supply as demanded. Inadequate blood flow for a prolonged period of time can cause chronic states of hypoxia leading to neurodegeneration, which will alter the ability for brain regions to communicate effectively, thus decreasing the effectiveness of functional connectivity. While increases and decreases21–25 have been shown in baseline perfusion in MS patients, we study the CVR and elasticity of the blood vessels and their ability to deliver adequate blood flow. CVR decrease may be caused by the presence of chronically elevated nitric oxide levels, 6 which is secondary to repetitive inflammatory cascades and is a vasodilator. Although increased perfusion was found in inflammatory lesions 21 or prelesional normal appearing WM,23,24 overproduction and prolonged exposure can affect the elasticity of the blood vessels and cause vascular habituation that leads to impaired perfusion. We confirm and expand on previous study results, 5 that there is diffusely impaired CVR in MS patients, since we show a significant decrease in four of the seven functional networks. Further, we found varied extent of CVR deficit in the various functional networks studied, suggesting network disruption 10 and reorganization in MS. 11 These results will help understand the vascular and functional deficits as well as cognitive impairment in patients with MS.
We show that after a strict correction for multiple comparisons, only the DMN, frontoparietal, somatomotor, and ventral attention networks show a significant decrease in average network CVR values. This finding is important, since it suggests that certain functional areas are more susceptible than others to vasomotor injury in MS. We found the most prominent CVR deficits within the DMN, and the dysfunction between the regions within the DMN may play a part in the cognitive deficits that patients experience in both relapsing-remitting progressive MS. 26 The DMN is considered to be most active at rest and during some passive processing tasks, and 27 thus has higher energy expenditure compared to other networks. In MS, one of consequence of chronically high level of nitric oxide is vascular habituation, which may lead to disrupted neurovascular coupling or reduced vasodilatory capacity (i.e. CVR) and limited blood supply when neurons are active. There is increasing evidence showing a connection between impaired neurovascular coupling and tissue hypoxia and subsequent neurodegeneration. 4 A recent study by Paling et al. 28 also showed prolonged arterial bolus arrival time in both WM and GM in MS patients, which also support our findings of impaired CVR and disrupted neurovascular coupling. This, in particular, will affect healthy and active neurons as a result of transient but frequent hypoxic attacks during daily life, which was hypothesized as “activity induced hypoxia.” 5 Since regions of the DMN are very active during a large portion of time, they may be more susceptible to vascular habituation and reduced CVR. Our results of significantly decreased CVR in the DMN is also mirrored in resting state functional connectivity studies, which found a decrease in functional connectivity within the network. 9 We also found a strong correlation between DMN CVR values and lesion load and the GM atrophy (measured as fGM), which is consistent with previous findings showing decreased network integrity in MS patients due to the disruption of WM pathways between DMN regions. 29 The correlation between CVR deficit of certain networks and WM lesion load suggests that the distribution of lesions may be a possible contributor for the CVR deficits. It is evident that WM lesions represent the regions, where most current, past, and repetitive inflammatory activities occur that are associated with overproduced nitric oxide. Such tonically high level of nitric oxide can cause CVR deficit and neurodegeneration including GM atrophy.
Previous studies have shown that MS lesions have a tendency to be in the frontal and parietal WM, disrupting the frontoparietal network. 30 These areas are associated with attention and working verbal memory tasks, in which MS subjects often experience impairment. 31 Additionally, WM lesions in the right parietotemporal regions have been correlated with fatigue in MS subjects. 32 We also show significantly decreased CVR values in the frontoparietal network in the MS group compared to controls. Also, an interesting finding of present study is the difference in CVR deficit between the ventral and dorsal attention networks. The dorsal network is a top-down guided voluntary activation of attention,33,34 whereas the ventral network is bottom-up process activated by unexpected stimuli or reorienting of attention in response to a new stimulus.35,36 A recent study 37 found increased activation in the ventral attention network in MS subjects when compared to controls in tasks with expectation stimuli and decreased activation in the dorsal attention network. This lack of preparatory expectation in MS patients may contribute to poor performance in attention and working memory tasks. Since the ventral attention network may be overly active, more strain is put on the vessels of these regions to supply adequate blood flow, contributing to vascular habituation and CVR deficits, in agreement with our results. The dorsal attention network, on the other hand, may be less active, which may be why the CVR deficit is less significant. In this study, CVR impairments in the somatomotor network are expected, since somatomotor impairments are one of the hallmark symptoms of MS. Decreased intra-network connectivity within this network has been reported in MS 38 as well as evidence for altered patterns of inter-network functional connectivity. 13 Additionally, the functional connectivity of the motor network is shown to be negatively associated with disease severity, 38 which is indicative of the motor deficits that MS patients commonly experience.
This study has several limitations. Our study did not obtain resting state functional MRI data for the patients included in the study, because current analysis techniques do not allow for reliable single subject network results. 39 Therefore, we cannot combine individual resting state connectivity and CVR results to better understand how these two measures interact. However, since the functional networks used in this study are well established, it is reasonable to use these predefined network masks to test our hypothesis that in MS, CVR impairment may not be equally affected in all functional areas. As shown, the blood flow regulation impairment is correlated with lesion load and neuronal degeneration in at least the DMN, and also globally. 5 In addition, lesions in cortical areas or on the long-distance projections can cause disruption in functional connectivity and a decrease in CVR. The image acquisition for the current study, however, was acquired at 3T, meaning that there is limited ability to detect cortical lesions as compared to higher field (e.g. 7T) MR strength. 40 The specific distribution of lesions in the cortex cannot be accurately correlated with CVR impairment. Although it is known that cortical GM lesions have less inflammatory activities than WM lesions, future studies on spatial lesion distribution in cortical GM and CVR deficit are warranted. Finally, our use of a relatively short post-labeling delay in pCASL sequence is based on SNR considerations that our targeted signal is only about 50% of the regular ASL and that we have additional constraints of CO2 inhalation duration. This delay time may result in macrovascular artifacts in the measured signal. However, it is expected that the over-estimation of CBF is present in both controls and patients and that the observation of a CVR difference between them is still valid.
Conclusions
We found a significantly decreased CVR in multiple functional network regions in MS, suggesting an impaired cerebral blood modulation that can lead to neurovascular coupling disturbance and affect effective oxygen delivery and subsequent neuronal dysfunction. These observations may offer valuable insight into the disrupted functional communication and cognitive impairment in MS patients that may be associated with blood flow autoregulation abnormalities.
Footnotes
Funding
YG was supported by NIH R01 grants NS076588, NS029029, NS029029S1, and the National MS Society research grant number RG 4707A1. HL was supported by NIH R01 grants MH084021, NS067015, AG042753, and NIH R21 grant NS078656. This work was also performed under the rubric of the Center for Advanced Imaging Innovation and Research (CAI2R, ![]() ), a NIBIB Biomedical Technology Resource Center (NIH P41 EB017183).
), a NIBIB Biomedical Technology Resource Center (NIH P41 EB017183).
Acknowledgements
We would like to thank Jacqueline Smith, Jean-Christophe Brisset, PhD, Ilya Kister, MD, Robert I. Grossman, MD, from the New York University School of Medicine for helping with conception and design or data collection. We would also like to thank Danny J. Wang, PhD, from the David Geffen School of Medicine at the University of California, Los Angeles, for providing the pseudocontinuous ASL sequence. These individuals did not receive compensation from the funding sponsors.
Declaration of conflicting interests
The author(s) declared no potential conflicts of interest with respect to the research, authorship, and/or publication of this article.
Authors’ contributions
OM collected the data, contributed to the study concept and design, did the data analysis, and drafted the manuscript. SC collected the data, planned the study, helped on data analysis and manuscript. HL planned the study, established the technical protocol, and helped on data analysis. LP established the database and did the statistical analysis. YG established the study concept and design, collected the data, contributed to the statistical analysis, and provided administrative support and study supervision. All authors contributed to the interpretation of data and revised the manuscript.