
Abstract
Several studies have highlighted a delayed secondary pathology developing after reperfusion in animals subjected to prolonged cerebral ischemia, and recently we have shown that peri-infarct depolarizations (PIDs) occur not only during ischemia, but also in this delayed period of infarct maturation. Here we study the electrocorticographic (ECoG) manifestations of PIDs as signatures of developing secondary pathology. DC- and traditional AC-ECoG signals were recorded continuously from epidural, nonpolarizable electrodes during 2 h of middle cerebral artery occlusion (MCAo) and 22 h of reperfusion in freely behaving rats. During MCAo, seizures and PIDs recurred frequently and their incidence was significantly correlated. After reperfusion, seizures and PIDs ceased, and for the next several hours delta wave abnormalities dominated the ECoG with progressively increasing amplitude. After a variable period (5 to 15 h), the ECoG amplitude decremented with the onset of a prolonged repetitive series of PIDs. Initial PIDs in this delayed phase produced transient depressions of the high amplitude ECoG signal, but thereafter the ECoG was persistently attenuated, with no transient depressions during subsequent PIDs. The time of onset of postreperfusion PIDs, and hence measures of ECoG attenuation, correlated with 24 h infarct volumes. PIDs could always be detected in baseline shifts of the AC-ECoG signal with a low high-pass cutoff setting. These results suggest that delayed PIDs after reperfusion contribute to a complex secondary pathology involving delayed edema, intracranial hypertension, and hypoperfusion. The manifestation of PIDs in ECoG/electroencephalography recordings may enable continuous real-time monitoring of infarct progression.
Keywords
Introduction
The clinical use of electroencephalography (EEG) for the diagnosis and localization of stroke has been largely supplanted by neuroimaging techniques (Faught, 1993). Recently, continuous EEG monitoring has gained favor for the detection of nonconvulsive seizures (NCS; Jordan, 1993, 1999; Vespa et al, 1999; Procaccio et al, 2001; Hirsch, 2004; Vespa, 2005) that likely contribute to exacerbation of injury and poor outcome (Young et al, 1996). Indeed, electrophysiologic approaches have an advantage over imaging in the feasibility of long-term monitoring and detection of sporadic ictal events. In addition to NCS, for instance, use of continuous electrocorticography (ECoG) has enabled the detection of spreading depression (SD) in the injured human brain (Strong et al, 2002), whereas 30 min DW-MRI scans had previously yielded negative results (Back et al, 2000). Although the utility of EEG in monitoring the time course and progression of cerebral infarction is still questioned (Faught, 1993), its further improvement and application in acute stroke is encouraged (Jordan, 2004).
Experimentally, continuous ECoG monitoring has been advantageous in the rat middle cerebral artery occlusion (MCAo) model of focal ischemia. In particular, we have documented the occurrence and incidence of NCS (Hartings et al, 2003b), which are not observed in anesthetized preparations, as well as other neurologically relevant abnormalities including polymorphic delta activity (PDA; Lu et al, 2001; Williams et al, 2003) and periodic lateralized epileptiform discharges (PLEDs; Hartings et al, 2003b). Topographic mapping and spectral analysis of these activities also provide functional end points in neuroprotection studies. Polymorphic delta activity, for instance, as a feature of reperfusion injury, is attenuated with treatment by sodium channel antagonists (Williams et al, 2003) and NCS provides a basis for target-directed neuroprotection with antiepileptic drugs (Williams et al, 2004).
Intracranial DC-amplified recordings, as a measure of brain tissue ion homeostasis, can also provide ongoing assessment of neurophysiologic dysfunction. In focal ischemia, anoxic depolarization rapidly develops in the ischemic core and is reflected in a sustained ∼20 mV negative shift in DC potential. Neuronal and glial membrane polarization is maintained in penumbral tissue, but is subject to recurring episodes of SD, referred to in this context as peri-infarct depolarizations (PIDs). Unlike SD in the normally perfused brain, PIDs lack compensatory hyperemia (Back et al, 1994), exacerbate tissue hypoxia and acidosis, and cause expansion of the ischemic core (Gynell et al, 1995; Back et al, 1996; Takano et al, 1996). Recently, we have shown that PIDs occur not only during vascular occlusion but also in a more prominent, delayed phase beginning 2 to 12 h after reperfusion (Hartings et al, 2003a). Although the frequency of these depolarizations matches the rate of infarct growth, it is unknown whether they manifest the deleterious consequences of PIDs that occur during occlusion of blood flow.
In the present study, we combine the use of AC-amplified ECoG with monitoring of the slow potential (DC amplification) to investigate the relationship of PIDs to traditional ECoG/EEG abnormalities, including NCS previously described in this model (Hartings et al, 2003b). We find that depolarizations occurring several hours after reperfusion cause a progressive, persistent decrement of the ECoG, suppressing the high amplitude delta activity that develops after reperfusion. The time of onset of these electrophysiologic changes correlates with 24 h infarct volume. These depolarizations thus represent harmful PIDs and may participate in a secondary injury cascade involving edema, intracranial hypertension, ischemia, and the growth of infarction. Continuous EEG/ECoG monitoring of secondary phase PID manifestations may be a useful tool, predictive of injury outcome and sensitive to treatment interventions, to monitor the development of these pathologies.
Materials and methods
Male Sprague–Dawley rats (Charles River Labs, Raleigh, VA, USA) weighing 275 to 350 g were used in these experiments. All surgical procedures were approved by the Walter Reed Army Institute of Research Animal Care and Use Committee. Research was conducted in compliance with the Animal Welfare Act, Guide for the Care and Use of Laboratory Animals (National Research Council), and other federal statutes and regulations relating to animals and experiments involving animals. Animals were maintained in a facility accredited by the Association for Assessment and Accreditation of Laboratory Animal Care International. For surgical procedures, anesthesia was induced with 5% halothane delivered in oxygen and maintained at 1.5% throughout surgery, and core body temperatures were maintained at 37.0°C by a homeothermic heating blanket.
Electrodes and Recording Preparation
DC recordings were made with epidural Ag/AgCl electrodes prepared from 0.010 in diameter Ag wire (Sigmund Cohn, Mt. Vernon, NY, USA). Wire was flamed to produce 0.8 to 1.0 mm diameter spherical tips and then chloridized. Electrodes were placed in burr holes through the skull made with manual drills, and two screws were placed over the uninjured hemisphere to serve as head-mount anchors. The free ends of the electrode wires were soldered to a multipin connector (March Electronics, West Hempstead, NY, USA) and the assembly was fixed to the skull with cranioplastic cement (Plastics One, Roanoke, VA, USA). Signals were recorded through shielded cables, input to separate channels for DC and AC amplification with a Grass (Natick, MA, USA) Model 15 amplifier system (15A12 DC and 15A54 AC amplifiers), digitized at 100 Hz, and collected with EEG recording and analysis software (Gamma, Astro-Med, Inc., West Warwick, RI, USA). DC recordings were filtered with a 0.1 Hz low-pass cutoff, and AC recordings were band-pass filtered at 0.3 to 50 Hz.
A two-electrode monopolar recording montage was used in most experiments. Lead electrodes were placed over frontal and parietal cortices (1.5 mm anterior and 2.5 posterior to bregma, respectively) in the injured hemisphere, medial to the core infarction (1.5 mm lateral to bregma). A reference electrode was located posterior to lambda. In three animals, stainless-steel screws (0 to 80 × 1/8 in.) were used to make AC-ECoG bipolar recordings in addition to the monopolar Ag/AgCl recordings used in other experiments. Screw electrodes were placed adjacent to the lateral ridge of the skull at 1.5 mm anterior and posterior to bregma and soldered to multipin connectors via insulated Ni chrome wire (0.2 mm diameter).
Middle Cerebral Artery Occlusion
Animals were subjected to transient MCAo by the intraluminal filament method the day after the electrode implantation. Briefly, the right external carotid artery was ligated, cauterized, and cut, and its branches were coagulated. A 35 mm length of 3-0 nylon monofilament (Ethicon, Somerville, NJ, USA) with a rounded tip was then inserted into the internal carotid artery via the proximal end of the external carotid artery stump. The filament was advanced approximately 20 mm beyond the bifurcation of the internal and external carotid arteries, when slight resistance was encountered. Animals were reanesthetized after 2 h and reperfused by retraction of the filament.
General Procedures
Animals were provided 20 to 25 g rat feed/day and had water access ad libitum before MCAo; food and water were available ad libitum thereafter. Animals were individually housed under a 12 h light/dark cycle. On the day of MCAo surgery, rats were transferred from their cages to custom-designed Plexiglas recording chambers (Dragonfly Inc., Ridgeley, WV, USA) equipped with multichannel swivel commutators (Plastics One, Roanoke, VA, USA). The multipin connector on the rat skull was connected to the swivel system via a flexible shielded cable, allowing free movement of the animals during recordings (Tortella et al, 1999).
Before MCAo surgery, rectal temperatures and neurologic function were assessed and recordings were made continuously for 30 mins. Immediately after surgery, animals were returned to recording chambers and continuous digital records were obtained for the subsequent 24 h, with the exception of a brief period for reperfusion surgery. Rectal temperatures and neurologic function were assessed at 2 h after injury and before killing at the study end point. Animals that did not exhibit full neurologic impairment at 2 h after injury, had subarachnoid hemorrhage at the time of killing, or died before the study end point were excluded from the study. After 24 h, animals were deeply anesthetized with 5% halothane and killed by decapitation.
Neurologic and Infarct Assessment
Neurologic function was assessed by testing four behaviors: (1) contralateral shoulder adduction (curling), (2) unequal forelimb flexion when held by the tail and suspended above the floor, (3) counterclockwise circling during free ambulation, and (4) unequal resistance to left lateral displacement compared with right displacement. Any animals that did not exhibit all four of these behaviors were excluded from further study.
After killing, brains were harvested and cut in seven 2 mm coronal sections beginning 1 mm from the rostral pole. Sections were stained with 2,3,5-triphenyltetrazolium chloride (TTC) and digitally imaged using a computerized analysis system (LOATS Inc., Westminster, MD, USA). Areas of infarction were defined as those completely lacking red TTC stain, and total infarct volumes were computed by integrating the infarct areas of sequential brain sections.
Data Processing and Analysis
Digitally recorded data were analyzed using Gamma v4.3 Review Software (Astro-Med, Inc., West Warwick, RI, USA) and Chart v5.2 (ADInstruments, Colorado Spring, CO, USA). Computational analysis and signal processing was performed with Chart v5.2 and custom-designed programs in MATLAB (The Mathworks, Natick, MA, USA). Peri-infarct depolarizations and the times of NCS onset/offset were scored by visual inspection of recordings. Nonconvulsive seizures events were electrocorticographically defined as rhythmic discharges with spike components that persisted > 10 secs (see Hartings et al, 2003b; Williams et al, 2004). While PLEDs might be considered an ictal pattern and form of partial status epilepticus (Handforth et al, 1994; Assal et al, 2001; Garzon et al, 2001), they were not included as NCS events for the analyses presented here. Peri-infarct depolarizations were identified as 1 to 5 mV negative deflections of the DC potential, 40 to 90 secs in duration, that occurred sequentially on both the frontal and parietal electrodes, with or without depression of the ECoG signal (see Results). Peri-infarct depolarization times were scored at the point of maximum DC negativity.
To evaluate trends in ECoG amplitude, total power in the global frequency band (0.5 to 50 Hz) was computed using the short-time Fourier transform using a 15-sec window translated at 10-sec intervals (5 secs overlap). Data in Figure 4 represent these total power estimates smoothed with a moving average filter using a window width of 1 h shifted in 5-min increments. Approximate times of ‘permanent’ ECoG amplitude decrement (see Results) were determined by two methods applied to these averaged power data: (1) the time of maximally negative slope as assessed in 5-min increments over 30-min epochs (i.e., min[amplitude(t + 30 min.) – amplitude(t)] for t = 0, 5, 10, etc.), and (2) the time at which amplitude falls below the initial postreperfusion value.
Seizure-triggered PID probability histograms (Figure 3) were constructed by setting the time of a trigger event (e.g., seizure offset) as t = 0 and incrementing the count in time bins corresponding to the intervals between the trigger and all adjacent PIDs. This was iterated for each trigger event, and the resulting histograms were divided by the number of trigger events to yield an ordinate measure of the probability of a PID per time bin. Peri-infarct depolarization-triggered averages (Figure 5) were constructed similarly, except that the times of peak DC negativities during PIDs were used as the trigger (t = 0) and total spectral power estimates based on 10-sec epochs for the adjacent −10 to + 10 mins were averaged. With these cross-correlation methods, any events that occur randomly with respect to the triggering stimulus yield a flat correlogram without evident temporal structure. Data are reported as means ± (s.d.).
Results
Continuous DC- and AC-amplified ECoG recordings were obtained in 18 rats subjected to 2 h MCAo and 22 h reperfusion. Rats had a mean core infarct volume of 170 (± 114) mm3 and neurologic scores of 6.4 (± 2.7) at 24 h. Figures 1 and 2 show trends and representative tracings of ECoG activity and DC potential during MCAo as well as pre- and postischemic periods, illustrating several findings examined in greater detail below. Relative to ECoG activity during awake, desynchronized ECoG states before MCAo (Figures 1A and 2A), the spontaneous ECoG was depressed during the 2 h ischemic period (Figures 1B and 2B). In this time, multiple PIDs occurred with a mean incidence across animals of 14.6 (±6.2) events (Figure 1, top and 1B). At the same time, recurrent episodic seizures (i.e., NCS) occurred (Figure 2C), generating the sharp, large amplitude peaks in power trend analysis (Figure 1B). Upon reperfusion, PIDs and NCS episodes ceased and ECoG amplitude increased substantially above pre-injury values over a period of several hours (Figure 1, top). The PID activity then re-emerged in a secondary phase (Figure 1, top) and coincided with transient, and then persistent decreases in ECoG amplitude to levels similar to those during MCAo (Figures 1C and 2F). Animals had an average of 65.1 (±34.7) PIDs in this period; only one animal did not have secondary phase PIDs.
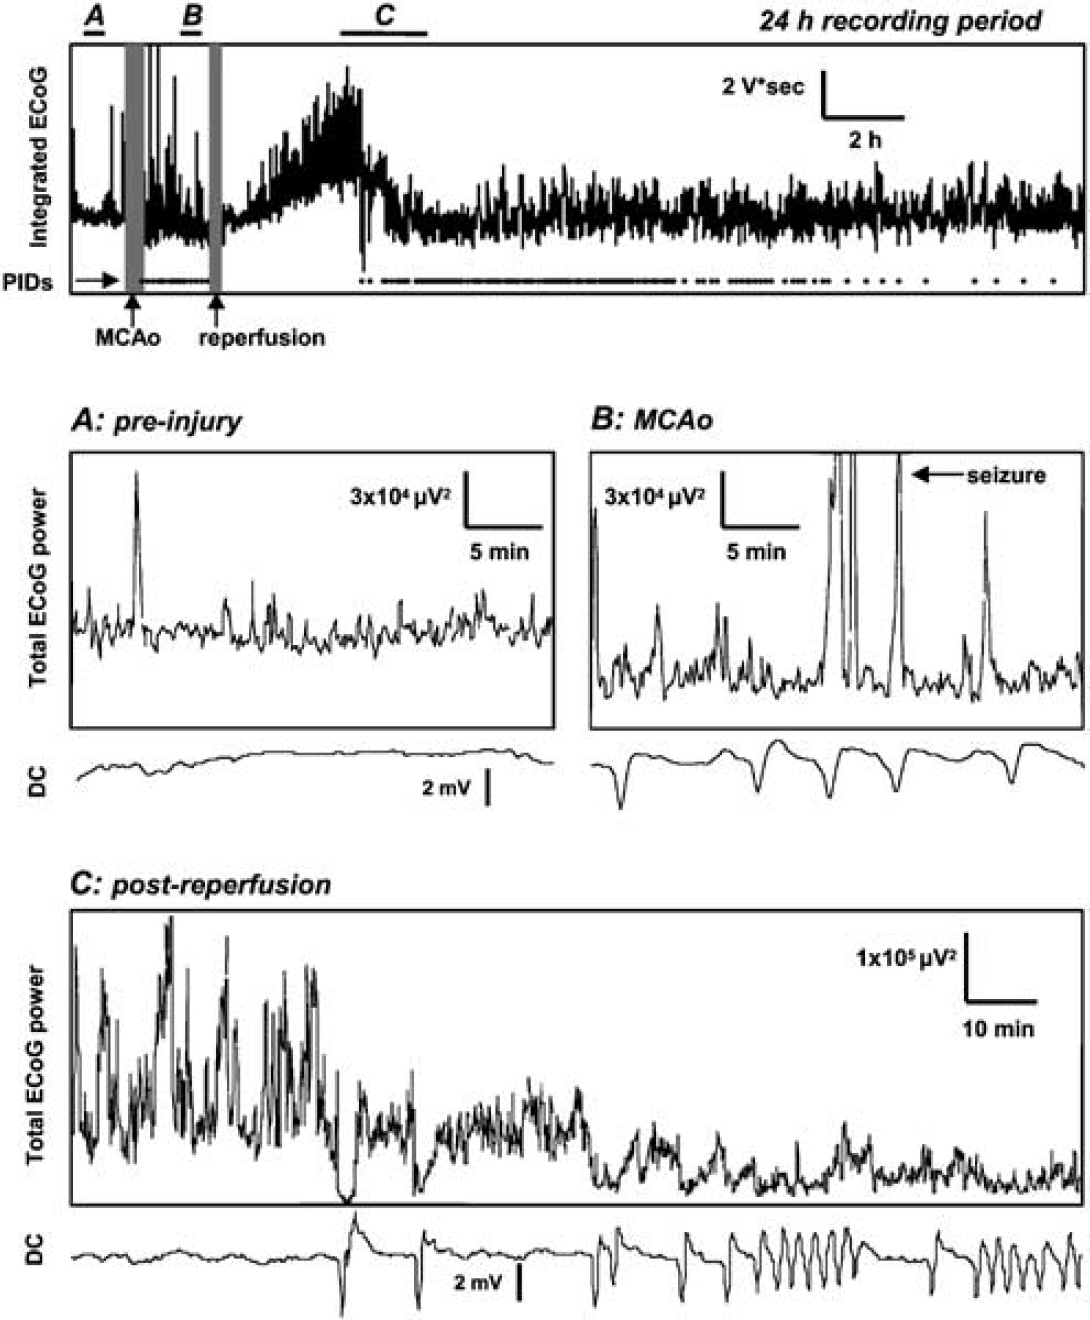
Relation of electrocorticographic (ECoG) power trends to peri-infarct depolarizations (PIDs). Top: Trend plot of the ECoG signal (0.5 to 50 Hz; integrated over consecutive 15-sec intervals with 5 sec overlap) over a 24 h period including pre-injury, MCAo, and reperfusion periods. Raster plot shows times of each PID event. Gray vertical bars denote times of MCAo and reperfusion surgeries, and bars labeled (
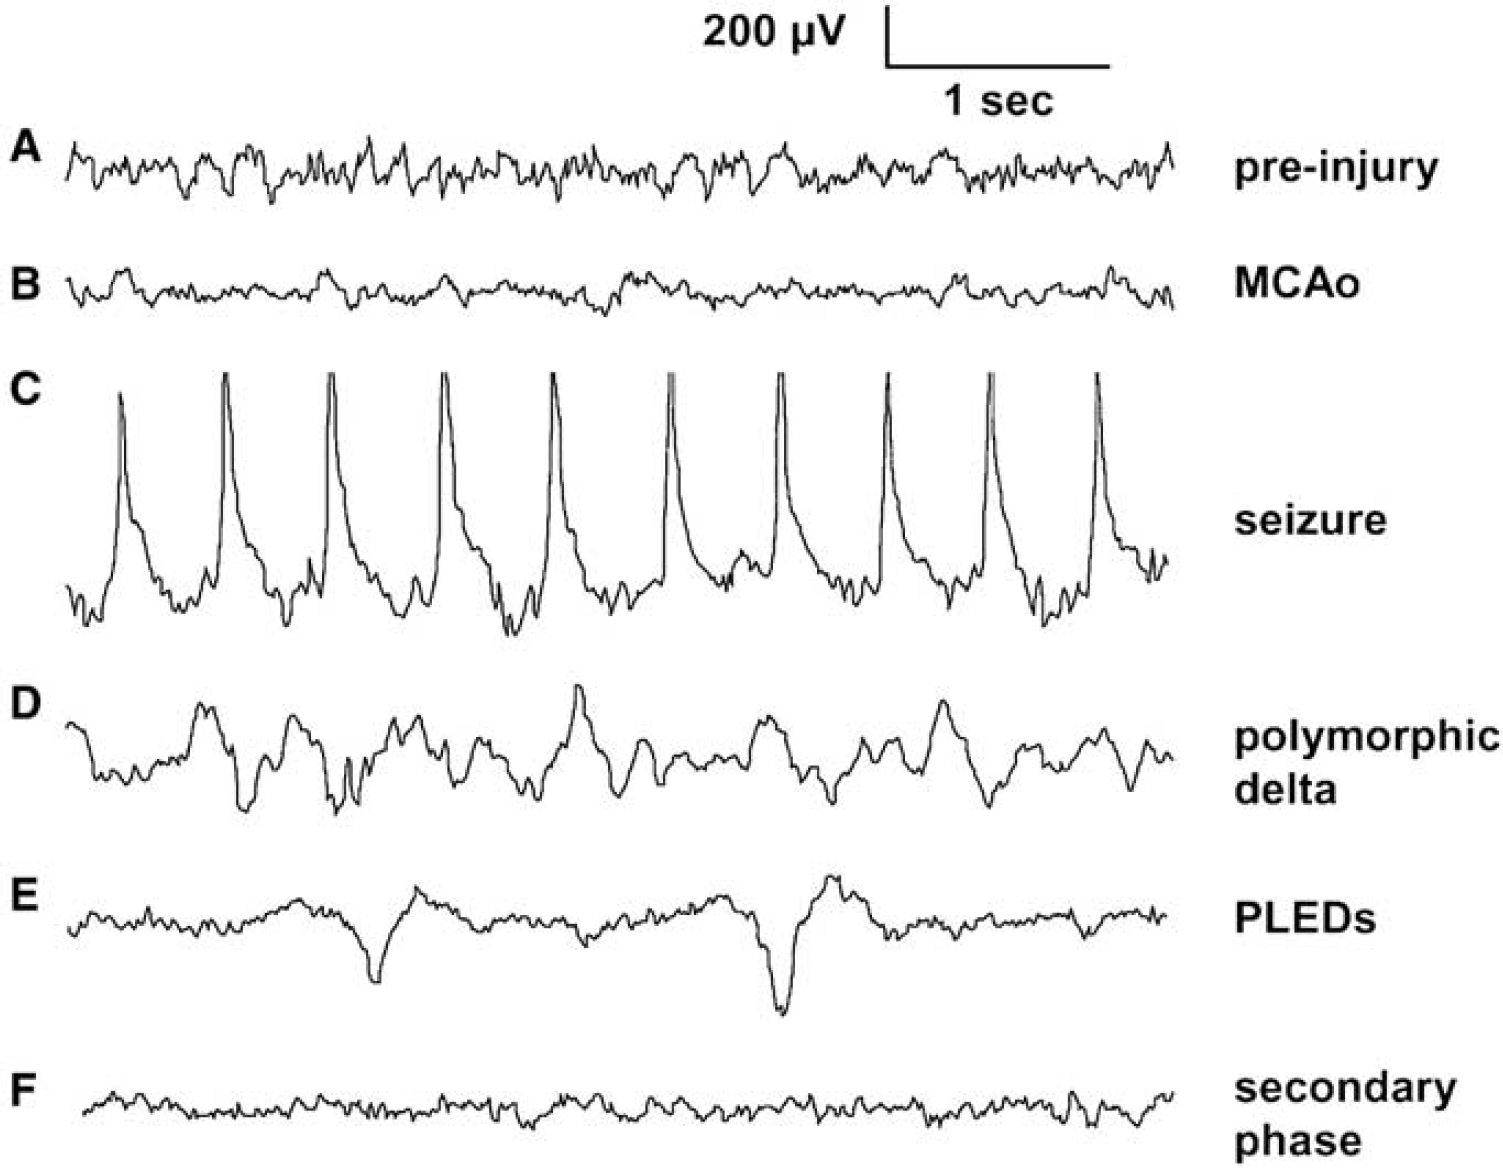
Representative electrocorticographic (ECoG) traces. (
Relation Between Peri-Infarct Depolarizations and Seizures
Electrographic NCS were observed in 11/18 rats during MCAo, with an average of 11 NCS events and 12 mins 20 secs time-in-seizure per rat exhibiting NCS. These NCS statistics are similar to those described previously for this model (Hartings et al, 2003b). The termination of a seizure episode sometimes coincided with the development of a PID. To determine whether there was any consistent temporal relationship between PIDs and seizures, peri-seizure histograms were constructed by comparing the times of seizure onset (Figure 3A) and offset (Figure 3B) with the times of PIDs observed in the same animals. These histograms, constructed from 125 seizures occurring in 11 rats, failed to reveal any consistent temporal relationship between seizures and PIDs, as PID probabilities were relatively constant in relation to the times of both seizure onset and offset (Figures 3A and 3B). The total number of seizures per animal, however, was significantly positively correlated with the total number of PIDs occurring during MCAo (Figure 3C; P = 0.03; R2 = 0.26). Seizure incidence during MCAo was also positively, albeit nonsignificantly, correlated with the number of PIDs occuring in the secondary, postreperfusion period (Figure 3D; P = 0.10, R2 = 0.16).
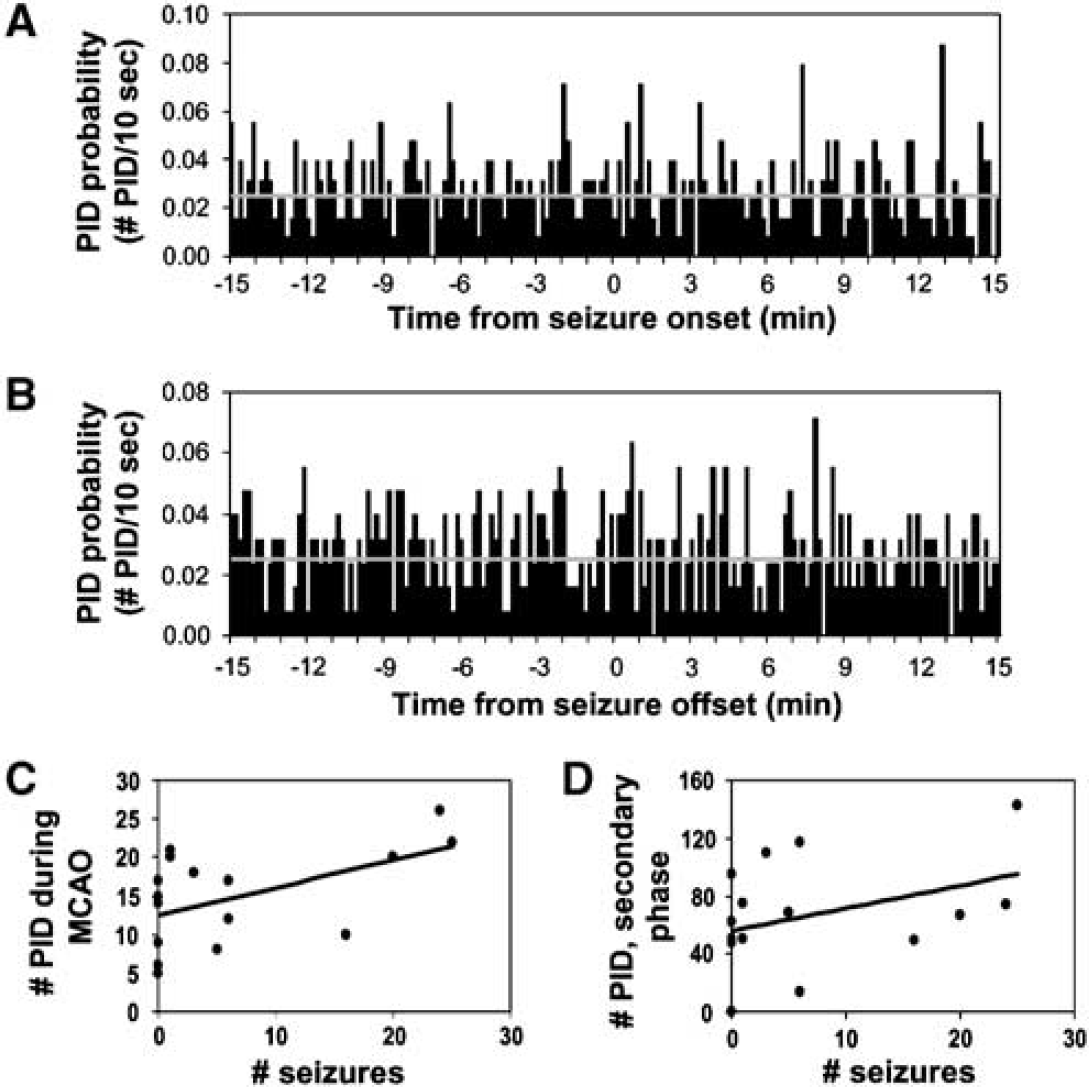
Population analysis of relation of seizures and peri-infarct depolarizations (PIDs). (
Persistent Decrement of Electrocorticographic Amplitude
Immediately after reperfusion, seizure and PID activity ceased and the ECoG amplitude increased above pre-injury levels with the onset of high voltage delta waves (Figure 1, top). Delta activity manifested as a continuum between PDA and somewhat more regular sharp or slow waves evolving occasionally into PLEDs (Figures 2D and 2E). The amplitude/incidence of these activities increased gradually over a period of several hours. This is illustrated in Figure 4A, which shows trends in total ECoG amplitude for 13 rats over 15 h after reperfusion. Note that amplitudes for all animals are increasing over the first 2 h. In each rat, however, a subsequent decline in ECoG power to preinjury or even ischemic levels (see representative traces, Figure 2) occurred at variable time points (Figure 4A). Five rats, shown in Figure 4C, did not exhibit increasing delta activities on reperfusion, although two of these showed similar delayed onset ECoG decrements.
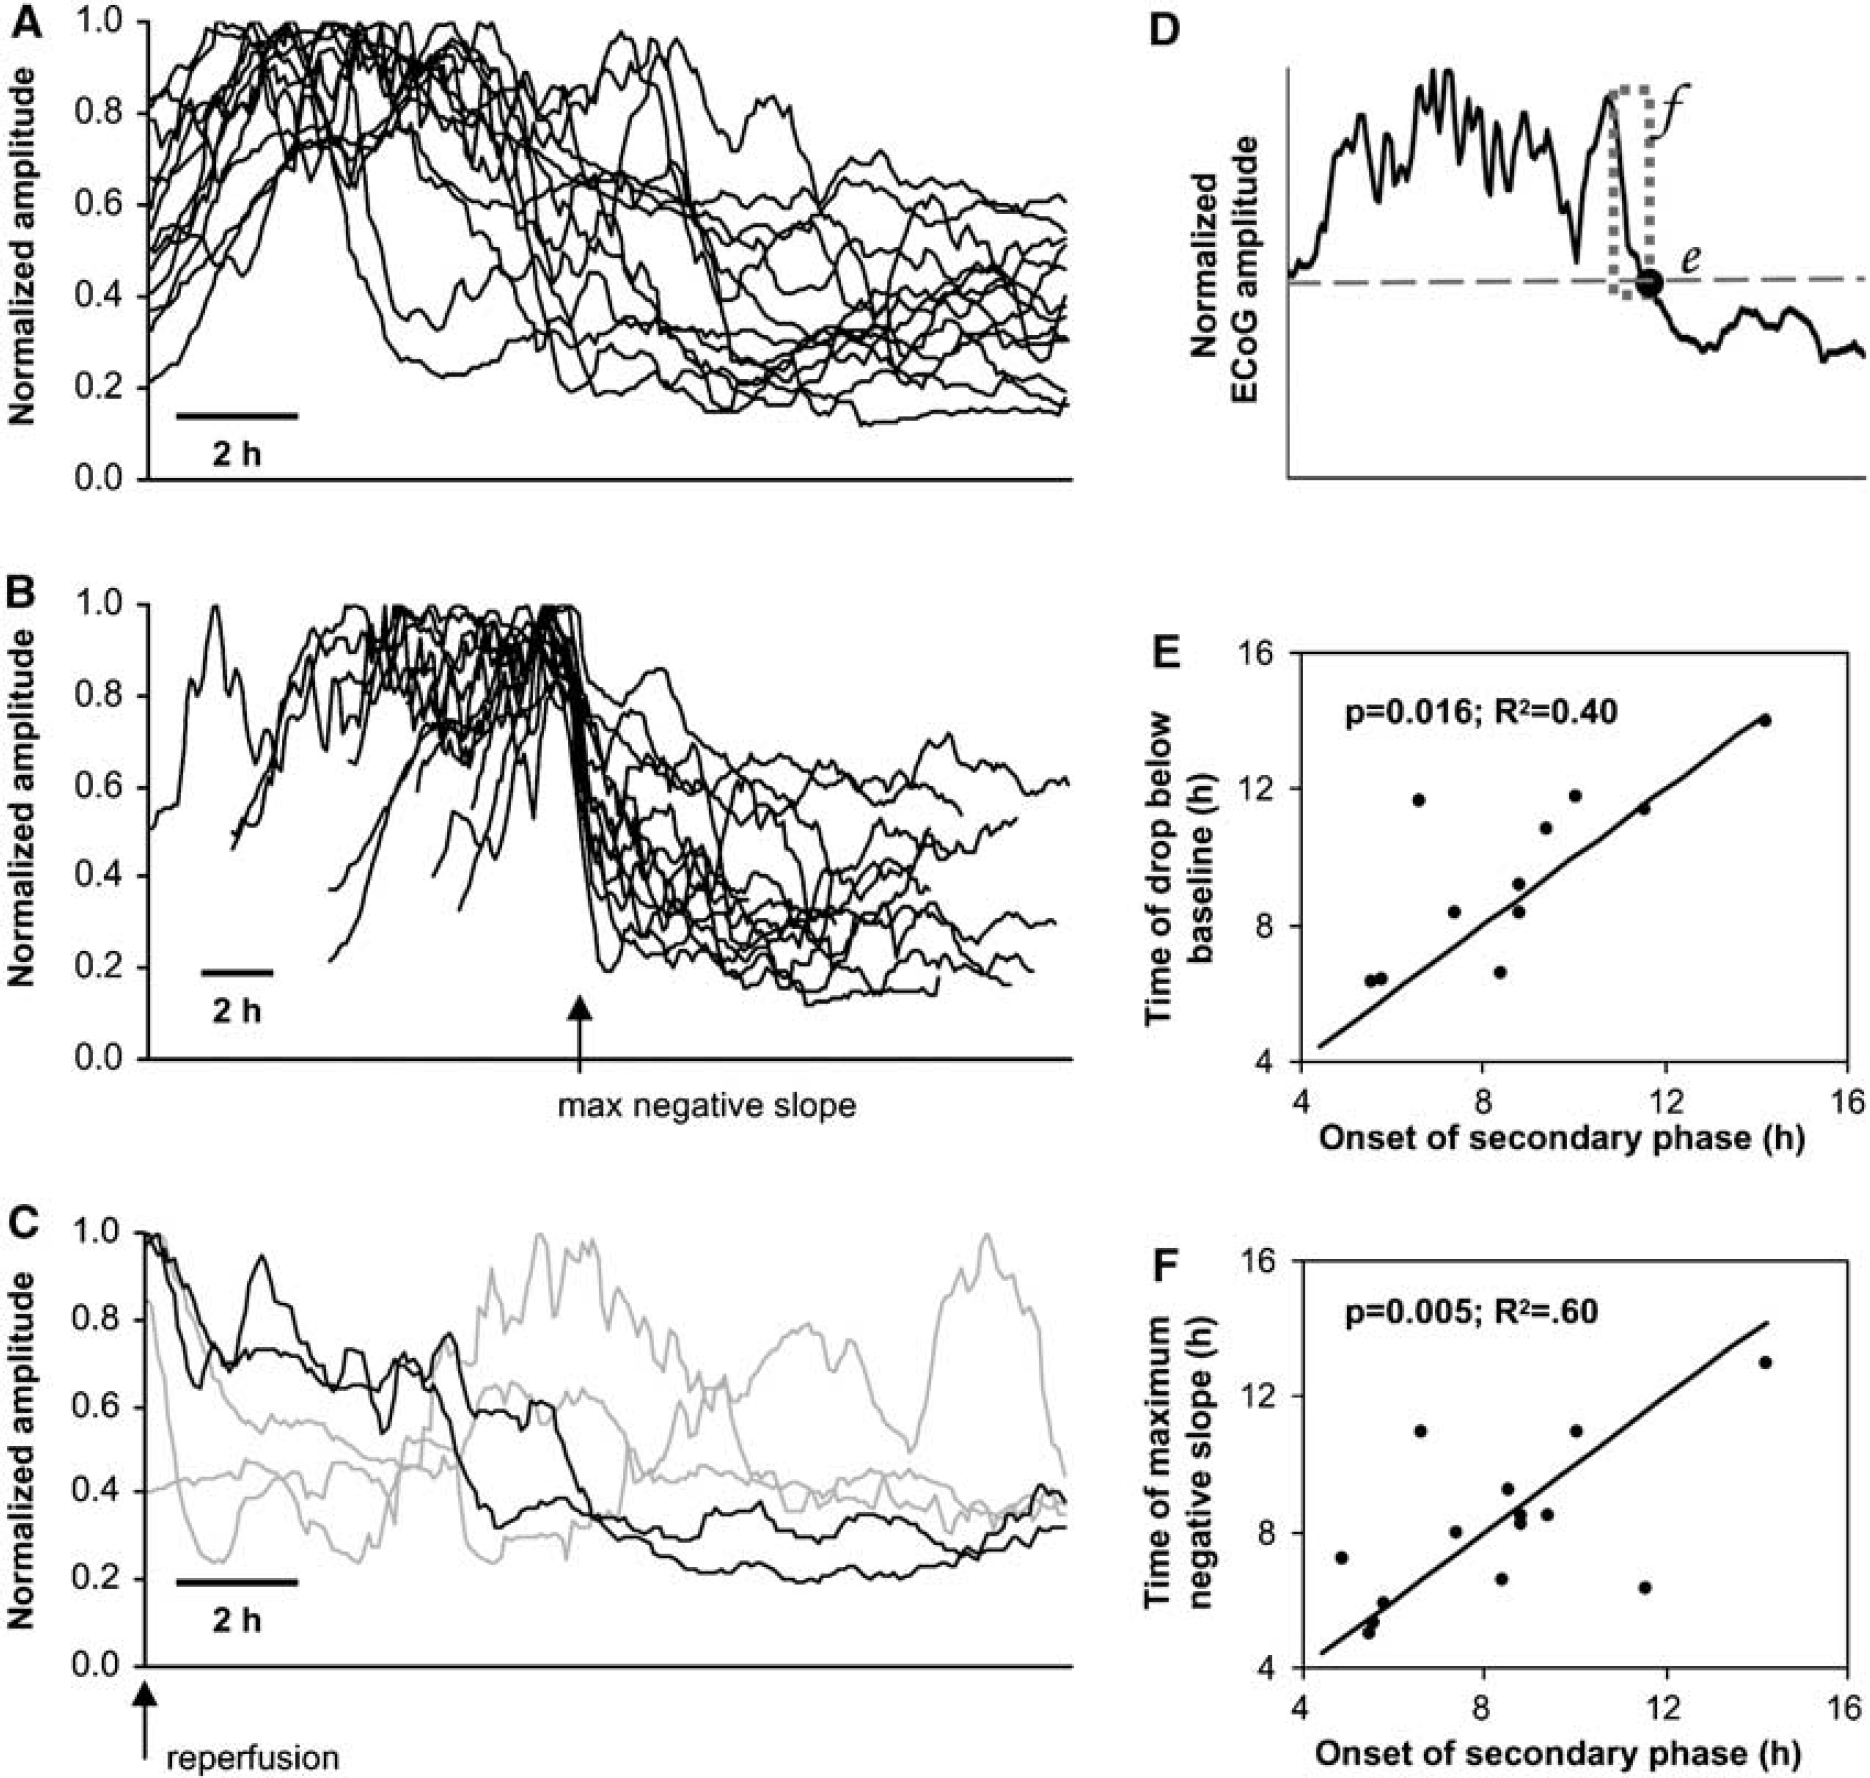
Decrease in electrocorticographic (ECoG) amplitude in reperfusion phase is triggered by onset of delayed peri-infarct depolarizations (PIDs). (
Analysis of individual recordings, as in Figure 1C, strongly suggested that these decrements of ECoG power were caused by the onset of repetitive depolarizations in the secondary phase of PIDs. To objectively assess this relationship, two methods were used to estimate the time of persistent decrement of the ECoG signal (see Materials and methods), as illustrated in Figure 4D: (1) the time of maximal negative slope in the ECoG power trend, and (2) the time at which ECoG power dropped below the intial postreperfusion value. Alignment of ECoG power trend traces according to the time of maximally negative slope (method 1) illustrates further the consistency of these trends as well as the effectiveness of this method for identifying the point of power attenuation (Figure 4B). The time of permanent ECoG decrement, as assessed by both methods, showed significant, positive correlations with the time of the first PID in the secondary, postreperfusion phase (Figures 4E and 4F).
We previously found that the time of onset of the secondary phase of PIDs correlated well with the 24 h infarct volume in 2 h MCAo, with earlier onset times predictive of greater injury (Hartings et al, 2003a). The same significant correlation exists for the present data set (P < 0.01; R2 = 0.53). Because these PIDs cause the attenuation of high amplitude delta activity, we also evaluated the relationship of the above AC-ECoG metrics with 24 h infarct volumes. The times of maximum negative slope (P = 0.02; R2 = 0.39) and drop below baseline (P = 0.07; R2 = 0.33) both showed negative correlations, but only the former measure was statistically significant.
Electrocorticographic Manifestations of Peri-Infarct Depolarizations: Transient Changes
Spreading depression was originally discovered as transient depressions in ECoG amplitude that propagated across the cerebral cortex (Leao, 1944). During 2 h MCAo, however, PIDs evidenced by DC shifts could not be detected in depressions of ECoG amplitude; indeed, ECoG amplitude was already depressed in this period (Figure 2B). This was verified in individual animals by constructing PID-triggered averages of the total ECoG power. As shown in Figure 5A, the amplitude of ECoG power is constant across −10 to + 10 mins relative to PIDs (power spikes reflect seizures). During the period of high voltage delta activity after reperfusion, however, depressions of ECoG amplitude did accompany negative DC shifts, and this was verified by PID-triggered averages (Figure 5B). After the permanent decrement of ECoG power, ECoG behavior reverted to that as observed during MCAo, with no transient ECoG depression during depolarizations (Figure 5C).
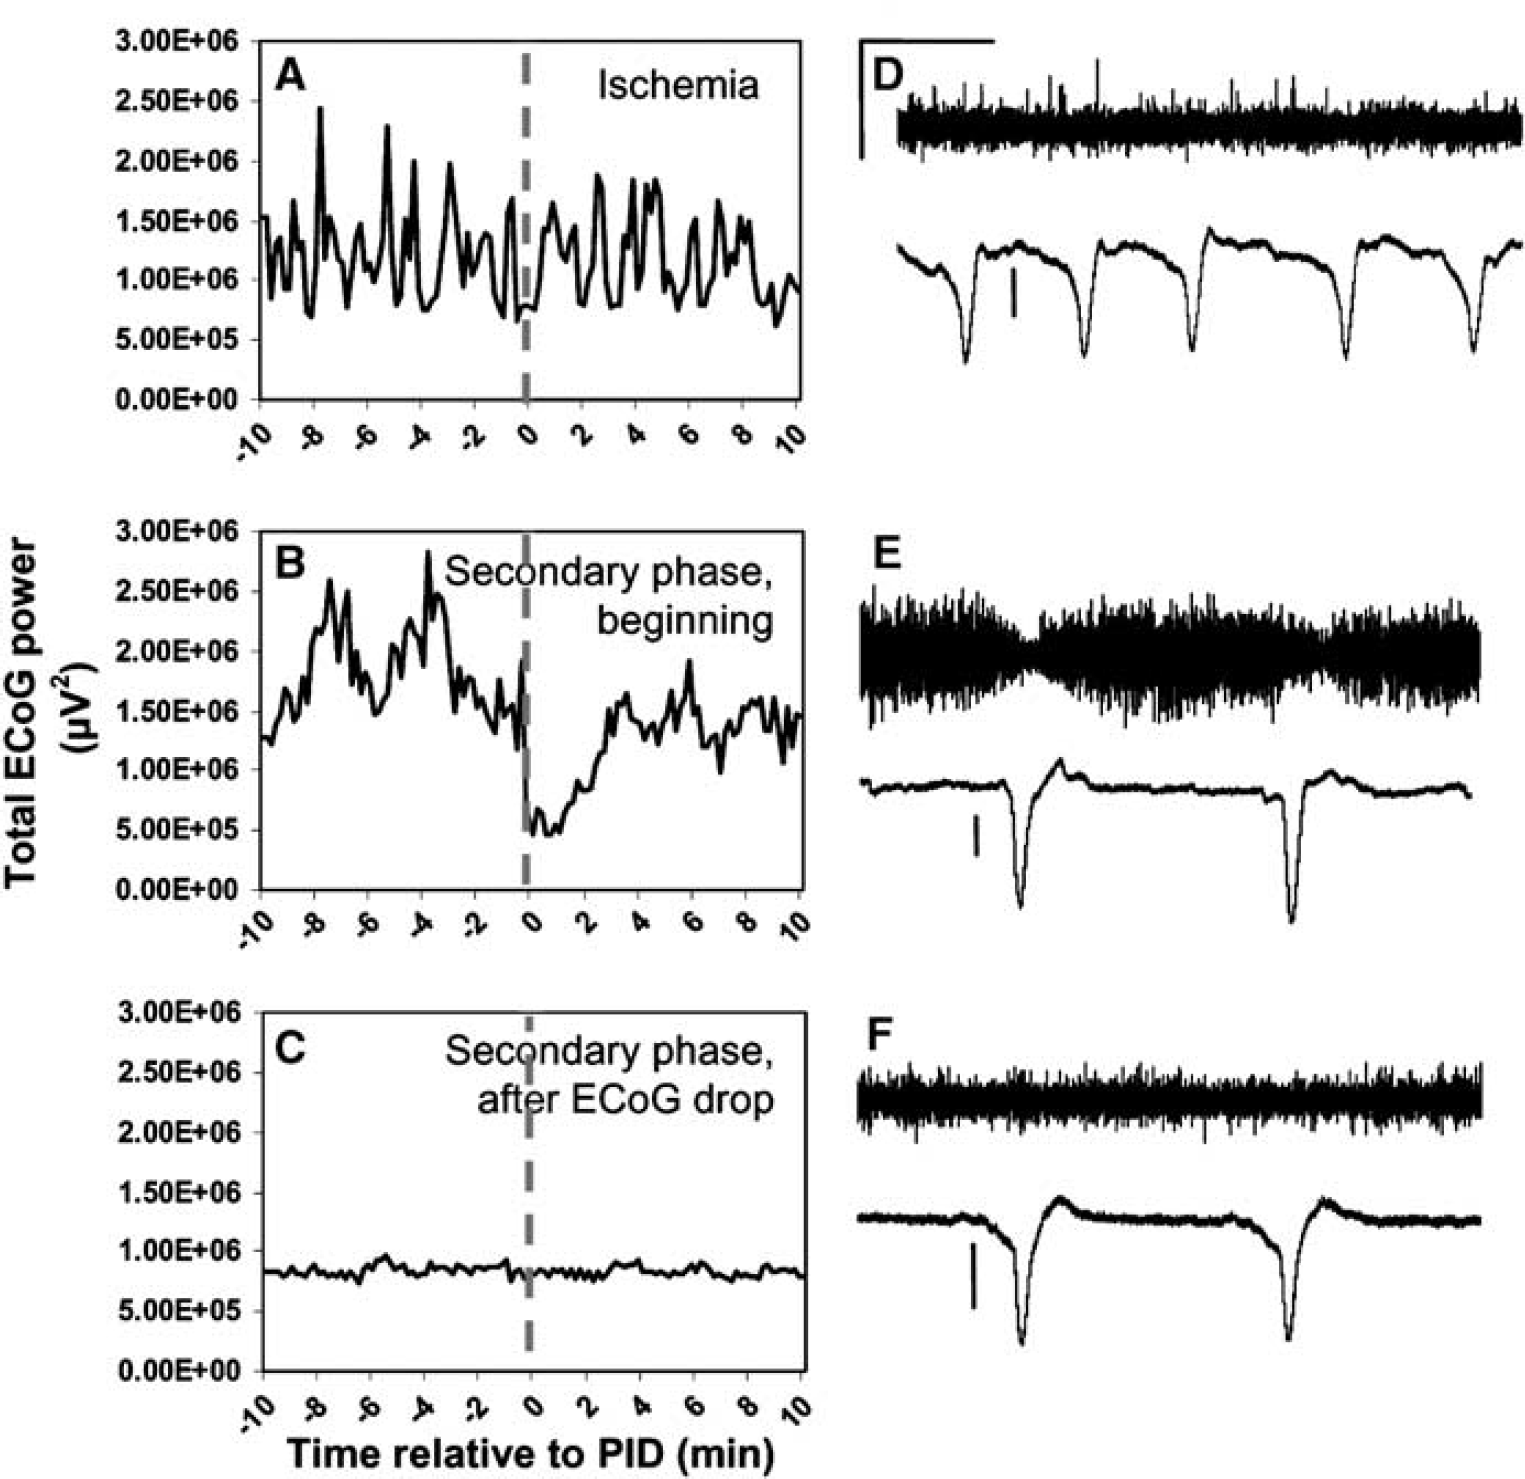
Peri-infarct depolarizations (PIDs) and transient suppressions of electrocorticographic (ECoG) signal. Only in the beginning of the secondary phase are PIDs evidenced as a ∼3-min drop in ECoG amplitude. (
It is possible that ECoG depressions were not apparent in these periods because of the monopolar recording configuration used. Bipolar recordings are optimal for detection of ECoG depression associated with SD/PIDs since activity at both positive and negative electrode locations would contribute to signal attenuation (Sramka et al, 1977/78). To test this, we also made bipolar recordings from pre-sumed penumbral regions, with 3 mm separating the screw electrodes. In these animals, the results from our monopolar recordings were confirmed. Figures 5D–F show bipolar recordings during ischemia, the start of the secondary phase, and several hours later after persistent ECoG amplitude decrement. Only at the start of the secondary phase, with high amplitude delta dominating spontaneous activity, are transient ECoG depressions evident.
Electrocorticographic Baseline Shifts Reflect Depolarizations
Although PIDs were not always manifested as depressions of 0.3 to 35 Hz ECoG activity in our recordings, prominent baseline shifts in the AC-amplified ECoG recordings always occurred coincident with DC negativities when a low high-pass cutoff setting (0.03 Hz) was used to record ECoG. Figure 6 shows simultaneous DC and 0.03 Hz high-pass filtered ECoG recordings, showing the temporal relationship between signals. Essentially, the baseline ECoG potential reflects the derivative of the DC potential. The times of maximal negative and positive slope in the DC potential (dashed line in Figure 6) coincide with troughs and peaks of the ECoG as well as the calculated derivative of the DC signal. The derivative nature of the baseline shift is because of the capacitative coupling in the AC amplification, which causes current flow only in response to changes in voltage as the capacitor is charged. Thus, the stereotyped baseline shift consists of two prominent phases, an initial negative and subsequent positive phase. A second negativity is present if there is positive overshoot in the DC potential, reflecting a hyperpolarization that usually follows the negative shift (e.g., see Figures 5E and 5F). The baseline shift can be extracted from the ECoG signal with preservation of temporal fidelity by low-pass filtering (e.g., 0.2 Hz; Figure 6). Finally, these baseline shifts reliably captured depolarization events regardless of whether suppression of higher frequency (0.3 to 35 Hz) signals was present (Figure 6A) or not (Figure 6B).
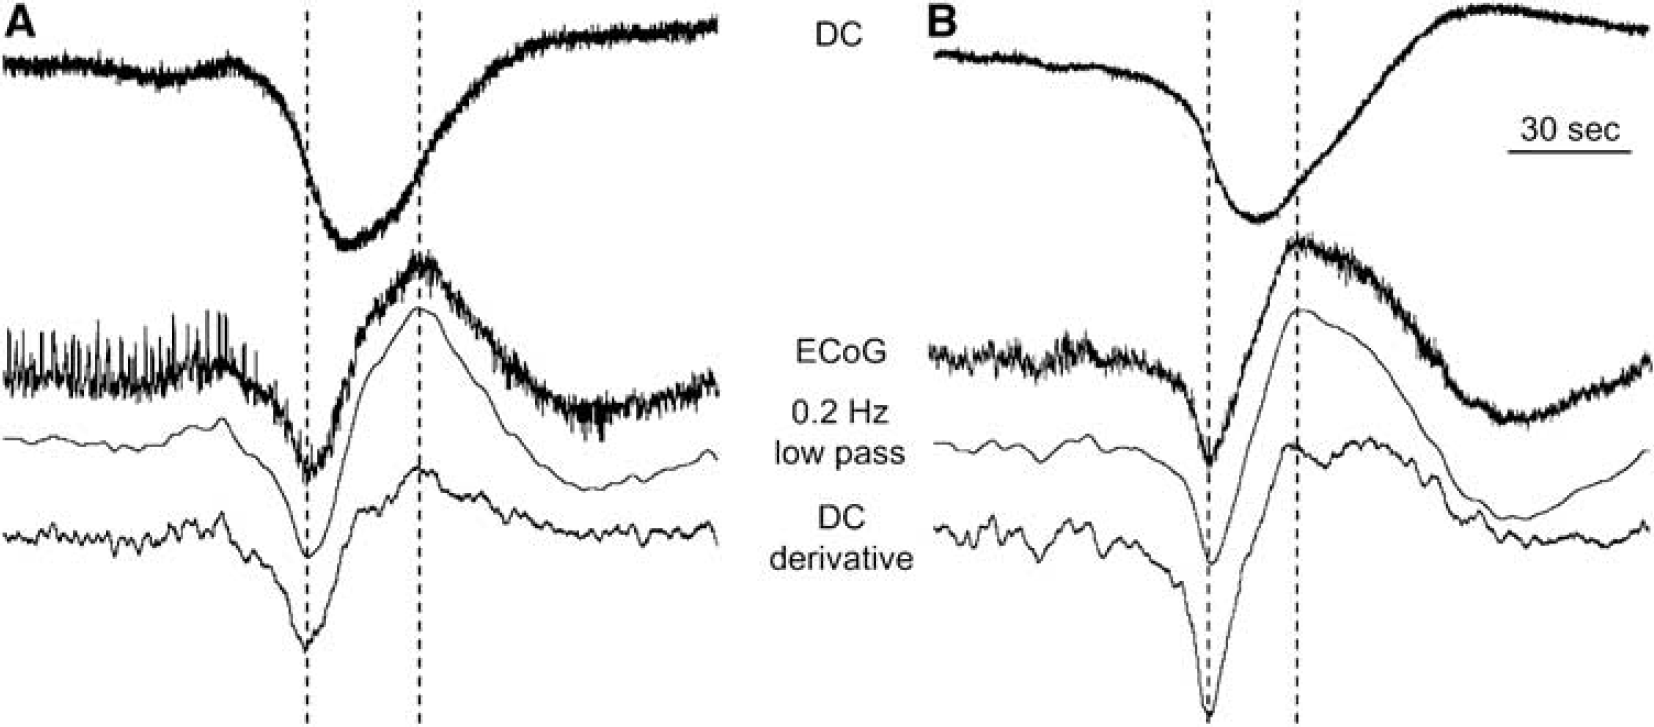
Depolarizations (DC shifts) are evidenced as baseline shifts in AC-amplified electrocorticographic (ECoG) recordings. Simultaneous recordings of DC potential (top traces) and ECoG with 0.03 Hz high-pass cutoff during periods before (
Discussion
The ischemic penumbra was originally defined electrophysiologically as the peri-infarct region in which cerebral blood flow (CBF) reductions are sufficient to cause suppressed spontaneous and evoked electrical activity, but not to cause metabolic failure and loss of cellular membrane integrity, as indicated by negative DC potential shifts (Astrup et al, 1981). Here, we have investigated the progressive deterioration of cerebral cortical activity in association with initial and delayed, secondary phases of injury after 2 h MCAo by monitoring spontaneous ECoG and DC potential. Our central finding is that the delayed, secondary phase of PIDs occurring several hours after reperfusion produce marked, persistent decrements in ECoG amplitude with characteristics similar to those during ischemia. These results suggest that delayed PIDs after reperfusion have deleterious effects associated with a multifactorial secondary injury process that can be monitored by AC-amplified ECoG recordings.
During 2 h MCAo, PIDs did not produce transient suppressions of the ECoG signal, which was already depressed because of ischemia. After reperfusion, ECoG amplitude progressively increased with the development of high amplitude delta wave abnormalities. These pathologies presumably correlate with the period of hyperemia occurring after reperfusion (Toyota et al, 2002). After several hours, initial PIDs in the secondary phase produced transient ECoG depressions that accumulated in a progressive, persistent decrement of spontaneous activity. The onset of secondary phase PIDs correlated with objective measures of the onset time of this persistent decrement. In this depressed state, ECoG amplitudes and waveforms were similar to those during ischemia, and, as during ischemia, PIDs were evidenced only in the slow DC potential negativity, and not in further suppressions of spontaneous ECoG.
In cat MCAo, progressive and persistent reduction of ECoG activity evidenced the deleterious effects of PIDs and was predictive of larger resulting infarctions (Ohta et al, 2001). Similarly, the present results suggest that depolarizations after ischemia–reperfusion have harmful effects characteristic of PIDs, rather than innocuous (Nedergaard and Hansen, 1988) or cerebro-protective (see Otori et al, 2003) SD in the uninjured cortex. This is further supported by the failure of PIDs to induce transient ECoG depressions during the late reperfusion period, which suggests that tissue in the vicinity of the electrodes was induced to a ‘penumbral’ state of attenuated spontaneous activity by initial PIDs of the secondary phase. While spontaneous activity (100 to 200 μV) was not completely abolished (i.e., isoelectric) in this or the MCAo period, it is probable, with the low impedance electrodes used, that this activity is recorded from a much broader volume of tissue than is subjected to depolarization. This fact could explain the failure to observe depressed ECoG transients during PIDs (i.e., depressions are too local relative to the source of the signals), but other results refute this: (1) ECoG depressions were observed initially during the secondary phase, and (2) bipolar recordings with very low spontaneous activity (∼25 μV) also showed no ECoG depressions with PIDs during MCAo and late reperfusion.
Peri-Infarct Depolarizations and Delayed Secondary Pathology
A delayed secondary phase of injury after reperfusion is well established in focal cerebral ischemia and reflects a multifactorial process leading to infarct maturation. After prolonged ischemia followed by reperfusion, there is initially a period of hyperperfusion followed by progressive and sustained hypoperfusion (Kagstrom et al, 1983; Tortella et al, 1989; Karibe et al, 1994). After reperfusion in transient MCAo of the cat, the delayed reduction of CBF is associated with elevation of extracellular glutamate and suppression of evoked potentials, suggesting development of penumbral conditions (Taguchi et al, 1996). In a malignant course, decreased CBF is further associated with depression of cerebral perfusion pressure, elevated intracranial pressure (ICP), and cerebral edema (Toyota et al, 2002, 2003). Similarly, in rat transient MCAo, reperfusion affords recovery of DW-MRI abnormalities, but with a later delayed recurrence of apparent lesions attributed to blood–brain barrier breakdown and vasogenic edema formation (Neumann-Haefelin et al, 2000). Amino acids also show delayed elevation in the reperfusion phase (Matsumoto et al, 1996).
The time course of this delayed secondary pathology closely matches the onset and time course of secondary phase PIDs we have described and implicates PIDs as an integral mechanism in these secondary processes (Hartings et al, 2003a). Although the chronic recording techniques used here preclude simultaneous ICP and CBF monitoring, a delayed onset of short and long depolarizations was recently shown to be closely associated with transient and persistent increases of ICP and reduced CBF in cat striatum after MCAo (Umegaki et al, 2005). Permanent occlusion was used in that study, but the same association between depolarizations, elevated ICP, and reduced CBF likely exists in the transient MCAo model as well. Permanent and transient MCAo produce a delayed secondary phase of PIDs with similar times of onset (Hartings et al, 2003a).
A causal sequence of these secondary events is difficult to establish, but it is probable that PIDs contribute to the development of secondary pathologies including edema and reduced CBF. Spreading depression increases blood—brain barrier permeability by activating brain matrix metalloproteinases (Gursoy-Ozdemir et al, 2004) and is speculated to induce vasogenic edema (Dreier et al, 2005). The PIDs may further contribute to intracranial hypertension through cytotoxic edema, because neuronal and glial swelling associated with SD is permanent under simulated penumbral conditions (Kempski et al, 2000). Peri-infarct depolarizations also reduce microcirculation (Pinard et al, 2002) and may depress CBF (Strong et al, 2003), thus exacerbating hypoperfusion. Most probably there is a feedback cascade involving each of these factors, as it is suggested that delayed secondary PIDs may be triggered in turn by ischemia consequent to edema and elevated ICP (Umegaki et al, 2005).
Peri-Infarct Depolarizations and Seizures
In his original description of SD, Leao (1944) reported the occurrence of SD in association with tonic-clonic discharges, and van Harreveld and Stamm (1955) later showed that stimulus-evoked seizures could terminate with the onset of SD. The sequential occurrence of these events has been reported in a variety of animal models (Somjen and Aitken, 1984; Siesjo et al, 1985; Guedes et al, 1987; de Azeredo and Perret, 1992) and their putative relationship may be relevant to clinical pathology (Donnet and Bartolomei, 1997).
The discovery of both NCS and PIDs in our long-term recordings raised suspicion that these activities are indeed causally linked in focal ischemia. To investigate this, we cross-correlated the time of seizure onset (or offset) with the times of PIDs in the same recordings. This analysis showed that NCS and PIDs have no consistent temporal relationship to each other. However, the number of NCS events was significantly correlated to the number of PIDs during 2 h MCAo, suggesting common or mutually facilitatory pathological triggers. Indeed, in vitro studies have shown that seizures and SD can be elicited at different thresholds of the same stimulus, whether electrical (Hablitz and Heinemann, 1989) or chemical (Borck and Jefferys, 1999; see also Kager et al, 2000). In human neocortical slices, elicitation of SD enhances the occurrence and amplitude of spontaneous, rhythmic sharp field potentials, suggesting an enhancement of excitability contributing to development of ictal discharges (Gorji and Speckmann, 2004). Detailed spatial mapping is required to further study the interaction of these phenomena in focal ischemia, because epileptiform discharges may block or redirect SD propagation (Koroleva and Bures, 1982).
Continuous Electroencephalography/Electrocorticography
Diagnostic and prognostic applications of quantitative EEG have proven useful in clinical stroke (Murri et al, 1998; Cuspineda et al, 2003). Continuous EEG, however, has been used mainly for diagnosis of NCS and nonconvulsive status epilepticus (Jordan, 1993; Afsar et al, 2003; Vespa et al, 2003; Hirsch, 2004) and warrants further study for monitoring of ischemic progression and clinical management (Jordan, 1999, 2004). The present results support the view that a continuous, quantitative EEG approach may be useful to monitor the acute clinical course of stroke patients in real time. Long-term trend monitoring revealed the onset of ECoG power loss and suppression of delta activity associated with developing secondary pathology. While it is unlikely that scalp EEG could detect depressions associated with individual depolarizations, it may well detect a progressive, persistent decline resulting from repetitive PIDs over a sufficient volume of penumbral tissue. This seems particularly plausible when prior activity is dominated by delta waves such as PDA or PLEDs, which may provide a high amplitude background for contrast with subsequently depressed EEG. Interestingly, lesion maturation in clinical stroke was recently shown to correspond to acute decreases in EEG delta power, and this metric correlated better than DW-MRI lesion volume with 30-day scores on the National Institutes of Health Stroke Scale (NIHSS) (Finnigan et al, 2004). Continuous measures of interhemispheric EEG symmetry in stroke also correlated with admission scores on the NIHSS and captured EEG power decrements similar to those described here (van Putten and Tavy, 2004).
Finally, we found it is possible to record the DC negativities associated with PID/SD in shifts of the baseline amplitude of the ECoG with the high pass filter broadened to a 0.03 Hz cutoff. These shifts have a high signal-to-noise ratio and recognizable, stereotyped patterns, since they signal the derivative of the DC potential with considerable temporal fidelity. A similar approach is being used by COSBID (Co-Operative Study of Brain Injury Depolarisations; www.cosbid.org) to detect SD/PIDs in recordings from subdural electrode strips (Strong et al, 2002; Fabricius et al, 2003). Although the spatial sampling of scalp EEG electrodes is poor, whether they can detect the signatures of developing secondary injury and/or PIDs described here may warrant clinical investigation. In particular, a full-band EEG approach may be particularly suited to detection of DC or baseline shifts and expand the application of EEG in continuous monitoring of brain injury (Vanhatalo et al, 2005).
Footnotes
Acknowledgements
We thank Drs Martin Fabricius and Martin Lauritzen for thoughtful discussions and comments. The views of the authors do not purport or reflect the position of the Department of the Army or the Department of Defense (para 4-3, AR 360-5).