
Abstract
Peri-infarct depolarizations (PIDs) contribute to the evolution of focal ischemic lesions. Proposed mechanisms include both increased metabolic demand under conditions of attenuated perfusion and overt vasoconstrictive responses to depolarization. The present studies investigated the relative contributions of metabolic and perfusion effects to PID-associated infarct expansion during middle cerebral artery (MCA) occlusion in the Spontaneously Hypertensive Rat. The initial distribution of ischemic depolarization (ID) was established within minutes after MCA occlusion at a cerebral blood flow threshold of ∼40 mL/100 g per minute, with expansion of the depolarized territory during 3hours detected in half of the animals. Peri-infarct depolarizations were associated with transient metabolic responses, comparable to those observed after spreading depression, with no evidence of cumulative energy failure after multiple transient depolarizations during 1 hour. Speckle contrast imaging of PID-associated flow transients documented prominent distal hyperemic flow responses that became progressively attenuated in regions of already impaired perfusion, with modest propagated flow decreases more proximal to the ischemic core. However, sporadic PIDs were associated with persistent decrements in perfusion, increasing tissue volume below the threshold for energy failure, ID and infarction. These latter, comparatively rare, events can account for the pattern of stepwise infarct expansion in this model.
Introduction
Recurrent peri-infarct depolarizations (PIDs) are long-recognized features of an evolving lesion in acute experimental stroke (Branston et al, 1977). They also occur in patients after ischemic stroke (Dohmen et al, 2008), and their observation after diverse brain insults has renewed interest in their pathophysiological significance (Lauritzen et al, 2010). Peri-infarct depolarizations are proposed to exacerbate brain injury by two interactive mechanisms, involving effects on metabolism and perfusion.
Even in normally perfused brain, cortical spreading depression (CSD) sufficiently increases metabolic demand to transiently deplete ATP (Mies and Paschen, 1984), with minutes or tens of minutes required to restore glucose and lactate to control levels (Hashemi et al, 2009; Mies and Paschen, 1984; Silver and Erecińska, 1994). Oxygen utilization can remain elevated for > 1 hour after CSD (Piilgaard and Lauritzen, 2009). Such metabolic impacts appear to be amplified under conditions of limited substrate availability during PID in the ischemic penumbra (Selman et al, 2004). Delayed metabolic recovery is associated with more prolonged depolarization in such regions (Branston et al, 1977; Mies, 1997), and persistent expansion of depolarized territory occasionally follows passage of a PID (Higuchi et al, 2002). Progressive calcium accumulation with increasing depolarization duration is a suggested mechanism by which PIDs could contribute to expanded tissue damage (Ohta et al, 2001), and transient dendritic pathology has recently been linked to local depolarization (Risher et al, 2010). However, the role of cumulative metabolic challenge is difficult to separate from the underlying cerebral blood flow (CBF) deficit.
Depolarizations have complex effects on cerebral perfusion. In normal brain, the predominantly hyperemic responses to CSD facilitate metabolic recovery. Hyperemia is also apparent after PID in penumbral regions having adequate collateral perfusion, but is blunted in regions of more severe flow impairment (Back et al, 1994; Nallet et al, 2000). Peri-infarct depolarization-induced hyperemia may steal from adjacent territory more proximal to the ischemic core (Pinard et al, 2002). The anatomical distribution of hyperemic versus hypoperfusive components of peri-infarct flow transients is consistent with such a pattern of differential response along the perfusion gradient in experimental stroke in both cats (Strong et al, 2007) and rats (Kumagai et al, 2010; Luckl et al, 2009). There can also be lasting vasoconstrictive responses to depolarization. Local vasoconstriction is proposed as the primary mechanism underlying both transient and persistent CBF reductions accompanying PIDs in cats (Strong et al, 2007). Hypoperfusion can be the predominant flow response to depolarization in mice, and incremental expansion of ischemic territory can accompany PID in this species (Shin et al, 2006). Cortical spreading depression-induced flow reductions are more pronounced in rats under conditions of hypotension and hypoxia (Sukhotinsky et al, 2008). Moreover, CSD leads to prolonged vasoconstriction and overt ischemia in rats under conditions of reduced nitric oxide and elevated K+ that mimic subarachnoid hemorrhage (Dreier et al, 1998). Prolonged hypoperfusion is observed after propagated depolarizations in human brain after hemorrhage (Dreier et al, 2009).
Anesthesia impacts cerebral perfusion, and can contribute to systematic differences in the hemodynamic response to, and metabolic impact of, depolarization. Normalization of glucose and lactate levels after spreading depression appears to be delayed in animals anesthetized with α-chloralose (Hashemi et al, 2009) relative to the glucose recovery time under barbiturate anesthesia (Silver and Erecińska, 1994). Halothane better maintains perfusion and attenuates infarct expansion relative to α-chloralose during prolonged anesthesia after middle cerebral artery (MCA) occlusion in cats (Saito et al, 1997). Recent studies of PIDs and their impact on cerebral perfusion during experimental stroke have largely used α-chloralose anesthesia (Strong et al, 2007).
The relative contributions of metabolic and perfusion responses to infarct expansion after PIDs remain unclear. The present study used a highly reproducible model of permanent focal ischemia in the Spontaneously Hypertensive Rat (SHR), in which sporadic PID-associated lesion expansion is known to occur (Higuchi et al, 2002), to examine the mechanistic relationships between CBF, depolarization, metabolism and histopathology during acute infarct evolution. The impact of anesthesia selection on perfusion responses to depolarization was also examined.
Materials and methods
Experimental Animals and Study Designs
Male 250 to 300g SHRs were obtained from Taconic Farms (Hudson, NY, USA) or Harlan Laboratories (Indianapolis, IN, USA). Focal ischemia was produced by tandem MCA and ipsilateral common carotid artery (CCA) occlusion (Brint et al, 1988), according to protocols approved by the Institutional Animal Care and Use Committee.
Study 1: The CBF threshold for ischemic depolarization (ID), and the anatomical relationship between acute depolarization and histopathology, were evaluated in 13 rats. Animals were subjected to permanent focal ischemia and the distribution of persistently depolarized cortex was assessed by periodically monitoring direct current (DC) potential at a series of positions distributed lateral to the midline. In eight of these rats, regional CBF was determined autoradiographically after 30 minutes occlusion, and CBF and depolarization status were compared at each recording position to define the perfusion threshold for ID. In another five rats recording continued for 3 hours and histopathology was evaluated 24 hours after occlusion to define the relationship between the acute depolarization time course and histological status.
Study 2: The metabolic impact of PIDs was assessed in 16 rats. Animals were subjected to permanent MCA/CCA occlusion (14 rats) or a sham procedure (2 rats) and the distribution and time course of both persistent ID and transient PIDs were evaluated using microelectrode arrays. Brains were frozen in situ 1 hour after MCA occlusion, during or up to 30 minutes after occurrence of a PID. Levels of ATP, phosphocreatine (PCr), glucose, and lactate were determined in microdissected tissue samples obtained between recording electrodes to define the distribution and time course of metabolic change in relation to depolarization status.
Study 3: Cerebral blood flow deficits and responses to PID were mapped using laser speckle contrast perfusion imaging. Rats were maintained under anesthesia with halothane (n = 7) or transitioned to α-chloralose following initial surgical preparation under isoflurane (n = 9). The distribution, magnitude, and frequency of PID-associated flow changes were continuously monitored during 4 hours ischemia.
Focal Ischemia
Rats were fasted overnight and anesthetized with 2% halothane (isoflurane in some perfusion imaging studies) in 70% nitrogen and 30% oxygen. A catheter (PE-50) was inserted into the tail artery for blood pressure monitoring and sampling. Rats were intubated, ventilated, and positioned in a stereotaxic apparatus, and anesthesia was reduced to 1%. Blood pressure was continuously recorded. Blood gases, pH, glucose, and hematocrit were measured at 30-minute intervals. Physiological parameters are documented in Supplementary Table S1. Body temperature was kept at 37.0 ± 0.5°C using a rectal thermistor and feedback control.
The right CCA was exposed via a midline incision, and either cauterized (perfusion imaging studies) or fitted with a Teflon/Silastic occluder (electrophysiological studies). The right MCA was accessed by a transtemporal approach (Brint et al, 1988). After partial excision of the temporalis muscle, a 2-mm burr hole was drilled 2 to 3 mm rostral to the fusion of the zygoma with the squamosal bone, and the dura pierced to expose the MCA 1 mm dorsal to the rhinal fissure. All manipulations were done under a warmed saline drip, keeping brain surface temperature at 37.0 ± 0.5°C (Kaplan et al, 1991). Ischemia was initiated by tightening the carotid occluder (unless previously cauterized) and the MCA was lifted and cauterized using a micromanipulator-controlled stainless steel hook. For sham operations, the vessels were manipulated but not occluded. Total anesthesia duration before occlusion was 2 to 3 hours. In survival experiments, surgical incisions were closed, anesthesia discontinued, animals weaned from the ventilator, and temperature controlled until thermal homeostasis was maintained.
Electrophysiological Recording
DC potentials were recorded with single electrodes (Study 1) or 3-electrode arrays (Study 2). Electrodes were borosilicate pipettes fitted with Ag-AgCl leads, filled with physiological saline, with tip diameter < 5 μm and a resistance of 2 to 4 MΩ. For regional CBF measurements (Study 1) electrodes included 5 mg/mL fluorescein and were connected to a microinjector for dye infusion. Reference electrodes filled with 1 M KCl were placed on a neck muscle.
In Study 1, burr holes were drilled and the dura incised at 1 mm intervals 1 to 6 mm lateral to the midline, 2 mm caudal to bregma (Figure 1). Baseline DC potentials were recorded with a single electrode inserted for several minutes at each position, previously zeroed in the pool of saline superfusate overlying the burr hole. Middle cerebral artery and CCA were then occluded. For the CBF study, DC potentials were recorded sequentially, beginning at the most lateral position and proceeding medially for 5 minutes at each location. After each recording, the site was labeled by dye injection (0.5 μl). Terminal CBF was assessed 30 minutes after occlusion. For the histology study, local depolarization status was assessed at 15 minutes and 1, 2, and 3 hours after occlusion.
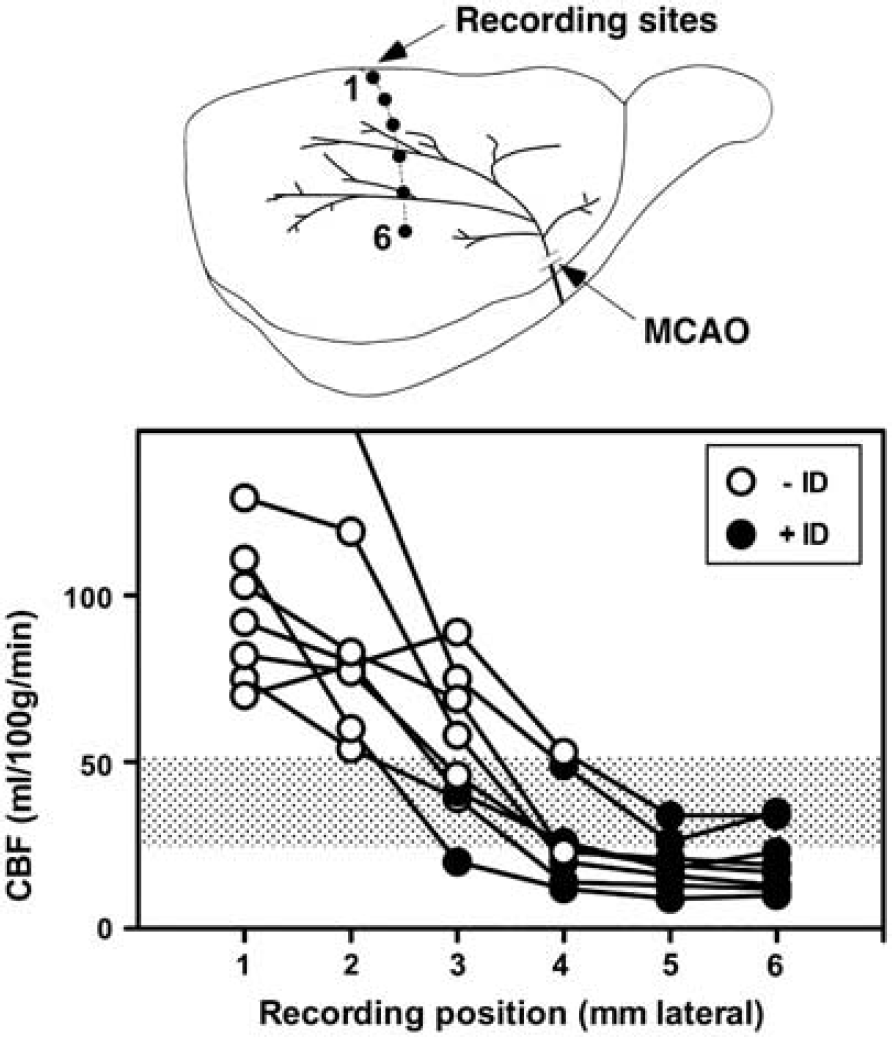
Cerebral blood flow (CBF) threshold for ischemic depolarization. Rats (n = 8) were prepared for electrophysiological recording at sites 1 to 6 mm lateral, 2 mm caudal to bregma, and subjected to middle cerebral artery occlusion (MCAO). The status of each site was documented as persistent ischemic depolarization (+ ID, closed circles) or no sustained depolarization (−ID, open circles), after which tracer was infused at 30 minutes after occlusion and brains sectioned for determination of regional CBF by quantitative autoradiography. The average of blood flows at adjacent + ID and -ID electrode sites defined a threshold for ischemic depolarization of 38 ± 13 mL/100 g per minute (shaded bar).
In Study 2, each rat was fitted with an array of three electrodes in a mediolateral orientation to allow continuous measurement of DC potentials in cortex experiencing varied CBF deficits (Figure 2A). Burr holes were 1, 2, and 3 mm lateral (2, 3, or 4 mm caudal to bregma, n = 4, 1, and 6, respectively) or 3, 4, and 5 mm lateral (2 mm caudal to bregma, n = 3 each). Halothane was decreased to 0.6%, and electrodes inserted after a 15-minutes equilibration period. After baseline recording, the MCA and CCA were occluded and DC potentials continuously monitored for 1 hour, after which brains were frozen in situ in varied temporal relationship to a PID. Sampled tissue regions were categorized as: ND (no depolarization), medial to an electrode site at which no depolarization had been detected; ID (ischemic depolarization), lateral to an electrode showing persistent depolarization throughout the recording period; RD (recurrent depolarization), between electrode pairs at both of which only transient depolarizations had been recorded; ID-RD and RD-ND, between electrodes showing the indicated responses.
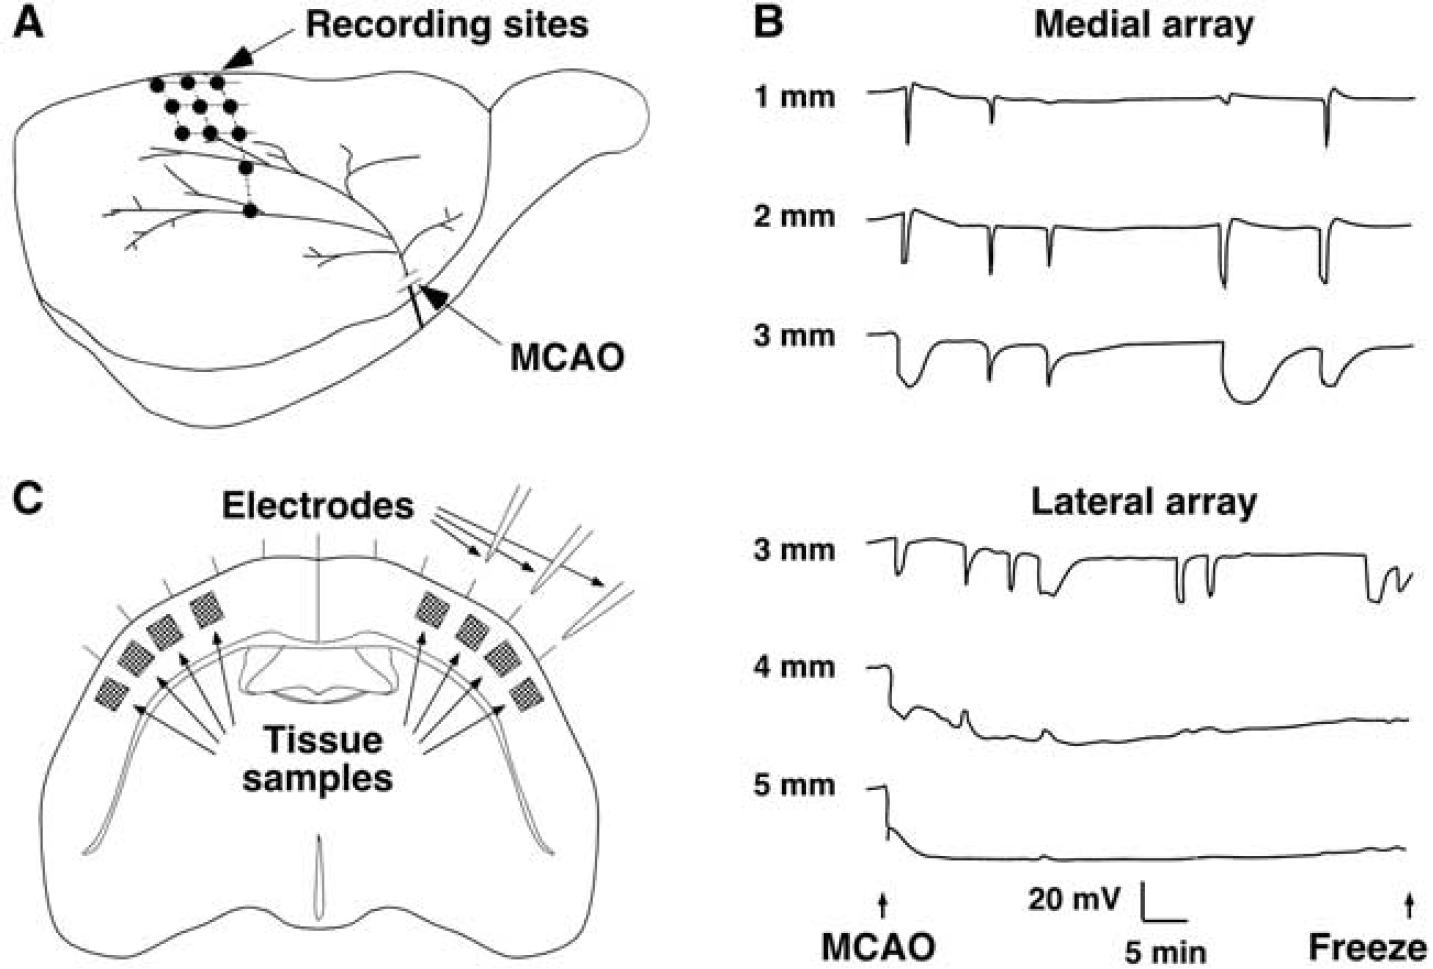
Recording and tissue sampling sites for metabolite studies and the distribution of peri-infarct depolarization. (
Autoradiographic Assessment of Cerebral Blood Flow
Regional CBF was measured by an indicator fractionation method using [14C]iodoantipyrine (Van Uitert et al, 1981). Rats were instrumented with a jugular catheter for tracer infusion and a femoral catheter for blood withdrawal. Isotope (30 μCi in 0.4 mL saline) was administered as arterial blood was sampled at a rate of 1 mL/min using a syringe pump. After 6 seconds, the animal was decapitated and blood sampling simultaneously stopped. Brains were removed and frozen in hexane at −45°C, and serial 20 μm coronal sections were collected at 0.5 mm intervals. Fluorescein-labeled recording sites were identified under ultraviolet illumination and the slide marked for subsequent alignment with autoradiographic images. Regional brain isotope levels were determined based on simultaneously exposed 14C calibration standards. Aliquots of blood were dissolved and counted in scintillation fluid, and the ratio of brain to blood radioactivity was used to calculate regional CBF.
Perfusion Imaging
Rats were surgically prepared for MCA occlusion. In addition, the scalp was retracted and the dorsal skull bilaterally thinned to transparency using a diamond bit under continuous saline superfusion, increasing anesthesia levels to 3% to 4% during this procedure. Skull surface temperature was thereafter maintained by superfusion with warmed saline. Perfusion distribution was evaluated by laser speckle contrast imaging (Dunn et al, 2001) using a commercially available instrument package (FLPI, Moor Instruments, Inc., Wilmington, DE, USA). Frames (152 × 113 pixels, ∼125 μm/pixel) were sampled with an exposure time of 4 ms, and calculated flux images were displayed once per second. Regions of interest were selected for continuous data collection at 1 second intervals and full field images were stored every 30 seconds. The latter were used to retrospectively evaluate flow changes in additional regions at lower temporal resolution, but with more precise anatomical localization. Baseline signal was monitored for 30 minutes, then vessels were occluded and animals repositioned to resume recording ∼5 minutes after the onset of ischemia. In a subset of animals, isoflurane was then replaced by α-chloralose (initial 50 mg/kg bolus i.v. infusion during 5 minutes, followed by 30 mg/kg per hour continuous infusion beginning at 1 hour), administered as the 2-hydroxy-propyl-β-cyclodextrin complex (Sigma-Aldrich, St Louis, MO, USA). Regional CBF (mL/100 g per minute) was calculated from recorded flux images according to a linear relationship (CBF = 0.105 × flux-13) established in preliminary calibration studies (Supplementary Figure S1).
Tissue Extracts and Metabolite Assays
Brains were frozen in situ with liquid nitrogen (Pontén et al, 1973) and stored at −70°C. Four tissue samples were taken from regions between electrodes and at either end of the array by inserting a sharpened 18 G tubing adapter through the skull, with temperature maintained at −20°C during sampling, and four additional tissue samples were taken at mirror sites in the contralateral hemisphere (Figure 2C). Tissue plugs were cut to obtain cortical samples at the depth of the electrode tips. Frozen samples (0.62 ± 0.15 mg) were weighed, crushed, and extracted with 100 μl of 3 M perchloric acid at −10°C for 15 minutes (Lowry and Passonneau, 1972), followed by addition of 300 μl of 1 mmol/L EDTA at 4°C. After centrifugation, the supernatant was neutralized with 120 μl of 400 mmol/L imidazole buffer and stored at −70°C. ATP and PCr were measured by a luciferin/luciferase method (Lust et al, 1981). Lactate and glucose were assayed fluorimetrically (Lowry and Passonneau, 1972).
Histological Evaluation
In Study 1, rats were reanesthetized 24 hours after occlusion and fixed by transcardial perfusion with heparinized saline followed by 37% formaldehyde-acetic acid-methanol (1:1:8). A needle was inserted in the centers of existing burr holes to mark sites at which depolarization had been monitored. The brain was paraffin embedded and 10 μm coronal sections were collected at the level of the recording sites. After staining with hematoxylin-eosin, the position of the infarct margin was determined by an investigator unaware of the prior depolarization results.
In Study 3, rats were decapitated after 4 hours of perfusion imaging and brains were removed and frozen in hexane at −40°C. Serial 20 μm sections were collected at 1 mm intervals and stained with hematoxylin-eosin. Edema-corrected infarct volumes were determined by subtracting the volume of noninfarct ipsilateral cortex from that of the contralateral hemisphere (Jacewicz et al, 1992).
Statistical Analyses
Group values are expressed as mean values ± s.d. Differences were assessed by two-way analysis of variance, Fisher's exact test, or t-test as required for the comparisons evaluated (Prism v. 5.0, GraphPad Software, Inc., Cary, NC, USA). P ≤ 0.05 was considered statistically significant.
Results
Cerebral Blood Flow Threshold for Ischemic Depolarization and Infarction (Study 1)
Successful recording and isotope delivery, and unambiguous identification of all electrode positions in tissue sections, were obtained for eight rats. Plots of blood flow versus recording position are shown in Figure 1, open and closed circles identifying normal and depolarized states, respectively. All but one animal exhibited significant CBF reduction even at the most medial electrode position evaluated (95 ± 21 versus 159 ± 31 mL/100 g per minute contralateral to the occlusion). Persistent depolarization was established at 3 to 4 mm lateral, at an average CBF of 38 ± 13 mL/100 g per minute in the perfusion gradient (shaded bar). A single rat exhibited locally elevated flow values at the 1 and 2 mm lateral recording positions (off scale in the figure), evidently reflecting the hyperemic response to a PID occurring during tracer infusion, and was excluded from this calculation.
The distribution of acute ID provided a robust indicator of regional outcome, predicting 24 hours histological status at 29 of 30 recording sites in 5 animals (Supplementary Figure S2). In the single discrepancy, the final infarct margin extended 500 μm medial to an electrode site at 3 mm lateral that had failed to depolarize within the 3 hours recording interval evaluated. Since delayed depolarization was explicitly demonstrated in two other animals, it may be inferred that this single site had taken still longer to terminally depolarize.
Metabolic Consequences of Depolarization (Study 2)
Recording and sampling sites, and representative traces illustrating the distribution of ischemic and recurrent PID, are shown in Figure 2. Recordings at 4 or 5 mm lateral demonstrated immediate, persistent ID. Other locations exhibited 3 to 11 (median 5) PIDs during 1 hour, characteristically brief and attenuated in magnitude at more medial positions 1 and 2 mm lateral, and more prolonged at 3 mm lateral.
Of the 56 tissue samples obtained from ischemic hemispheres, (14 rats, 4 sites per animal) 2 were eliminated because failure of a single electrode precluded classification of both adjacent sites, and 2 samples were lost during extract preparation. Distinct metabolite responses to depolarization were observed for each sample category (Figure 3). Sites undergoing persistent ID (n = 9) exhibited marked depletion of ATP, PCr and glucose, and elevated lactate. After RD (n = 17), metabolite levels were altered initially but normalized rapidly, and ATP, PCr, and glucose tended to overshoot values for sham animals within 3 minutes after the onset of repolarization. A significant increase in PCr persisted though 30 minutes (6.0 ± 0.6 versus 5.0 ± 0.5 μmol/g for control cortex). Glucose progressively declined within the control range, and lactate remained modestly elevated (2.0 ± 0.9 versus 1.2 ± 0.5 μmol/g for control). In contrast, intermediate regions (ID-RD, n = 13) showed persistent glucose depletion and lactate elevation, as well as partial reductions in ATP and PCr in half of the samples, consistent with the expected heterogeneity in tissue status at such sites. Regions with ND (n = 4), or between electrodes showing RD-ND (n = 9), showed the increase in PCr seen after repolarization of adjacent RD regions, as well as the gradual decline in glucose levels, whereas lactate remained in the control range. Values for samples from contralateral cortex were identical to those of the sham-operated controls (not shown). Consideration of depolarization status more reliably discriminated the graded metabolic response to MCA occlusion than did anatomical position alone (Supplementary Figure S3).
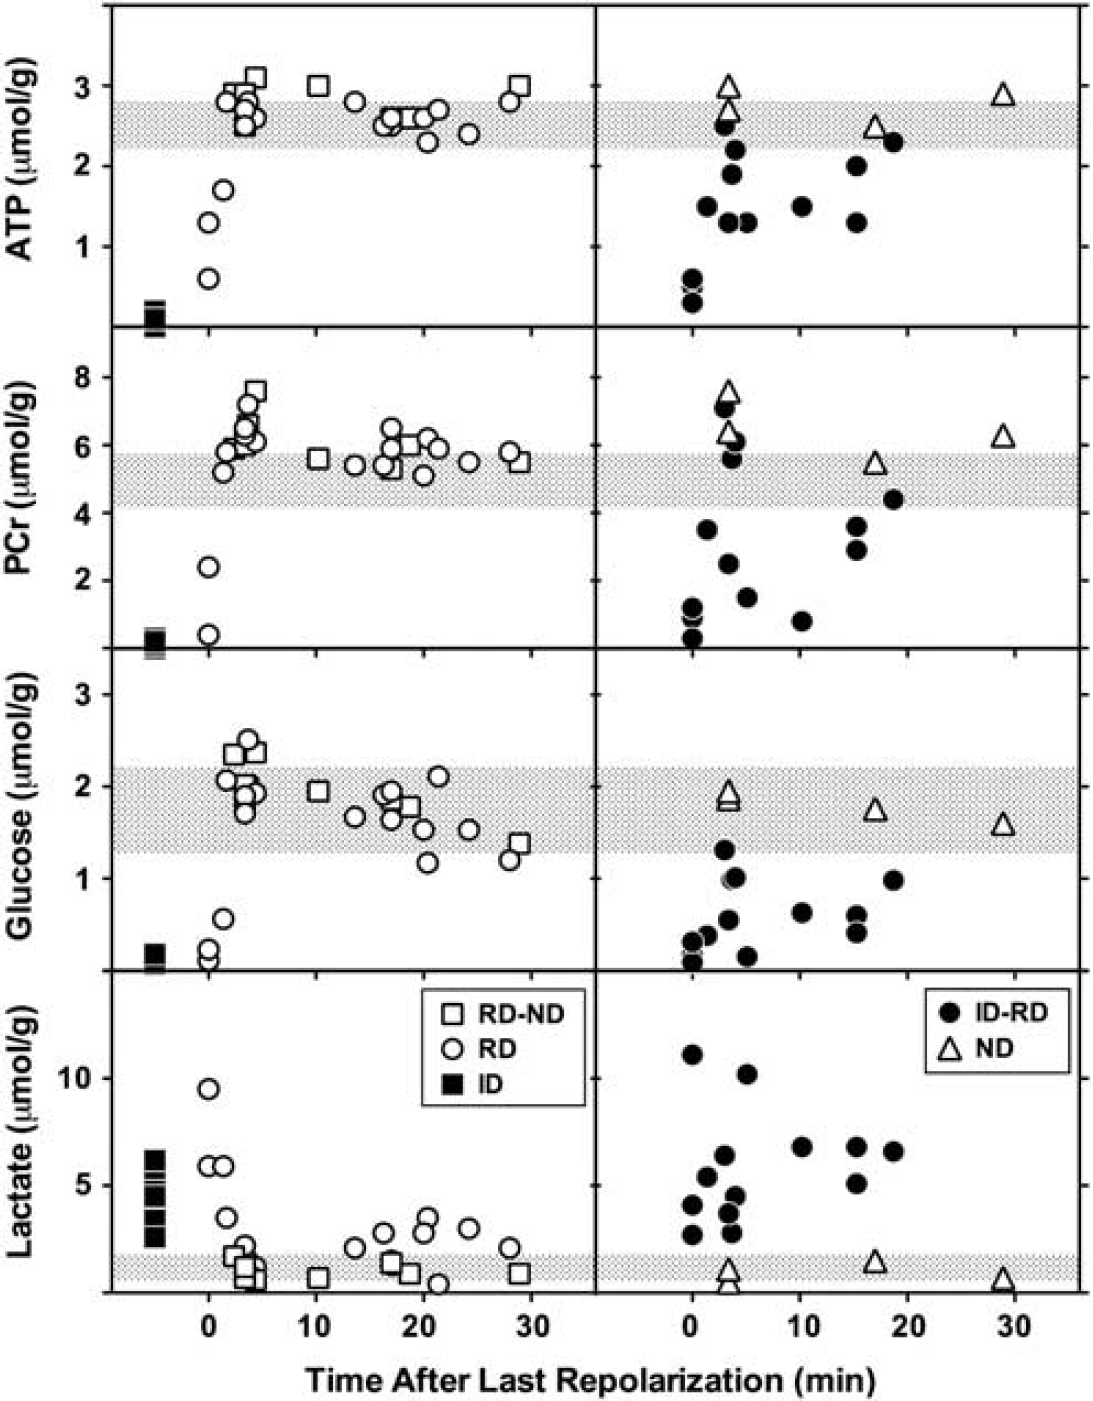
Metabolite changes in response to depolarization. Tissue samples from sites identified in Figure 2 were obtained from brains frozen in situ after 1 hour middle cerebral artery (MCA) occlusion, during or at intervals up to 30 minutes after a recurrent depolarization (RD). Locations undergoing persistent ischemic depolarization (ID, filled squares, n = 9) exhibited loss of ATP, phosphocreatine (PCr) and glucose, and markedly elevated lactate, relative to corresponding tissue from sham-operated animals (shaded bars, mean ± s.d.). RD (open circles, n = 17) resulted in profound but transient metabolic responses, tending to overshoot control values 3 to 5 minutes after repolarization. Increases in PCr were also observed during this interval in ipsilateral cortex that had not exhibited depolarization (ND, open triangles, n = 4), and at adjacent locations (RD-ND, open squares, n = 9). Thereafter ATP and PCr levels remained stable, whereas glucose declined slightly and lactate increased modestly above control levels. Persistent, intermediate changes in metabolite levels were only observed in regions adjacent to those undergoing sustained depolarization (ID-RD, closed circles, n = 13).
Imaging of Peri-Infarct Flow Transients and the Impact of Anesthesia (Study 3)
Examples of perfusion images and representative traces are shown in Figure 4. Marked CBF fluctuations were observed under volatile anesthesia before occlusion, and persisted contralaterally for the duration of the study when halothane administration was sustained. These occurred at a frequency comparable to that observed for peri-infarct flow transients ipsilaterally, although the temporal coupling was imprecise. Such oscillations are not fully explained, but flow increases were associated with intervals of modest hypotension (Supplementary Figure S4), indicative of generalized vasodilation. Cerebral blood flow stabilized in animals under α-chloralose anesthesia, albeit at a lower level. Mean baseline CBF in contralateral cortex was 43 ± 4 and 102 ± 10 mL/100 g per minute under anesthesia with α-chloralose and halothane, respectively, comparable to values in correspondingly anesthetized control animals (49 ± 4 and 96 ± 15).
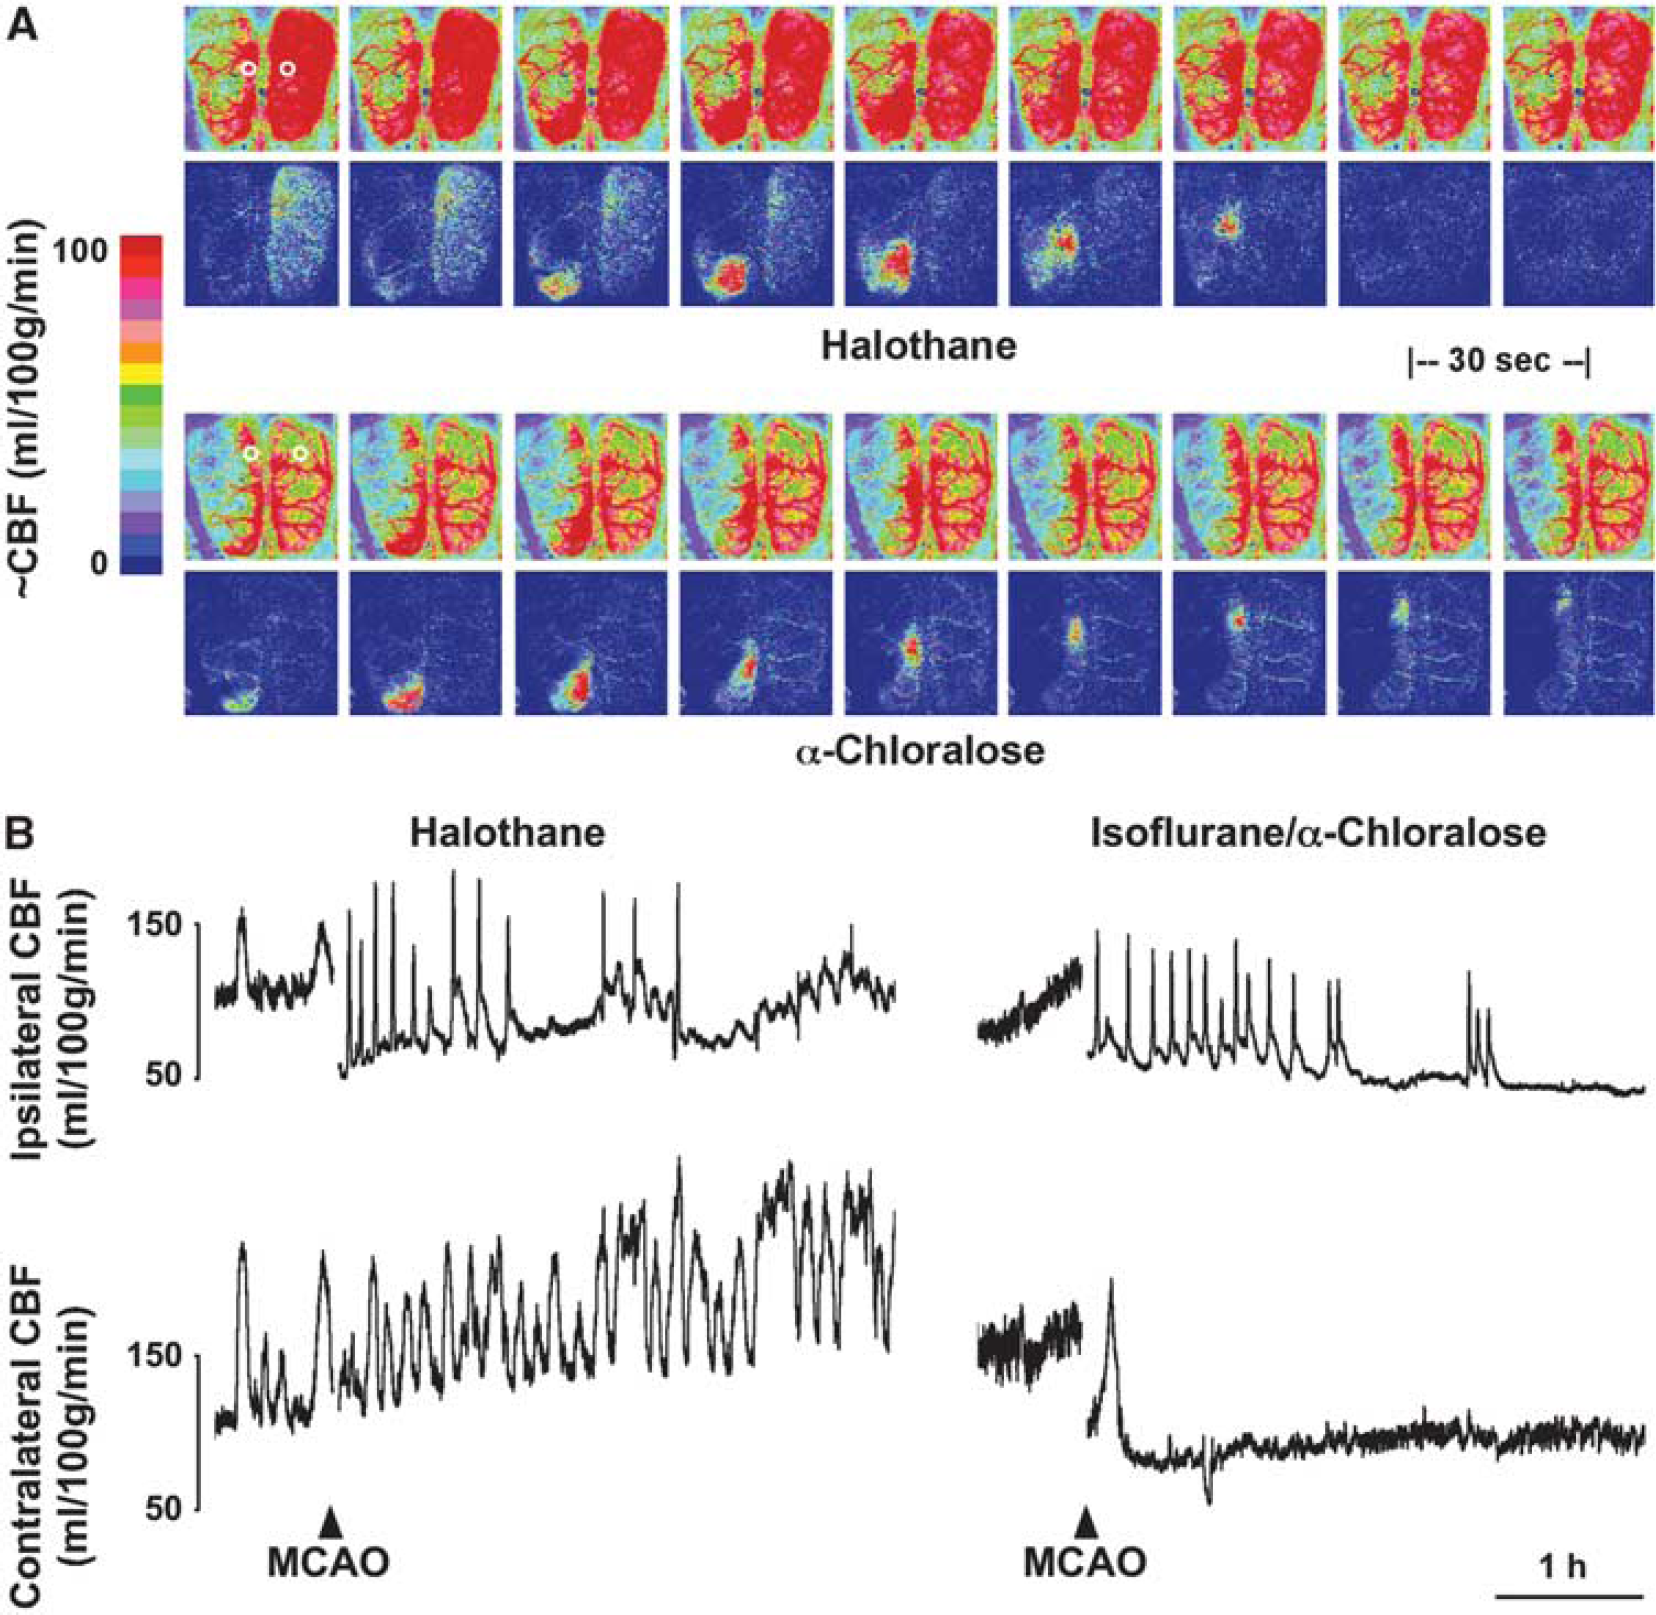
Perfusion imaging and the impact of anesthesia. Rats were surgically prepared for perfusion imaging under halothane or α-chloralose anesthesia. (
Peri-infarct depolarization incidence in halothane-anesthetized animals was lower than in the earlier metabolite study (2 to 7, median 3, during the first hour of occlusion, falling to 0 to 4, median 2, during the second hour and occurring rarely thereafter). Peri-infarct depolarizations were more frequent under α-chloralose anesthesia (6 to 9, median 7, during hours 1 and 2; 0 to 7, median 2, during hour 3; 0 to 4, median 2, during hour 4). Propagated hyperemic responses to PID were observed under both anesthesia conditions, but perfusion deficits in the MCA territory were more severe under α-chloralose anesthesia, and hyperemic peaks were blunted in magnitude in comparison with halothane.
Representative traces (Figure 5, upper panels) document regional CBF at the approximate anatomical locations indicated during the first hour after occlusion for the same animals illustrated in Figure 4. Group data (Figure 5, lower panels) compare baseline CBF gradients and local hyperemic responses for the two groups. Medially, peak perfusion reached 137 ± 21 and 105 ± 22 mL/100 g per minute under halothane and α-chloralose, respectively. For comparison, retrospective analysis of autoradiographic images obtained in a previous study (Zhao and Nowak, 2006) identified three rats in which peri-infarct hyperemia was captured in the awake state, showing much higher peak cortical CBF (253 ± 6 mL/100 g per minute).
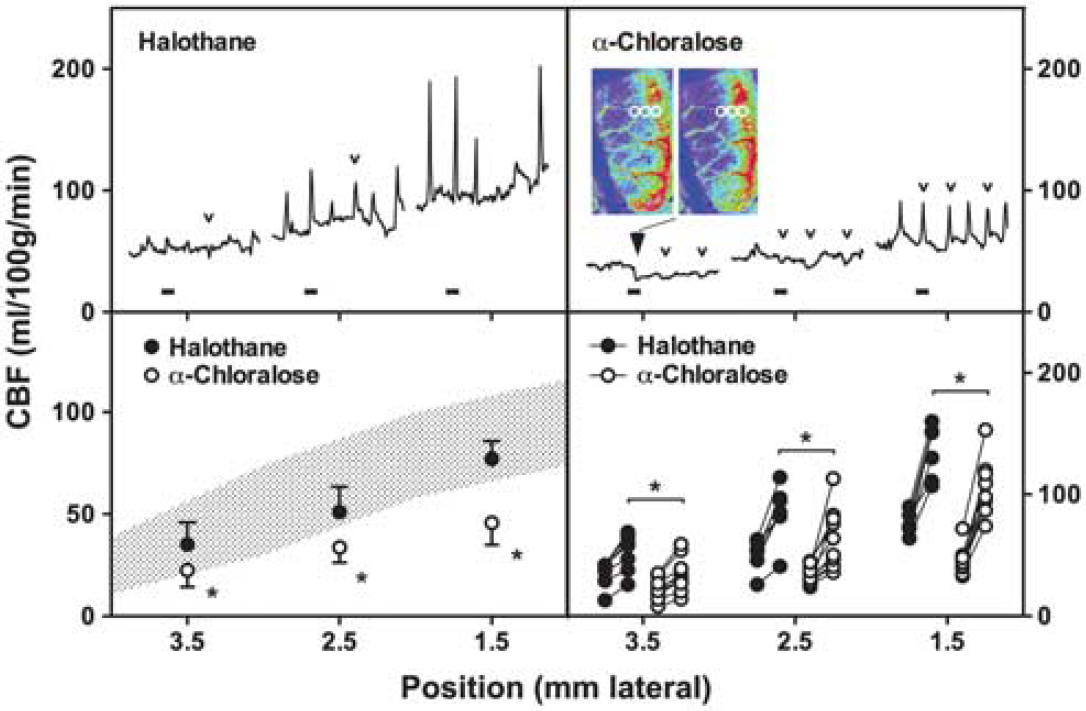
Quantitative assessment of peri-infarct cerebral blood flow (CBF). Traces (upper panels) document the time course of perfusion change during the initial hour of occlusion at approximate anatomical positions indicated on the horizontal axis (1.5, 2.5, and 3.5 mm lateral) 2 to 4 mm caudal to bregma. Blocks identify intervals corresponding to the image series illustrated in Figure 4A. Transient hypoperfusion occurs laterally during a subset of events that elicit strictly hyperemic responses at the more medial position (small open arrowheads) under both anesthesia conditions. Persistent CBF reduction is noted at the most lateral position in the α-chloralose anesthetized animal (large filled arrowhead) and is apparent in images obtained before and after the identified peri-infarct depolarization (PID), adjusted to emphasize changes in the lower perfusion range. Regions of interest (circles) indicate positions subjected to quantitative analysis. Grouped data for all animals (lower panels) show the impact of anesthesia on mean baseline perfusion at each location (left) and the mean hyperemic response to depolarization for individual rats (right), excluding hypoperfusion responses. Shaded area in left panel indicates regional CBF determined by autoradiography for a separate group of animals under halothane anesthesia but without the extensive skull preparation required for perfusion imaging (mean ± s.d., data from Figure 1). Baseline CBF and hyperemic responses to depolarization were consistently lower under α-chloralose anesthesia (*P < 0.05).
Although hyperemia was the obvious perfusion response to PID, the α-chloralose anesthetized animal also exhibited persistent expansion of the territory exhibiting the most severe perfusion deficit, apparent as a lasting reduction in CBF at the most lateral recording position (Figure 5). Transient flow reductions are also seen in traces from both animals in association with some, but not all, of the hyperemic responses observed medially. A survey of sites in the more lateral regions accessible to imaging in these studies provided a comparison of PID-associated flow transients in the two groups (Table 1). Transient hypoperfusion occurred in regions of already markedly attenuated baseline CBF (20 to 50 mL/100 g per minute) during 60% of events under halothane anesthesia. This proportion is probably an underestimate since the imaged region was limited, only select points were sampled, and changes smaller than 5 mL/100 g per minute were not included. Such events were less often detected in rats under α-chloralose anesthesia, and occurred in regions having somewhat lower flow (10 to 40 mL/100 g per minute). In contrast, persistent CBF decrements were rare (< 4% of events under α-chloralose anesthesia), were restricted to regions having still lower CBF before the event, and usually occurred within 30 minutes after occlusion. Although only a single such response was recorded under halothane anesthesia the difference in these small numbers of events did not achieve statistical significance (Fisher's exact test).
Anesthesia effects on PID-associated perfusion responses
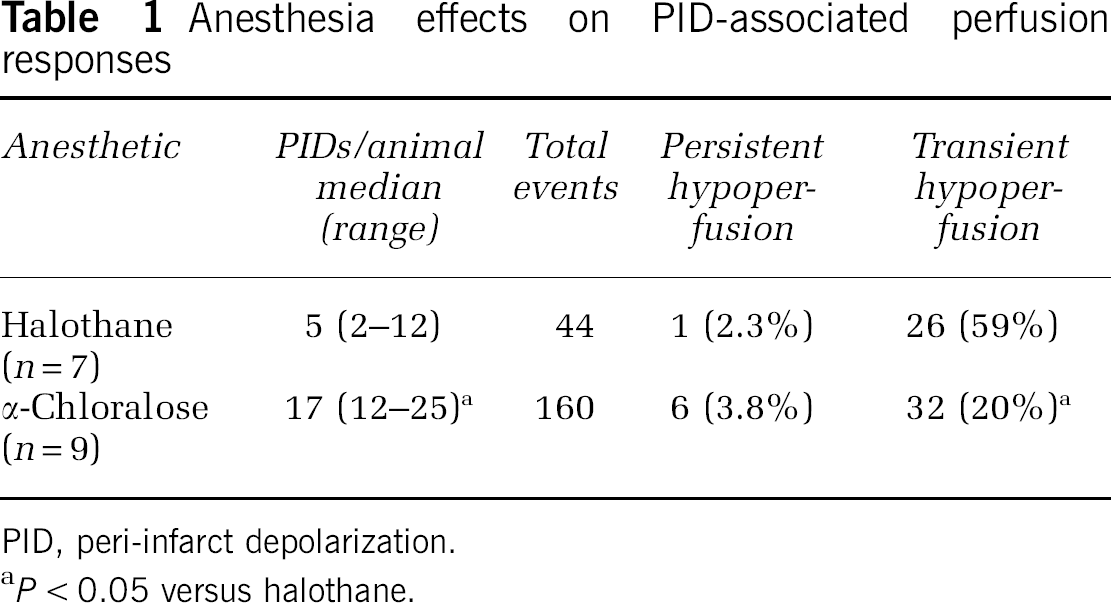
PID, peri-infarct depolarization.
P < 0.05 versus halothane.
Infarct volumes at the end of the 4-hour recording session were 77 ± 28 versus 115 ± 9 mm3 for halothane and α-chloralose groups, respectively, which differed significantly (unpaired t-test). These represent ∼60 and 90% of the infarct volume ultimately reached in the model, demonstrating more rapid lesion evolution under α-chloralose anesthesia.
Discussion
These results document perfusion and metabolic responses to PIDs in a rat focal ischemia model characterized by a reproducible ischemic territory and rapid infarct evolution, permitting clear definition of anatomical and temporal relationships. Characteristic hemodynamic features of PIDs are observed, including components of propagated hyperemia as well as hypoperfusion. A small subset of events resulted in more prolonged flow deficits and expansion of terminally depolarized cortex, indicative of overt vasoconstriction. Only transient ATP depletion was detected after passage of a PID in those regions for which local repolarization could be confirmed. The distribution of persistent depolarization, metabolic failure, and infarction was therefore determined by the CBF gradient established during the initial hours of occlusion, to which occasional PIDs directly contributed.
Model Characteristics and Technical Considerations
The SHR exhibits a short temporal threshold for infarction of 2 to 3 hours (Kaplan et al, 1991), and in awake animals the final infarct volume is accurately predicted by perfusion deficit at 3 hours (Zhao and Nowak, 2006). A majority of events contributing to infarct evolution therefore should be accessible to monitoring during a correspondingly short window. A CBF threshold of ∼40 mL/100 g per minute is obtained for both acute ID (Figure 1) and eventual infarction (Jacewicz et al, 1992).
Incremental expansion of the territory exhibiting ID was documented in two of five rats by direct mapping of electrophysiological changes during 3 hours of halothane anesthesia with 24 hours infarct distribution (Supplementary Figure S2), and could be inferred to have occurred later in a third animal. This agrees with the 48% of SHR showing stepwise expansion of ischemic core during the same interval, based on the distribution of increased NADH fluorescence (Higuchi et al, 2002). A similar proportion of animals in the current study (five of nine, with two events in one animal) experienced a persistent PID-associated CBF decrement during 4 hours of perfusion imaging under α-chloralose anesthesia (Table 1), by which time 90% of final infarct volume had been achieved. Thus, a stable CBF deficit in this model is established after rare early expansion events in the cortical region accessible to these studies.
The comparative rarity of such events in the SHR contrasts with the more regular stepwise expansions reported in previous studies in mice (Shin et al, 2006), as well as in other rat strains (Nakamura et al, 2010). Although blood pressure is a critical variable impacting the dynamics of depolarization-associated flow responses (Sukhotinsky et al, 2008), hypertension per se is unlikely to have been a critical variable in either the perfusion or metabolite studies. Rather, the paucity of collateral perfusion in the SHR, further attenuated by ipsilateral CCA occlusion (Brint et al, 1988), results in a steep and rapidly established CBF gradient (Jacewicz et al, 1992; Zhao and Nowak, 2006), with perhaps only a more limited capacity for further expansion.
Reliable study of PID-associated infarct expansion required use of α-chloralose anesthesia, since only one of seven rats imaged under halothane anesthesia exhibited a persistent loss of perfusion (Table 1). This reflects in part the > 3-fold reduction in total events per animal relative to α-chloralose anesthesia, in agreement with previous studies documenting attenuated PID propagation under halothane (Saito et al, 1997). Halothane effects may have been amplified in the imaged group by the more prolonged interval of deep anesthesia required for skull preparation in this component of the study. Whether this may have also contributed to the marked oscillations in global perfusion seen here under halothane anesthesia remains to be determined. Such cyclic perfusion changes could partially contribute to an entraining of PIDs (Figure 4), which would be preferentially triggered during intervals of lower CBF.
Metabolite Studies
Lasting depletion of ATP and PCr, indicative of overt metabolic compromise, was only observed in regions undergoing persistent ID or at immediately adjacent locations (ID-RD). Rapid and complete metabolic recovery was documented in regions confirmed to repolarize after passage of a PID (Figure 3). The time course of ATP recovery in such regions (within 3 minutes) was only moderately slower than observed after CSD in normal brain (Mies and Paschen, 1984). This at first appears to disagree with a previous study, in which more lasting ATP and PCr depletions were reported after PID than after CSD (Selman et al, 2004). In those experiments brains had been frozen during depolarization at a single electrode site, after which tissue samples had been collected rostral and caudal to that position and a temporal relationship to depolarization inferred from the assumed PID trajectory and propagation rate. The anatomical extent of sampled cortex permitted evaluation of only a short temporal window in that study, extending ∼1 minute after depolarization. Whereas this sensitively discriminated more persistent metabolite depletion than seen after CSD, it could not have detected the robust recovery documented soon thereafter in the present experiments.
Early overshoot in metabolite levels was prominent even in regions that had not overtly depolarized, persisting, and achieving statistical significance for PCr (Figure 3). One likely mechanism would be a shift in the creatine kinase equilibrium with increasing intracellular pH. Delayed alkalosis was noted after CSD in normal brain (Gault et al, 1994), as well as in better perfused regions of the ischemic penumbra (Back et al, 2000). Relative extracellular alkalosis has been described within regions of endothelin-induced vasoconstriction (Oliveira-Ferreira et al, 2010). Since PCr increased in regions outside the eventual infarct margin in the current study, this effect is not necessarily of pathological relevance. Rather, it may be associated with the depression of electrophysiological activity and reduced metabolic demand expected in the aftermath of depolarization, or with deafferentation of peri-infarct territory.
Modest lactate elevation and glucose reduction persisted through 30 minutes after repolarization in regions that experienced recurrent PIDs, although both had initially normalized (Figure 3). Anatomical bias may have contributed to this apparent delayed effect, since some of these samples were distributed more laterally and therefore further down the perfusion gradient (Supplementary Figure S3). Because experiments were terminated at a consistent time point after occlusion, animals providing data at shorter intervals tended to experience more depolarizations (4 to 11), whereas those at longer intervals had experienced fewer events (3 to 5). It is therefore clear that glucose and lactate recovered rapidly even after repeated PIDs.
Perfusion Responses to Depolarization
Although rare, lasting PID-associated CBF reductions were primary contributors to the expansion of ischemic territory (Figure 5), and could account for the increments in persistently depolarized cortex previously described in this model (Higuchi et al, 2002). As noted in other studies (Shin et al, 2006; Strong et al, 2007), this type of response was restricted to regions of already low CBF. A corresponding position in the perfusion gradient is more lateral in halothane-anesthetized animals with higher CBF, and was perhaps less consistently imaged.
Peri-infarct depolarizations were much more frequently associated with only transient hypoperfusion, at intermediate positions in the CBF gradient, coincident with distal hyperemia. Comparable distributions of hyperemic and hypoperfusive responses to PID have been noted in other studies (Kumagai et al, 2010; Luckl et al, 2009; Shin et al, 2006; Strong et al, 2007). This is consistent with the proposed contribution of a steal phenomenon to regional flow changes during PID (Pinard et al, 2002), although hypoperfusion occurred without close coupling to hyperemia in the cat (Strong et al, 2007). Alternatively, this heterogeneity in regional perfusion change may reflect conduction of differential vasomotor responses within the vasculature, as reported during CSD (Brennan et al, 2007). Although predominantly vasodilatory in that study, propagated constriction sometimes occurred in proximity to the site of the initiating stimulus, reflecting the importance of the local milieu in determining the balance between vasoconstriction and vasodilation (Dreier et al, 1998). Hypoperfusion transients were observed here at sites 3 mm or more lateral, at flow values close to the CBF threshold for depolarization (Figure 1), and would be expected to contribute directly to the prolonged depolarization intervals (Figure 2) and resultant metabolic compromise (Figure 3) seen at this point in the perfusion gradient. Speculatively, prolonged depolarization could in turn contribute to maintained local vasoconstriction, this synergy occasionally resulting in the transition to persistent expansion of the flow deficit. Transient hypoperfusions were proportionately fewer under α-chloralose anesthesia (Table 1), perhaps reflecting both reduced steal and the difficulty in identifying small decreases under conditions of globally attenuated perfusion.
We did not explicitly identify pathological consequences of transient flow decrements in the present experiments, but recent studies examining depolarization effects at much higher temporal and spatial resolution demonstrated a cyclic pattern of dendritic injury in association with such events (Risher et al, 2010). This was more closely coupled to depolarization than to perfusion change, although better maintained local blood flow reduced the risk of permanent damage. This may be particularly relevant to mechanisms of selective neuron loss in peri-infarct territory, since cortical neuron death is exquisitely sensitive to cumulative depolarization duration (Higuchi et al, 2002).
Anesthesia Effects on Cerebral Blood Flow and Peri-Infarct Depolarizations
In the course of the perfusion imaging studies, it became apparent that infarct expansion events could not be reliably studied under sustained halothane anesthesia (Table 1). The switch to α-chloralose reduced baseline perfusion, blunted CBF responses to depolarization, and increased both PID number and the rate of infarct expansion, as noted in other studies (Luckl et al, 2008; Saito et al, 1997). Rapid glucose recovery was observed after PIDs under halothane anesthesia (Figure 3), as also reported after CSD under barbiturate anesthesia (Silver and Erecińska, 1994), whereas CSD effects on perfusion and metabolism are more prolonged under α-chloralose (Hashemi et al, 2009; Piilgaard and Lauritzen, 2009). It remains unclear which condition better approximates the unanesthetized state. Blood flow under routine halothane anesthesia is similar to (Figure 1) or slightly lower (Jacewicz et al, 1992) than that of awake SHR (Zhao and Nowak, 2006). Whereas α-chloralose preserves coupling of CBF and metabolic rate in normal brain (Nakao et al, 2001), perfusion responses to increased demand during PID are clearly attenuated (Figure 5). This might suggest that halothane anesthesia better approximates the awake postischemic rat, in which hyperemic responses to PID are even greater. However, animals released from naive halothane exposure may experience modest systemic vasoconstriction not seen under maintained halothane anesthesia (Zhao and Nowak, 2006), and transition to α-chloralose during postocclusion monitoring may reproduce some aspects of this condition. Awake recordings in a filament occlusion model indicate a high incidence of PIDs during the initial hours of occlusion (Hartings et al, 2003), also more comparable to that seen under α-chloralose. Confounding effects of anesthesia in experimental stroke remain to be resolved.
Conclusions
Occasional PIDs, occurring soon after MCA occlusion, result in lasting decrements in perfusion associated with acute infarct expansion in the SHR. Transient flow decreases are observed much more frequently, propagating adjacent to distal hyperemic responses, and undoubtedly impact metabolic recovery and prolong local PID duration. Although the majority of PIDs do not appear to contribute to overt infarction, they would nevertheless be associated with sustained functional deficits in affected cortex, and perhaps with selective peri-infarct neuron damage. The quantitative importance of these distinct components of the response to PID appears to differ considerably among animal models, and the extent to which they may be delineated in clinical stroke remains to be determined.