
Abstract
Spreading depolarization (SD), a pathologic feature of migraine, stroke and traumatic brain injury, is a propagating depolarization of neurons and glia causing profound metabolic demand. Adenosine, the low-energy metabolite of ATP, has been shown to be elevated after SD in brain slices and under conditions likely to trigger SD in vivo. The relationship between metabolic status and adenosine accumulation after SD was tested here, in brain slices and in vivo. In brain slices, metabolic impairment (assessed by nicotinamide adenine dinucleotide (phosphate) autofluorescence and O2 availability) was associated with prolonged extracellular direct current (DC) shifts indicating delayed repolarization, and increased adenosine accumulation. In vivo, adenosine accumulation was observed after SD even in otherwise healthy mice. As in brain slices, in vivo adenosine accumulation correlated with DC shift duration and increased when DC shifts were prolonged by metabolic impairment (i.e., hypoglycemia or middle cerebral artery occlusion). A striking pattern of adenosine dynamics was observed during focal ischemic stroke, with nearly all the observed adenosine signals in the periinfarct region occurring in association with SDs. These findings suggest that adenosine accumulation could serve as a biomarker of SD incidence and severity, in a range of clinical conditions.
INTRODUCTION
Spreading depolarization (SD) of brain tissue is a self-propagating wave of neuronal and glial activation, carried by large transmembrane currents that depolarize cells and disrupt ionic gradients.1,2 Spreading depolarization imposes a large metabolic burden on brain tissue, evidenced by depletion of energy substrates and O23,4 and by accumulation of metabolic byproducts such as lactate and H+.5,6 ATP concentration drops by nearly 50% during SD in normoxic conditions, 7 and metabolic depletion is expected to be more severe when occurring in tissue with limited substrate availability.
Recent clinical studies strongly suggest that SD is involved in the pathophysiology of migraine with aura, thromboembolic stroke, traumatic brain injury, and subarachnoid hemorrhage. 8 While normoxic, normoglycemic SD can be noninjurious, 9 SD in the setting of metabolic compromise exacerbates neuronal injury.10,11 Work in animal models has identified delayed repolarization, marked by prolonged extracellular direct current (DC) shifts, as a hallmark of injurious SD in metabolically compromised tissue. 10 Observational studies in human subjects have confirmed the association between prolonged DC shifts and poor outcome after SD, 12 but human studies have so far been limited by the requirement for invasive electrical recordings in patients with craniotomies. It would be helpful to establish additional biomarkers of metabolic status, to assess vulnerability to SD in injured brain.
Extracellular adenosine accumulation can serve as a global indicator of energy charge. Adenosine, a metabolic byproduct of ATP hydrolysis, accumulates in the extracellular space when energy demand exceeds supply. 13 As such, adenosine accumulation reports changes in ATP concentration without necessitating any assumptions about the upstream cause of metabolic deterioration; it can be triggered by isolated hypoxia or hypoglycemia, 14 or high-output conditions such as seizure. 15 Thus, extracellular adenosine serves as an integrator of net metabolic status. We have recently used electrochemical detection methods in brain slices to verify that adenosine accumulates after K+-induced SD, 16 possibly indicating the severity of this metabolic challenge. Whether adenosine accumulation can be detected after SD in vivo is not yet clear. Although adenosine increases have been reported in the settings where SD is most likely to occur (i.e., potassium infusion, ischemia,17,18 and traumatic brain injury 19 ), these studies have been conducted largely without monitoring for SD. One study that did assess SD found a clear temporal association between adenosine peaks and electroencephalographic suppression, 20 although the sampling method made pulsatile adenosine dynamics difficult to resolve, and relationships to DC shift durations or metabolic status were not elucidated.
In the present study, we report adenosine signals associated with SD in brain slices and in vivo. We first tested whether metabolic status could modulate adenosine accumulation in brain slices subjected to SD, and then compared SD-associated adenosine release in vivo, under healthy, hypoglycemic, and ischemic conditions. Our findings suggest that adenosine can be a useful indicator of unmet metabolic demand in the wake of SD, and could provide a useful adjunct or alternative to electrical recordings to assess recovery from SD in compromised tissues. Preliminary findings of this study have been published in abstract form. 21
MATERIALS AND METHODS
Animals and Brain Slice Preparation
All animal studies were conducted under protocols approved by the University of New Mexico Health Sciences Center Institutional Animal Care and Use Committee (IACUC, Animal Welfare Assurance #A3350-01, USDA Registration #85-R-0014) in accordance with U.S. Animal Welfare Regulations and Public Health Service Policy on Humane Care and Use of Laboratory Animals. 22 Adult C57Bl/6 mice (n = 20) were anesthetized with ketamine/xylazine, decapitated, and brain slices were prepared as described previously. 16 From each animal, a series of coronal slices was prepared at 250 μm, 350 μm, and 450 μm thicknesses, and a distribution of rostral, intermediate, and caudal slices of each thickness was included in each series of experiments. Slices recovered in artificial cerebrospinal fluid (aCSF) at 35°C for 1 hour then were held at room temperature until being used for experiments.
Brain Slice Recordings
Slices were transferred to a submersion-style flow chamber (RC-27L, Warner Instruments, Hamden, CT, USA) and continuously superfused at a rate of 2 ml/minute with aCSF (34°C to 35°C). Lycra slice supports suspended the slice 0.5mm above the coverslip floor of the chamber, and a meniscus was formed with the immersion objective, such that carboxygenated aCSF continuously bathed both top and bottom faces of the slice. SD was generated by microinjection of KCl 1M, and detected with extracellular electrodes (DC shifts), and propagation tracked with intrinsic optical signals (>600 nm transmitted light) as described previously. 16 Nicotinamide adenine dinucleotide (phosphate) (NAD(P)H) autofluorescence signals were assessed in some studies following methods previously described. 23 Briefly, after excitation at 360 nm illumination (Polychrome V, FEI Life Sciences, Munich, Germany), endogenous fluorescence emission was band-pass filtered 510 ± 42 nm (filter-set from Semrock, Rochester, NY, USA) and collected by interline transfer CCD camera (Imago, FEI Life Sciences), with 4 × 4 binning, 0.5 to 2 Hz. In some studies, partial pressure of O2 (pO2) was measured using a temperature-compensated luminescence quenching Oxymicro probe (World Precision Instruments, Sarasota, FL, USA) placed at the surface of the slice (spatial resolution <50 μm, temporal resolution <1 second, 1 Hz acquisition). O2 probes were calibrated daily using water-saturated air and O2-free water solution (sodium sulfite 1% w/v), and signals were converted to mmHg using local barometric pressure. The O2 probes generated 505 nm excitation that interfered with NAD(P)H signal acquisition. However, since the frequency of O2 and NAD(P)H signal acquisitions were at different rates (1 Hz versus 0.5 to 2 Hz for O2 and NAD(P)H, respectively) and not aligned with each other, the number of frames contaminated with O2 excitation signals were minimal, and could be removed without distortion of NAD(P)H transients. All signals (DC, NAD(P)H and O2) were co-registered according to the KCl pulse, using either the TTL pulse on the KCl picospritzer (for NAD(P)H) or the pulse artifact on electrical recordings (for both the DC and O2 recordings made on the same recording computer).
Brain Slice Model of Metabolic Impairment
Previous authors have demonstrated that brain slice thickness is an important determinant of oxidative metabolism, with impaired diffusion of O2 in thicker slices leading to enhanced lactate accumulation and diminished mitochondrial oxidative transients in response to synaptic stimulation.24,25 We took advantage of this model to experimentally manipulate metabolic status before the induction of SD. Figure 1 verifies that increasing slice thickness established progressive degrees of metabolic impairment. Increasing slice thickness progressively decreased pO2, measured at the slice surface (analysis of variance (ANOVA) P<0.001, Figure 1B) and increased NAD(P)H autofluorescence (Kruskal-Wallis P<0.001, Figure 1C). In vivo estimates of pO2 (18.0 ± 1.9 26 ) are similar to those we obtained at the surface of 350 and 450 μm slices (25.52 ± 11.96 and 15.25 ± 12.7mmHg, respectively), although pO2 values will be decreased within the depth of the slice.27,28 The effect of slice thickness on pO2 measured at the slice surface is noteworthy, given similar superfusion (2 ml/minute) with carboxygenated aCSF. This finding could best be explained by the full volume of respiring tissue acting as an O2 sink, creating an O2 gradient across the slice that extended into the unstirred layer of aCSF. 28 Consistent with this, and in agreement with prior reports, 28 during O2 probe placement, we observed a steep decrease in pO2 on approach to the slice, even some distance away in the bath. Consistent with other evidence that brain slice thickness influenced metabolic status, evoked field excitatory postsynaptic potentials (as a ratio of presynaptic fiber volley) were largest in 250 μm slices and progressively smaller in 350 and 450 μm slices (0.3 mA stimulation, 10.1 ± 3.0 versus 4.1 ± 3.3 versus 2.8 ± 0.5 (amplitudefEPSP/amplitudefiber volley), ANOVA P<0.01, P<0.01 250 versus 350 and 250 versus 450, Bonferronicorrected t-tests, n = 5, 8, 4 slices from 5 animals). Preparations throughout this range of slice thicknesses and metabolic states supported the initiation and propagation of SD.
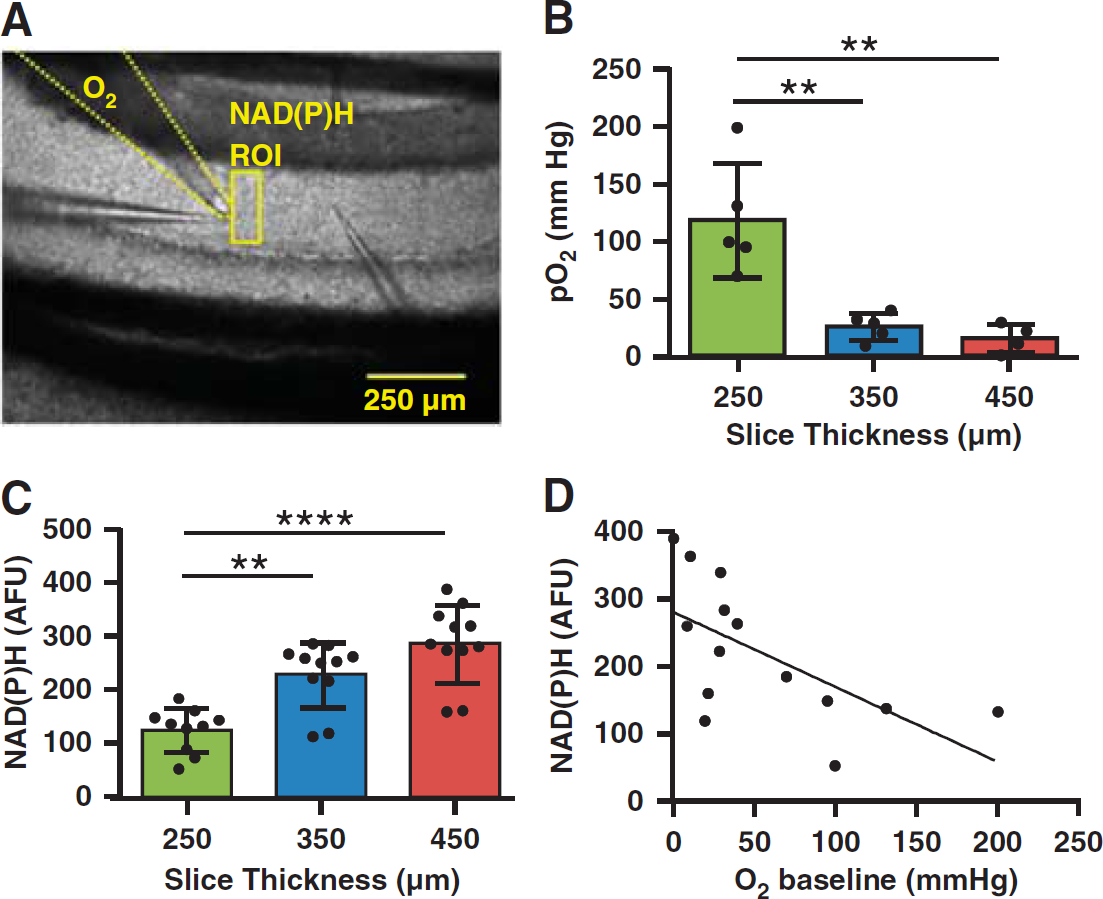
Brain slice thickness model for progressive metabolic impairment. Impaired metabolic status was confirmed by nicotinamide adenine dinucleotide (phosphate) (NAD(P)H) autofluorescence (360 nm excitation) and O2 tension in brain slices acutely prepared at 250, 350, or 450 μm. (
Surgical Preparation and In Vivo Recording
Non-fasted, adult (16.3 ± 7.1 weeks, 29.4 ± 6.5 g, n = 35) C57Bl/6 mice were anesthetized with isoflurane (3% induction, 1% to 2% maintenance) titrated to maintain a respiratory rate of ∼2 Hz and burst-suppression firing. Body temperature (37.0°C ± 0.5°C) was maintained by using a thermostatically controlled heating pad (Harvard Apparatus, Holliston, MA, USA). Because SD has been shown to cause focal hypoxia, 3 mice were supplemented with normobaric O2 (1.5 L/minute). In a subset of animals, blood pressure was measured (83.36 ± 6.56mmHg, n = 17). Arterial blood samples confirmed hyperoxemia and were otherwise similar to previous reports 29 (pH 7.32 ± 0.06, pCO2 33.69 ± 10.83mmHg, pO2 389.21 ± 51.81 mmHg, n = 9). Burr holes were drilled in the frontal bone (0.5 mm, at (AP, ML) (+2.0, +1.0)) for SD induction by a drop of KCl (1 mol/L) or insertion of a 27G needle. Additional burr holes were placed in the parietal bone (1 mm, dura removed, (−1.0, +1.0)) for electrophysiologic and adenosine measurements. In control (n = 8) and insulin-treated animals (n = 8 including four crossed over from controls, see below), SD was induced repetitively at 30-minute intervals, or longer intervals when needed to allow full recovery of adenosine transients or electrocorticographic activity.
In four animals undergoing SD at 30-minute intervals, hypoglycemia was subsequently induced by intraperitoneal injection of 1.5 mU/g recombinant human insulin (Novolin R U-100, Novo Nordisk, Bagsvaerd, Denmark) diluted 1:100 in normal saline 0.9% w/v. An additional four animals received insulin from the start of the experiment, and as data from these animals were consistent with the delayed treatment group, insulintreatment data were pooled (n = 8 animals). Blood glucose in tail vein samples was tested using a clinical glucometer and test strips (ReliOn Prime, Bentonville, AR, USA).
In another group of animals (n = 14), focal stroke was induced by distal middle cerebral artery occlusion (dMCAO) by cauterization as described by Kuraoka et al, 30 and perfusion deficits were confirmed by a custom laser speckle contrast imaging (LSCI) system. The exposed mouse skull was illuminated by a 785 nm laser diode (Thorlabs, Newton, NJ, USA), and backscattered 720 nm longpass-filtered light was collected with a SLR camera lens (f/3.5, 55 mm, Nikon, Tokyo, Japan) and digital CCD camera (Stingray F-504B, Allied Vision Technologies, Stadtroda, Germany). The skull was coated with a thin film of mineral oil to improve imaging quality. The camera angle was orthogonal to the dorsal surface of the skull. Blood flow maps computed from LSCI were calculated and displayed in real time by LabVIEW software modified from Bernard Choi, UCI. 31 Normalized perfusion deficits were calculated offline from background-subtracted 8- bit LSCI blood flow maps in ImageJ (NIH, Bethesda, MD, USA), by calculating the ratio of pixels below threshold (defined as intensity 30% contralateral) to total pixels in the hemisphere.
Electrophysiologic signals were detected by glass microelectrodes (2 to 6MΩ) filled with saline (0.9% w/v), at a cortical depth of ∼500 μm. Signals were amplified (Axon Axopatch, Molecular Devices, Sunnyvale, CA, USA), digitized (PowerLab 8/16), and recorded in LabChart 7 (1 to 20 kHz, AD Instruments, Dunedin, New Zealand).
Adenosine Measurements
Amperometric recordings from adenosine-sensitive enzyme-linked electrochemical probes (SBS-Ado-05-50, Sarissa Biomedical, Warwick, UK) were made as previously described in brain slices 32 and also applied to in vivo recordings. Probe responses were linear in the range of values reported here and for each experiment, probes were calibrated against ≥2 concentrations of exogenous adenosine in physiologic buffer (aCSF in perfusion chamber, 34°C, or phosphate-buffered saline after in vivo measurements, 35°C to 37°C). Adenosine measurements reported here are estimates, as concentrations at the slice surface likely differ from interstitial levels. We note that the present estimates are ∼10-fold lower than values previously calculated by comparison with older frozen stocks. 16 The adenosine signal is reported as mol/L‘, after the convention of Frenguelli et al 33 as it may include adenosine derived from extracellular breakdown of ATP, and does not distinguish adenosine from its degradation products (i.e., inosine, hypoxanthine, and xanthine). Null probes lacking enzymes (SBS-NUL-05-50, Sarissa Biomedical) did not generate signals after SD (0.84 ± 1.19 mA, n = 11 SDs from four animals, P<0.001 versus uncalibrated signals from adenosine probes after SD) ruling out contamination by swelling or from electroactive compounds such as serotonin, catecholamines, and reactive oxygen species.
For in vivo adenosine recordings, the entire sensing surface of the probe (500 μm length, 50 μm diameter) was inserted into the cortex. A recovery interval of ≥30 minutes was maintained between SDs throughout experiments; therefore, a ≥30 minute equilibration interval was also built into the recording protocol before the first experimental SD. If SD was inadvertently induced by placement of the probe, this interval allowed any acute effects of SD on adenosine accumulation to resolve before the start of experiments. To address concerns that brain temperature could differ from body temperature, we tested the enzyme-linked probes for temperature dependence, and found them minimally sensitive to temperature differences in the 34°C to 37°C range (signals generated by adenosine were 104.9 ± 6.9% at 35.5°C, 100.0 ± 12.6% at 34°C, 88.3 ± 1.0% at 32°C, and 80.1 ± 5.4% at 30°C, expressed as % signal at 37°C). Animals were euthanized by pentobarbital overdose to terminate experiments, and we maintained recordings during and beyond terminal SDs. Signals from both adenosine and null probes dropped steeply soon after pentobarbital injection, and continued to drop during and after terminal SD. This nonspecific negative current appeared to coincide with the development of hypotension, was unlikely to be temperature related, and was not clearly associated with DC potential changes. Therefore, no data from SD induced by global ischemia in vivo are reported here.
Drugs and Solutions
All salts, chemicals, and drugs were obtained from Sigma-Aldrich (St Louis, MO, USA). Artificial cerebrospinal fluid was composed of (in mmol/L): glucose 10, CaCl2 2, MgSO4 1, NaCl 126, NaHCO3 26, KCl 3, NaH2PO4 1.5, and was equilibrated with 95% O2, 5% CO2, (pH 7.4). Oxygen-glucose deprivation (OGD) solution was modified from aCSF by replacing glucose with equimolar sucrose and equilibrating with 95% N2, 5% CO2. Cutting solution was composed of (in mmol/L) sucrose 220, NaHCO3 26, glucose 10, MgSO4 6, KCl 3, NaH2PO4 1.5, CaCl2 0.2. Phosphate-buffered saline was composed of (in mmol/L) NaCl 137, KCl 2.7, Na2HPO4 10, KH2PO4 1.8 (pH 7.4). Adenosine was prepared as a stock solution (1 mmol/L) in water and stored at −20 °C, and potency of frozen stock was periodically compared against fresh solutions.
Analysis
Direct current shift duration was measured at 80% recovery. Electrocorticogram (ECoG) was quantified by methods described previously. 12 Briefly, signals were band-pass filtered (0.5 to 40 Hz), and the integral of the total power was computed using a 20-second decay constant. Artifacts visually identified or marked during acquisition were excluded. Electrocorticogram depression was defined as a drop in the power integral to <50% baseline, and duration of suppression was defined as time to sustained recovery (42 minutes) of this signal to a level ≥50% baseline. Isoelectricity was defined using a cut-off of 0.180 V2s (isoelectric baselines' power integral 0.157 ± 0.003 versus non-isoelectric baselines, 0.419 ± 0.239 V2s, P<0.05, n = 5, 13 animals).
Area under the curve (AUC) was calculated as the time-integrated adenosine signal. Rarely, recordings were interrupted before adenosine signals had decayed completely; in these cases, AUC was corrected by linear extrapolation. This procedure was also used when clusters of SDs occurred at short intervals such that adenosine signals had not completely decayed before the next SD arrived. Where possible, adenosine was attributed to individual SDs; for some clusters this could not be distinguished, and the total depolarization time/total ECoG suppression/total adenosine accumulation were calculated for the cluster. When adenosine peaks arrived on an elevated baseline from a previous SD, the baseline was reset to attribute the net adenosine increase to each DC shift individually.
Values are reported as mean ± s.d. Throughout, statistical significance was evaluated by Student's t-tests, ANOVA, correlation tests, and linear regression, setting a type 1 error threshold of α = 0.05 and using Bonferroni correction for multiple comparisons. Non-parametric tests (Kruskal-Wallis ANOVA, Spearman correlation coefficient) were applied to data sets with non-Gaussian distributions (assessed by Kolmogorov-Smirnov normality tests). Statistical outliers were never excluded. Rarely, data were excluded owing to poor data quality (DC shift ambiguous or inverted, ECoG isoelectricity, adenosine probe calibration failure). Such exclusions are noted in relevant sections of the text. Statistics support was provided by the Design, Biostatistics, and Ethics core component of the UNM Clinical and Translational Science Center.
RESULTS
Baseline Metabolic Impairment Prolonged Direct Current Shifts and Increased Spreading Depolarization-Evoked Adenosine Accumulation
We recently described adenosine accumulation after SD in the hippocampal CA1 region of brain slices. 16 Here, we tested the hypothesis that limiting metabolic supply would both delay repolarization and enhance adenosine production evoked by SD. By manipulating slice thickness, we generated a range of basal metabolic conditions before the induction of SD (see Methods, Figure 1): standard 350 μm slices (used in our prior reports) were contrasted with 250 μm slices (less metabolically compromised) and 450 μm slices (more metabolically compromised). We confirmed in this model that DC shift durations increased with metabolic impairment (ANOVA P<0.0001, Figures 2A and 2B), correlating with high basal NAD(P)H autofluorescence (Figure 2C) and low basal pO2 measured at the slice surface (Spearman r = −0.8549, P<0.001, n = 14 slices from four animals). Consistent with the hypothesis, adenosine accumulation was significantly increased with progressive metabolic compromise. In response to SD, adenosine accumulation was barely detectable at the surface of metabolically well-supplied slices, but as metabolic impairment became more severe, adenosine transients were readily detected after SD (peak, ANOVA P<0.001, Figures 2D and 2E; AUC, 0.1 ± 0.1 versus 2.8 ± 2.2 versus 8.0 ± 2.7 mmol/L's, ANOVA P<0.001, 250 versus 450 P<0.001 and 350 versus 450 P<0.01, Bonferroni-corrected t-tests). After correcting for proportional increases in tissue volume (and thus, the potential size of the adenosine pool), there was still a significant effect of slice thickness on adenosine production, attributable to metabolic status (ANOVA P<0.001, P<0.01 250 versus 350 and P<0.001 250 versus 450, Bonferroni-corrected multiple comparisons). Signals peaked progressively later in more metabolically compromised slices (ANOVA P<0.001, n = 5, 5, 5 slices from four animals) and signals lasted progressively longer. Thus, adenosine signals recovered to baseline (≤10% peak) very quickly in 250 μm slices (265.4 ± 156.5 seconds), whereas 350 μm slices recovered within the range described in our previous report (950.3 ± 473.2 seconds); signals in 450 μm slices persisted longer (1657.8 ± 112.2 seconds; ANOVA P<0.0001, all groups P<0.01 Bonferroni-corrected multiple comparisons, n = 5, 5, 4 slices from four animals). Peak estimated adenosine concentrations (Figure 2F) and accumulations (AUC) correlated with basal NAD(P)H autofluorescence (Spearman r = 0.70, P<0.01, n = 15 slices from four animals). Together, these findings suggested that adenosine accumulation depended in part on the basal metabolic state before the onset of SD.
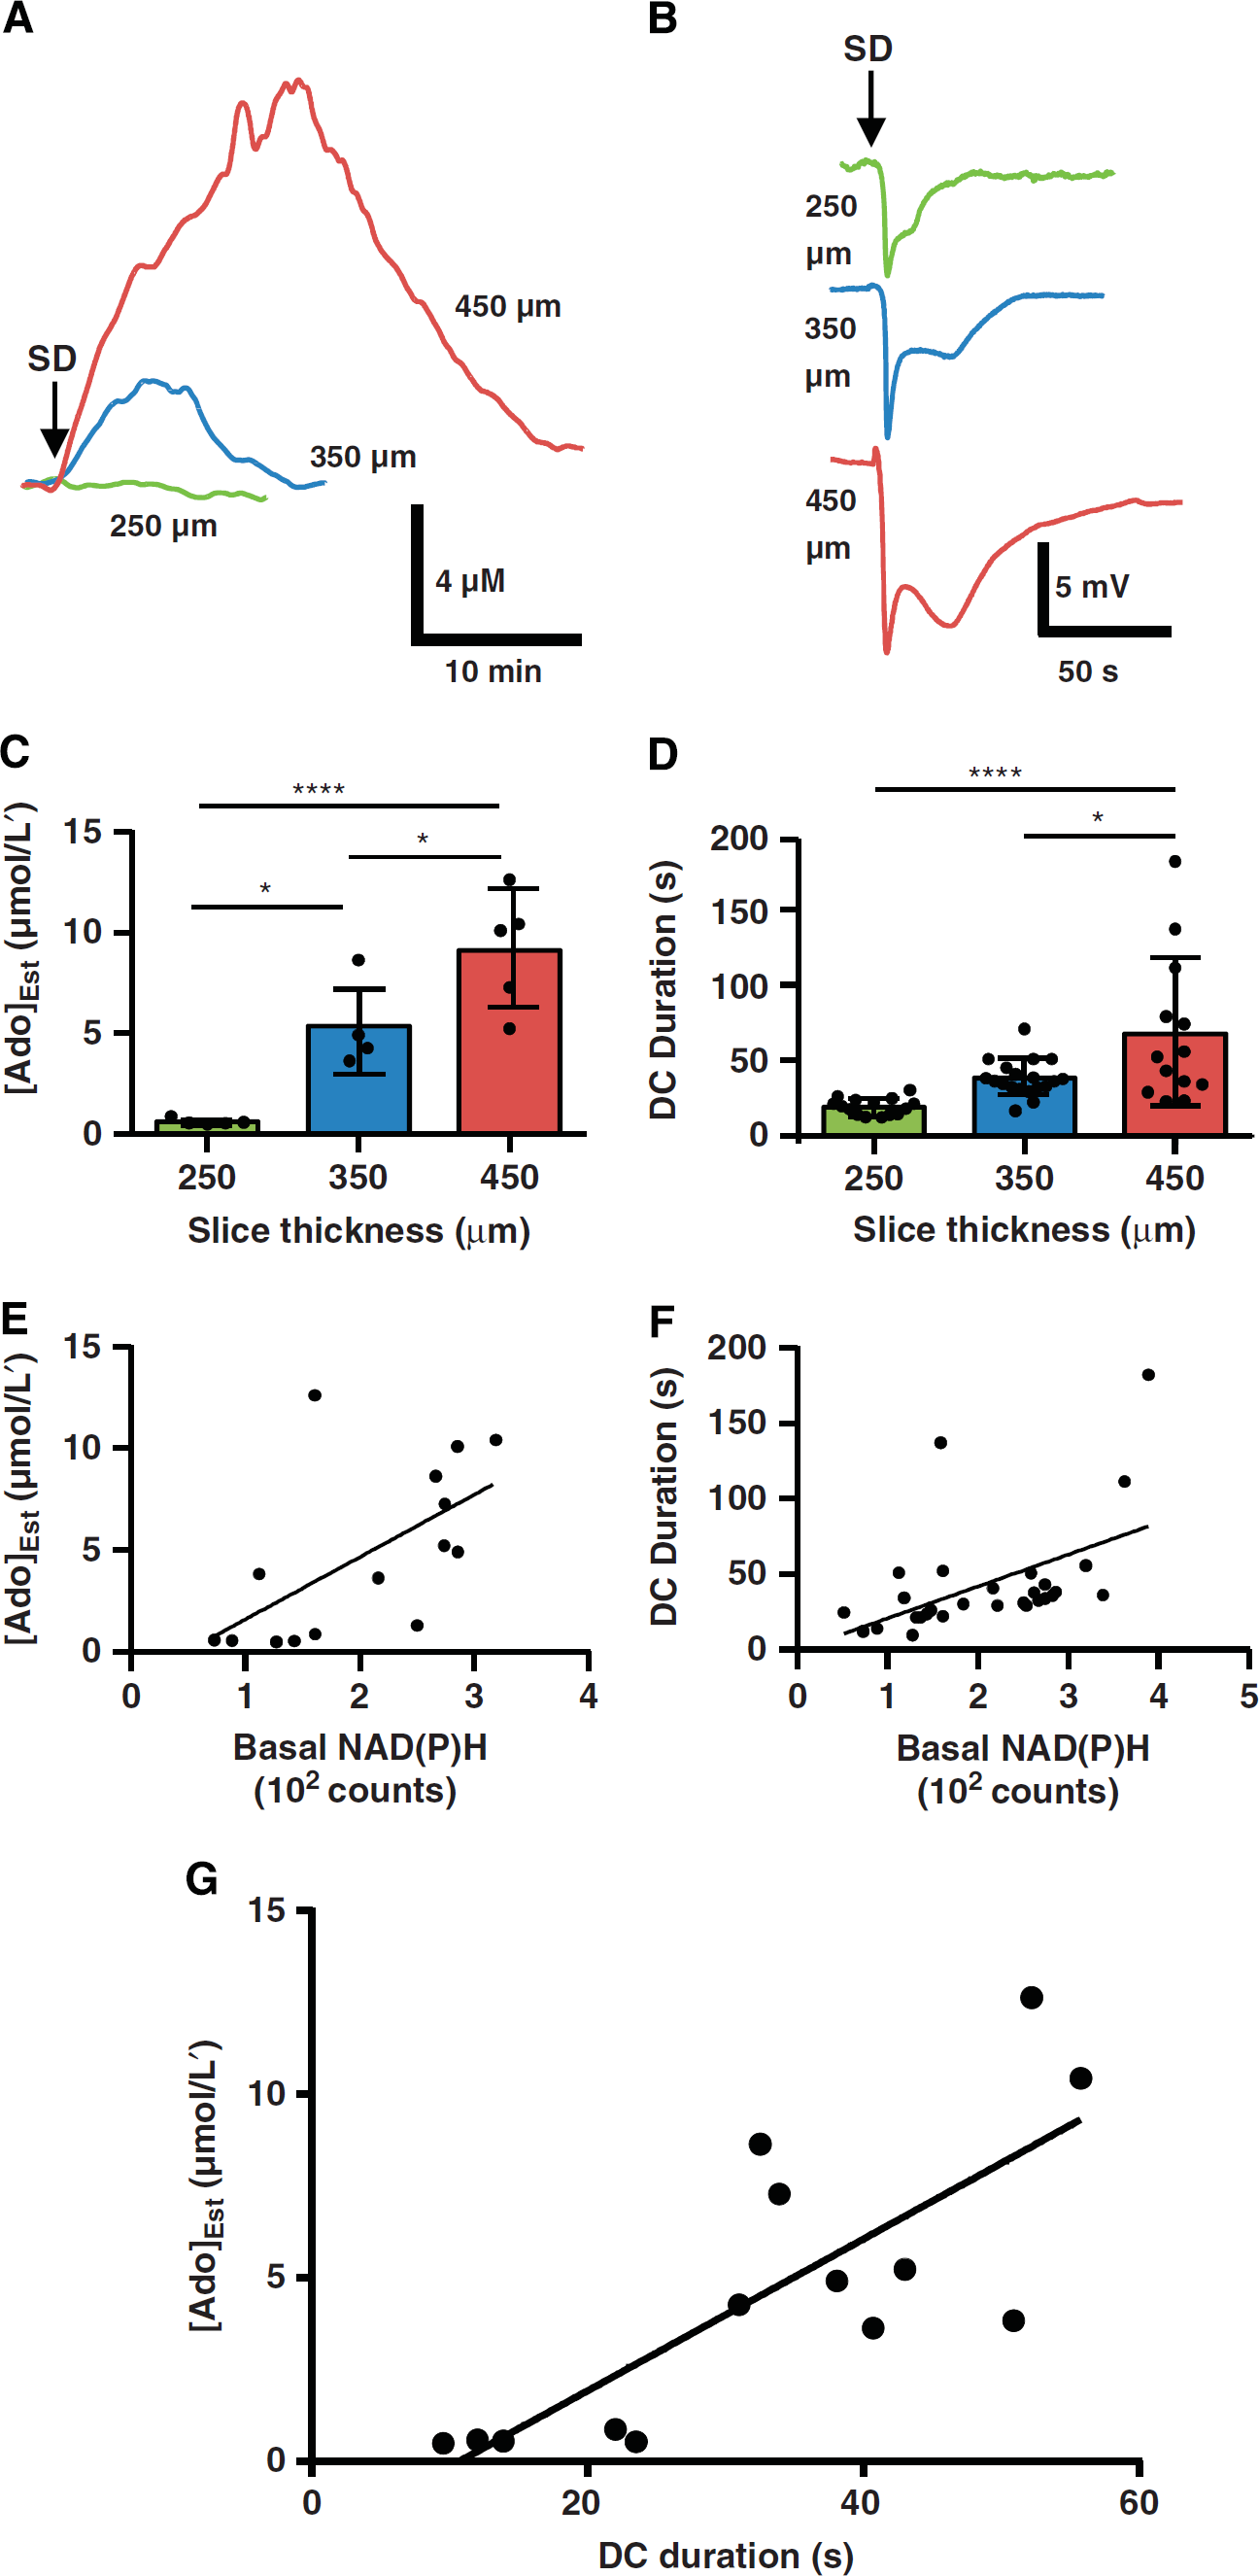
Metabolic impairment prolonged direct current (DC) shifts and increased spreading depolarization (SD)-evoked adenosine accumulation. (
As noted above (Introduction), DC shift duration is one established biomarker for injurious SD.10,12 We found a positive relationship between DC shift duration and the peak amplitude of adenosine transients (Figure 2G), assessed over the range of metabolic status shown in Figure 1. Total adenosine accumulation (estimated from AUC) also correlated with DC duration (Spearman r = 0.77, P<0.01, n = 14 slices from four animals). Together, these results indicated that adenosine increases became substantially larger in tissue in which repolarization was impaired or delayed by metabolic compromise before the onset of SD.
Relationship to Nicotinamide Adenine Dinucleotide (Phosphate) Dynamics
Previous authors have established that the magnitude of the NAD (P)H oxidative transient and flux through oxidative respiration (measured by changes in O2 tension) correlate with the metabolic demand placed on the tissue.23,27,28 We compared our observations of adenosine accumulation with O2 utilization and the oxidative transient of NAD(P)H during SD, across the range of different baseline conditions established in Figure 1.
During SD, decreases in O2 tension and oxidative transients in NAD(P)H autofluorescence were largest in slices with high O2 availability, and were progressively smaller in relatively more hypoxic slices (NAD(P)H ANOVA P<0.0001, pO2 ANOVA P<0.001, Figures 3A-C). pO2 decreases correlated with NAD(P)H oxidative transients (Spearman r = 0.8549, P<0.001) as expected for mitochondrial NADH signals. After SD, the peak adenosine signals measured at the slice surface were negatively correlated with the magnitude of NAD(P)H oxidative transients (Figure 3D). In agreement with prior work,25,34 the duration of the oxidative transient was longest in high O2 conditions, and considerably shorter in slices with more limited oxygen availability (14.2 ± 5.1 versus 6.1 ± 1.6 versus 5.6 ± 1.6 seconds, 250 versus 350 versus 450 μm, ANOVA P<0.0001; 250 versus 350 P<0.001 and 250 versus 450 P<0.0001, Bonferroni-corrected t-tests, n = 10, 10, 7 slices from eight animals).
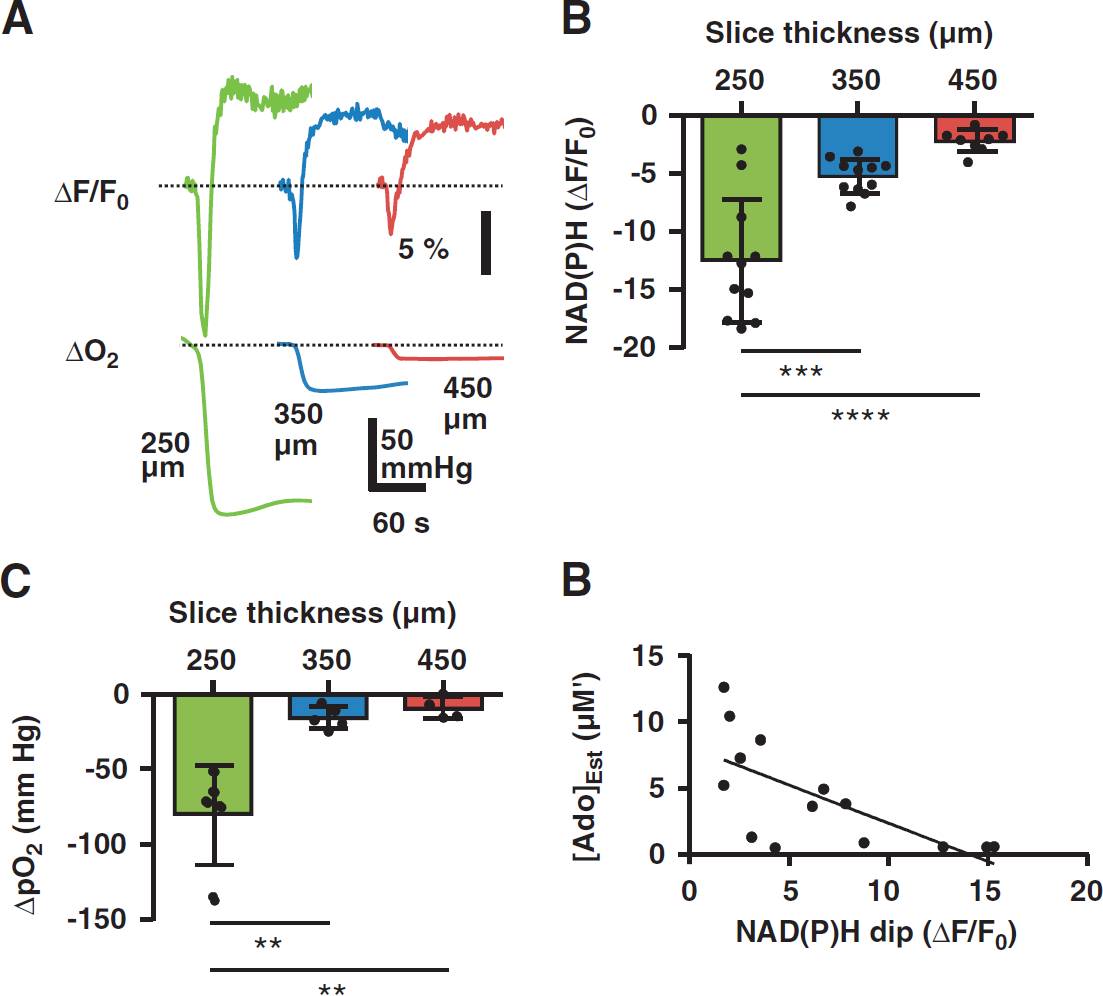
Mitochondrial signals of oxidative metabolism correlated with adenosine accumulation. (
The amplitudes of overshooting autofluorescence increases (Figure 3A) were largest in brain slices with high basal pO2 (dF/F0 13.3 ± 5.6 versus 8.2 ± 5.1 versus 7.7 ± 2.8%, 250 versus 350 versus 450, ANOVA P<0.05, P<0.05 Bonferroni-corrected t-tests 250 versus 350 and 250 versus 450, n = 11, 10, 8 slices from eight animals). This observation contrasts with prior reports of increased overshoot amplitudes in relative hypoxia.3,27 In the current study, amplitudes of overshoots in 450 μm slices may have been partly limited by a ceiling effect on NAD(P)H signal increases (see below). Another factor that likely contributes to the apparent discrepancy is contamination by profound swelling-related intrinsic optical changes that occur after SD, and that can be influenced markedly by the optical recording configuration (submersion versus interface chambers). Thus, we did not further interpret overshooting autofluorescence increases after SD in the present study.
Direct current shifts correlated with NAD(P)H oxidative transients (Spearman r = 0.6882, P<0.0001, n = 29 slices from eight animals), although the relationship was significantly nonlinear (P<0.01, runs test) and better fit by a first-order exponential than by linear regression (P<0.05). This pattern could be explained by a ceiling effect, such that under hypoxic conditions when NAD(P)H oxidative transients approached zero, DC durations continued to increase owing to the unmet metabolic demand. Consistent with this interpretation, the NAD(P)H response to hypoxia was significantly blunted in 450 μm slices (maximum dF/F0 after 20- minute hypoxia exposure 26.7 ± 7.6 versus 27.1 ± 5.6 versus 14.7 ± 3.7%, 250 versus 350 versus 450 μm, P<0.01 ANOVA, n = 6,6,6 slices from two animals). By contrast with NAD(P)H signals, the relationship between adenosine and DC shift duration was linear throughout the range (P = 0.29, runs test) and better fit by linear regression than by an exponential function. These findings suggested that compared with NAD(P)H autofluorescence changes, adenosine signals were better able to distinguish severe metabolic compromise resulting from SD in hypoxic conditions.
As noted above, our data were consistent with the model that adenosine accumulation resulting from SD was modified by basal metabolic status, but might be confounded by the larger volume of tissue in thick brain slices. Therefore, we tested whether varying metabolic status in slices of fixed thickness would have a similar effect on SD-associated adenosine transients. Figure 4 shows that reducing basal O2 availability to physiologic values 28 was sufficient to amplify adenosine signals after SD in 250 μm slices. Equilibrating aCSF with 21% rather than 95% O2 significantly reduced pO2 at the slice surface (30.9 ± 25.2 versus 189.8 ± 42.9mmHg, paired t-test P = 0.0001, n = 6 slices from three animals) and increased NAD(P)H autofluorescence (225.5 ± 47.9 versus 193.8 ± 43.6 counts, paired t-test P<0.001, n = 5 slices from three animals), without itself increasing adenosine to detectable levels. In 21% O2 conditions, SD-evoked adenosine transients were easily detected from 250 μm slices, with accumulations approximately fourfold larger than in 95% O2 conditions (Figures 4A and 4B), and adenosine signals were more dramatically increased in the same preparations by subsequent OGD challenges (AUC 2.6 ± 1.6 versus 10.2 ± 7.1 versus 52.7 ± 21.9 mmol/L's, ANOVA P<0.05, Figures 4A and 4B). Thus, differences in SD-induced adenosine accumulation were attributable to basal metabolic status in a model without tissue volume as an experimental variable.
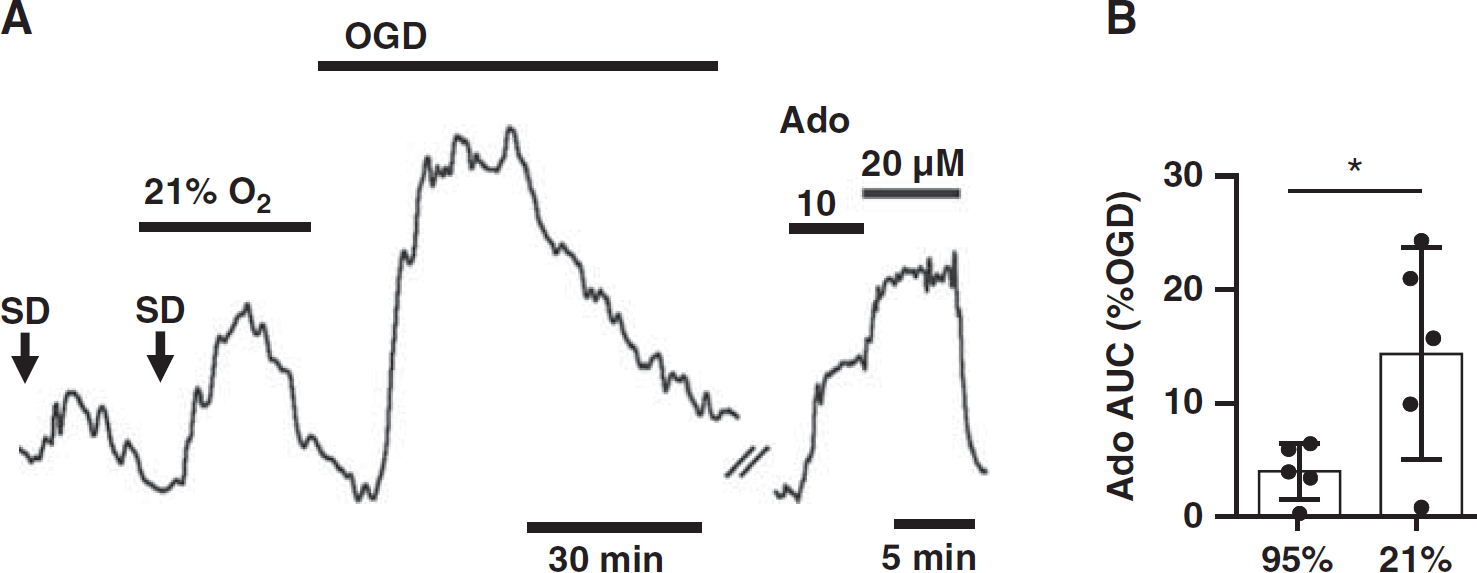
Graded metabolic impairment increased spreading depolarization (SD)-associated adenosine accumulation in brain slices of fixed thickness. (
Neocortical Slices
Before transitioning to in vivo recordings of SD in neocortex, we repeated some key experiments in neocortical regions of brain slices to establish that it was feasible to detect an adenosine signal from this tissue. After SD confirmed by intrinsic optical signals and DC shifts, adenosine accumulated to 8.6 ± 3.4 μmol/L’ (AUC 5.5 ± 4.7 mmol/L's) at the surface of 350 μm slices and 19.2 ± 7.2 μmol/L' (AUC 19.7 ± 10.3 mmol/L's) in 450 μm slices (peak P<0.05, AUC P<0.05, 350 versus 450 μm, unpaired t-tests n = 5,5 slices from two animals) (propagation rate 2.8 ± 1.3 and 2.6 ± 0.7 mm/minute, DC amplitude −4.9 ± 1.6 and −6.1 ± 2.0 mV, DC duration 97.9 ± 28.2 and 79.1 ± 36.4 seconds, respectively). In metabolically compromised slices (450 μm) subjected to SD, more adenosine was detected from cortex than from hippocampal CA1 (P<0.05, n = 5,5 slices from two animals), likely because the area of depolarized tissue was larger. 16
Adenosine Accumulation was Observed After SD In Vivo and Correlated with Direct Current Duration
Figure 5 shows that transient accumulation of adenosine was detected with SD in vivo. Figure 5D shows representative traces in one animal. The peak estimated adenosine concentration reached 25.9 ± 35.6 μmol/L' (range 4.3 to 58.5 μmol/L’) (n = 14 SDs from eight animals) and all peaks occurred after DC shifts; and under these conditions, adenosine peaks were never seen without a confirmed SD. Adenosine transients decayed slowly over several minutes, returning to within 10% of baseline at 24.7 ± 17.2 minutes. Events associated with adenosine accumulation were typical SDs. Direct current shift duration averaged 69.3 ± 35.9 seconds (n = 14 SDs from eight animals). Propagation rate, estimated from LSCI, was 3.5 ± 2.6 mm/minute (n = 3 SDs from two animals). The magnitudes of peak amplitudes of adenosine transients, as well as areas under the curve (AUC) each correlated with DC durations (peak, Spearman r = 0.71, P<0.01; AUC, Figure 5B), similar to findings in brain slice studies (Figure 3).
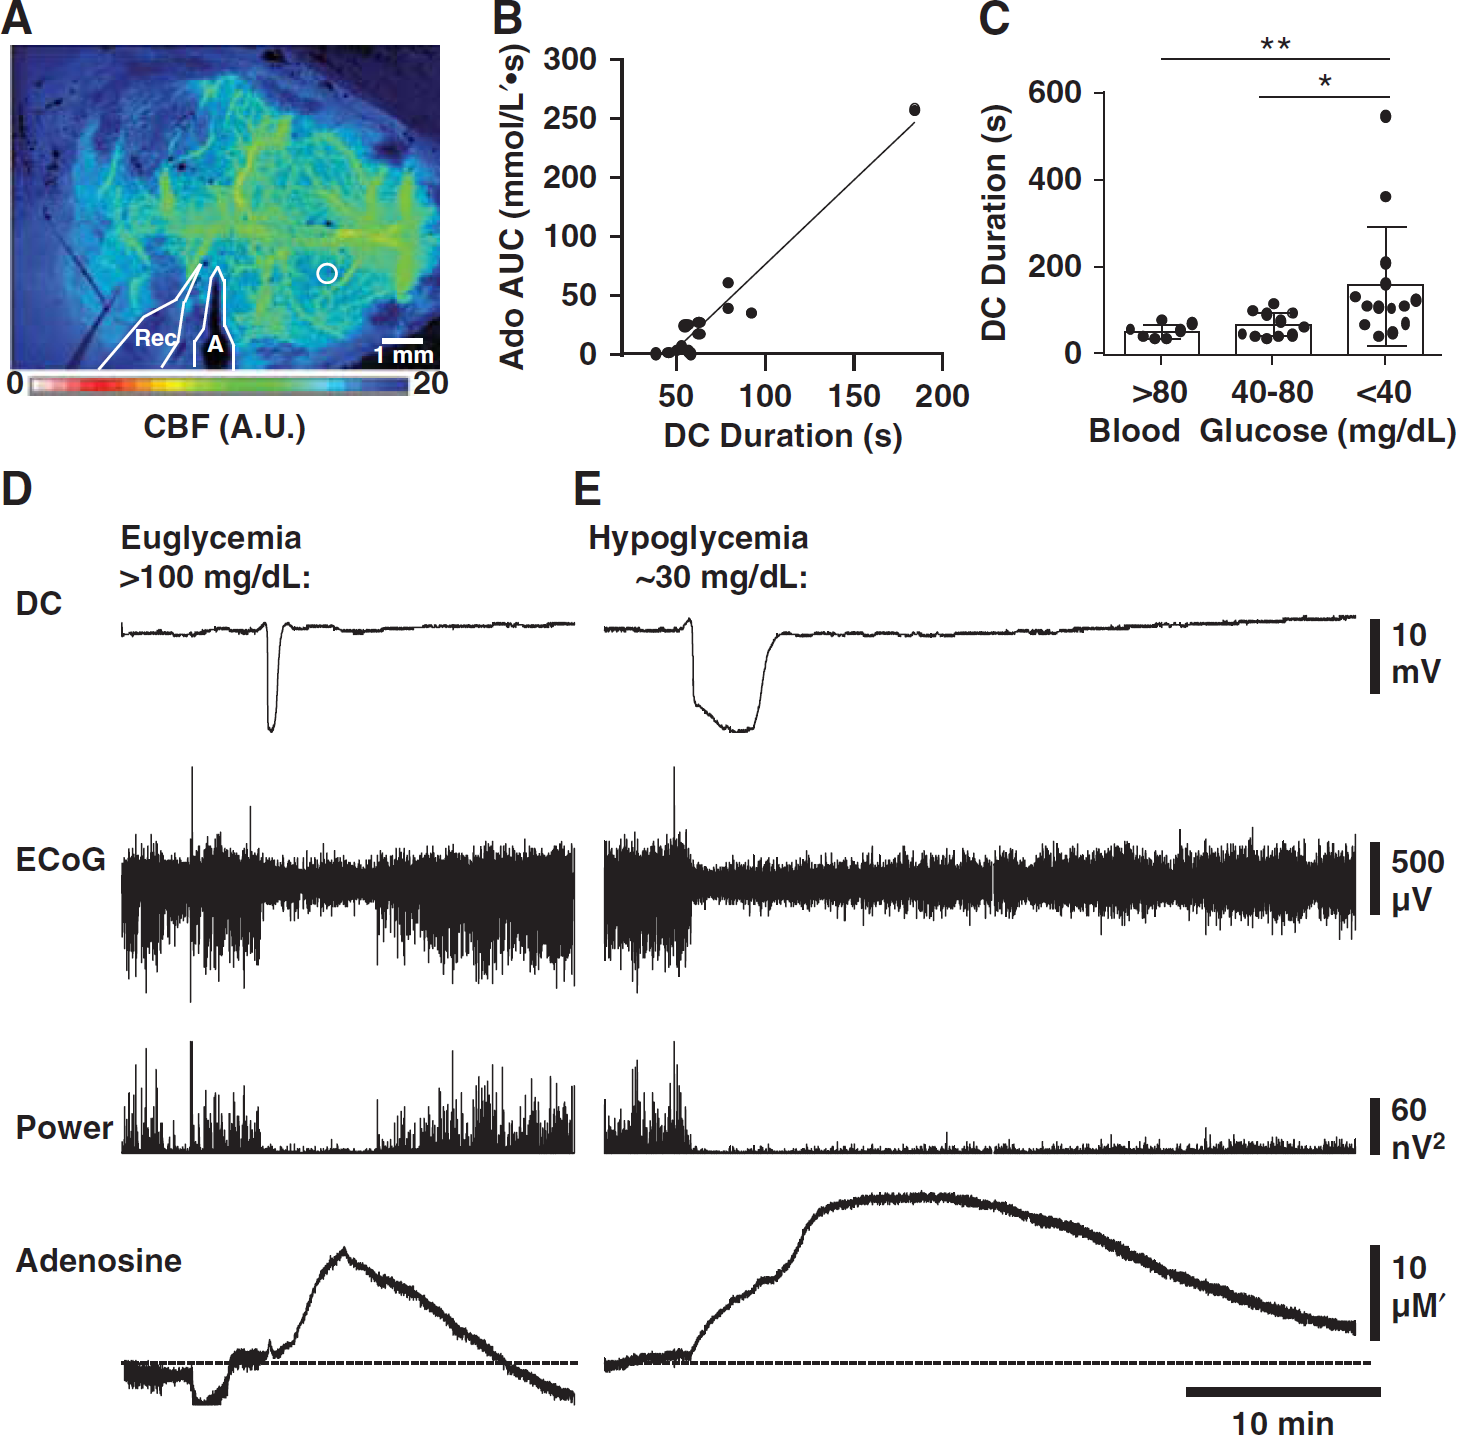
Detectable adenosine accumulation after spreading depolarization (SD) in vivo and enhancement under conditions of metabolic impairment. (
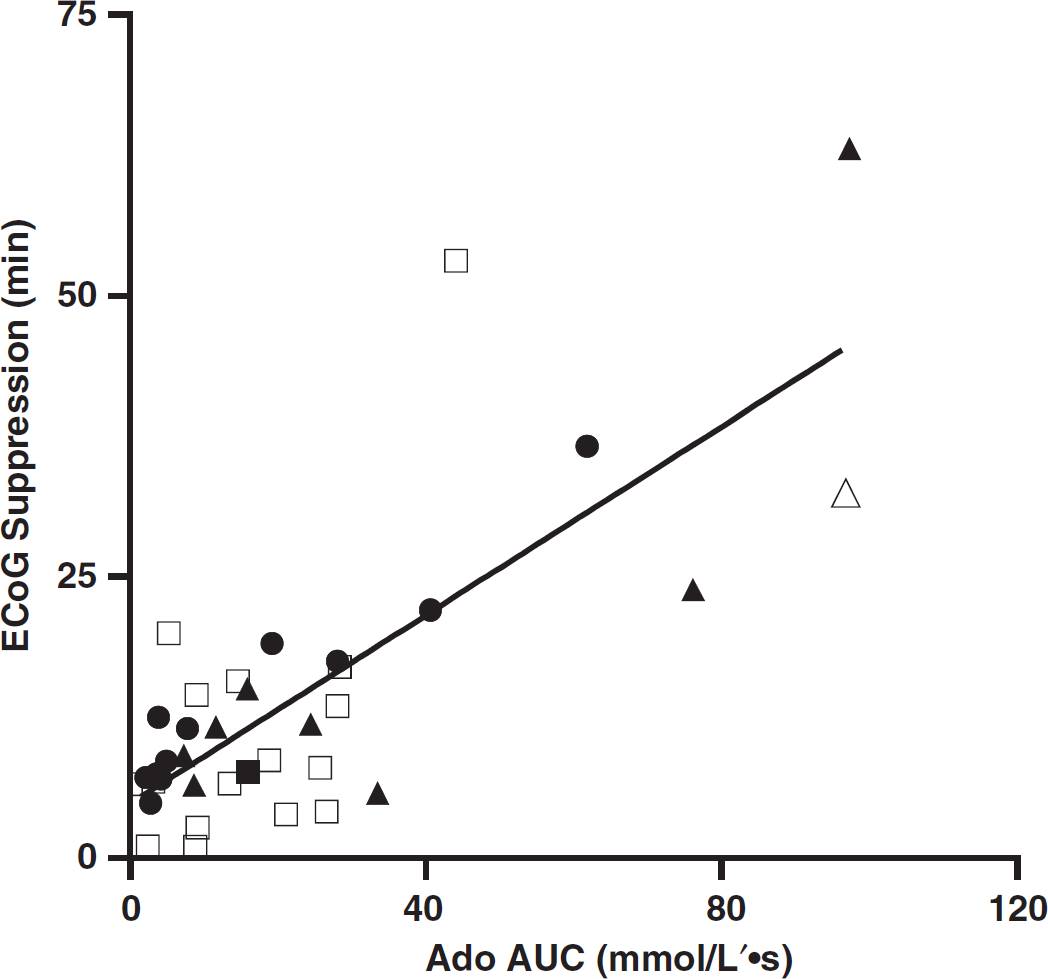
Electrocorticographic (ECoG) depression correlated with adenosine accumulation. Spreading depolarizations (SDs) from animals with insulin exposure (white squares) and without insulin (black circles), as well as SDs recorded during focal ischemia (individual SDs, black triangles; cluster, white triangle). Data shown are from non-isoelectric SDs only. Electrocorticographic suppression recorded during SDs correlated with adenosine accumulation (area under the curve (AUC)) (R2=0.5449, P<0.001). Each data set alone also showed this relationship (untreated: R2=0.9381, P<0.0001, n=10 SDs from six animals; insulin: R 2 =0.2440, P<0.05, n=18 SDs from three animals; evoked and spontaneous SDs in middle cerebral artery occlusion animals: (r=0.7167, P<0.05, n =9 SDs from six animals).
For the experiments in Figure 5, we induced SD in the otherwise healthy neocortex of anesthetized adult C57Bl/6 mice. As others have reported hypoxic domains associated with SD, 3 and hypoxia is known to be a potent stimulus for adenosine release, 14 we provided supplemental O2 to maintain arterial hyperoxemia >300mmHg throughout all in vivo experiments (see Materials and Methods). This allowed us to determine that SD itself, regardless of confounding effects of any associated hypoxia, could trigger adenosine accumulation.
In Vivo Adenosine Accumulation was more Pronounced when Metabolism was Impaired by Hypoglycemia or Ischemia
To evaluate the role of metabolic supply on adenosine accumulation after SD in vivo, we impaired metabolic status with insulin-induced hypoglycemia or with focal ischemia induced by dMCAO.
Hypoglycemia was induced by insulin injection (1.5 mU/g, intraperitioneally) in anesthetized mice while generating and recording SD and measuring associated adenosine signals from the cortex. As previously described by other authors,35,36 DC shifts were prolonged under hypoglycemic conditions (Kruskal-Wallis P<0.001, Figures 5C and 5E). Adenosine accumulation showed a significant positive correlation with DC shift duration in insulintreated animals (Spearman r = 0.4545, P<0.05, n = 21 SDs from five animals).
In insulin-treated animals, adenosine transients reached peaks comparable to those seen in untreated animals (26.2 ± 14.2 μmol/L’; range: (3.5 to 45.2 μmol/L’)). Interestingly, the effect of serum blood glucose concentration on DC duration was nonlinear, and was better fit by a first -order exponential than by linear regression (P<0.05). That is, DC shifts remained short even well below the physiologic range of systemic glucose concentrations, and did not become obviously prolonged until glucose fell below 40 to 45 mg/ dL, or around the threshold of clinical neuroglycopenia. 37 In two out of eight insulin-treated animals, SDs occurred spontaneously (at blood glucose levels of 22 and 28 mg/dL), consistent with prior investigations of severe hypoglycemia. 38 Severe hypoglycemia alone was a poor predictor of adenosine accumulation resulting from SD (AUC 16.91 ± 13.31 versus 16.37 ± 20.27 mmol/L's, glucose <40 versus ≥40 mg/dL, P = 0.9318). Rather, only those hypoglycemic SDs that also had prolonged DC shifts generated larger adenosine signals.
We induced focal ischemia by occlusion of the distal middle cerebral artery following previously described procedures, 30 then recorded adenosine and electrophysiologic signals from burr holes placed adjacent to the predicted dMCAO core and monitored relative cerebral blood flow using LSCI (Figure 6A). We observed spontaneous SDs in 8 out of 14 animals with dMCAO (latency to first periinfarct depolarization, 136.0 ± 132.1 minutes, range 7 to 354 minutes; Figure 6B). Each SD that was confirmed by a clear DC shift was accompanied by a readily resolvable, transient increase in adenosine signal (Figure 6D, n = 15 SDs from eight animals) and these reached an average of 22.5 ± 11.2 μmol/L’ (range: 4.7 to 47.3 μmol/L‘). As ischemia progressed, DC shifts tended to become more prolonged and adenosine signals increased (Figures 6C and 6D). Adenosine accumulation correlated with DC durations of spontaneous SDs in dMCAO animals (peak, Spearman r = 0.6182, P<0.01, n = 18 SDs from eight animals). Compared with other reports of dMCAO, the delay and/or prevention of SD in some of our animals was likely related to the use of isoflurane as anesthetic 39 and the intentionally elevated arterial O2 content. 29 Twenty-eight SDs in 74.4 recording hours were detected by LSCI transients, and of these, 21 SDs were confirmed by DC shifts. Laser speckle contrast imaging detected seven SDs that did not propagate through the DC recording site, likely owing to the inadvertent positioning of electrode in infarcted or otherwise damaged tissue. Electrophysiologic signals from six additional SDs in dMCAO animals were excluded from further analysis because DC deflections were ambiguous or too small to measure reliably.
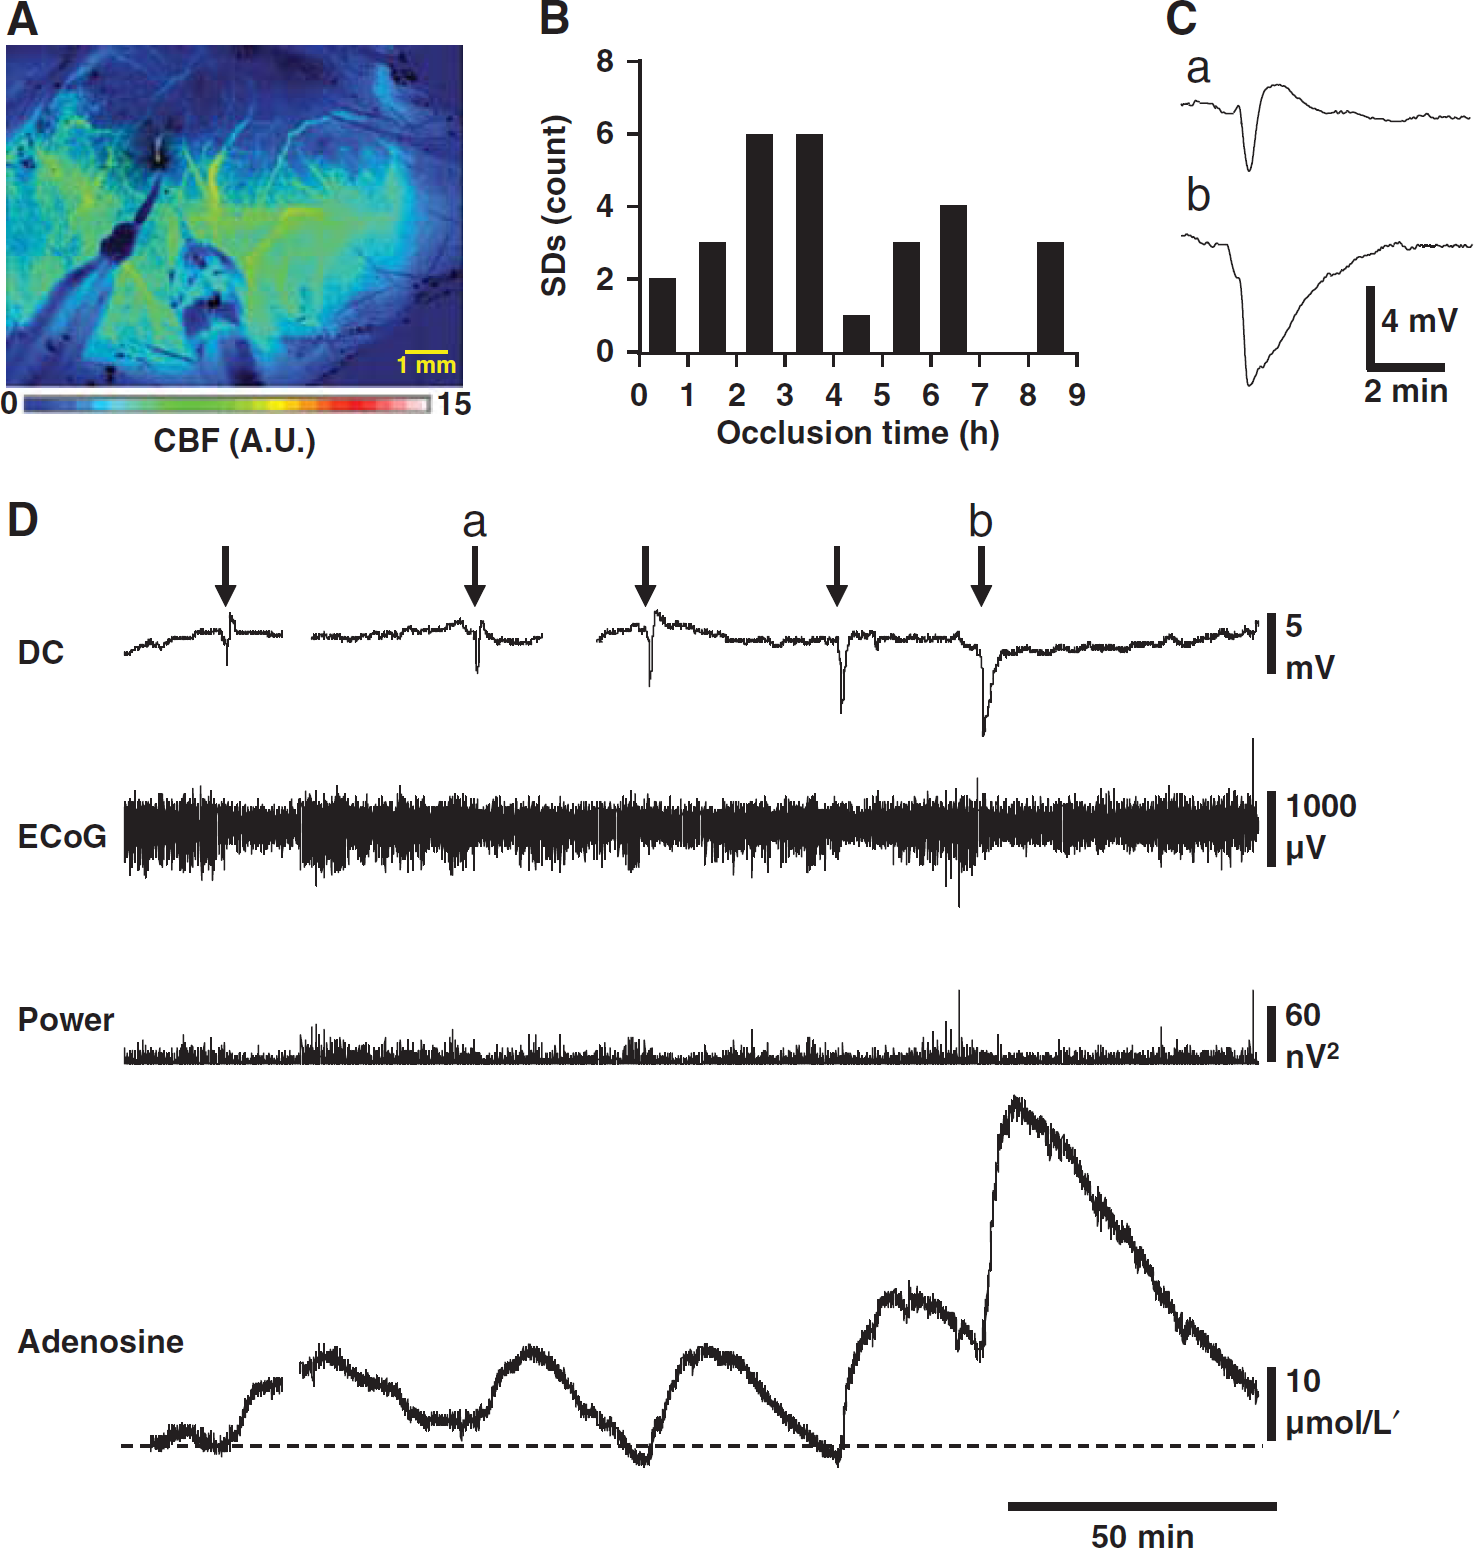
Adenosine accumulation in periinfarct tissue was linked to spreading depolarization (SD) events. (
Perfusion deficits resulting in SDs were not significantly larger than perfusion deficits failing to elicit SDs (9.3 ± 5.4% versus 7.7 ± 4.7%, P = 0.55, n = 8, 6 animals) and no dose-effect relationship was detected between perfusion deficits and number of SDs (P = 0.5066, n = 14 animals). We evaluated signals for indications of gradual adenosine accumulation before the onset of the first SD, and between events. A rising adenosine baseline was briefly seen (for ∼40 minutes) in only 1 out of 14 dMCAO animals (with a slope of 6.74 nmol/L’ per second), after an ambiguous DC signal. Otherwise, adenosine transients were not seen before SD, in intervals between SDs, or in animals without SDs (P<0.001, maximum peak-to-trough adenosine amplitude from dMCAO animals without SD compared with signals recorded in animals immediately after SD). Isoelectricity was observed at the onset of recording in 3 of 14 dMCAO animals, and could indicate these recordings were made from the belt of normally perfused yet electrocorticographically depressed tissue surrounding ischemic lesions, 40 or that an undetected spreading depression or nonspreading depression (possibly mediated by adenosine 41 ) may have occurred before recording.
Considering all SD-associated adenosine measurements together, whether from untreated, hypoglycemic, or infarcted animals, a correlation was seen between DC durations and adenosine accumulation (peak Spearman r = 0.5092, P<0.0001, n = 54 SDs from 17 animals; AUC Spearman r = 0.5209, P<0.0001, n = 56 SDs from 20 animals). The resolution of electrocorticographic (ECoG) depression has also been interpreted to be an indirect indicator of metabolic recovery after SD. 12 Consistent with this, a relationship was observed between adenosine accumulation and ECoG suppression, for each data set alone (normoglycemia, hypoglycemia, dMCAO, Figure 7) and for all-cause SD considered together (Spearman r = 0.5797, P<0.001, n = 37 non-isoelectric SDs from 18 animals). This relationship might also have been predicted from results presented above, as adenosine accumulation was seen to correlate with DC shift duration, and DC shift duration has previously been shown to correlate with ECoG depression in nonisoelectric SDs. 12 The latter relationship was also detected in the present data set (Spearman r = 0.3045, P<0.05, n = 43 SDs from 17 animals).
Thus, in vivo studies under conditions of metabolic compromise confirmed the relationship between DC shift duration and adenosine accumulation and revealed a striking pattern of adenosine signals associated with stroke-induced SDs rather than ischemia per se.
DISCUSSION
The major new findings of this study were that (1) SD in vivo generated robust adenosine transients in otherwise healthy mice, (2) adenosine signals associated with focal stroke were pulsatile and intimately linked to SDs, and (3) adenosine signals triggered by SD could reliably report underlying metabolic status in brain slices and in vivo, and compared favorably with other established measures of metabolic demand including DC shift durations, NAD(P)H and O2 signals, and electrocorticographic depression. These findings suggested that adenosine could be used as a biomarker or adjunct modality to detect SD-associated metabolic demand in excess of available substrate (i.e., glucose and oxygen), in tissue vulnerable to injury. Adenosine accumulation may also be implicated in functional consequences of SD including effects on blood-brain barrier permeability, neuroinflammation, synaptic transmission, and vascular tone.
Adenosine Accumulation in Brain Slices is a Marker of Severe Metabolic Burden of Spreading Depolarization
As discussed in the Introduction, extracellular adenosine is sensitive to small changes in intracellular ATP concentration. Here, we found that in addition to being quite sensitive, adenosine signals correlated with unmet metabolic demand across a wide dynamic range as compared with other signals.
Our results (Figures 1–4) indicated that adenosine increases became substantially larger in tissue that was metabolically compromised before the onset of SD, supporting the hypothesis that energy demand in excess of supply during SD is a major source of this signal. Our adenosine signals were similar to others with amperometric probes in brain slices undergoing K+-induced depolarization (∼10 μmol/L 42 ) and OGD-induced SD 33 and were in line with in vitro estimates based on pharmacology during intermittent OGD (∼30 μmol/L). 43 Our in vitro findings further suggested that extracellular adenosine could serve as a surrogate marker of DC shift duration.
Approaches to explicitly assess the metabolic burden of SD in brain slices have included NADH autofluorescence and O2 measurements, among others.23,27 As a measure of metabolic responses to SD, adenosine was better than NAD(P)H dynamics in compromised tissue (Results, Figure 3), in that NAD(P)H signal dynamics approached a ceiling as hypoxia became more extreme, whereas adenosine could still distinguish degrees of DC shift prolongation. O2 signals similarly approached a floor effect, whereas adenosine signals increased linearly across the range of metabolic status tested.
Graded Spreading Depolarization-Induced Adenosine Release was Observed In Vivo
We observed adenosine accumulation time-locked to SD in vivo (Figure 5). The peak adenosine concentrations we estimated were higher than those previously reported by microdialysis in a study where EEG depression was used to detect SD (∼300 nmol/L 20 ). Our findings support the conclusion of this prior study, that adenosine accumulation was a consequence of SD; and it is likely that pooling samples across several minutes in the microdialysis study may have led to underestimation of peak values. Our values are on the order of those reported in another microdialysis study of adenosine in a fluid percussion model of traumatic brain injury (6 μmol/L), 19 in which SD likely occurred, although its occurrence was not monitored. At the concentrations estimated here, adenosine might be expected to activate all subtypes of P1 receptors, including A1, A2A, and A2B and A3 receptors. Such receptor activation could have broad implications for electrocortical suppression, blood-brain barrier permeabilization, vascular reactivity, thermoregulation, and neuroinflammation after SD. 13 All these targets, individually or in combination could contribute to neuroprotection or neurotoxicity in different disease contexts. In addition, adenosine increases could be detected even during DC shifts, raising the possibility that adenosine could modify transmitter release or excitability even during the passage/ propagation of SD events.
In general, in vivo findings (Figures 5–7) built upon our conclusions from brain slice studies 16 (Figures 1–4) that SD led to accumulation of adenosine in a physiologically relevant range, even in the context of intact neurovascular coupling (Figure 5). Although the adenosine signals we detected by amperometric probes were specific to SD, studies in brain slices suggested that providing tissue with supraphysiologic availability of substrate and O2 could limit adenosine accumulation below detectable levels (Figure 2). Thus, while adenosine signals from amperometric probes were specific to SD, they were not sufficiently sensitive to detect small adenosine releases associated with SD under conditions of supraphysiologic metabolic supply. As a stand-alone screening tool, adenosine would likely carry a low false-positive rate and a relatively higher false-negative rate. The SDs missed by adenosine would be those carrying the lowest pathologic risk.
Clinical research protocols have generally measured DC shift duration and ECoG suppression as markers of the metabolic impact of SD, and thus required direct electrical access to the cortical surface. However, recent work has revealed a metabolic signature of SD, including decreased glucose and elevated lactate/pyruvate ratio in patient microdialysate samples.6,44 Our findings build on this prior work, and suggest that adenosine may be a useful adjunct biomarker for SD and in some cases, may be more sensitive to subtle disturbances in metabolism after SD.
Recapitulating findings from our slice studies, the total accumulation in response to SD in vivo was graded, increasing linearly with the duration of the DC shift when tested under conditions of progressive metabolic compromise (Figures 3 and 5). Electrical features of SD (DC shift duration and prolonged electrocorticographic (ECoG) suppression) have previously been used as markers of metabolic impairment,12,45 and it is known that tissue undergoing SD on a background of ECoG suppression (so-called ‘isoelectric SD‘) has a poor prognosis. Here, adenosine accumulation correlated with both DC shift durations and ECoG suppression (Figures 5 and 7), and could therefore be useful as a proxy marker of vulnerable tissue undergoing SD. Compared with ECoG suppression, adenosine has the added benefit of providing information about metabolic recovery in isoelectric tissue.
Consistent with prior reports, we observed that DC shifts became prolonged as systemic blood glucose approached neuroglycopenic levels (<40 mg/dL, Figure 5). The observation that hypoglycemia prolongs DC shift durations is well established.35,36 Presumably, substrate deficiency limits energy production below that required for [K+]o clearance by Na+/K+ATPase and thus delays cellular repolarization. 38 Previous authors have demonstrated that SD itself depletes glucose levels, which require 25 to 30 minutes to recover. 4 This time course closely matches the period of metabolic recovery marked here by adenosine elevation. Thus, these metabolic signals are concordant, and our data support the conclusion that there is a vulnerable period marked by metabolic depletion after SD. 4 We suggest that, like glucose, adenosine signals appear to be sensitive to deteriorations of energy status in compromised tissue, and could serve as a useful prognostic marker under certain conditions.
Adenosine in Stroke Linked to Spreading Depolarizations We observed adenosine peaks in association with depolarizations around the perimeter of focal strokes (Figure 6). Adenosine transients in periinfarct regions almost always followed the occurrence of SDs, recovering to baseline during quiescent intervals. To our knowledge, this is the first report of this pattern of pulsatile adenosine accumulation in stroke. The maximum adenosine levels associated with SDs in the ischemic penumbra, estimated here, were higher than concentrations reported on the basis of microdialysis in the striatum at specific time points after filament MCAO (2.7 μmol/L 18 ), and in the cortex during global ischemia (3.5 μmol/L 17 ). This discrepancy can be explained by the fact that we measured continuously at a relatively high sampling rate (1 kHz) rather than pooling samples from tens of minutes, and thus were able to detect transient peaks. Because the latency to SD varies from animal to animal (Figure 6B), and because accumulation is transient, an analysis scheme that aligned measurements by occlusion time would have averaged samples obtained during SD with those from quiescent periods, yielding a lower estimate of adenosine concentration and contributing to variability.
Although we did not report on adenosine signals within the ischemic core, it seems likely from brain slice studies of OGD that the initial adenosine release is linked to SD. 33 Importantly, our recordings do not provide information on basal adenosine concentrations, and cannot rule out the possibility that values were elevated at baseline, or that an adenosine gradient existed across the ischemic penumbra. Such basal adenosine tone, if present, could mitigate the inverse neurovascular coupling and long DC shifts characterizing SD in periinfarct regions46,47 and would be expected to inhibit seizure activity. 15 In addition, we acknowledge that O2 supplementation provided in our studies may have improved metabolic status, in those regions with preserved residual blood flow. However, these continuous adenosine recordings were made from the beginning of acute strokes and continued for up to 8 hours, and no progressive increases in baseline were observed.
A model in which adenosine gradually accumulates owing to progressive metabolic impairment in the penumbra, or owing to diffusion from the ischemic core, was not supported by the pattern we observed, although it is possible that isoelectricity in the periinfarct region was mediated in part by adenosine accumulation below our threshold of detection.40,41 We instead suggest that the bulk of adenosine released in stroke is pulsatile and linked to occurrence of SDs and not to gradual deterioration of metabolic status. If this is true, it follows that the more adenosine accumulation is observed, the more SDs (or the worse the SDs) may be inferred to be occurring. Prior work has shown that adenosine levels strongly predict neurologic impairment and lesion size after ischemia; 48 together with other foundational data on SD,10,11 the current findings suggest that adenosine signals indicate the number or severity of SDs, whereas the SDs themselves likely have a causal role in consolidation and expansion of ischemic lesions.
Our findings suggested that adenosine (or its derivatives) might serve as useful biomarkers of SD in injured brain. Although speculative, the incorporation of adenosine-sensitive probes into ventricular drains or central line catheters could enable detection of brain-derived adenosine in cerebrospinal fluid or plasma in patients without craniotomy, as a means to estimate SD burden. Indeed, adenosine is elevated in the peripheral blood of patients recovering from transient ischemic attacks and stroke. 49 Adenosine's short half-life (∼300 ms in plasma) may allow individual events to be resolved. However, uric acid (the stable end-product of adenosine degradation in humans), 13 may better report the cumulative severity of SD, and can be detected noninvasively in urine or serum.
Footnotes
The authors declare no conflict of interest.