
Abstract
Receptor occupancy studies performed with PET often require time-consuming dynamic imaging for baseline and post-dose scans. Shorter protocol approximations based on standard uptake value ratios have been proposed. However, such methods depend on the time-point chosen for the quantification and often lead to overestimation and bias. The aim of this study was to develop a shorter protocol for the quantification of post-dose scans using a dual time-point approximation, which employs kinetic parameters from the baseline scan. Dual time-point was evaluated for a [11C]raclopride PET dose occupancy study with the D2 antagonist JNJ-37822681, obtaining estimates for binding potential and receptor occupancy. Results were compared to standard simplified reference tissue model and standard uptake value ratios-based estimates. Linear regression and Bland–Altman analysis demonstrated excellent correlation and agreement between dual time-point and the standard simplified reference tissue model approach. Moreover, the stability of dual time-point-based estimates is shown to be independent of the time-point chosen for quantification. Therefore, a dual time-point imaging protocol can be applied to post-dose [11C]raclopride PET scans, resulting in a significant reduction in total acquisition time while maintaining accuracy in the quantification of both the binding potential and the receptor occupancy.
Introduction
One of many applications of positron emission tomography (PET) is to investigate the suitability and target engagement of new pharmaceuticals in vivo. With a suitable radiotracer for the same target, PET imaging is able to measure receptor occupancy or enzyme inhibition of a new drug. 1 These studies evaluate the drug’s ability to reach its target and determine the proper dosage to reach specific occupancy levels for the intended effect. Therefore, PET dose occupancy studies play an important role in drug advancement by accelerating development in a focused manner and reducing trial costs. 2
In order to obtain the relationship between drug concentration in plasma and the achieved percentage of receptor occupancy (Occ%), a multiple-scan PET occupancy study must be designed. The study design consists of a baseline scan followed by either one or more scans after drug dosing (i.e. post-dose scans). Assuming no change in tracer affinity 3 and correcting for possible influence of the drug of interest in the delivery of the tracer, the competition between drug and radiolabeled ligand results in a reduction in specific tracer uptake seen in the target in the post-dose scans compared to the baseline. This difference provides information on the amount of receptors occupied by the drug. 4
When a brain region devoid of the target of interest is available, receptor occupancy can be calculated by using either distribution volume ratio (DVR) 5 or binding potential (BPND) estimated from a reference region approach. These models can provide indirect input functions by using information given by the reference region about the tracer’s non-specific binding properties. Methods such as the simplified reference tissue model (SRTM) 6 allow direct estimation of the binding potential from a dynamic scan and therefore contribute to a straightforward quantification of receptor occupancy. However, most reference tissue methods require time-consuming full dynamic scanning protocols.
Reduction in scan duration is of particular interest in drug occupancy studies, as subjects must undergo at least two PET scans per study. Additionally, shorter protocols allow more flexibility in a study set, increase comfort, and lower costs. On that account, approximations have been proposed7–9 in order to obtain the DVR or the BPND from short static imaging protocols. These relate a late time ratio between tracer uptake in target and reference tissues, expressed in standard uptake values (SUVR), to the receptor imaging parameters. However, such approximations rely on the assumption that the tracer is in transient equilibrium at late time points. 7 Besides being dependent on the correct determination of the equilibrium period, such methods have been demonstrated to consistently overestimate DVR and BPND.7,8,10
The aim of this study was to avoid the overestimation associated with SUVR based methods while maintaining short and flexible acquisition protocols. Therefore, an equation relating DVR to SUVR was derived and different methods to calculate the resulting correction term were investigated. The proposed method uses a combination of dynamic baseline and dual time-point static post-dose scans. Although the method still requires dynamic information, it might prove useful in the context of multi-scan protocols, such as dose occupancy studies. Within such a context, it is assumed that the specific kinetic parameters used in the method remain constant between scans. Consequently, the dynamic information necessary for the quantification of the post-dose scans can be extracted from the baseline scans. In this case, BPND and occupancy values can be estimated from a dynamic baseline and a series of static post-dose scans, thereby reducing the overall acquisition time while maintaining accuracy.
Material and methods
Dual time-point approximation
When the tracer kinetics in the target and reference compartments can be approximated by a one-tissue compartment model (1TCM),
3
the SRTM can be applied and the instantaneous change in tracer concentration in each compartment is described by


The apparent

Combining (1) and (2) by isolating


Equation (5) shows that estimation of DVR requires the determination of (1) the SUVR and (2) a time-dependent correction factor. The second is defined by the slope of target and reference tissue time-activity curves (TAC) normalized to the reference tissue tracer concentration (
Taking into account the activity concentration of two scan frames of equal duration, a dual time-point SUVR is calculated as the geometric mean
11
of tracer concentration in each frame

The normalized slopes, defined by the instantaneous derivatives, are estimated from the same frames by a finite differences approximation

Using equations (6) and (7) and the baseline-derived washout rate constants for the determination of DVR, equation (5) can be determined from a dual time-point approximation, yielding DVRDTP or the corresponding binding potential BPDTP (BPDTP = DVRDTP − 1).
Therefore, with the proposed method, receptor occupancy values for post-dose scans are calculated based on the following definition

Study setup
The dual time-point method was evaluated by analyzing retrospective data from an open-label PET study that assessed the D2-receptor occupancy after single and multiple doses of 10 mg JNJ-37822681, as described previously. 29,30 The study was conducted in the University Medical Center Groningen (UMCG) PET center and was supported by Xendo Drug Development (Groningen, The Netherlands). Ethics committee approval was obtained (Stichting Beoordeling Ethiek Biomedisch Onderzoek, Assen, the Netherlands) and all subjects gave prior written informed consent after receiving detailed information about the protocol, in accordance with the ethical standards of the Helsinki Declaration of 1964 and its later amendments. The study population consisted of 11 healthy male subjects with ages ranging from 18 to 55 years, and a body mass index from 18 to 30 kg/m2.
All subjects underwent a structural T1-weighted MRI scan to enable image coregistration for the analysis. A baseline and two post-dose scans were performed, except for two occasions of tracer synthesis failure, totaling 31 scans (11 baseline and 20 post-dose). The baseline [11C]raclopride PET scans were acquired between 25 and 2 days prior to JNJ-37822681 dosing (day 1). Next, subjects received 10 mg of the compound twice a day, on days 1–6, and a single dose in the morning of day 7. On day 1, the first post-dose [11C]raclopride PET scans were performed 2.1 to 10.6 h after administration of the compound. During days 7–10, the second post-dose [11C]raclopride PET scans were obtained 2.6–58.5 h after dosing on day 7.
Dynamic [11C]raclopride PET imaging and analysis
All PET scans were performed with a high-resolution ECAT EXACT HR + scanner (Siemens Healthcare, Erlangen, Germany). Individual 2D 68Ge-based transmission scans of 10 min were acquired for attenuation correction. Both at baseline and post-dose scans subjects received an intravenous bolus injection of 200 MBq of [11C]raclopride and underwent a 60 min dynamic PET acquisition, starting at the time of injection and consisting of 21 frames (6 × 5 s, 3 × 10 s, 4 × 60 s, 2 × 150 s, 2 × 300 s, and 4 × 600 s). Each emission frame was corrected for decay, scatter, randoms, and attenuation, and reconstructed using the ordered subset expectation maximization (OSEM) algorithm (four iterations and 16 subsets) followed by a 4 mm FWHM Gaussian smoothing.
For each subject, summed PET images were coregistered to corresponding MRI, and MRI data were subsequently normalized to MNI space using the T1 MRI template available in PMOD (version 3.3, PMOD Technologies Ltd, Zurich, Switzerland). The same coregistration and normalization parameters were then applied to the dynamic scans. Time-activity curves were generated for striatum and cerebellum 14 by applying the corresponding predefined volumes of interest (VOIs) of the Hammers atlas 15 to the dynamic data.
Following the well validated quantification approach for [11C]raclopride,
6
the simplified reference tissue model was defined as the standard method. The extracted TACs from baseline and post-dose scans were fitted to the SRTM using cerebellum as a reference region, and BPND values were generated for the striatum. Washout rate constants for both striatum (
Dual time-point image analysis
From the same time–activity curves, the dual time-point approximation was implemented in two steps. First, the scan-specific SRTM-derived washout rate constants
Next, the dynamic baseline-derived washout rate constants were applied to the post-dose scans and DVRDTP values were determined. Binding potential obtained from this method is hereby defined as dual time-point binding potential (BPDTP). Corresponding receptor occupancy estimates (%OccDTP) were computed based on SRTM BPND from the baseline scan and BPDTP from the post-dose scan using equation (8) and compared to %OccBPND using SRTM BPND values of both baseline and post-dose scans. Finally, a population-based approach for the estimation of BPDTP, denoted BP
For comparison, a simple tissue concentration ratio (SUVR) was calculated for all scans and evaluated as a method for binding potential estimation by assuming a direct correspondence between SUVR and DVR. Binding potential estimated from this approximation is hereby defined as SUVR binding potential (BPSUVR). Corresponding receptor occupancy (%OccSUVR) was calculated from baseline and post-dose BPSUVR and compared to %OccBPND using SRTM BPND values of both baseline and post-dose scans.
Three different combinations of two consecutive 10-min time frames (20–40 min, 30–50 min, and 40–60 min) were chosen for all approximations in order to evaluate the time dependency in the accuracy of each method.
Statistical analysis
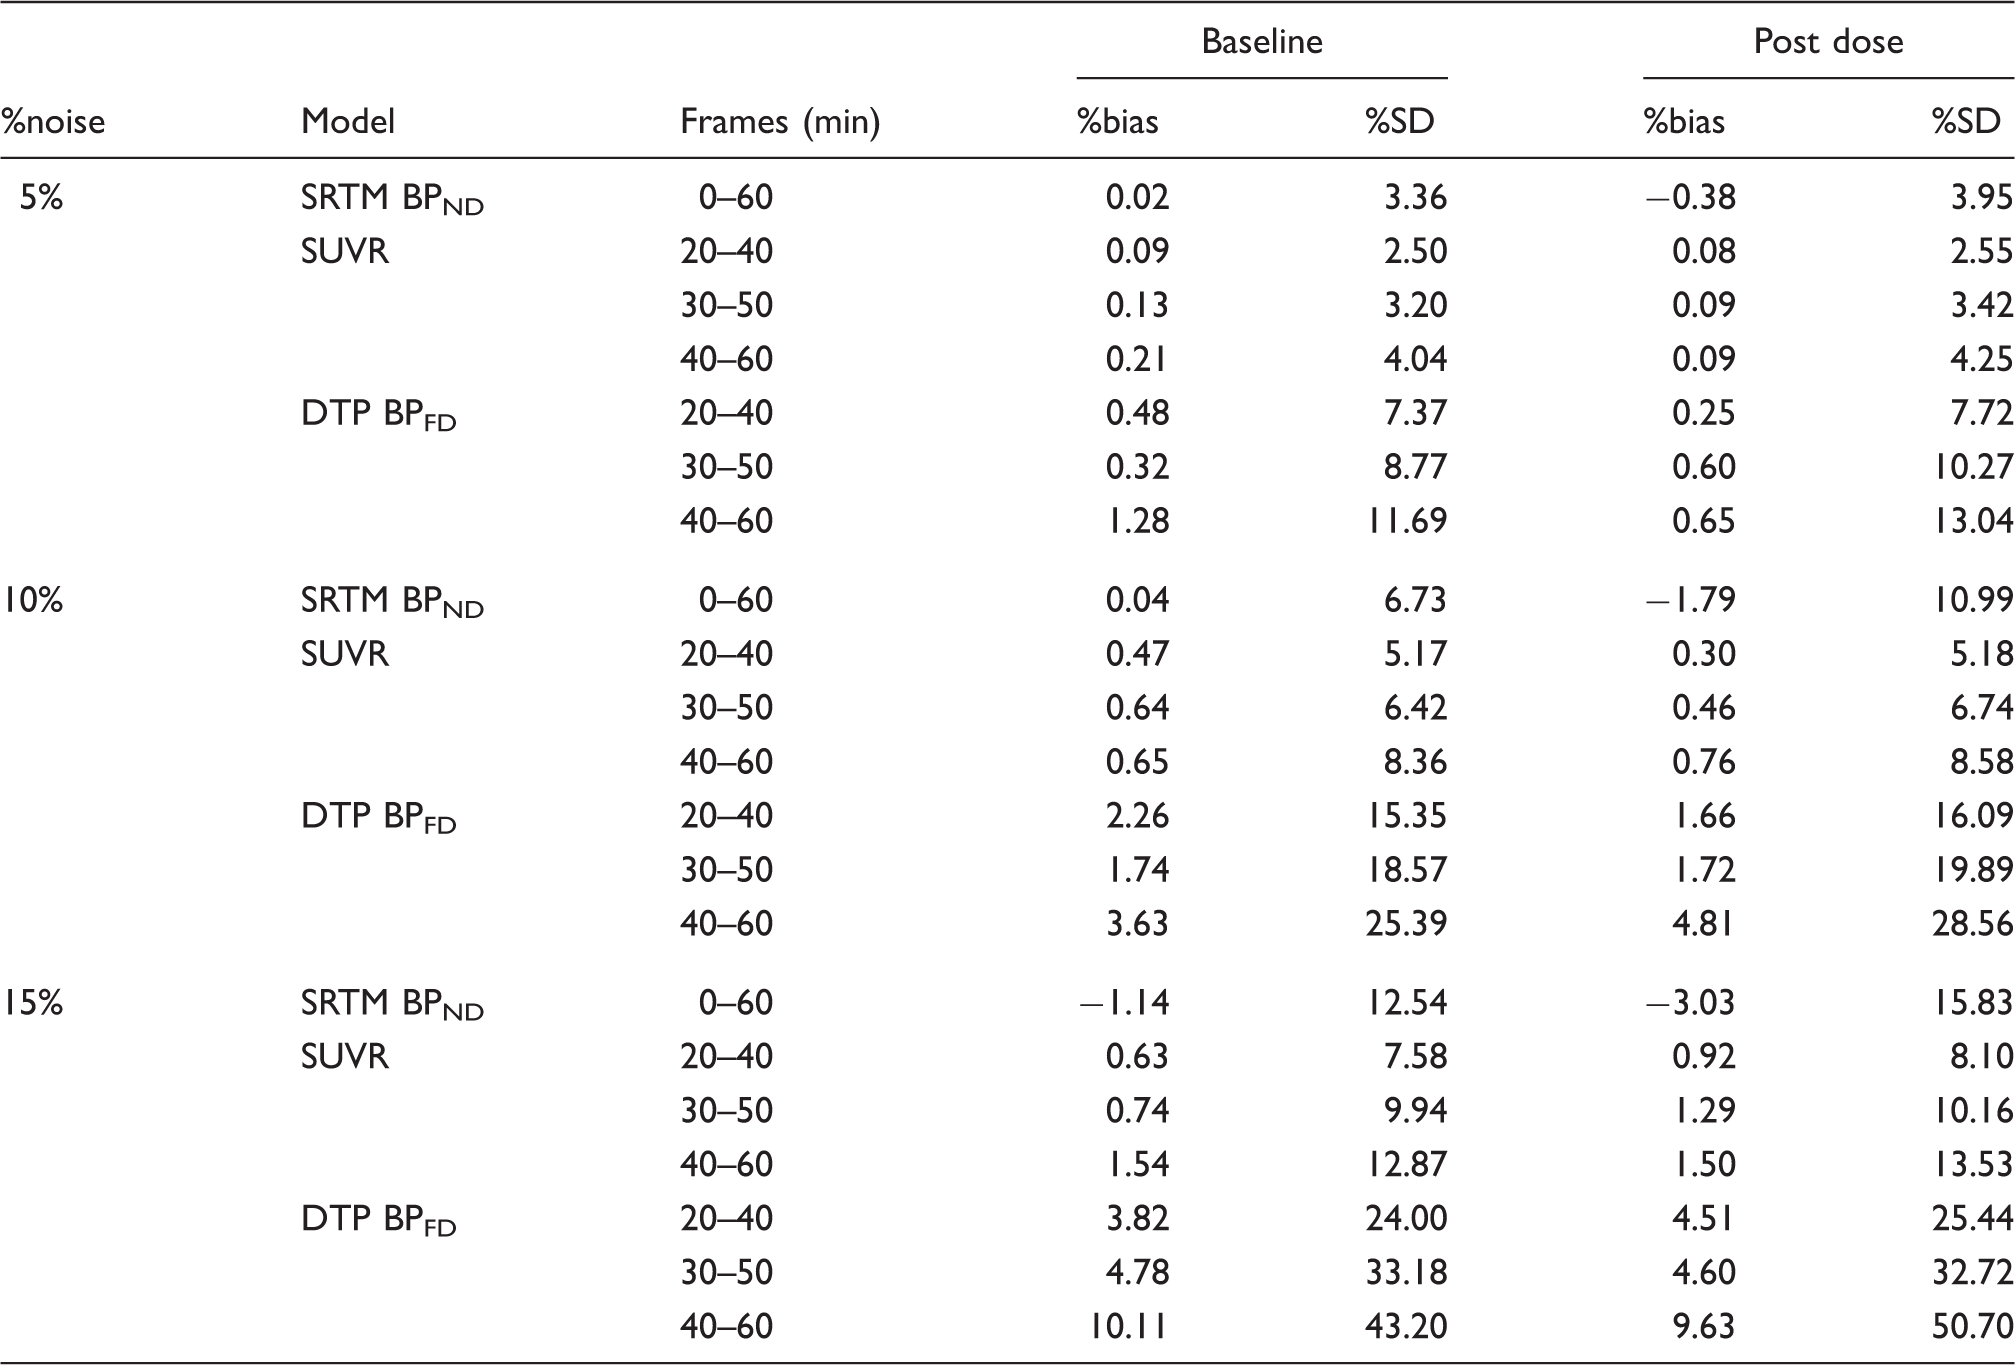
Results are reported as mean ± standard deviation (SD). Correlation between SRTM BPND and all other approximations was assessed by linear regression analysis. The agreement between methods and the bias associated with the approximations were determined based on a Bland–Altman analysis on binding potential and receptor occupancy estimates. Limits of agreement of 95% were considered. The results of quantification of simulated noisy data by each of the three methods (SRTM, DTP or SUVR) were compared to noise-free SRTM BPND values via two measures: %bias, calculated as
Changes in bias associated with different time intervals were analyzed to determine whether the methods are time-dependent. Further analysis was also performed on
All statistical analysis was performed using IBM SPSS Statistics (Version 20.0, Armonk, NY) and GraphPad Prism (Version 5.0, San Diego, CA, USA), and a p < 0.05 was considered significant in all tests.
Results
Binding potential estimation
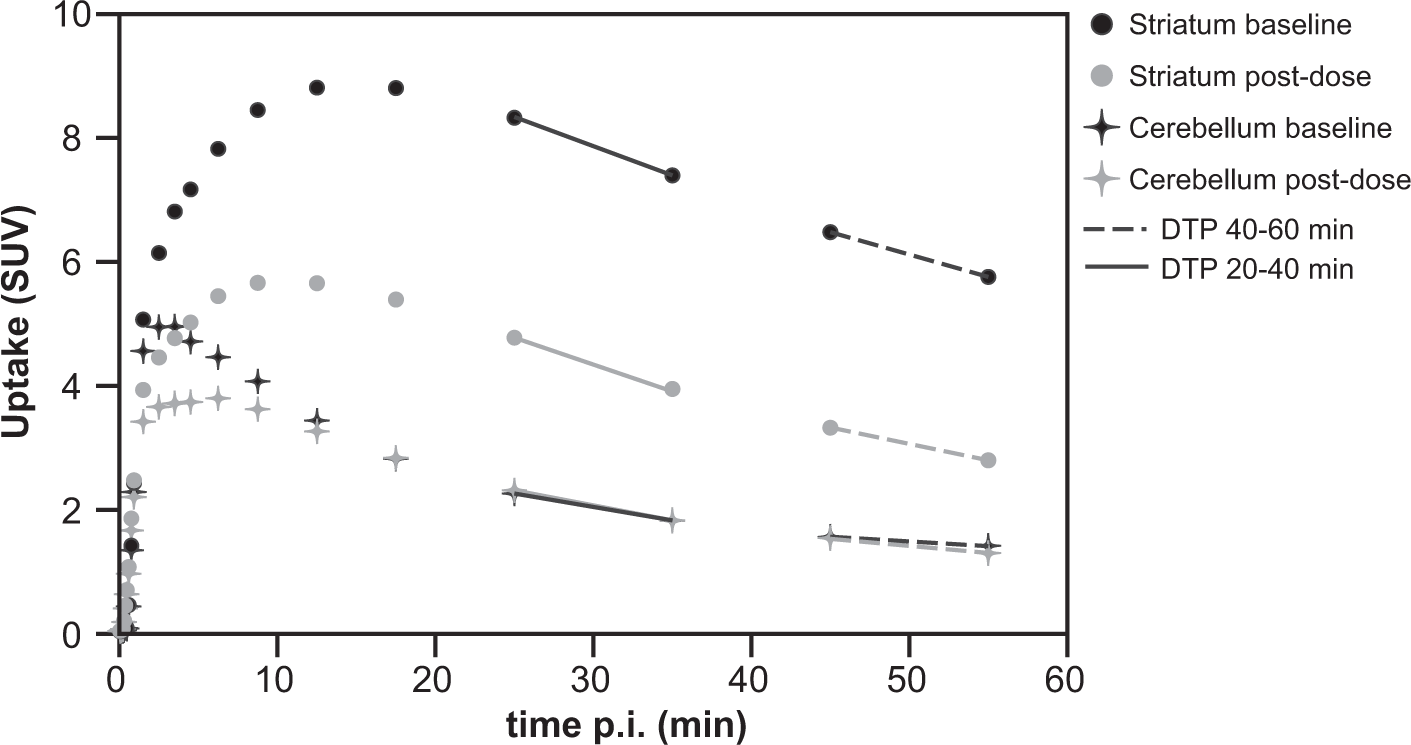
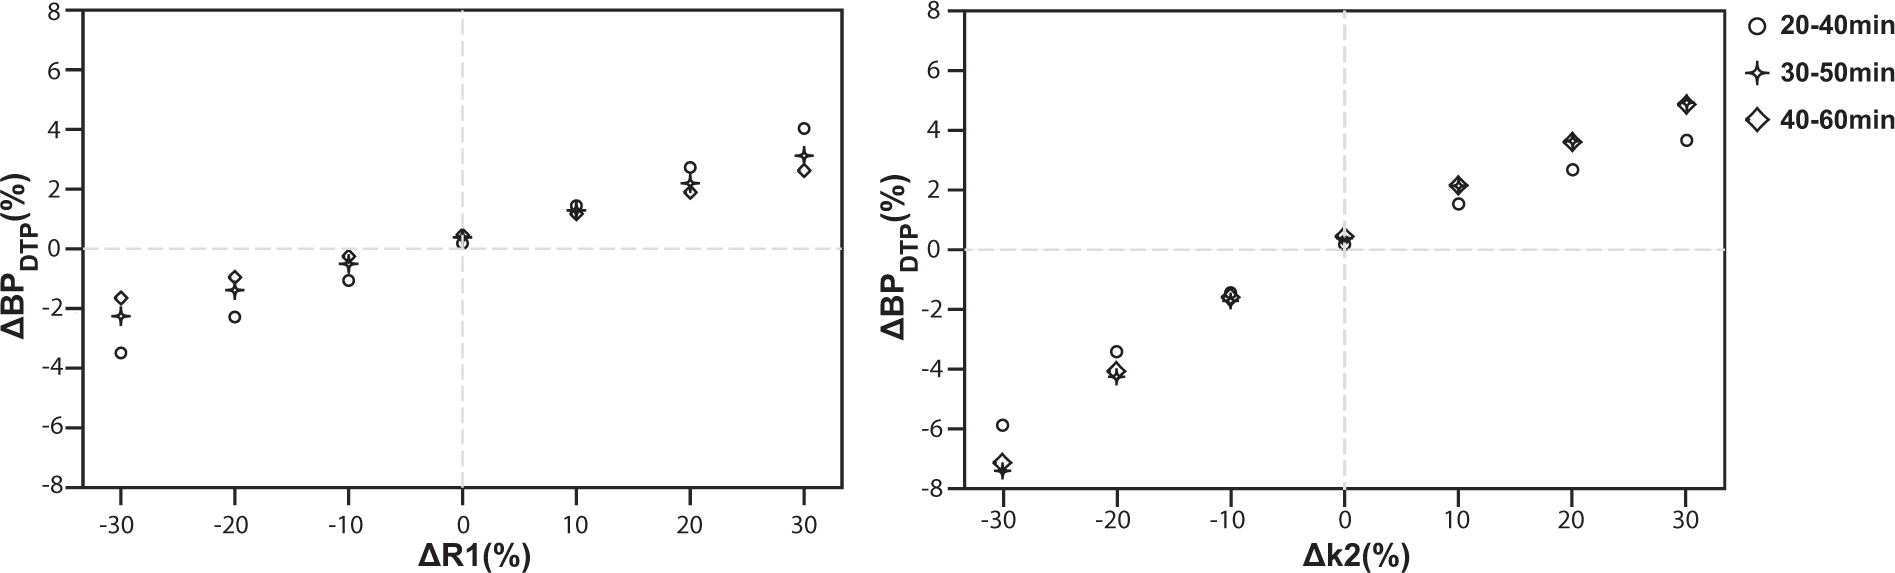
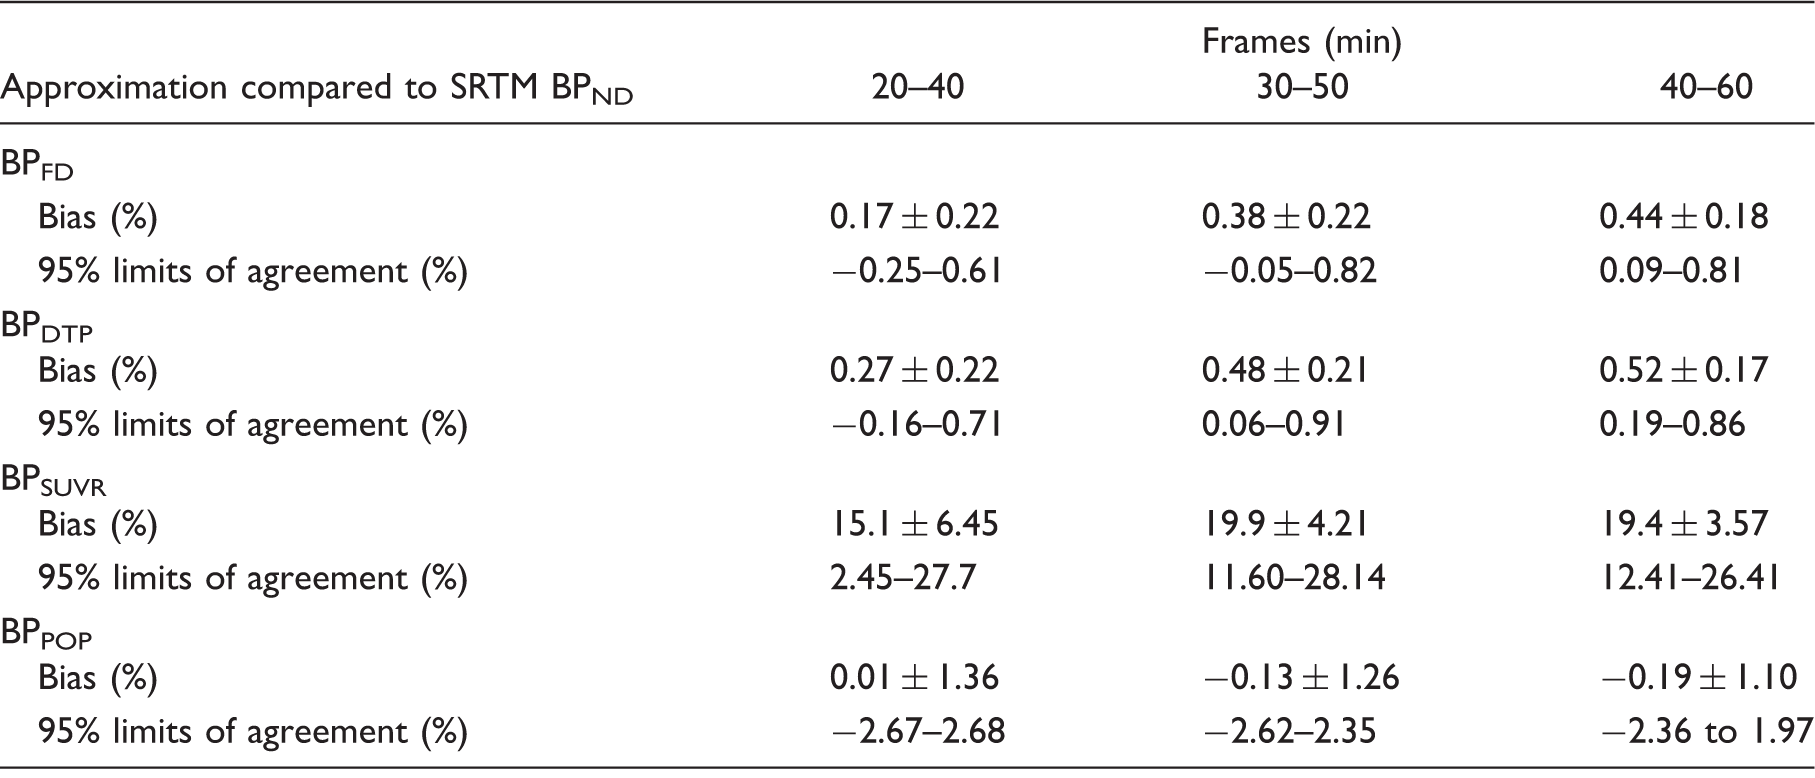
BPFD showed a perfect correlation (R2 = 1) with SRTM derived BPND for all time intervals (Figure 1(a)). Bland–Altman analysis showed a negligible bias and 95% limits of agreement of less that ± 1% for all time intervals (Table 1), supporting the use of the finite differences approximation for the determination of the TAC slopes as presented in Figure 2. Moreover, a perfusion-related error analysis showed that potential changes in kinetic parameters between scans would result in less than 8% error in BPDTP estimation (Figure 3(a) and (b)). The highest percentage of error in the estimation of binding potential (7.4%) resulted from a 30% decrease in Regression analysis of binding potential estimates. Regression analysis of BPFD, BPDTP and BPSUVR with SRTM BPND. Identity line is shown as reference. BPFD shows perfect correlation with SRTM BPND, with a R2 = 1 and slope = 1 for all time frames (a). BPDTP shows excellent correlation with SRTM BPND, demonstrated by a R2 = 0.99 and slope = 0.99 for all time frames (b). BPSUVR shows good correlation and a small overestimation when compared to SRTM BPND, presenting a R2 = 0.97 and slope = 1.02 for the 20–40 min, R2 = 0.98 and slope = 1.18 for the 30–50 min and R2 = 0.99 and slope = 1.23 for the 40–60 min frames (c). Representation of the method’s approximation. Representative TAC for both baseline and post-dose scans of a subject with the highest occupancy levels, demonstrating the estimation of the TAC slopes by the finite differences approximation. Kinetic parameter estimation error analysis. Error analysis performed on changes in R1 and Bland–Altman analysis of binding potential estimates. Note: Bland–Altman analysis comparing standard SRTM based BPND values to estimates from other approximations. Bias and 95% limits of agreement expressed in percentage difference plus or minus the standard deviation.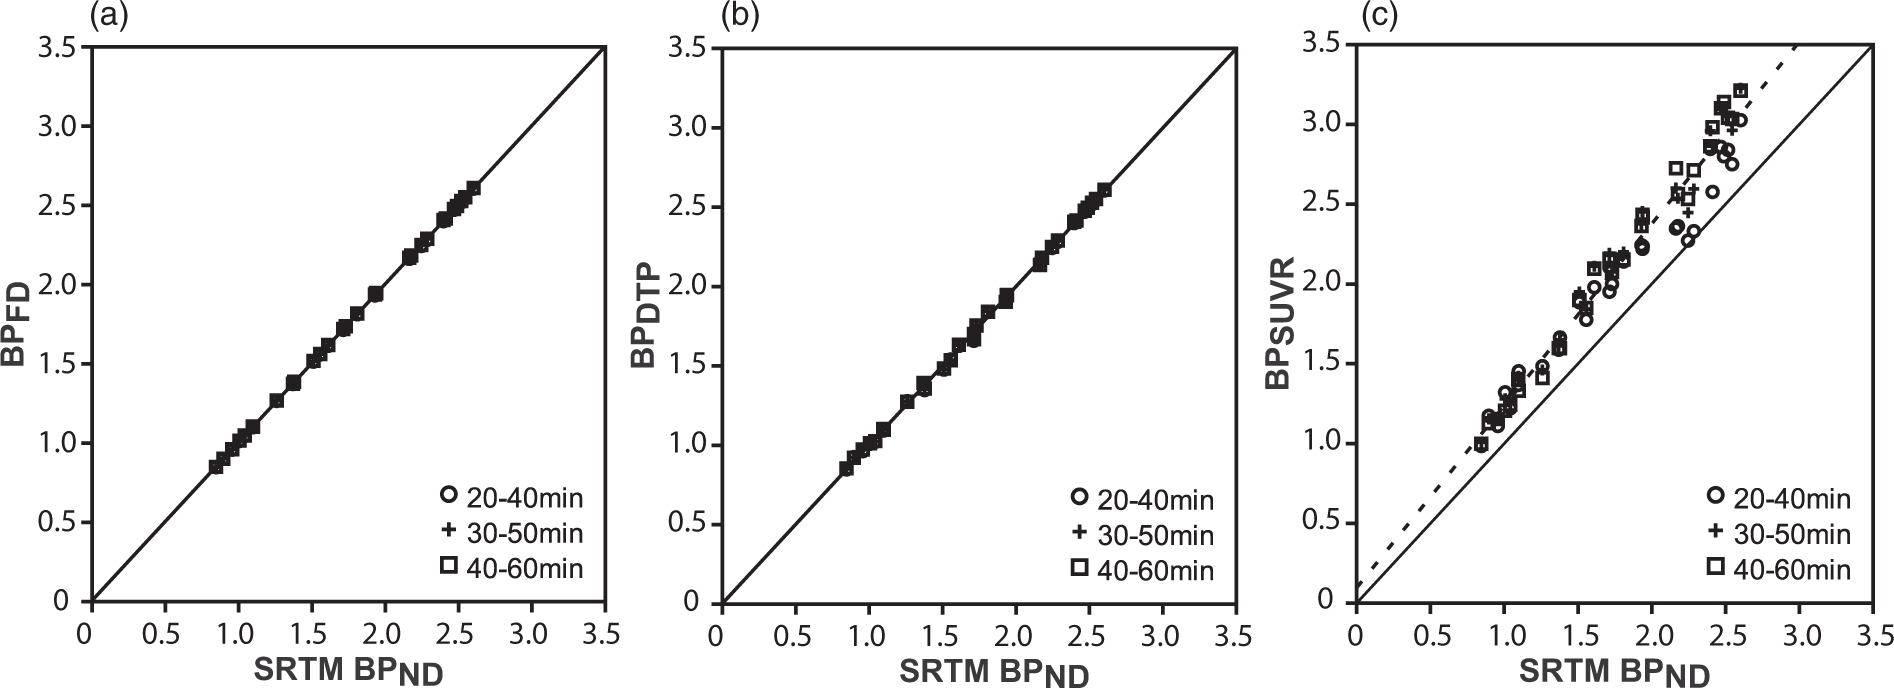
The results of the estimation of BPFD from simulated noisy data showed that for the DTP method, the %bias ranged from 0.25 to 1.3% for the lowest level (5%), increasing from 3.8 to 10.1% for the highest noise level (15%), while the %SD ranged from 7.4 to 13% for the lowest level (5%) of simulated TACs to 24 to 50% for the 15% noise level. On the other hand, SRTM BPND and SUVR estimates using the simulated, noisy TACs resulted in a %bias of less than 4% and a maximum %SD of less than 16% for all noise levels. Representative TACs for the 15% noise simulation are shown in Figure 4 and an overview of noise-induced bias and variability for the different methods is presented in Table 2.
Representative noise simulations for striatal and cerebellar TACs. A representation of the noise free post-dose striatal (black) and cerebellar (gray) TACs used for the noise simulation (solid lines) together with representative TACs for the 15% noise level (dots) and their upper and lower bounds, defined as ± 1.96 × SD (dashed lines). Noise-induced bias and variability. Note: Comparison of the noise-induced bias and variability between different quantification methods applied to simulated noisy TACs. The analysis was performed for three different noise levels (5%, 10%, and 15%) of noise-free TACs representative for baseline (BPND = 2.35) and post dose (BPND = 1.44) scanning.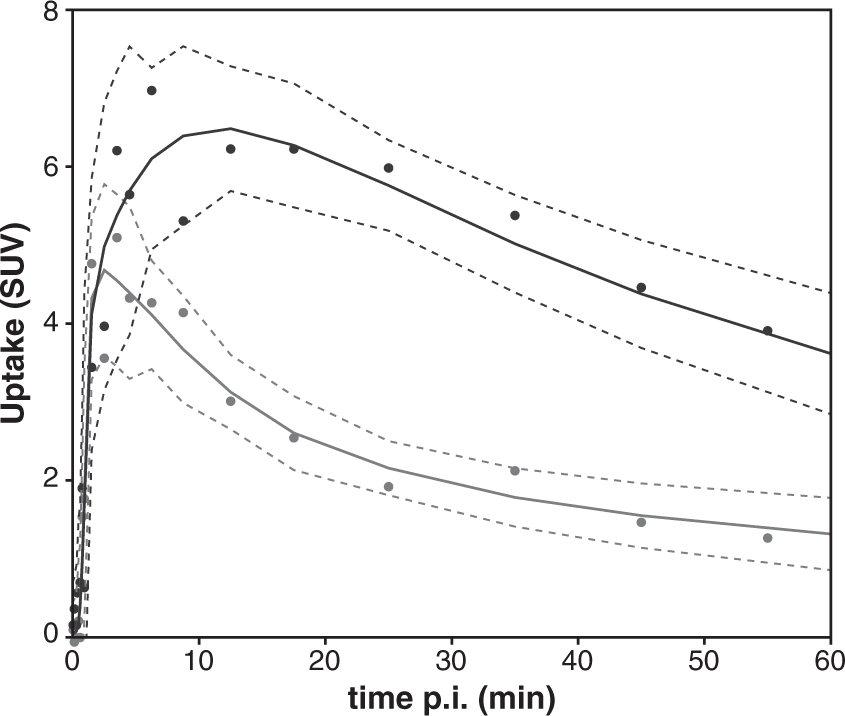
Using subject-specific
The results from the GEE analysis on the change of kinetic parameters from baseline to post-dose scans were in accordance with our assumption, demonstrating that individual
Binding potential values obtained from the SUVR method also demonstrated high correlation (R2 = 0.97–0.99) with SRTM-derived estimates although with a consistent overestimation for all time intervals (Figure 1(c)). In fact, the average factor for correction of SUVR (denominator in equation (5)) was 1.14 for the first post-dose scan (40–60 min interval as an example). It was composed of an average slope of −0.058 ± 0.014 g ml−1min−1 and −0.014 ± 0.004 g ml−1min−1 for striatum and cerebellum respectively, a CR = 1.51 ± 0.21 g ml−1 and the
Receptor occupancy estimation
The range of receptor occupancy achieved in this study, calculated from SRTM derived BPND, was from 0% at baseline up to 65.7% in post-dose scans, with an average value of %Occ = 38.3 ± 18.5%.
Receptor occupancy determined from post-dose BPDTP showed small bias and excellent agreement to the standard method. Furthermore, the values for %OccDTP were not affected by the choice of time post-injection, being consistent for all three dual time-point combinations chosen in this work (bias of 0.16 ± 0.97% for 20–40 min, 0.08 ± 1.01% for 30–50 min and 0.04 ± 0.92% for 40–60 min, and respective 95% limits of agreement of −1.75% to 2.08%, −1.90% to 2.07% and −1.77% to 1.85%). A representative Bland–Altman plot is shown in Figure 5(a) (40–60 min interval).
Bland–Altman plots of receptor occupancy estimates. Representative Bland–Altman plots showing agreement between methods for estimation of receptor occupancy and the standard SRTM BPND based approach. The 40–60 min dual time-point interval was chosen as representative for receptor occupancy estimation using baseline SRTM BPND and post-dose BPDTP (a) and baseline and postdose BPSUVR (b).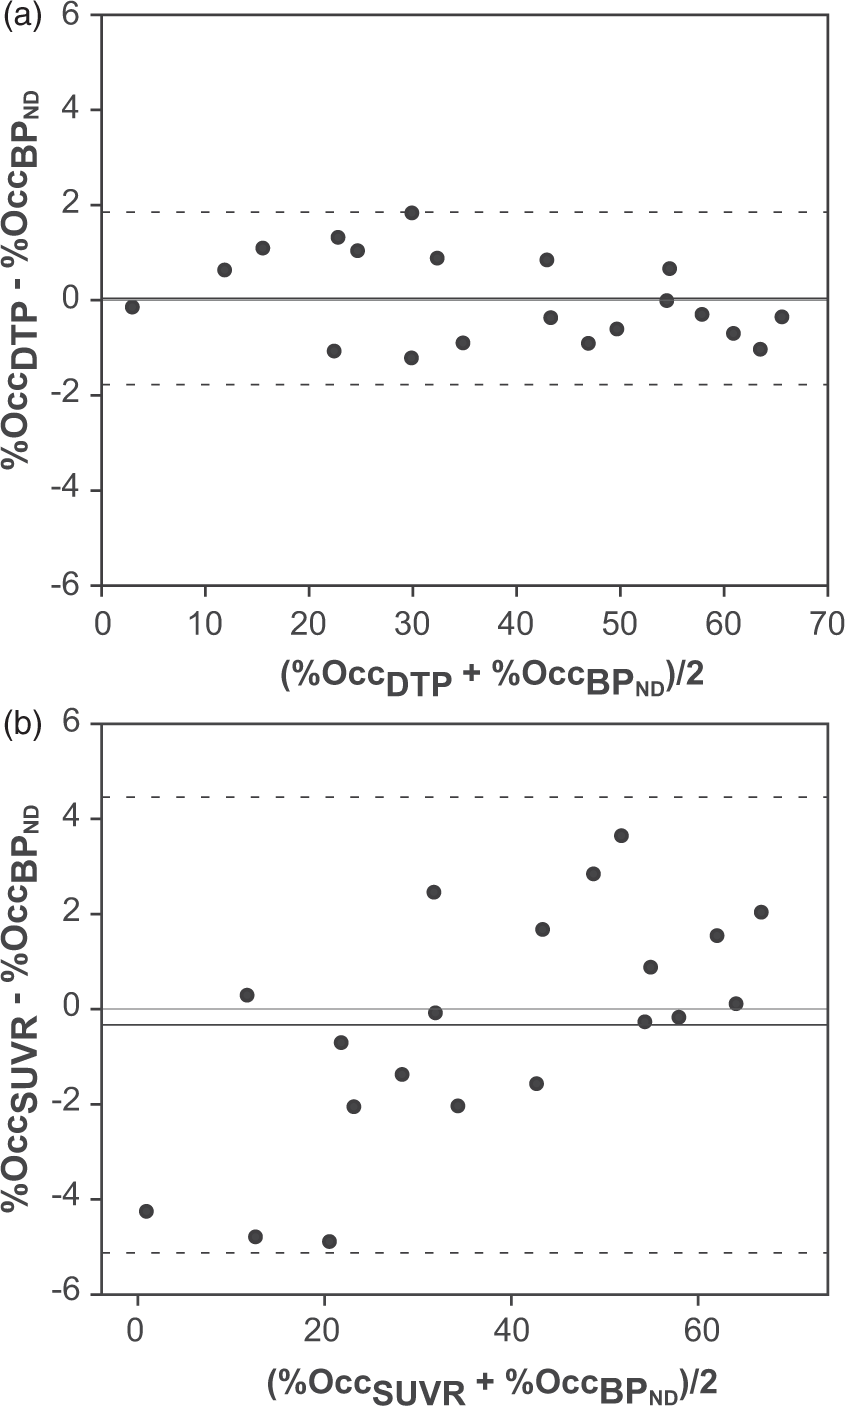
Even though BPSUVR in general overestimated SRTM values, the subsequent estimation of receptor occupancy is less affected. Bland–Altman analysis showed a bias of −4.95 ± 3.87% for 20–40 min, −1.76 ± 3.10% for 30–50 min and −0.33 ± 2.44% for 40–60 min, while the corresponding 95% limits or agreement were from −12.2% to 2.98%, −7.85% to 4.31%, and −5.15% to 4.46%. A representative Bland–Altman plot is shown in Figure 5(b) (40–60 min interval).
Discussion
This study aimed at increasing schedule flexibility for post-dose scans in terms of imaging availability, patient comfort, and possible issues with motion artefacts. The proposed method reduces acquisition time for post-dose scanning and eliminates the need to start the post-dose scan at the time of tracer bolus injection. As such, the method allows for the scan to be reset in case of camera failure or patient discomfort, maintaining the validity of the acquired data. Short post-dose scans would also allow PET dose occupancy scans to be performed within a clinical time slot for whole body PET/CT scanning such that these studies can easily blend in with the clinical routine. Besides, the reduction in acquisition time would be beneficial for both imaging staff and volunteers, since motion during scanning would be reduced and the quantitative quality of the PET data increased, while adding extra flexibility to patient preparation and positioning in the PET system. Moreover, the possible time reduction could also effectively increase the number of subjects scanned per tracer production batch. Indeed, when a standard 60 min dynamic scanning protocol is reduced to a 20 min DTP protocol and, for example, a fixed DTP interval of 20–40 min after injection is chosen for each scan, two consecutive scans can be performed with only a small delay between injections, resulting in the possibility of scanning at least two patients from one [11C]raclopride tracer batch with a realistic amount of (specific) activity.
The new method is based on a dynamic baseline and a dual time-point approximation for quantification of the post-dose scan. Starting from the same kinetic assumptions as for the SRTM, the method depends on two additional assumptions. The first is that the derivatives of the target and reference TAC slopes can be approximated by a finite difference. The second is that the specific kinetic parameters (
The validity of the first assumption was assessed using data from baseline and post-dose scans. Scan-specific washout rate constants
After validation of the first assumption, the applicability of the proposed method was assessed by evaluating the second assumption. Applying subject-specific
In contrast, BPSUVR estimates suffer from a consistent overestimation which can be seen by both the linear regression analysis (Figure 1(c)) and the bias in binding potential estimation from the SUVR method (Table 1), in agreement with previous studies.8,10 However, receptor occupancy estimates are less affected (Figure 5(b)). Nevertheless, the GEE analysis demonstrated that time is a significant factor in bias for this method. Even when measuring SUVR during the transient equilibrium, the overestimation is dependent on the rate of plasma clearance and the tissue kinetics. 7 In the case of [11C]raclopride, the tissue clearance is fast compared to the plasma clearance, resulting in a small overestimation of VT from ratio methods.
The dual time-point method increases accuracy, reduces bias, and eliminates the time dependence of parameter estimation when compared to SUVR methods. It also accounts for errors in the determination of the transient equilibrium state for the scan acquisition, by including the difference in TAC slopes in the determination of DVTDTP (equation (5)). Consequently, DTP protocols offer the possibility of starting the scan at different time points post-injection, avoiding issues related to camera failure. The comparison between post-dose BPDTP and SRTM BPND and the respective receptor occupancy estimates support the applicability of a shorter protocol in [11C]raclopride dose occupancy studies. Furthermore, an inter-subject variability of ±10% in washout rate constants together with correction factors in the order of 10–18% seen in this work suggest that
Specifically for dose occupancy studies, results depend on the stability of receptor affinity, 3 while dosing with new drug compounds may also influence the kinetic behavior of the tracer, compromising the use of baseline washout rate constants for post-dose quantification. Especially regarding the possible effects of the drug dosing on perfusion-related kinetic parameters, a first validation of the approach is necessary. Again, an error analysis similar to the one performed in this study can be valuable to assess the robustness and applicability of this approach in other settings. Moreover, this analysis is rather straightforward provided dynamic baseline datasets are available. On the other hand, simultaneous PET/MRI could be of interest for monitoring of perfusion changes between scans by combining PET with MR ASL (Arterial Spin Labeling) perfusion measurements, 28 a perfusion-weighted MR imaging technique that does not require an exogenous contrast agent. Next to dose occupancy studies, the DTP approximation of BPND could also be a valuable approach for PET displacement or activation studies where the endogenous neurotransmitter level is increased during scanning and kinetics of specifically bound radioligands are altered. In general, these data are analyzed by an extension of SRTM which models the change of the endogenous neurotransmitter level and quantifies the amplitude of this change. For these studies, a DTP approximation could be considered to monitor BPND changes relative to baseline after activation. 29
To conclude, combining dynamic baseline scanning and dual time-point post-dose imaging resulted in an accurate method for the quantification of BPND and occupancy levels of the specific and fast-dissociating D2 antagonist JNJ-37822681, using [11C]raclopride PET. Compared to SUVR, the proposed method is more accurate, less time-dependent and produces smaller bias, while the reduction of the total acquisition time is still significant. Although the dual time-point approximation should be applicable to every tracer with a reference tissue and single compartment tracer kinetics, this approach should be validated for dose occupancy studies with other tracers or drug compounds to assess time stability of washout rate constants, and the possible impact of the tested drug on tracer kinetics.
Footnotes
Funding
The author(s) received no financial support for the research, authorship, and/or publication of this article.
Acknowledgements
The authors would like to acknowledge Janssen R&D (Janssen Research and Development, Janssen Pharmaceutica NV, Belgium) for the collaboration which enabled this study. For their support and contribution to the design of the study, a personal acknowledgement is also due to Erik Mannaert, Mark Schmidt and Peter de Boer.
Declaration of conflicting interests
The author(s) declared no potential conflicts of interest with respect to the research, authorship, and/or publication of this article.
Authors’ contributions
ILA and MK jointly developed the concept and design of the manuscript. AW and AMMdS contributed greatly to a discussion of the method and its applications. ILA wrote the first draft and searched for relevant articles. RD, MK, AW, and AMMdS reviewed the choice of references, tables, and figures and edited the initial draft and every subsequent draft.