
Abstract
Transmembrane AMPA receptor regulatory protein γ-8 (TARP γ-8) mediates various AMPA receptor functions. Recently, [11C]TARP-2105 was developed as a PET ligand for TARP γ-8 imaging. We performed a full kinetic analysis of [11C]TARP-2105 using PET with [11C]TARP-2105 for the first time. The distribution volume (VT), which is a macro parameter consisting of the K1–k4 rate constants in the two-tissue compartment model analysis, exhibited the following rank order: hippocampus (1.4 ± 0.3) > amygdala (1.0 ± 0.2) > frontal cortex (0.9 ± 0.2) > striatum (0.8 ± 0.2) ≫ cerebellum (0.5 ± 0.1) ≈ thalamus (0.5 ± 0.1) > pons (0.4 ± 0.1 mL/cm3). These heterogenous VT values corresponded with the order of biological distribution of TARP γ-8 in the brain. To validate the reference tissue model, the binding potential (BPND) of [11C]TARP-2105 for TARP γ-8 was estimated using general methods (SRTM, MRTM0, Logan reference model, and ratio method). These BPNDs based on reference models indicated excellent correlation (R2 > 0.9) to the indirect BPNDs based on 2TCM with moderate reproducibility (%variability ≈ 10). PET with [11C]TARP-2105 enabled noninvasive BPND estimation and visual mapping of TARP γ-8 in the living rat brain.
Introduction
The α-amino-3-hydroxy-5-methyl-4-isoxazole propionic acid receptor (AMPAR) is an ionotropic-type glutamate receptor located on the postsynaptic membrane of glutamatergic neurons and involved in the majority of fast excitatory neurotransmission in the brain. 1 Therefore, the AMPAR is a crucial target for the development of pharmaceutical agents to treat central nervous system (CNS) disorders, such as epilepsy and ischemia.2,3 The AMPAR is a Na+, K+, and Ca2+ cation channel and structurally forms heterotetramers that assemble from combinations of four subunits, GluA1–GluA4, that include four domains. 4 These domains include the extracellular N-terminal domain, ligand-binding domain, membrane-embedded transmembrane domain that forms the ion channel, and cytoplasmic C-terminal domain. 5 Native AMPAR complexes consist of combinations of ion channel-forming core units and various transmembrane auxiliary subunits, such as transmembrane AMPAR regulatory proteins (TARPs), cornichons, CKAMP44, Shisa6, SynDIG1, SynDIG4, and GSG1L. 6 The association of auxiliary subunits with AMPAR provides functional diversity for channel gating and receptor localization. 7 Of these subunits, two major auxiliary subunits, TARPs and cornichons, are abundantly expressed in the hippocampus, cortex, and striatum. 8 Notably, recombinant AMPA-TARP complexes have been widely studied using cryogenic electron microscopy, which provided detailed information about their architecture.5,9–11
TARPs are classified into two types based on the postsynaptic density 95 (PDZ) domains of the peptide. Type I-TARPs (γ-2, 3, 4, and 8) contain a canonical PDZ binding motif, whereas Type II-TARPs (γ-5 and 7) have an atypical PDZ binding motif. 6 Pharmacologically, TARP modulators have been recently developed to avoid the side effects caused by direct AMPAR modulation. Of these, TARP γ-8 antagonists have shown anti-alcoholism and anti-epileptic effects without side effects.12,13 Additionally, TARP γ-8 modulates AMPAR functions, such as trafficking, synaptic localization, the deactivation rate, the desensitization rate, conductance, glutamate affinity, long-term plasticity, and short-term plasticity. 4 Therefore, TARP γ-8 is considered as an attractive pharmaceutical target for indirect regulation of AMPAR function.
Positron emission tomography (PET) is an advanced and frequently used molecular imaging modality that allows quantitative elucidation of the drug kinetics, molecular density, and biodistribution in vivo. 14 Furthermore, PET in small animals is also widely used to measure the drug occupancy of new pharmaceuticals.15,16 Accordingly, TARP γ-8 PET ligand utilization data would provide detailed information about unknown functions of TARP γ-8, its relationship with CNS disorders, and its pharmacological properties.
Recently, we developed 2-cyclobutyl-3-(1H-indazol-5-yl)-5-[11C]methyl-3H-imidazo[4,5-b]pyridine ([11C]TARP-2105, Figure 1(a)) as a novel PET ligand for TARP γ-8, which revealed high radioactive uptake in the hippocampus, the richest TARP γ-8 region in mammalian brains, 17 during in vitro and in vivo evaluations. 18 Moreover, radioactivity was significantly diminished by treatment with the commercially available TARP γ-8 selective inhibitor JNJ-55511118. 19 Thus, [11C]TARP-2105 exhibited suitable tracer performance and characteristics, suggesting that it could be a promising PET ligand for noninvasive quantification of TARP γ-8 in the brain.
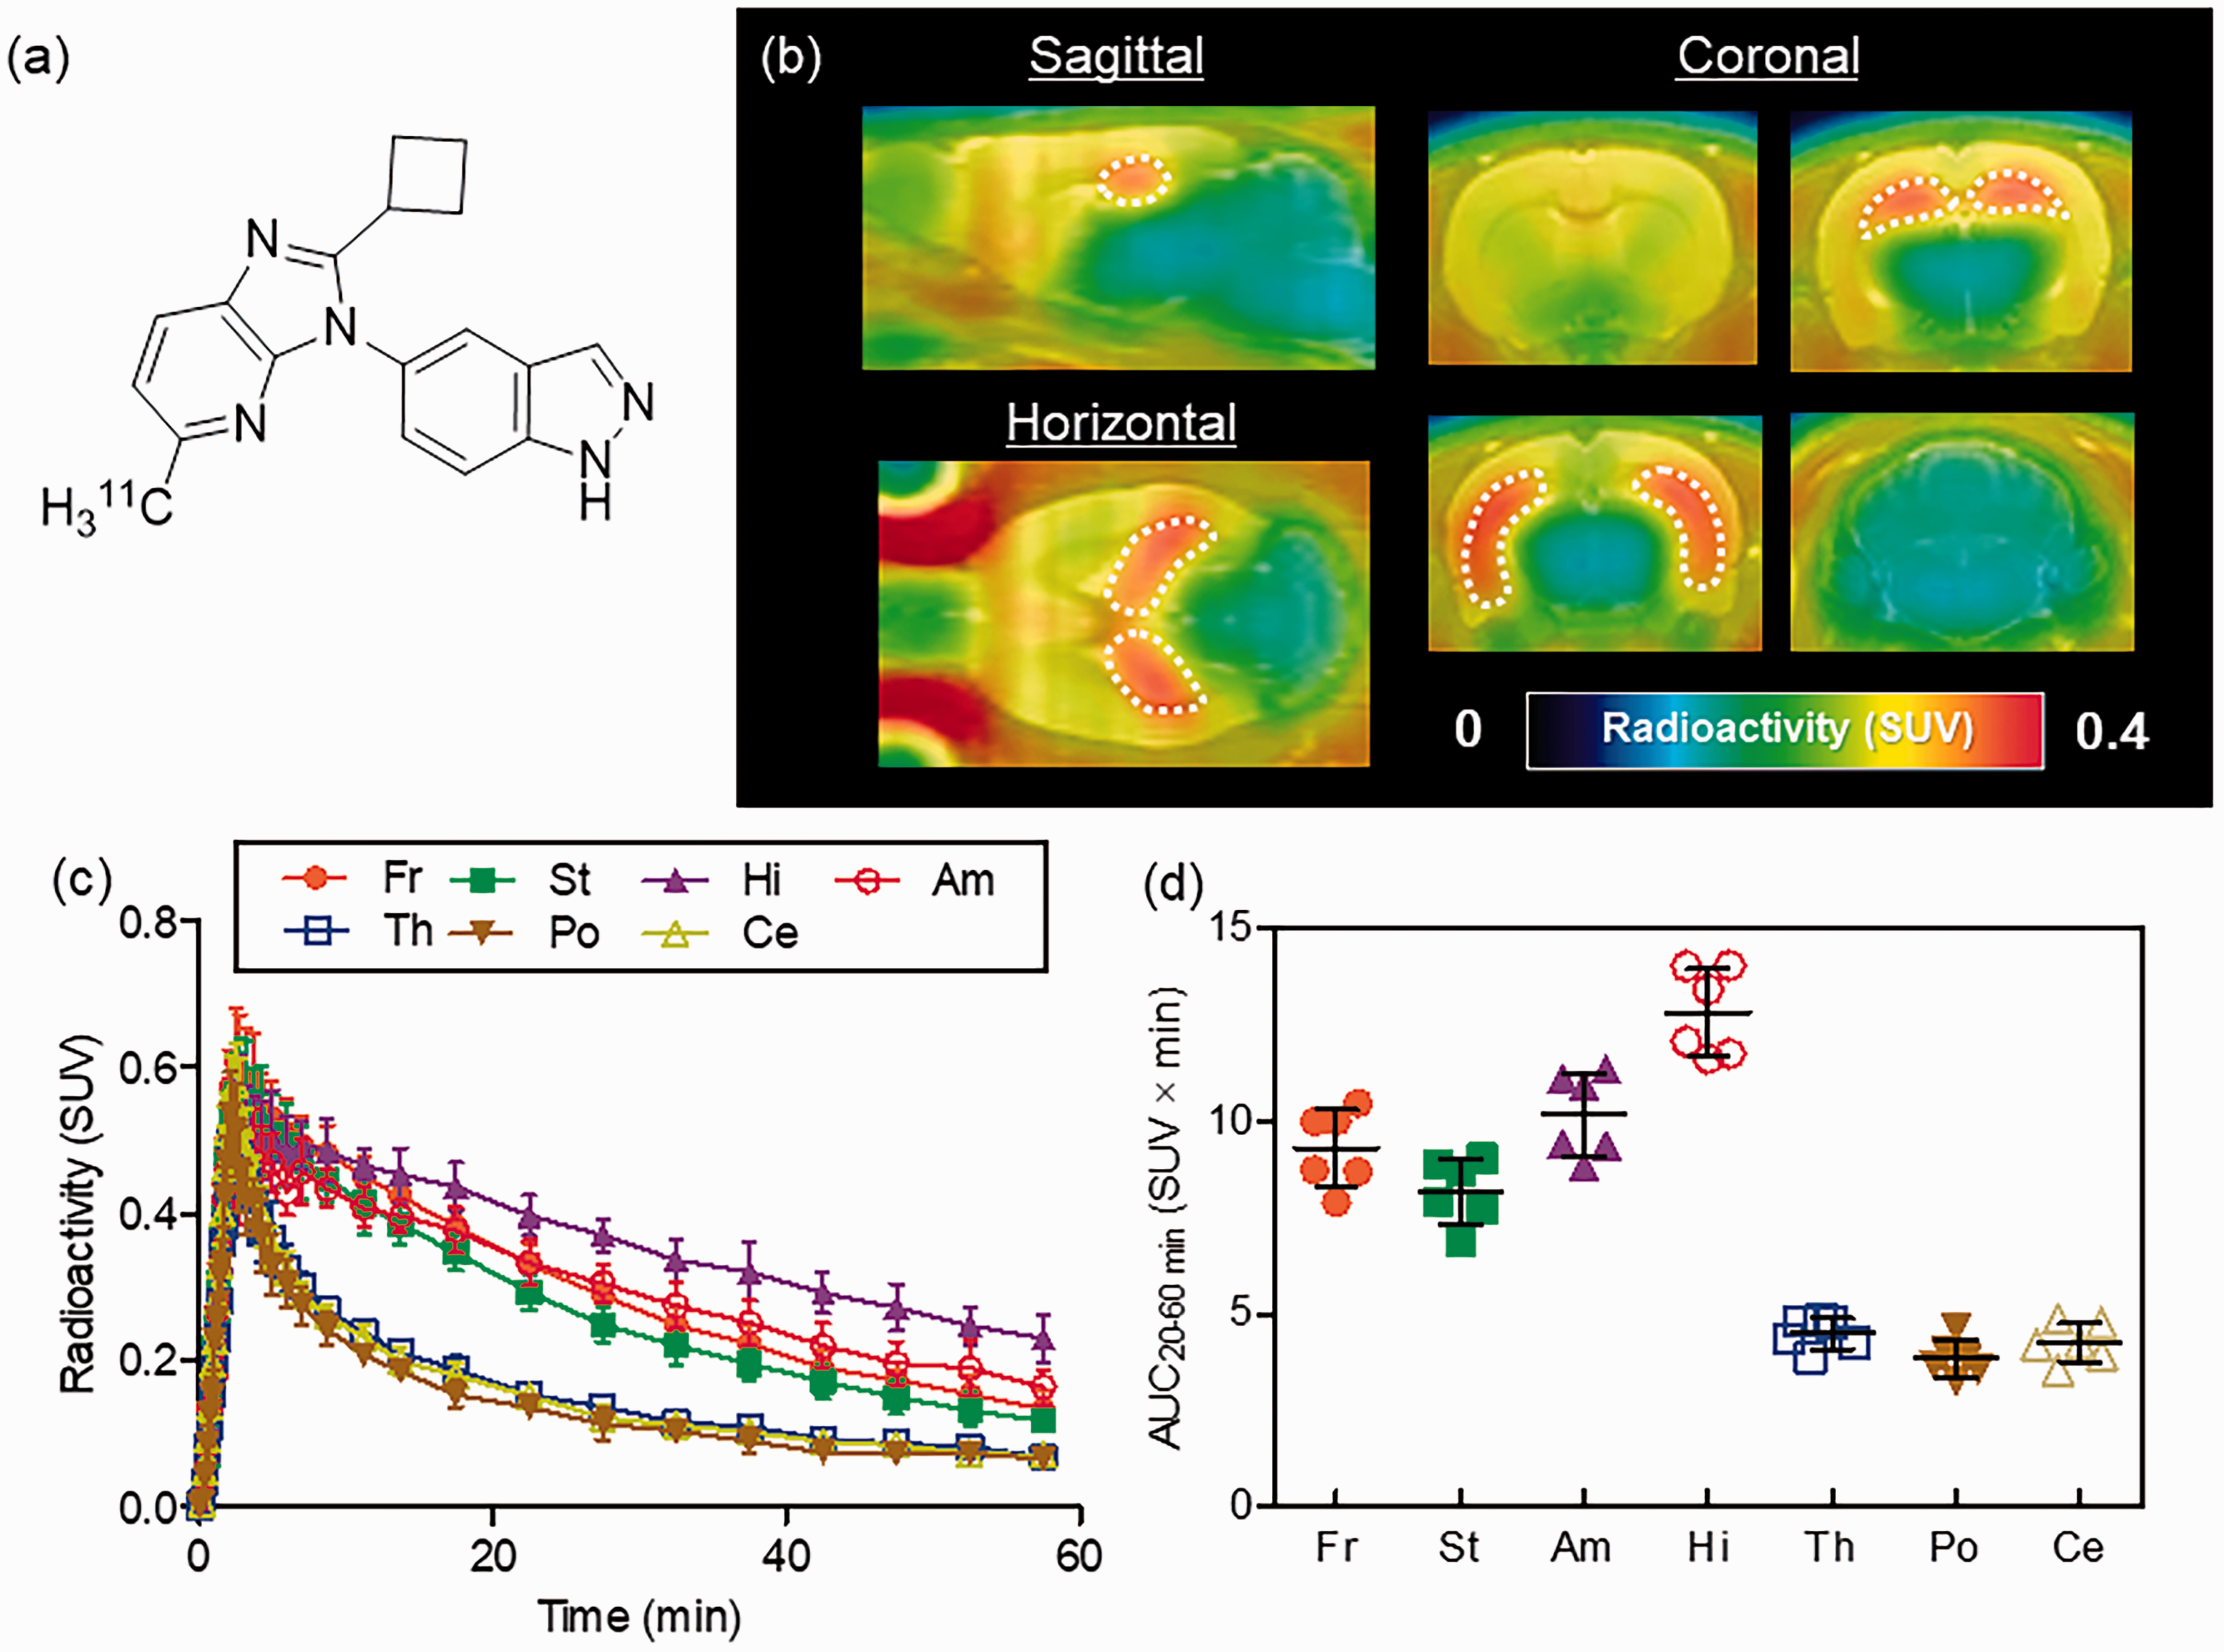
PET images and brain kinetics of [11C]TARP-2105. (a) Chemical structure of [11C]TARP-2105. (b) Averaged PET/MRI -fused images. PET images were reconstructed in a summation image using dynamic images obtained at 0–60 min. (c) Time-activity curves (n = 6) of [11C]TARP-2105 in the frontal cortex (Fr), striatum (St), amygdala (Am), hippocampus (Hi), thalamus (Th), pons (Po), and cerebellum (Ce). Error bars represent standard deviation (SD). (d) Area under the time-activity curve (AUC) (n = 6, means ± SD) of [11C]TARP-2105 at 20–60 min in brain regions. Radioactivity is expressed as the standard uptake value (SUV).
Here, we performed a full kinetic analysis of [11C]TARP-2105 for the first time using compartment models in a PET study with blood sampling in rats. Furthermore, to noninvasively quantify the in vivo availability of [11C]TARP-2105 for TARP γ-8, we determined appropriate reference regions and evaluated general analysis models. Finally, we conducted test-retest PET studies with [11C]TARP-2105 to guarantee the reproducibility of this noninvasive method.
Materials and methods
General
All reagents and organic solvents used in this study were of analytic HPLC grade and were purchased from Sigma-Aldrich (St. Louis, MO, USA), FUJIFILM Wako Pure Chemical (Osaka, Japan), and Tokyo Chemical Industries (Tokyo, Japan).
[11C]TARP-2105 was synthesized in accordance with a previously described procedure. 18 Briefly, a mixture containing a tributyltin precursor was reacted with [11C]methyl iodide prepared from [11C]CO2, which was produced by an 14N(p, α)11C nuclear reaction using a Cypris HM18 cyclotron (Sumitomo Heavy Industries, Tokyo, Japan). For animal experiments, [11C]TARP-2105 was dissolved in saline and formulated with suitable molar activity (>37 GBq/μmol) and radiochemical purity (>99%) after synthesis.
Animals
Sprague–Dawley rats (male, 8–11 weeks old) were purchased from Japan SLC (Shizuoka, Japan). Rats were kept in a temperature-controlled environment with a 12-h light/dark cycle and given a standard diet (MB-1, Funabashi Farm, Chiba, Japan). Animal experiments were performed according to the recommendations of the Committee for the Care and Use of Laboratory Animals, National Institutes for Quantum Science and Technology (QST) and were approved by the institutional committee of QST (approval number: 16-1006).
All animal experiments are reported according to the ARRIVE (Animal Research: Reporting in Vivo Experiments) guidelines.
Procedure for small-animal PET with blood sampling
Prior to PET assessment, a rat (n = 6, 313 ± 55 g) was anesthetized with isoflurane (introducing: 5%; keeping: 1.5–2% in air), and a polyethylene catheter (FR2, Imamura, Tokyo, Japan) was inserted into the left femoral artery for blood sampling. The operation for cannulation was performed using an operating microscope (Leica, Wentzler, Germany). Subsequently, a 24-gauge intravenous catheter (Terumo Medical Products, Tokyo, Japan) was inserted into the tail vein of anesthetized rat for bolus injection, and the rat was secured in a custom-designed chamber and placed on a small-animal PET scanner (Inveon, Siemens Medical Solutions, Knoxville, TN, USA). The body temperature of rat was maintained using a 40°C water circulation system (T/Pump TP401, Gaymar Industries, Orchard Park, NY, USA).
A bolus of [11C]TARP-2105 (50 ± 17 MBq, 0.6 ± 0.6 nmol, 1 mL) was injected at a flow rate of 0.5 mL/min using a syringe pump (PHD2000, Harvard Apparatus, MA, USA) via a catheter in the tail vein, and dynamic emission scans in three-dimensional list mode were performed for 60 min (10 s × 12 scans, 20 s × 3 scans, 30 s × 3 scans, 60 s × 3 scans, 150 s × 3 scans, and 300 s × 9 scans). Arterial blood was manually collected via catheter of tail vein into the microtube at 20 and 40 s (0.05 mL); 60 s (0.1 mL); 80, 100, 110, 120, 130, and 150 s and 3 and 4 min (0.05 mL); 5 min (0.2 mL); 10 min (0.08 mL); 15 min (0.2 mL); 30 min (0.3 mL); and 60 min (0.4 mL) after the PET scan was started. The blood samples were weighted and centrifuged at 15,000 g at 4°C to separate the plasma. The radioactivity of the whole blood and plasma was determined using a 2480 Wizard auto-gamma scintillation counter (Perkin-Elmer, Waltham, MA, USA) and was corrected for decay. Metabolite analysis was performed as described previously. 20 Briefly, plasma samples obtained 1, 5, 15, 30, and 60 min after injection were deproteinized with equivalent volumes of acetonitrile. An aliquot of the supernatant from the plasma was injected into an HPLC system with a radiation detector, 21 and analyzed using a Capcell Pack C18 column (4.6 mm i.d. × 250 mm, Shiseido, Tokyo, Japan) with MeCN/H2O (4/6, v/v) at 1.5 mL/min. The PET scan with blood sampling and following metabolite analysis were repeated six times.
Data analysis
PET dynamic images were reconstructed with filtered back projection using a Hunning filter with Nyquist cut-off of 0.5 cycle/pixel by the Inveon Acquisition Workplace software (Siemens Medical Solutions). PET/magnetic resonance imaging (MRI) fused images were acquired by PMOD version 3.4 (PMOD Technologies, Zurich, Switzerland). To generate the time-activity curves (TACs) in brain regions, volumes of interest were drawn on the whole brain, frontal cortex, striatum, amygdala, hippocampus, thalamus, pons, and cerebellum by referencing MRI templates of the rat brain. 22 The radioactivity was decay-corrected according to the injection time and expressed as the standardized uptake value (SUV), which was normalized to the injected radioactivity and body weight. 23 The SUV was calculated according to the following formula:
SUV = (radioactivity per mL tissue/injected radioactivity) × body weight (g). We also calculated the area under the curve (AUC) using TACs from 20 to 60 min in various brain regions. The summation time for AUC estimation was determined by a relationship study (Figure S1).
Kinetic analysis
Non-linear least squares (NLS) fitting
One-tissue compartment model (1TCM) and two-tissue compartment model (2TCM) analyses were conducted using the metabolite-corrected plasma input curve of [11C]TARP-2105. The fractional blood volume was set to 2% in all regions according to a previous report.
24
The goodness of fit was assessed using the Akaike information criterion (AIC)
25
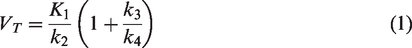
and the model selection criterion (MSC) as an another criterion used in Scientist Software (MicroMath, Saint Louis, MO, USA). The percentage of the coefficient of variation (%COV) was estimated from the diagonal of the covariance matrix of the fitting. As the main outcome measure of the 2TCM, the total distribution volume (VT) in each region was calculated as follows:
Graphical analysis
A Logan graphical plot was introduced as a simple method for estimation of the VT value; 27 t* was fixed at 20 min in the present study. The correlation between VT values based on the 2TCM and Logan graphical analysis (Logan GA) was evaluated using the respective VT values of six baseline PET measurements.
Reference tissue model analysis
To noninvasively estimate the nondisplaceable binding potential (BPND), a putative value of the in vivo density of the target molecule, analyses were performed using the simplified reference tissue model (SRTM),
28
Ichise’s multilinear reference tissue model (MRTM0),
29
Logan’s graphical reference tissue model (Logan Ref),
30
and a ratio method.
31
The MRTM0 allows for BPND estimation with the smallest parameter estimation variability compared with other linear (MRTM and MRTM2) and non-linear models. Its limitation is a negative bias with the presence of noise in PET data, and its magnitude increases with noise. However, this negative bias is minimal when the BPND magnitude is small (<1).
32
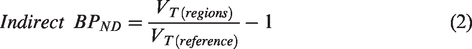
Because of its simplicity, the Logan Ref method, which does not include the efflux rate constant of reference region (k2′), is commonly used for quantification in radioligand-receptor dynamic PET studies. For the Logan Ref method, t* was fixed at 20 min by visual inspection of the residual plots. To validate the reference region, TACs of the cerebellum, pons, or thalamus were used to evaluate these candidate reference regions in the SRTM analysis. To evaluate the general reference region model, the estimated BPND value of each reference tissue model was compared with the distribution volume ratio minus 1 (DVR − 1), defined as the indirect BPND in the 2TCM.
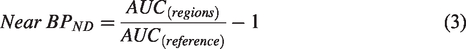
For the ratio method, the near-BPND was expressed as follows:
All kinetic analyses and reconstruction of parametric images were performed using PMOD version 3.4 (PMOD Technologies).
Test-retest PET studies
Four rats were used twice within 10 days (325 ± 58 g at the first scan and 363 ± 44 g at the second scan) for PET assessments with [11C]TARP-2105 (35–43 MBq; 0.2–0.5 nmol). The test-retest reliability for BPND values was assessed as follows:
Relative difference (%) = (scan 2 – scan 1)/scan 1 × 100 Test-retest variability (%) = |scan 2 – scan 1|/[(scan 2 + scan 1)/2] × 100 %COV = standard deviation/mean × 100 Intraclass-correlation coefficient (ICC) = (mean sum of squares between subjects (BSMSS) − mean sum of squares within subjects (WSMSS))/(BSMSS +WSMSS)
Results
Non-parametric PET imaging in rat brains
Figure 1 shows averaged PET images fused on a MRI template of the rat brain (b), TACs in brain regions (c), and the AUC20–60 min values of [11C]TARP-2105 (d) in several brain regions. In the PET images, the greatest radioactive accumulation was observed in the hippocampus, immediately peaking (0.5 SUV) after the injection and then slowly washing out of the brain. A moderate radioactive signal was observed in the forebrain (frontal cortex, striatum, and amygdala), which also showed kinetics similar to those of the hippocampus. However, low radioactive signals were found in the thalamus, pons, and cerebellum, which indicated rapid clearance after initial radioactive uptake. The AUC20–60 min value (SUV × min) in the hippocampus indicated the greatest amount of radioactive tracer uptake (12.8 ± 1.0). The value was over three-fold of that of the pons (3.8 ± 0.4), which showed the lowest radioactive uptake.
Comparison of compartment models
Figure 2(a) shows the metabolite-corrected plasma input curve. The percentages of the intact form of [11C]TARP-2105 after injection were 75% at 5 min, 20% at 30 min, and 11% at 60 min (Figure S2). The maximum radioactivity of the metabolite-corrected plasma input curve was 4.0 SUV at 2 min after injection. Subsequently, the radioactive tracer exhibited rapid clearance and decreased to <0.1 SUV at 60 min after injection.
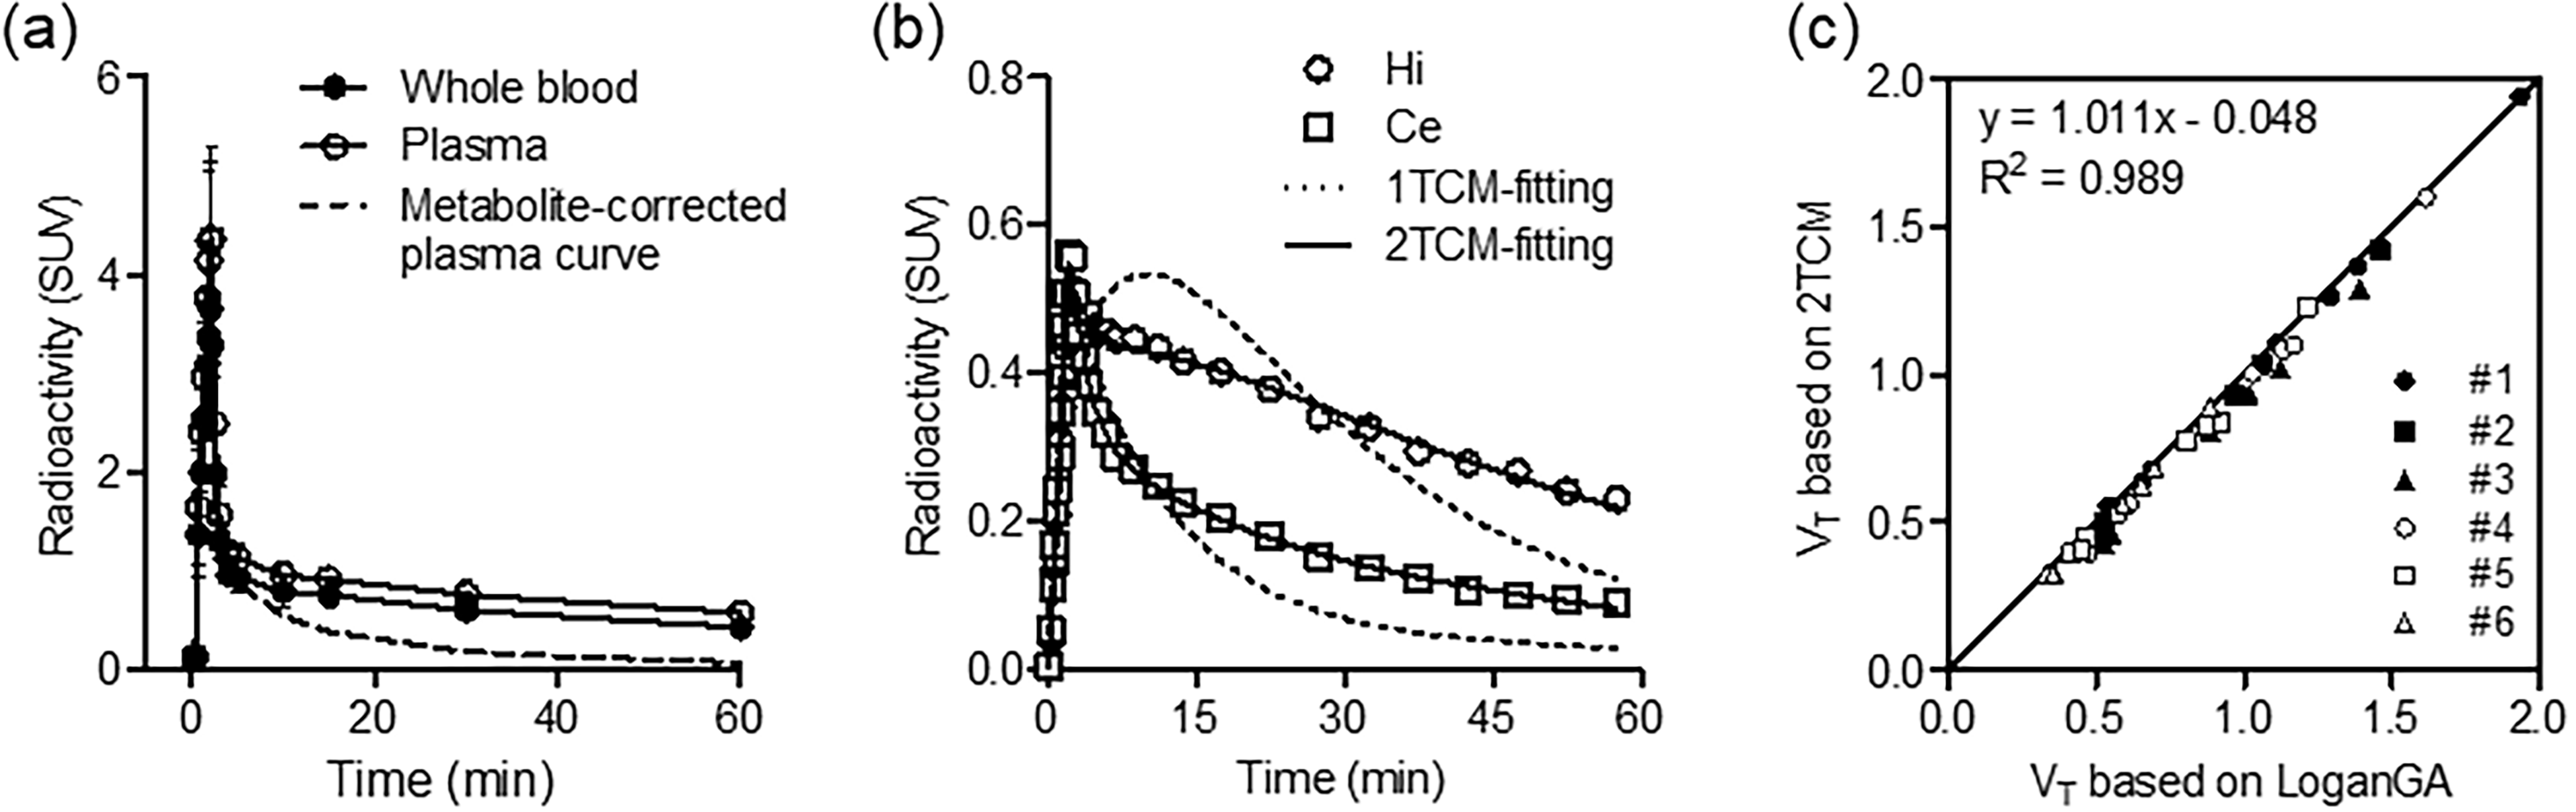
Kinetic analysis using the [11C]TARP-2105 plasma input curve. (a) Time-course of radioactivity in whole blood and plasma and the metabolite-corrected plasma curve (n = 6). Error bars represents standard deviation (SD). (b) Compartment model fitting of representative time-activity curves (TACs). The TACs include the richest region of TARP γ-8 (hippocampus: Hi, open circles) and a region with low TARP γ-8 (cerebellum: Ce, open squares). Compartment model fitting was conducted using the one-tissue compartment model (1TCM, dotted line) and 2TCM (solid line). (c) Relationship between distribution volumes (VT) based on graphical analysis (Logan GA) and non-least squares analysis (2TCM).
Figure 2(b) shows a typical compartmental-model curve fitting of [11C]TARP-2105 in the hippocampus (the richest TARP γ-8 region) and cerebellum (a low TARP γ-8 region). The fitting curves obtained using the 2TCM with the TACs of the hippocampus and cerebellum were superior to those obtained using the 1TCM. Additionally, the goodness of fit scores of the 2TCM was superior to those of the 1TCM. The AIC scores of the 1TCM and 2TCM were 82.8 and 14.7 in the hippocampus and 77.4 and 24.4 in the cerebellum, respectively. The MSC scores of the 1TCM and 2TCM were 2.1 and 4.2 in the hippocampus and 2.9 and 4.5 in the cerebellum, respectively. These results indicated that the 2TCM is an adequate model for NLS analysis of PET kinetic data using [11C]TARP-2105.
Outcomes of 2TCM analysis in rat brains
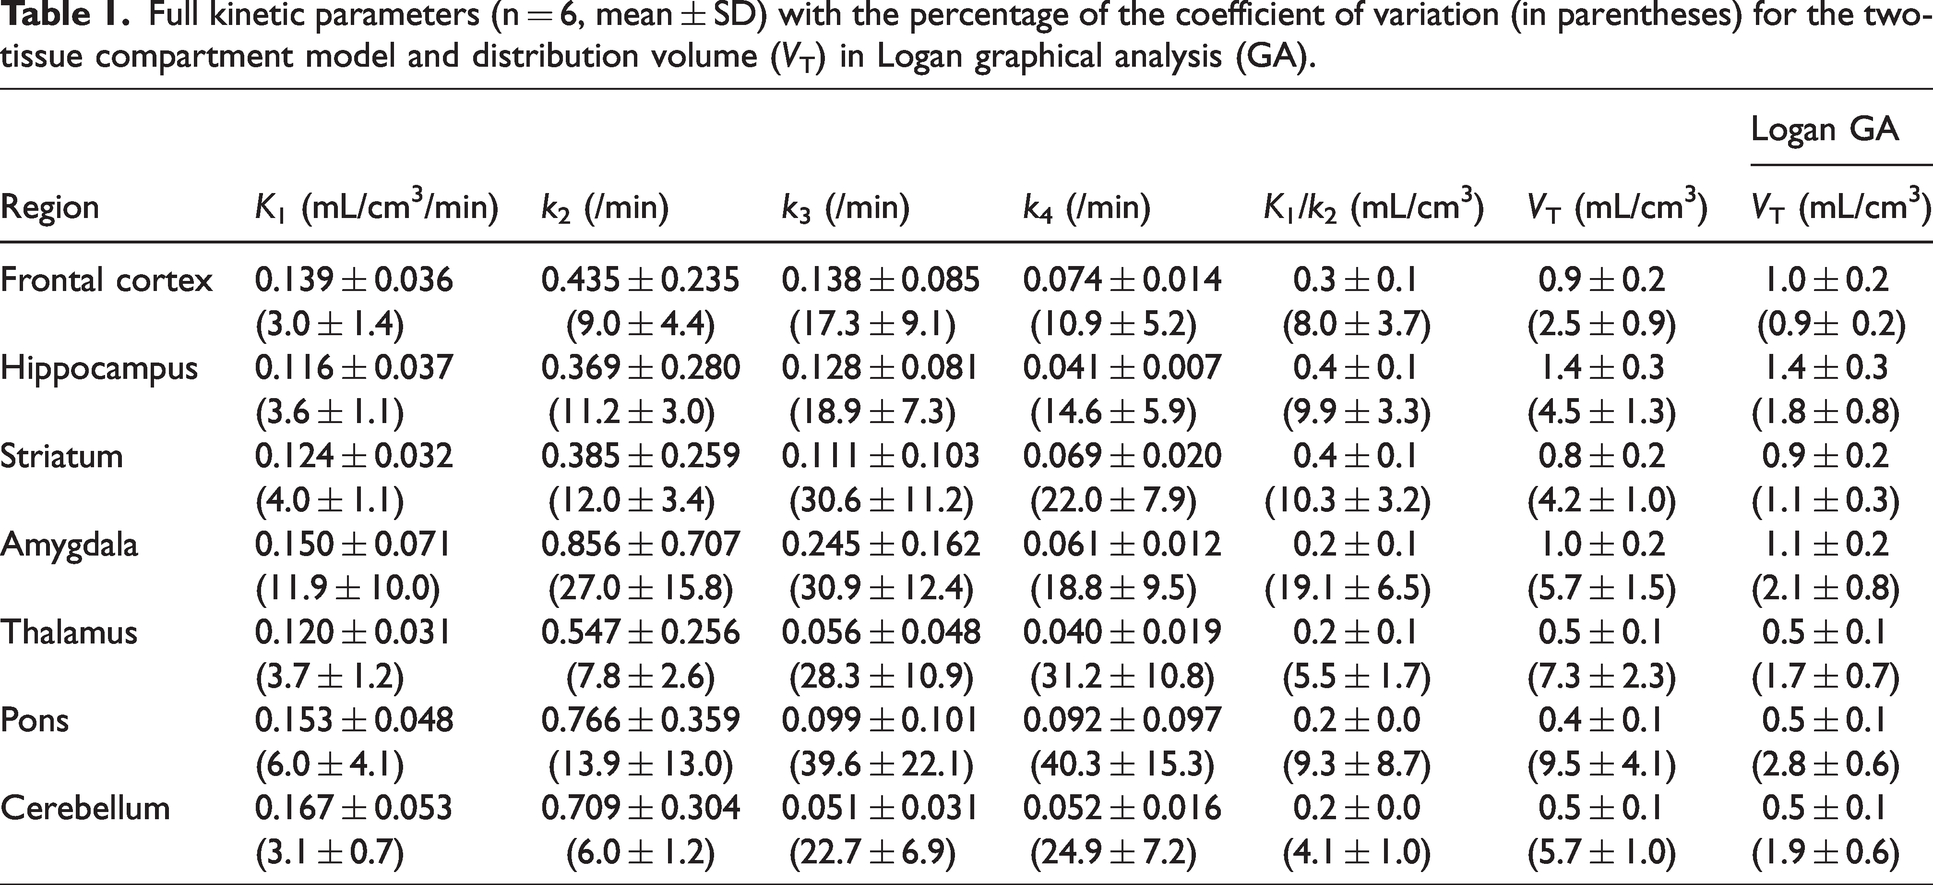
Table 1 shows the outcome measurements of full kinetic parameters of [11C]TARP-2105 in rat brain regions. High VT values in the 2TCM analysis were observed in the hippocampus (0.9–1.9 mL/cm3), frontal cortex (0.6–1.3 mL/cm3), striatum (0.6–1.1 mL/cm3), and amygdala (0.7–1.4 mL/cm3). Low values were found in the thalamus (0.3–0.7 mL/cm3), pons (0.3–0.6 mL/cm3), and cerebellum (0.3–0.6 mL/cm3). The VT values based on Logan GA were similar to the values obtained for the 2TCM. Additionally, scatter plot analysis of the VT values of the Logan GA and 2TCM methods exhibited a high correlation (R2 = 0.987) and a slope close to 1 (slope = 1.013) (Figure 2(c)), indicating that the 2TCM method could accurately estimate VT values.
Full kinetic parameters (n = 6, mean ± SD) with the percentage of the coefficient of variation (in parentheses) for the two-tissue compartment model and distribution volume (VT) in Logan graphical analysis (GA).
Validation of reference regions
TARP γ-8 is markedly expressed in the hippocampus but has negligible levels in the thalamus, cerebellum, and pons in the rat brain. 33 To determine an adequate reference region, we compared variations in data acquisition among the three reference regions.
Figures 3(a) to (c) show correlation plots between BPND values obtained with the SRTM and DVR − 1 (indirect BPND) based on the 2TCM using different reference regions ((a): cerebellum; (b): thalamus; (c): pons). Although BPND values in each reference region was underestimated, the highest correlation (R2 = 0.945) between the BPND and DVR − 1 values was found in the kinetic analysis using the TAC of the cerebellum. Therefore, the cerebellum is an adequate reference region when reference tissue model analysis is used for PET with [11C]TARP-2105.
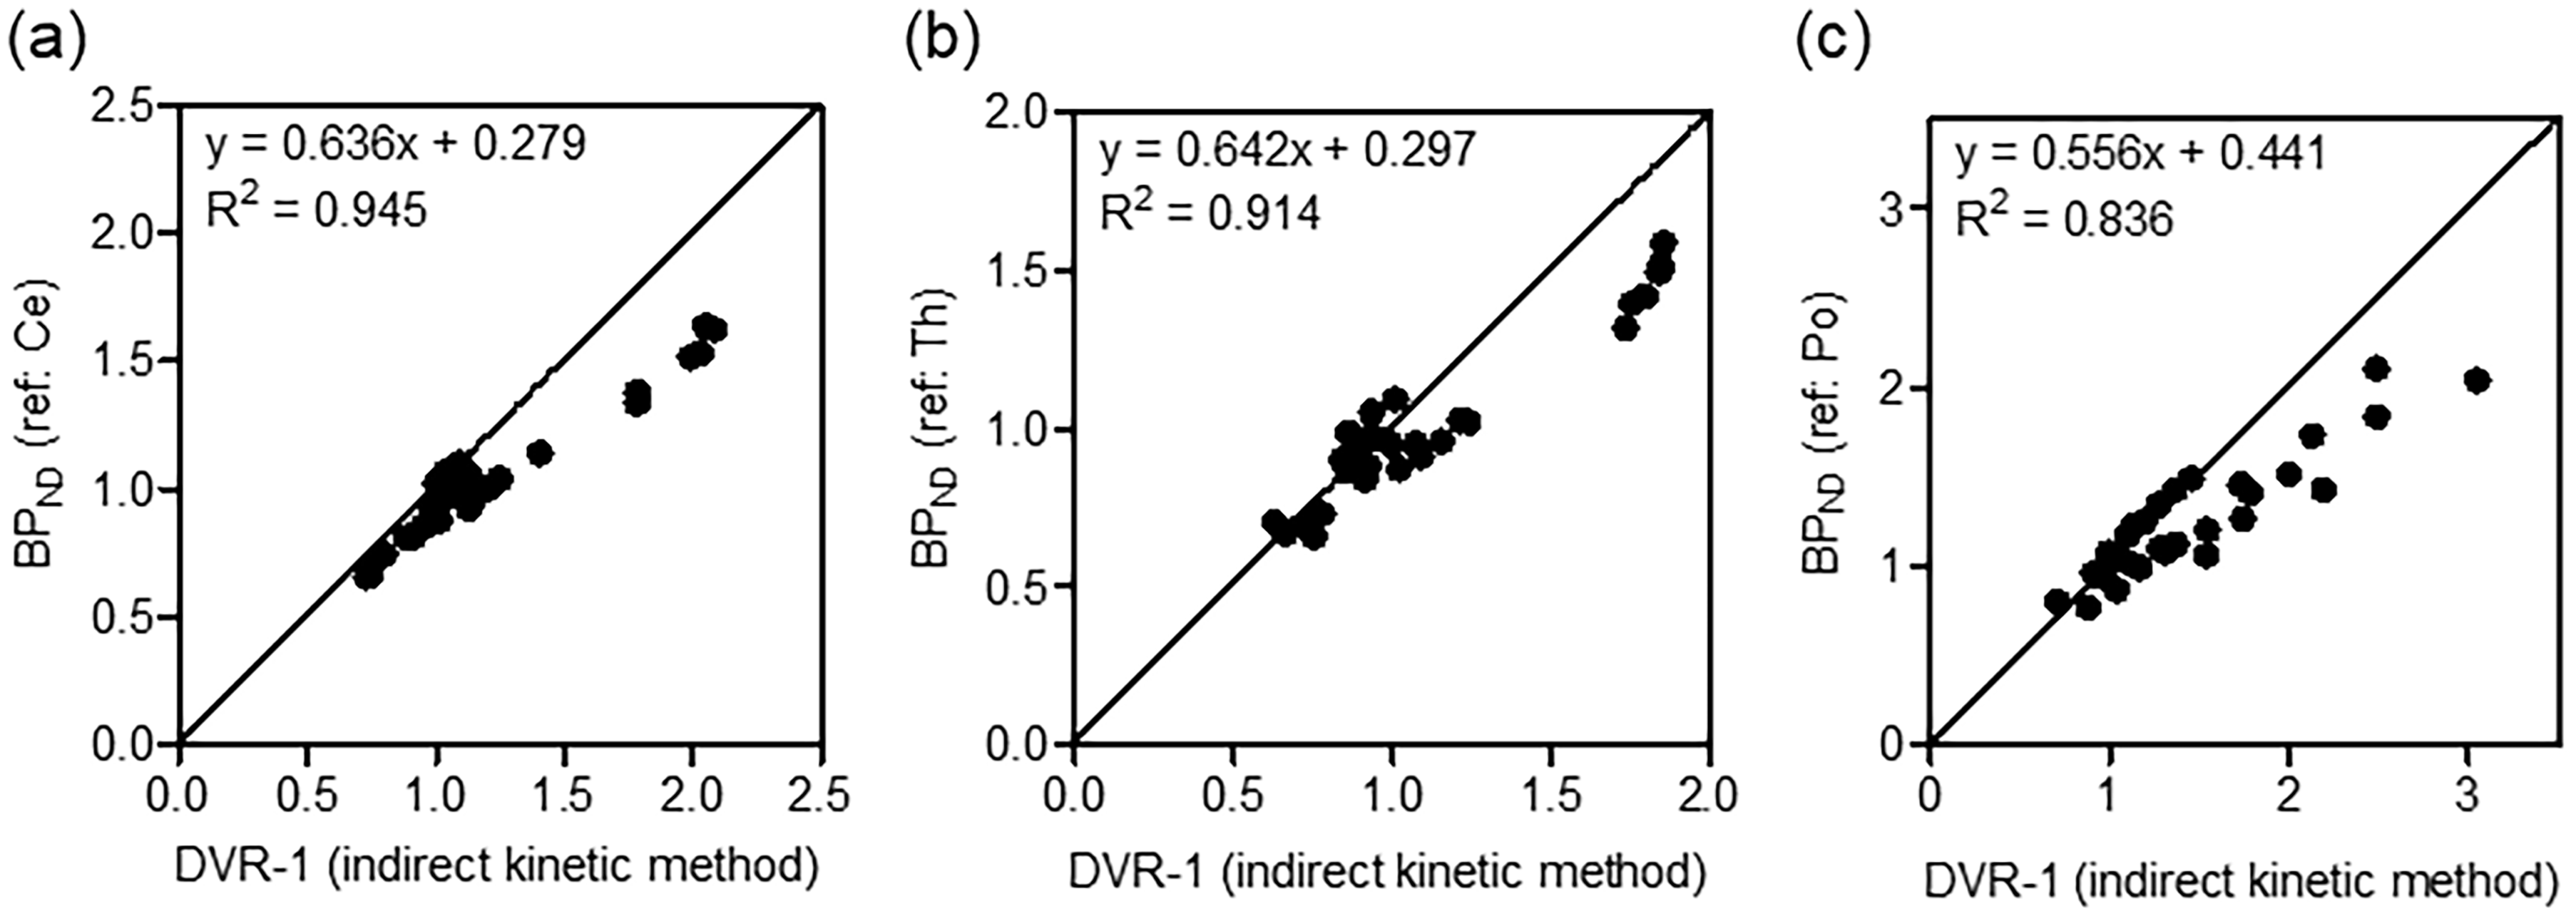
Validation study for determination of an adequate reference region. Scatter plots indicating the correlation between BPND based on simplified reference tissue model (SRTM) analysis and the distribution volume ratio (DVR) minus 1 using the indirect kinetic method. The cerebellum (a), thalamus (b), and pons (c) were chosen as reference regions. Data plots were obtained from six rats. Abbreviations: Ce, cerebellum; Th, thalamus; Po, pons.
Comparison of general reference tissue models
Subsequently, we compared the BPND values acquired using the indirect kinetic method with those determined by general reference tissue models, such as the SRTM, MRTM0, Logan Ref, and ratio method.
Table 2 shows regional BPND values based on several model analyses in six rat brains. In the indirect kinetic method with blood sampling, the estimated indirect BPND (DVR − 1) value in the investigated brain regions exhibited the following rank order: hippocampus (1.79–2.08) > amygdala (1.04–1.25) > frontal cortex (0.95–1.07) > striatum (0.74–0.91). Compared with the indirect BPND values, the lowest difference was detected for the MRTM0 (11.4%), whereas the highest difference was determined in the SRTM (14.3%).
The BPND values in brain regions estimated using various reference methods (n = 6).
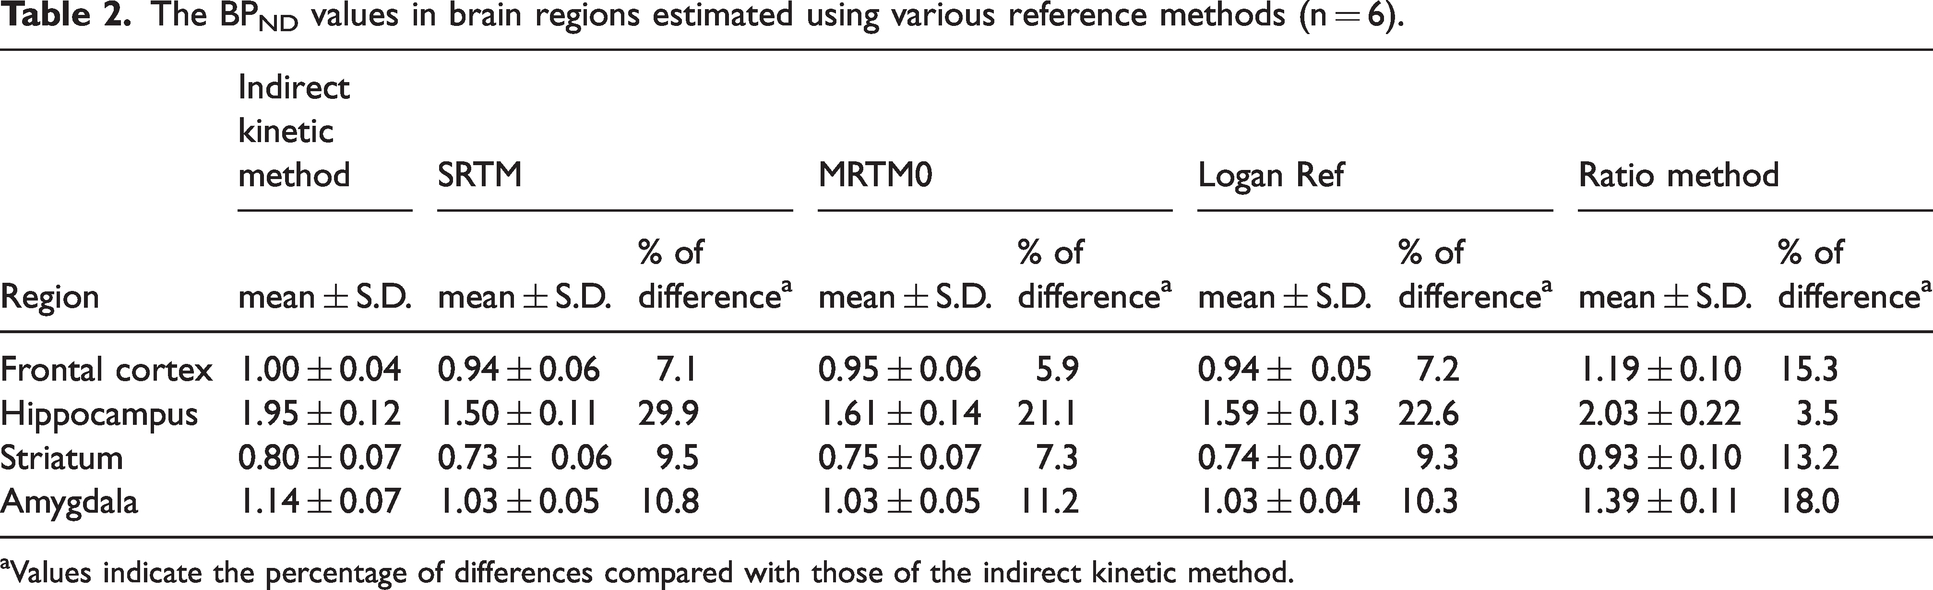
aValues indicate the percentage of differences compared with those of the indirect kinetic method.
Figures 3(a) and 4(a) to (c) show relationships between BPND values estimated by several reference models (SRTM, MRTM0, Logan Ref, and ratio method) and indirect BPND (DVR − 1) values calculated by the 2TCM. The BPND values estimated by each reference model exhibited high correlation (R2 > 0.9). Among the reference models, the Logan Ref method showed the highest correlation (R2 = 0.969) despite slight underestimation (slope = 0.724). In contrast, although near-BPND values based on the ratio method exhibited the closest relationship (slope = 0.928) with indirect BPND values, the value exhibited a constant bias (0.248).
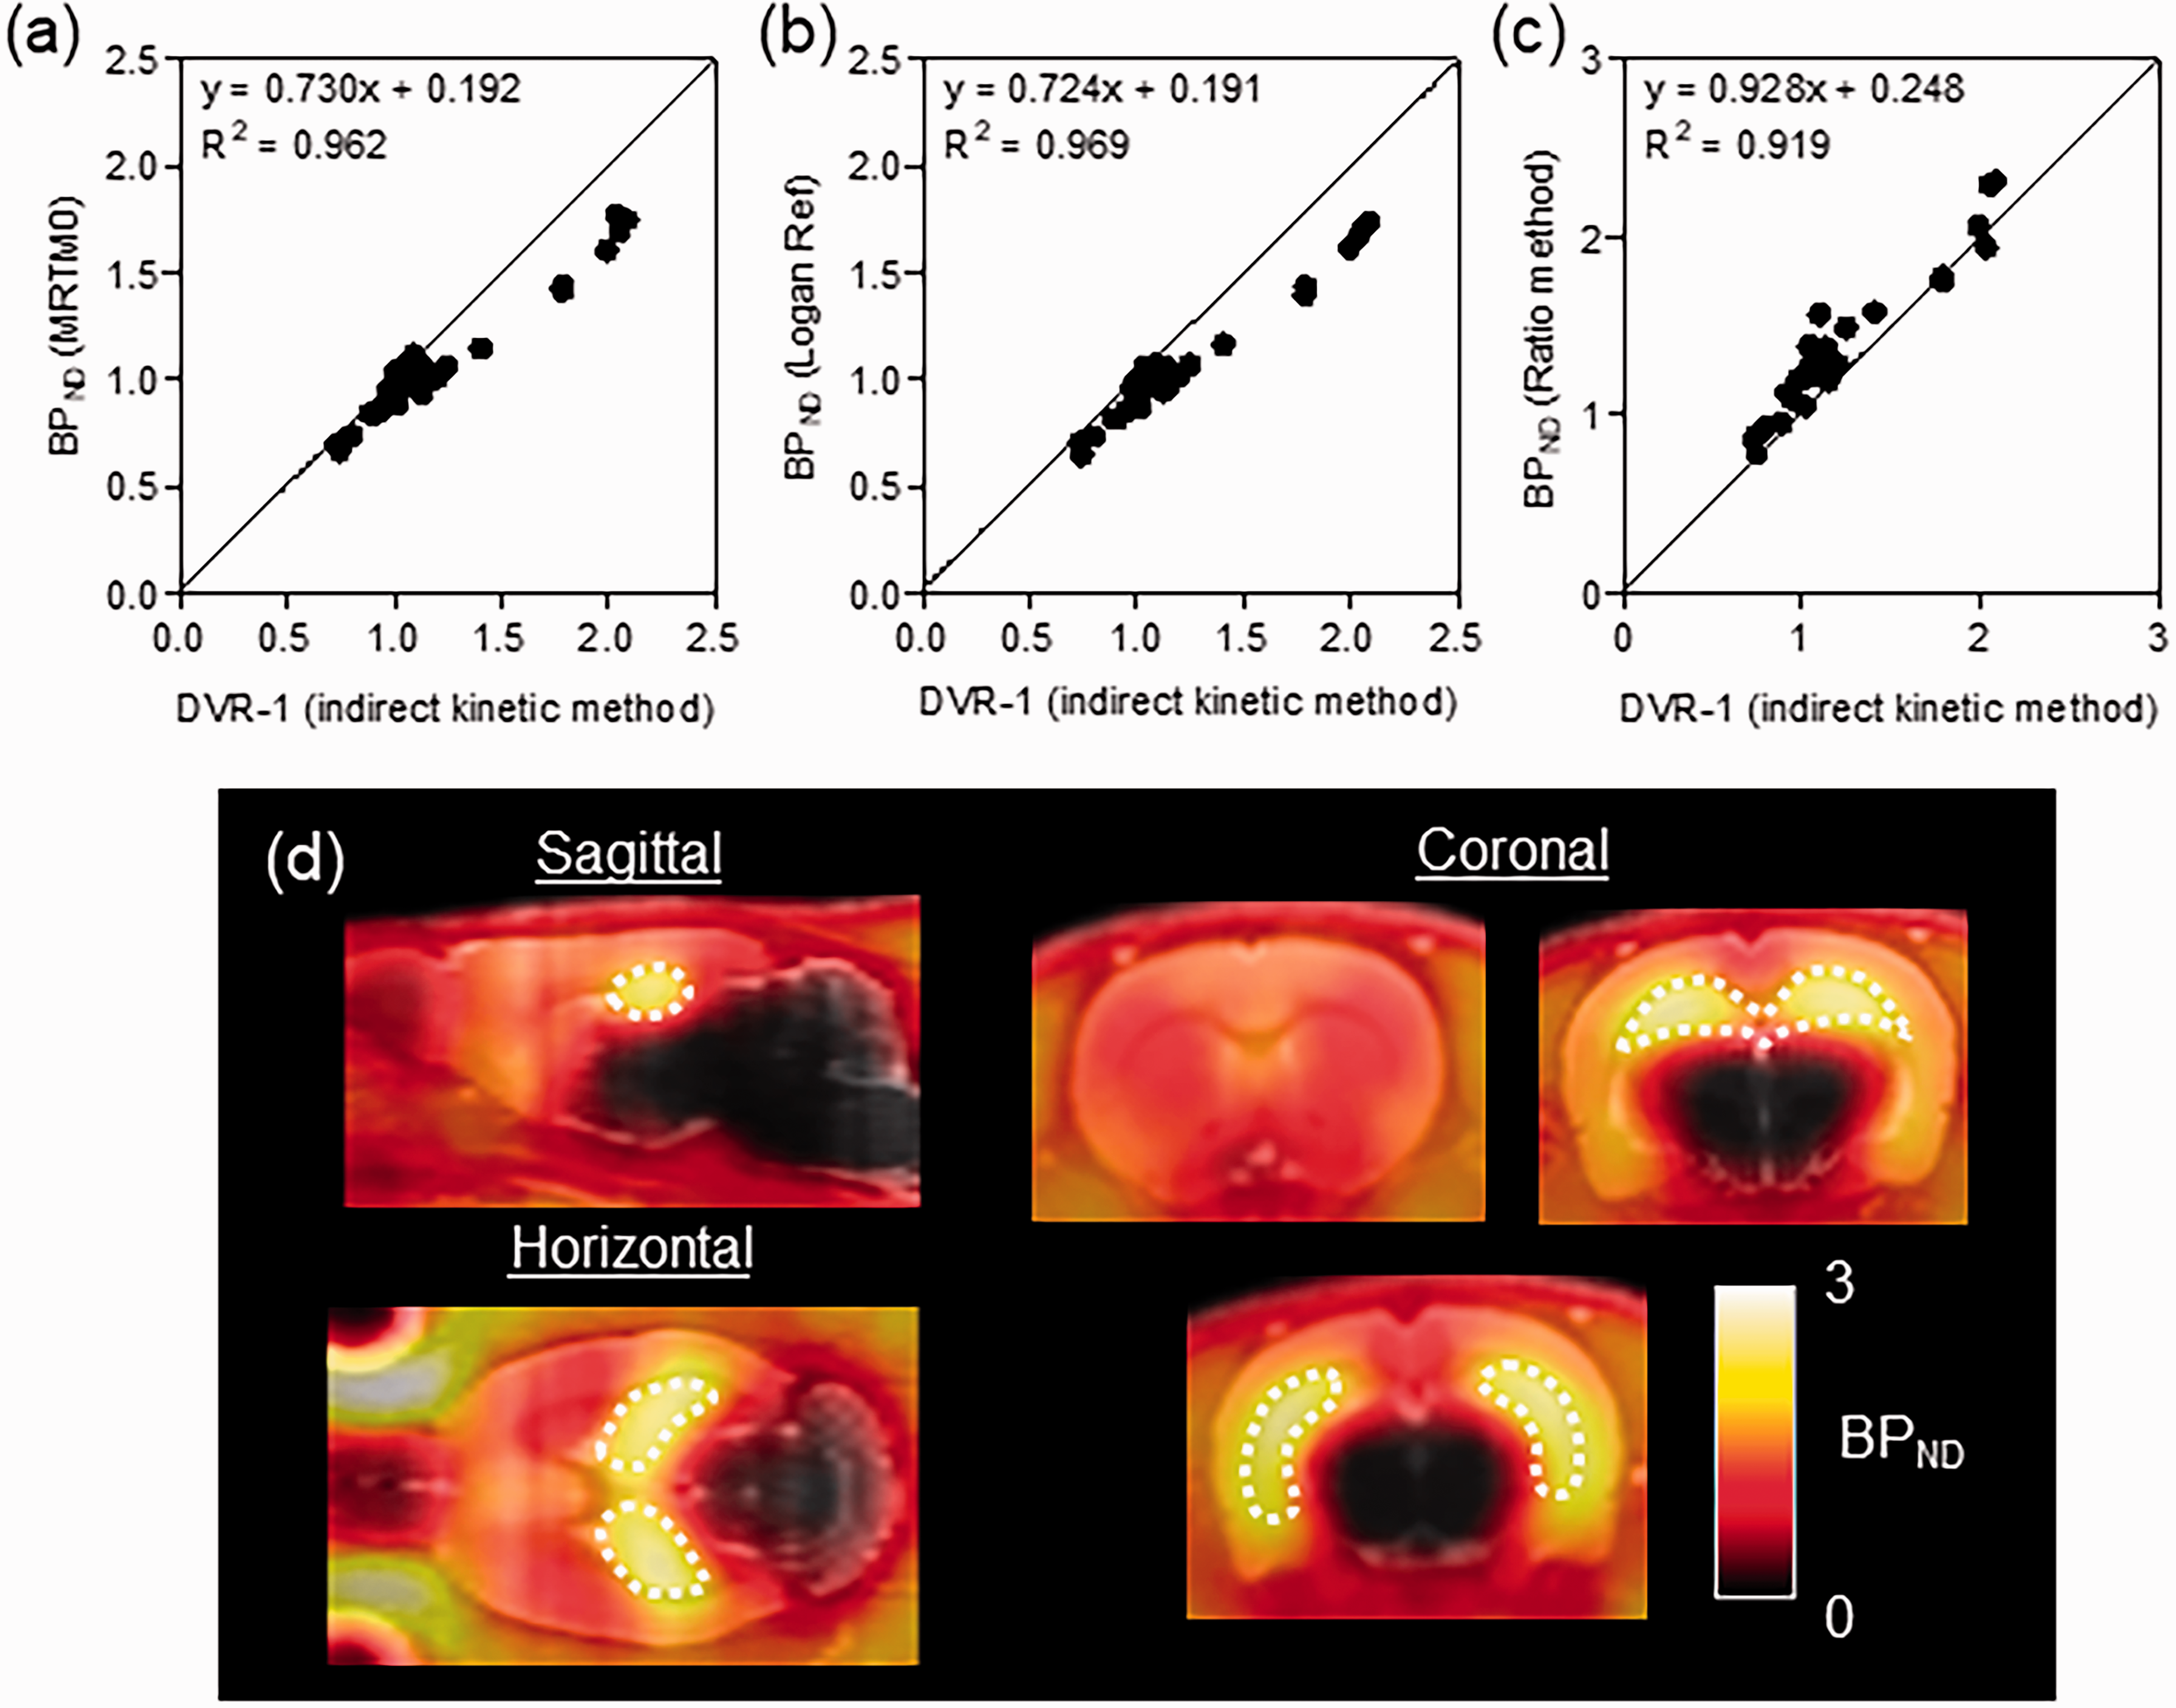
Relationship between BPND based on general reference tissue models and the distribution volume ratio minus one (DVR − 1) based on the indirect kinetic method and parametric PET/MRI -fused images of TARP γ-8 in the brain. Reference tissue model analyses were conducted using the multilinear reference tissue model (MRTM0) (a), Logan reference model (Logan Ref, b), and ratio method (c). The parametric PET images (d) were generated using BPND values based on the ratio method and averaged for six rats. The dotted line area indicates the hippocampus, the region richest in TARP γ-8.
Bland-Altman plots showed biases of BPND values based on these reference tissue methods, compared with DVR − 1 (2TCM) (Figure S3). The percentages of difference of BPND values were −12.4 ± 18.1 for SRTM, −10.3 ± 14.7 for MRTM0, −11.1 ± 13.9 for Logan Ref, and 13.6 ± 17.8 for ratio method, respectively. All reference tissue models showed the similar tendency that positive bias was observed in low BPND values and negative bias was found in high BPND values.
Test-retest study for estimation of the BPND
Table 3 shows the reproducibility of the test-retest PET study for estimation of the BPND in each reference tissue model. In the hippocampus, the richest region of TARP γ-8 in the brain, the percentages of the relative difference and variability were 9.2 and 8.9 for the SRTM, 11.0 and 10.4 for the MRTM0, 10.3 and 10.0 for the Logan Ref, and 11.2 and 10.7 for the ratio method, respectively. Additionally, the correlation (Pearson’s r) between test and retest outcomes in all regions was 0.952 for the SRTM, 0.941 for the MRTM0, 0.943 for the Logan Ref, and 0.940 for the ratio method (Figure S4).
Test-retest variability (n = 5, mean ± SD) for estimation of BPND in PET with [11C]TARP-2105.
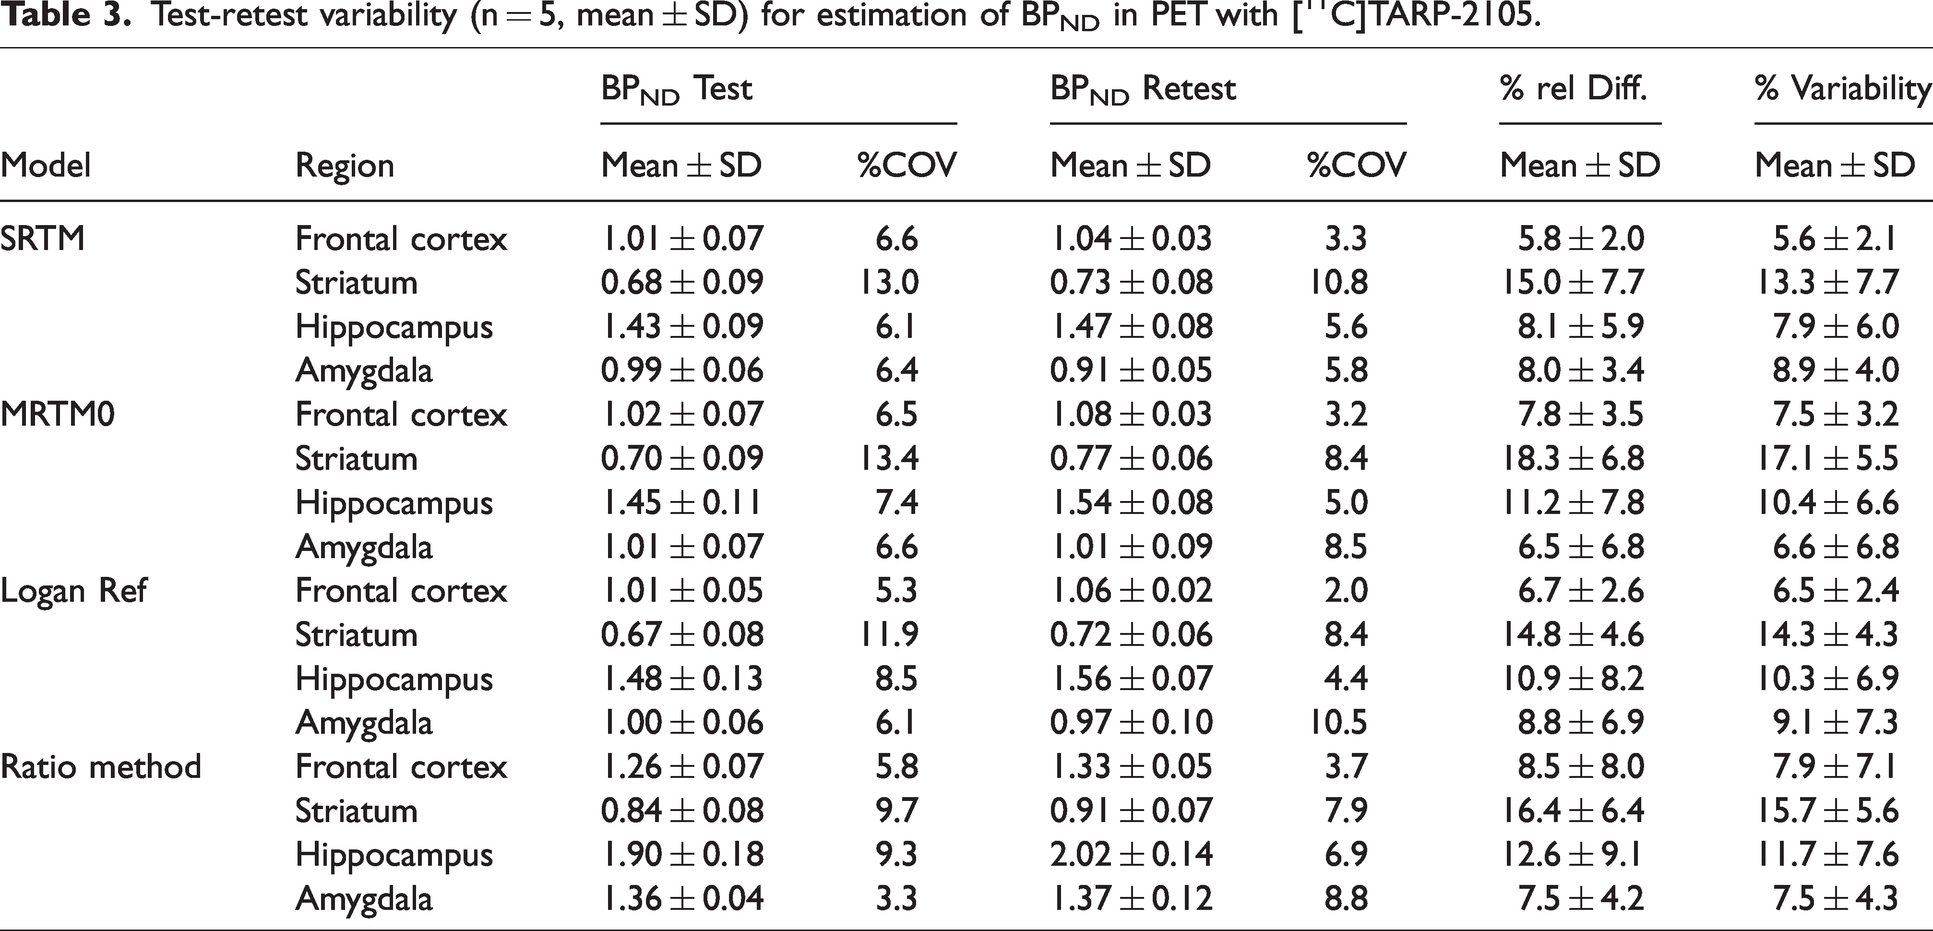
In this study, the ICC values were below 0.5 within all regions in all reference tissue models (data not shown), which indicates that the within subject variability was relatively large value against the between subject variability. Although the ICC values did not indicate test-retest reliability, the percentages of relative difference and variability scores and the Pearson’s r values showed relatively high reliability for outcomes in test-retest study, as described above. Therefore, the BPND estimations based on the reference tissue models would show relatively high reproducibility.
In vivo mapping of TARP γ-8 in the rat brain
Figure 4(d) shows averaged BPND-based parametric images of [11C]TARP-2105 with TARP γ-8 in six rat brains. In the present study, parametric images of BPND were generated using the ratio method exhibiting the least amount of underestimation. High BPND signal intensity was observed in the hippocampus, and moderate signals were observed in the forebrain. In contrast, the mid-brain and pons signals were negligible. Therefore, we successfully visualized the in vivo availability of [11C]TARP-2105 to TARP γ-8, which reflected the biological distribution reported previously. 33
Discussion
In the present study, we estimated the kinetic parameters and distribution volumes of [11C]TARP-2105 in rat brain regions for the first time. Additionally, we validated the utility of the reference tissue model as a noninvasive method for quantification of TARP γ-8 and achieved in vivo visualization corresponding to the TARP γ-8 density using PET.
[11C]TARP-2105 was recently developed as a promising PET ligand for TARP γ-8 imaging in our research group. 18 In that report, in vitro autoradiography studies of [11C]TARP-2105 showed heterogeneous radioactive accumulation in the brain in the following rank order: hippocampus, frontal cortex, striatum, thalamus, and cerebellum. The radioactive signals were successfully decreased by administration of the TARP γ-8-selective inhibitor JNJ-55511118. 19 Previous studies of the biological distribution of TARP γ-8 in the rodent brain reported that the hippocampus exhibited the greatest amount, followed by the cerebral cortex, striatum, and amygdala, with little expression within the hindbrain, midbrain, and thalamus.33,34 Consequently, it was strongly suggested that [11C]TARP-2105 binding directly corresponds to the TARP γ-8 density in the brain. In the present study, we estimated the VT, a macroparameter consisting of the K1–k4 rate constants of radioligands in the brain, of [11C]TARP-2105 in brain regions. The VT values of the hippocampus (high TARP γ-8 level) and cerebellum (low TARP γ-8 level) were 1.4 and 0.5 mL/cm3, respectively. Although the binding component ratio between the hippocampus and cerebellum determined by in vitro autoradiography with [11C]TARP-2105 was higher than 10, the VT ratio between the two regions was less than three. One possible reason for this discrepancy was the low brain permeability of [11C]TARP-2105. The highest VT value of 1.4 mL/cm3 and brain uptake of [11C]TARP-2105 of less than 1 SUV were low values as the PET ligand for brain imaging. To evaluate limitation of brain permeability of [11C]TARP-2105 by ATP-binding cassette (ABC) transporters, a single PET scan with [11C]TARP-2105 was conducted using rat administrated with elacridar, 35 a potent dual inhibitor for P-glycoprotein (Pgp) and breast cancer resistant protein (BCRP). Administration with elacridar increased with roughly 2-fold the brain uptake of radioactivity (AUC20-60 min value) in every brain region (Figure S5). These results indicate that the entrance of [11C]TARP-2105 into brain would be limited by Pgp and BCRP. In addition, the partial volume effect caused by the limited spatial resolution of the PET scanner might influence the signal/noise ratio because the rat hippocampus is very small. More importantly, although ABC transporters limited the brain permeability of [11C]TARP-2105 to some extent, we successfully estimated regional VT values with high accuracy (<10%COV) using the 2TCM, even in TARP γ-8-poor regions such as the cerebellum, thalamus, and pons.
The BPND value is frequently used as a reliable index for specific binding of radioligands to target molecules in vivo rather than the VT value. 36 The indirect kinetic method with arterial blood sampling as described in equation (2) is widely used as a standard method to estimate the BPND (DVR − 1). However, PET analysis with arterial blood sampling is an invasive procedure that is particularly unsuitable for pathological animal models. Therefore, the reference tissue model without arterial blood sampling is essential for noninvasive estimation of BPND values of radioligands for target molecules. Because TARP γ-8 has limited expression in the cerebellum, thalamus, and pons,33,34 we determined the most adequate reference region among these areas. The lowest radioactive uptake (AUC20–60 min =3.8 SUV × min) was observed in the pons. However, the BPND values based on the SRTM using the TAC of the pons as a reference region indicated large variation compared with that of other reference regions (Figure 3(c)). This large variation in the pons might be caused by a relatively large %COV in the 2TCM outcomes (Table 1), which suggests that the TAC of the pons would include some noise. The smallest variation and highest correlation (R2 = 0.945) with the indirect BPND values was determined using the TAC of the cerebellum. Because the cerebellum is the largest region in the rat brain, detection of radioactive signals in this region could be achieved with low variation and the least amount of noise. Moreover, the cerebellum is frequently used as a reference region in small-animal PET studies using reference tissue model analysis.37–39 Hence, the cerebellum is considered an adequate reference region for noninvasive estimation of BPND values using reference tissue model analysis in PET with [11C]TARP-2105. Subsequently, the essential scan time for acquisition of BPND values in the PET study was evaluated using the SRTM. Although the BPND values in the frontal cortex, striatum, and amygdala exhibited plateaus for 30 min data acquisitions or less, the BPND value in the hippocampus required more than 50 min date acquisitions to nearly reach a plateau. Similarly, the ratios of TAC in the brain regions to TAC of cerebellum reached plateaus less than 30 min excepting that in the hippocampus, whereas the ratio of hippocampus got to plateau at roughly 50 min. Consequently, PET scans of 60 min were sufficient for the acquisition of BPND values using the SRTM (Figure S6).
Reference tissue model analysis is generally performed as NLS and graphical analyses. NLS analyses, including the SRTM and MRTM, were theoretically consisted from the 2TCM and therefore can be used to estimate not only the BPND values of radioligands but also the rate constants of input (R1) and clearance (k2’) of radioligands.28,29 In contrast, graphical analysis directly calculates the DVR and is not affected by the compartmental structure of radioligands. 30 In this study, we evaluated the reliability and reproducibility of BPND values using representative NLS (SRTM and MRTM0) and graphical (Logan Ref) analyses. Compared with the indirect BPND based on the 2TCM, the highest correlation was shown for the BPND based on the Logan Ref method (R2 = 0.969) despite a small amount of underestimation (slope = 0.724). In contrast, the highest reproducibility of the BPND values in the test-retest PET study was observed for the SRTM, although the BPND measurement showed a certain amount of underestimation (slope = 0.636) compared with the indirect BPND. Besides, the ratio method is occasionally used to simply estimate the near-BPND, similar to the SUV ratio, as a semi-quantitative parameter. 40 The ratio method is useful in clinical research, especially for patients who cannot lie on a bed for an extended period, because this analysis shortens the scan period and simplifies the estimation process. However, the reliability of BPND estimation depends on the time frames used for its calculation, and an optimal time frame for reliable BPND estimation is dependent upon the kinetics of the radioligand. 41 Therefore, it is essential to evaluate whether the ratio method reflects the BPND in PET studies with [11C]TARP-2105. Herein, we validated the time frames to reliably estimate the BPND in PET studies with [11C]TARP-2105 and consequently the frame from 20 min to 60 min after injection was found to be an adequate summed period (Figure S1). Interestingly, the BPND based on the ratio method resulted in little underestimation (slope = 0.928) and sufficient reproducibility (%variability = 10.7) of BPND estimation, which would permit decreasing the emission scan time in PET studies on rats using [11C]TARP-2105. Additionally, parametric images (Figure 4(d)) of the BPND based on the ratio method showed more obvious contrast with a wide range of signal than images obtained using the SRTM. 18 The reference tissue model for PET with [11C]TARP-2105 could be selected according to the research purpose. For example, when a BPND with R1 information is needed, the SRTM can be used. Alternatively, to simply obtain BPND information only, the Logan Ref method can be used. In limited case of animal studies using same kind of rat in this study use, the BPND can easily be estimated in a shortened PET scan using the ratio method.
Theoretically, the BPND is composed of the free-to-nondisplaceable concentration ratio (fND), target density (Bmax), and ligand affinity (KD) as shown in the following equision.
42
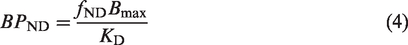
As shown in equation (4), limited brain permeability directly affects fND. Therefore, BPND values of [11C]TARP-2105 in baseline subjects would suffer from underestimation. In fact, treatment with elacridar enhanced BPND values in every brain region and notably BPND value in the hippocampus increased with roughly 140% (Table S1). However, it is considered that the fND value would be at a similar level in same animal species. Therefore, the use of BPND as an index for TARP γ-8 density in PET imaging study with [11C]TARP-2105 is reasonable in experiments for rat. To determine the species difference of brain permeability of [11C]TARP-2105, it is essential for further PET studies using non-human primates. The preclinical evaluation is important for translational study of [11C]TARP-2105 in human.
Although this is not a clinical study, TARP γ-8 is a novel target for the development of pharmaceuticals for CNS disorders, and its function remains unknown. Therefore, performing the present small-animal PET study with [11C]TARP-2105 using pathological and genetic animal models could provide important information to elucidate the TARP γ-8 mechanisms underlying CNS disorders. Moreover, occupancy studies of new therapeutic drugs can be easily performed using PET with [11C]TARP-2105. 43
In conclusion, PET with [11C]TARP-2105 could be used to noninvasively quantify the specific binding of TARP γ-8, which would permit further understanding of the unknown mechanisms of TARP γ-8 and facilitate translation of basic research to clinical studies.
Supplemental Material
sj-pdf-1-jcb-10.1177_0271678X231152025 - Supplemental material for Small-animal PET study for noninvasive quantification of transmembrane AMPA receptor regulatory protein γ -8 (TARP γ -8) in the brain
Supplemental material, sj-pdf-1-jcb-10.1177_0271678X231152025 for Small-animal PET study for noninvasive quantification of transmembrane AMPA receptor regulatory protein
Footnotes
Funding
The author(s) disclosed receipt of the following financial support for the research, authorship, and/or publication of this article: We gratefully acknowledge financial support from JSPS KAKENHI (Grant No. 19K08240 to T. Y. and 20H03635 to M.-R. Z.), the AMED Moonshot Research and Development Program (Grant No. 21zf0127003h001 to M.-R. Z.) and partial NIH supports (MH120197, AG073428 & AG074218 to S.L.).
Acknowledgements
Declaration of conflicting interests
The author(s) declared no potential conflicts of interest with respect to the research, authorship, and/or publication of this article.
Authors’ contributions
All authors made a substantial contribution to the study concept and design, the article and revising it for intellectual content. TY, SL, and MRZ contributed to the conception and design of the research and interpreting the results. TY, AH, YZ, and HW collected the data. HI, KK, GC, and YL conducted radiosynthesis. YK, MO, and NN operated cyclotron. TY analyzed the neuroimaging data. TY, SL, and MRZ reviewed and edited the manuscript. TY is the guarantor of this work, had access to the data and accepts full responsibility for the work and conduct of the study and the decision to publish.
Supplementary material
Supplemental material for this article is available online.
References
Supplementary Material
Please find the following supplemental material available below.
For Open Access articles published under a Creative Commons License, all supplemental material carries the same license as the article it is associated with.
For non-Open Access articles published, all supplemental material carries a non-exclusive license, and permission requests for re-use of supplemental material or any part of supplemental material shall be sent directly to the copyright owner as specified in the copyright notice associated with the article.