
Abstract
The Patlak graphical analysis (PGAREF) for quantification of irreversible tracer binding with a reference tissue model was approximated by a dual time point imaging approach (DTPREF). The DTPREF was applied to 18 [18F]-FDOPA brain scans using the occipital cortex as reference region (DTPOCC) and compared to both PGAOCC and striatal-to-occipital ratios (SOR). Pearson correlation analysis and Bland–Altman plots showed an excellent correlation and good agreement between DTPOCC and PGAOCC, while correlations between SOR and PGAOCC were consistently lower. Linear discriminant analysis (LDA) demonstrated a similar performance for all methods in differentiating patients with Parkinson’s disease (PD) from healthy controls (HC). Specifically for [18F]-FDOPA brain imaging, these findings validate DTPOCC as an approximation for PGAOCC, providing the same quantitative information while reducing the acquisition time to two short static scans. For PD patients, this approach can greatly improve patient comfort while reducing motion artifacts and increasing image quality. In general, DTPREF can improve the clinical applicability of tracers with irreversible binding characteristics when a reference tissue is available.
Keywords
Introduction
Positron emission tomography (PET) provides quantitative information on physiological processes and functional tissue characteristics. The underlying mechanisms of PET tracer binding can be described by compartmental models. However, a model accounting for all states of tracer binding is often too complex and unpractical in a clinical setting. Therefore, model simplifications are essential to provide stable and reliable quantitative endpoints while reducing the acquisition time and/or avoiding invasive procedures such as arterial blood sampling. Especially for PET tracers which bind irreversibly and often require relatively long acquisition times, reducing the scan duration can be imperative to improve patient comfort and clinical applicability.
The Patlak Graphical Analysis 1 (PGA) is a non-compartmental approach to quantify irreversible tracer binding by estimating the metabolization, influx or trapping rate constant of the tracer (Ki). PGA uses the tracer concentration in arterial plasma as input function, and assumes that at some time point post-injection (p.i.) an equilibrium is reached between the non-specific, reversible tracer binding in the target tissue and the plasma activity levels. From that time point, the Patlak plot becomes linear and the slope of the linear part corresponds to Ki. If a tissue devoid of specific tracer binding or metabolism is available, it can be considered as a reference tissue. The tracer uptake in this reference tissue can therefore be used as an input function for PGAREF, avoiding the need for arterial blood sampling. 2 Despite the fact that quantifying irreversible tracer binding using PGA or PGAREF is rather straightforward, irreversible tracer kinetics are often quantified by one static scan at a late time point p.i.. This approximation reduces the scanning time, therefore increasing cost effectiveness and patient comfort while minimizing motion artifacts. Tracer uptake values of this static scan can be converted to Standardized Uptake Values (SUV) 3 by normalizing for injected dose and patient weight. They can also be normalized to the tracer uptake in a reference tissue or to blood activity levels, yielding SUV ratio values (SUVR).4,5 However, quantification using one static scan at a fixed, late time point p.i. has several drawbacks, extensively described for oncological [18F]-FDG6,7 PET imaging. Amongst the most important limitations are the dependency of the quantification on the imaging time point p.i. 3 and the lack of direct information on the trapping or metabolization rate 8 of the tracer.
To overcome the limitations of a SUV-based quantification, a dual time point (DTP) method was proposed for [18F]-FDG PET imaging 9 as an approximation for PGA. The DTP method estimates Ki using the tissue tracer concentration and blood activity levels of two late static scans. Therefore, it potentially reduces acquisition times and increases patient comfort while providing equivalent quantitative information. We extended the previous DTP method to a reference tissue approach (DTPREF) such that PET imaging of irreversibly tracer binding could also benefit from a DTP quantification when a reference tissue is available.
[18F]-FDOPA 10 is a PET tracer with irreversible binding characteristics and well-established for the diagnosis and progression assessment of Parkinson’s Disease (PD), 11 a disorder characterized by the loss of presynaptic dopaminergic neurons. After entering the brain, [18F]-FDOPA is decarboxylated into [18F]-dopamine and trapped in the presynaptic vesicles. Nonetheless, a small fraction of [18F]-dopamine is metabolized and excreted from the brain. In addition, an [18F]-FDOPA metabolite formed in plasma is able to cross the blood–brain barrier and enter the brain. Due to its complex metabolic pathway and the presence of metabolites, [18F]-FDOPA has been quantified by several models,12–16 each of them focusing on specific parts of the tracer kinetic profile. However, for the first 90 min after injection, [18F]-FDOPA is considered to bind irreversibly, 17 with PGA being widely applied for its quantification. Moreover, the occipital cortex can be used as a reference tissue representing the reversible and non-displaceable uptake of [18F]-FDOPA in brain tissue and enabling the use of both PGAOCC and SUVR approaches. 12 More specifically, the striatal uptake of [18F]-FDOPA relative to the occipital cortex is denoted striatal-to-occipital ratio (SOR).
The present study had two goals. The first goal was to derive a DTPREF method based on a reference tissue approach and validate this method for the quantification of [18F]-FDOPA brain scans using the occipital cortex as reference region (DTPOCC). The second goal was to evaluate the performance of the DTPOCC model in differentiating patients with Parkinson’s disease from healthy controls (HC). For this purpose, the DTPOCC approach was compared to the standard PGAOCC model using a full dynamic PET scan and to the clinically relevant SOR using a late static PET scan.
Material and methods
Theory
Similar to the approach of van den Hoff and colleagues,
9
we derived the DTPREF method directly from the PGAREF equations. PGAREF describes the tissue tracer concentration at a specific time point t p.i. using a reference tissue model as follows
2
:

If we can assume that from a time point


Subtracting equation (2) from equation (3) and isolating

The nominator terms of equation (4) can be estimated directly from two static scans acquired at time points t1 and t2. The first integral term in the denominator can be expanded as:
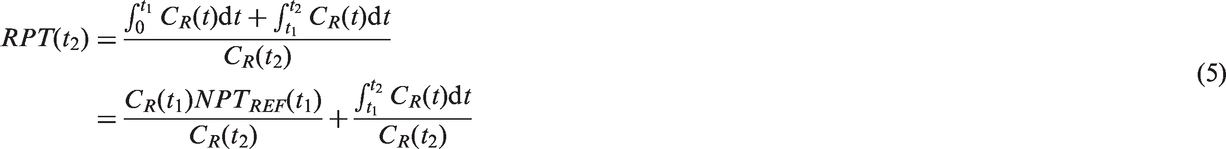
The second term of equation (5) can be estimated from the same two static scans by a trapezoid approximation. However, the first term involves

The application of this method requires only (a) the tracer concentration in the target and the reference tissue from two static scans at different time points t1 and t2 p.i. and (b) a population-based average
[18F]-FDOPA dynamic PET study
Data from 18 subjects included in a clinical study performed at the University Medical Center Groningen (UMCG) were retrospectively analysed. Written informed consent was obtained according to the 1964 Helsinki declaration and its later amendments, and the original study was approved by the local medical ethics committee. As it comprised a retrospective study, formal consent for the present analysis was not required. Subjects were referred to the UMCG and divided into three groups: HC (n = 5), clinically diagnosed Parkinson’s Disease patients (PD) (n = 8), and patients without a clear clinical diagnosis (n = 5). The latter group will be referred to as ‘undiagnosed’ (UD) throughout this article. Patients in the PD group were diagnosed by a movement disorders specialist according to clinical consensus criteria. 18
Subjects fasted for a minimum of 4 h before the start of the scan and 2.5 mg/kg of carbidopa was administered orally. One hour after the carbidopa administration, subjects received an intravenous bolus injection of 200 MBq of [18F]-FDOPA and were positioned in the high-resolution ECAT EXACT HR+ PET scanner (Siemens Healthcare, Erlangen, Germany) for a 2 h dynamic 3D PET acquisition started at time of injection. [18F]-FDOPA was prepared in the radiochemical laboratory of the University Medical Center Groningen according to a previously described synthesis protocol. 19
Image processing
Individual PET data were corrected for scatter and randoms while a separate ellipse algorithm was used to correct for attenuation. Dynamic data were reconstructed using Direct Inverse Fourier transformation (DIFT) 20 and consisted of 21 frames (10 × 30 s, 3 × 300 s, 4 × 600 s and 4 × 900 s). All image post-processing was performed in PMOD (PMOD 3.3 Technologies Ltd, Zurich, Switzerland). First, motion correction was applied by using a weighted summation of the first 13 frames as reference for the rigid matching of the remaining, individual frames. Next, each dynamic PET dataset was spatially normalized to MNI space using an in house developed [18F]-FDOPA specific brain template. Optimal transformation parameters were determined for the last 15 min time frame and subsequently applied to the dynamic dataset. A set of predefined volumes of interest (VOIs) derived from the Hammers atlas 21 was applied to the dynamic data and time activity curves (TACs) for the caudate nucleus, putamen and occipital cortex (reference region) were generated. Left and right sides of caudate and putamen VOIs were analysed separately, since lateral differences in tracer kinetics can be observed within a single subject. 22
Image analysis
First, PGAREF was applied to all dynamic datasets, with the occipital cortex as reference tissue (PGAOCC). Three different intervals were used to determine the PGAOCC derived influx constant (
Second, corresponding
Finally, individual scans were also quantified using the SOR(X) of a single frame with X representing each of the three 15 min time frames starting at 75, 90 or 105 min p.i., respectively. In this way, SOR data were matched with the PGAOCC and DTPOCC analysis.
Statistical analysis
DTPOCC and SOR quantification were compared to PGAOCC using linear regression and Pearson correlation analysis. A Bland–Altman plot was applied to analyse the agreement between PGAOCC and DTPOCC. Linear regression, Pearson correlation and Bland–Altman analysis were performed on all datasets, including HC, PD and UD data. Finally, a linear discriminant analysis (LDA) was conducted to investigate whether there were differences between methods when classifying subjects as HC or PD. The LDA was applied to PGAOCC and DTPOCC using the 40 - to 90-min interval and to SOR using the 15 min frame starting at 90 min p.i.. In this way, it was possible to compare results with literature data.
12
Left and right
To assess the effect of using a heterogeneous population-based
Results
Representative Patlak plots using the occipital cortex as a reference region are presented in Figure 1 for both HC and PD, with the Patlak plots of the PD patient displaying a modest lateralization for the putamen. PGAOCC showed no significant differences between left and right Representative Patlak plots. Representative PGAOCC plots for a HC (a) and a PD (b) patient. Solid grey lines indicate the fitting interval (40–90 min). For each region, the PGAOCC fits are represented by solid black lines (left hemisphere) and dashed lines (right hemisphere).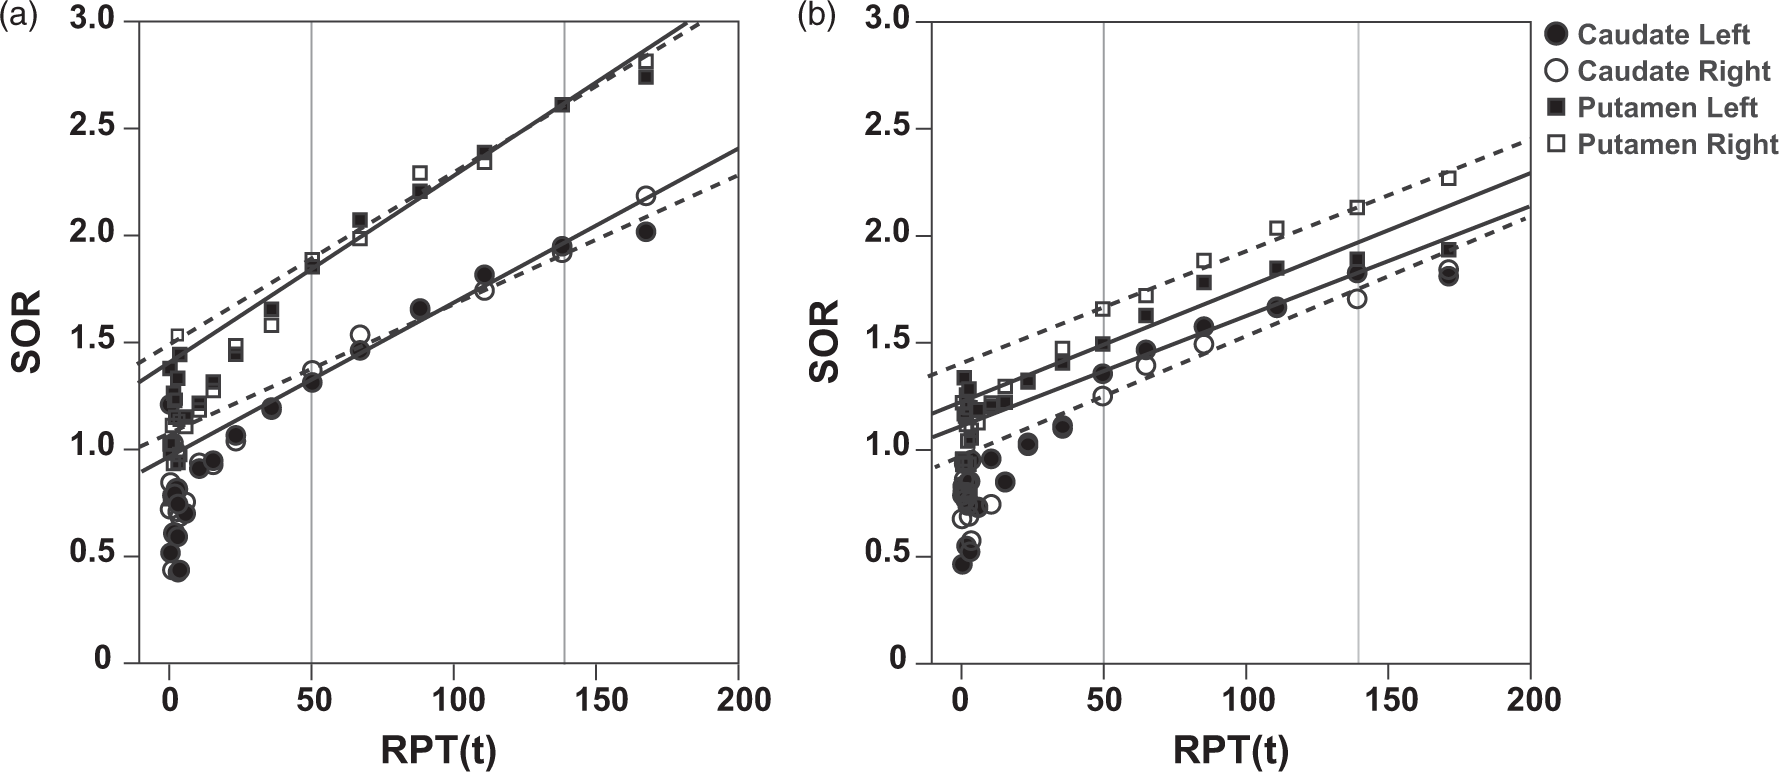
Corresponding dual time point Linear regression analysis for Linear regression analysis for DTPOCC estimates. Results of the linear regression analysis between Bland–Altman analysis for DTPOCC estimates. Results of the Bland–Altman analysis comparing 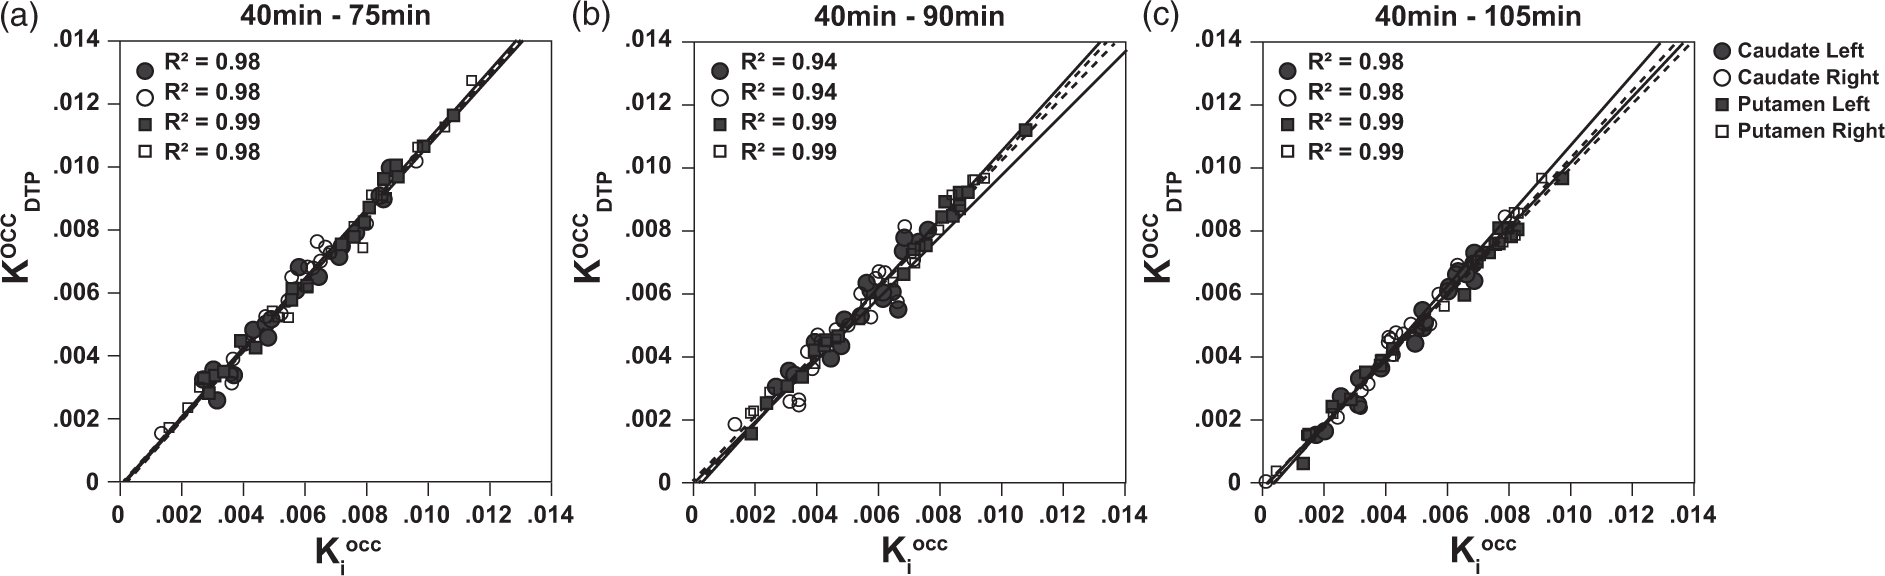
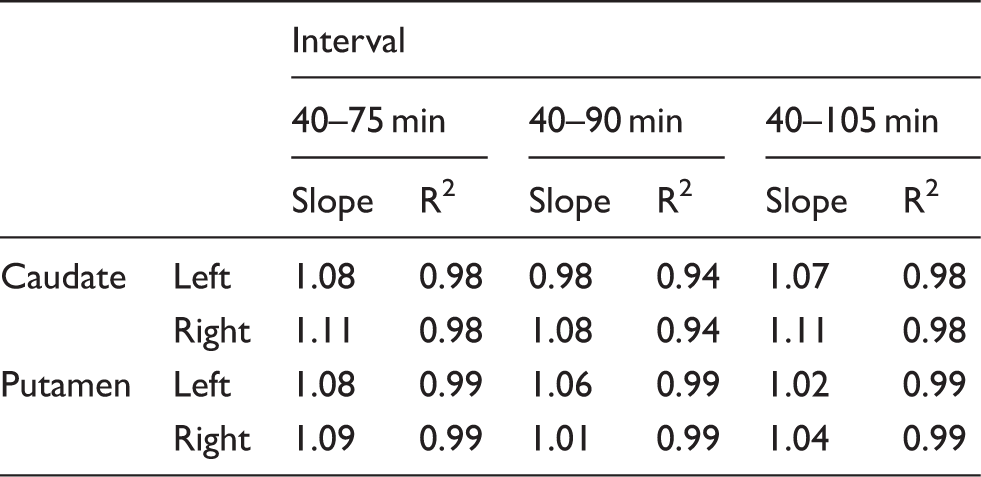
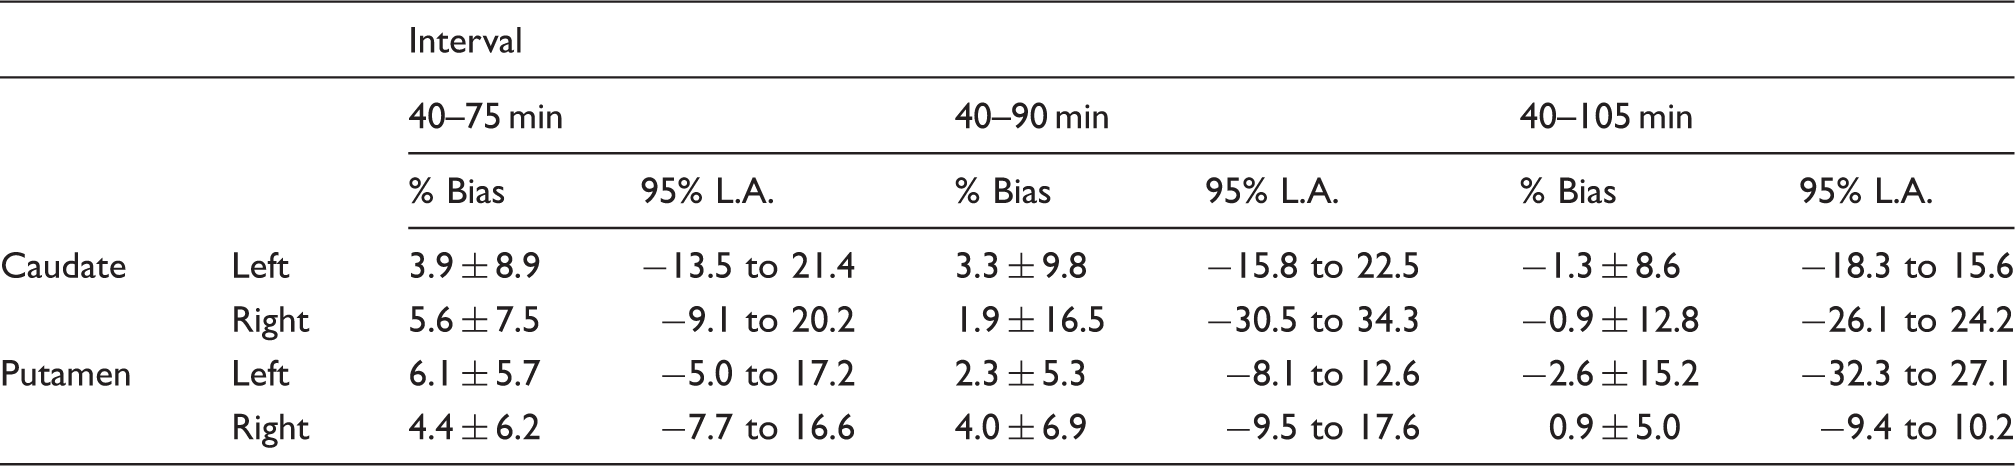
Figure 3 represents the variability of Relative variability of 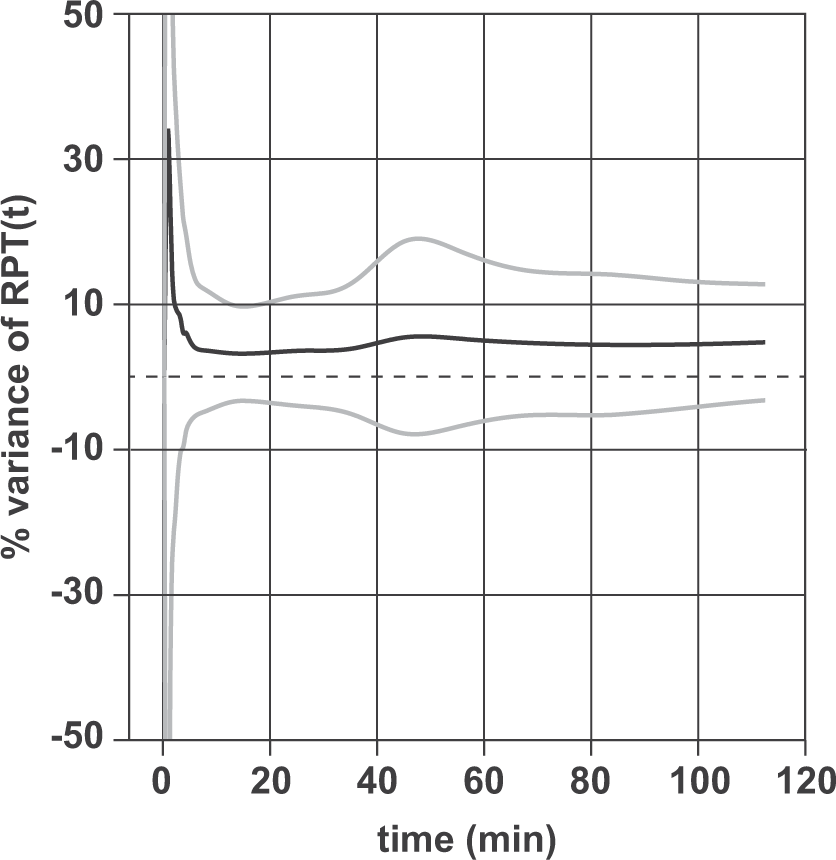
Overall, a good correlation was found between SOR and Linear regression analysis for SOR estimates. Comparison of methods by means of linear regression analysis of SOR and 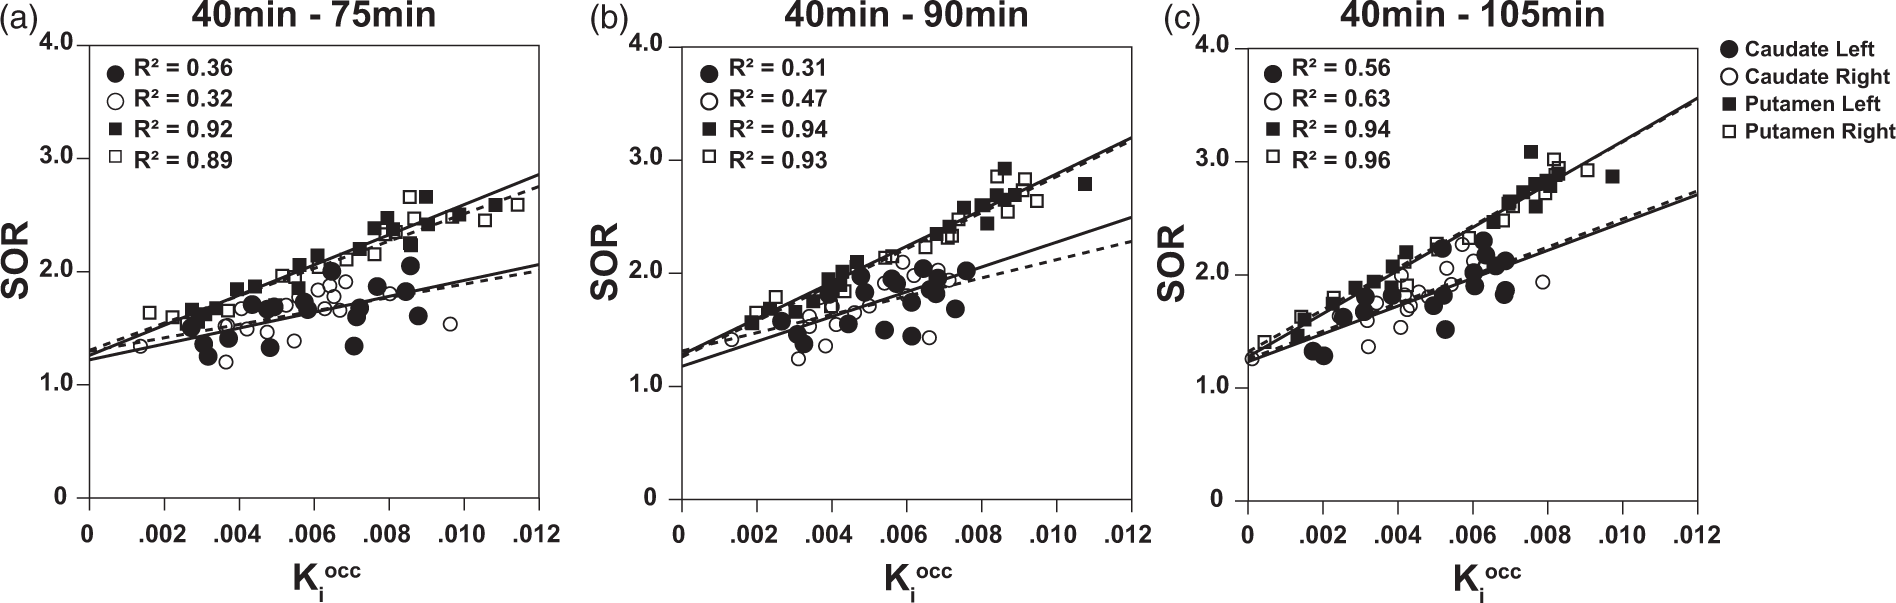
F ratios from linear discriminant analysis for all three methods.
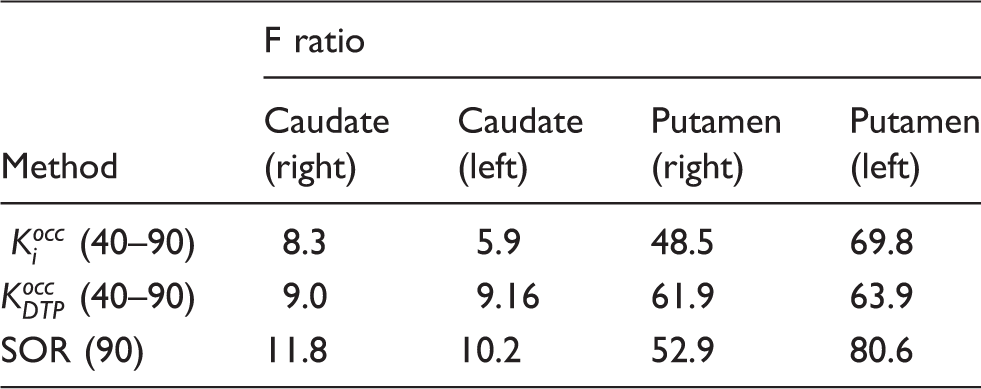
Linear discriminant analysis (F ratio) for all three quantitation methods. The F ratio describes the separation between the HC and PD groups for each of the striatal regions analysed in this study.
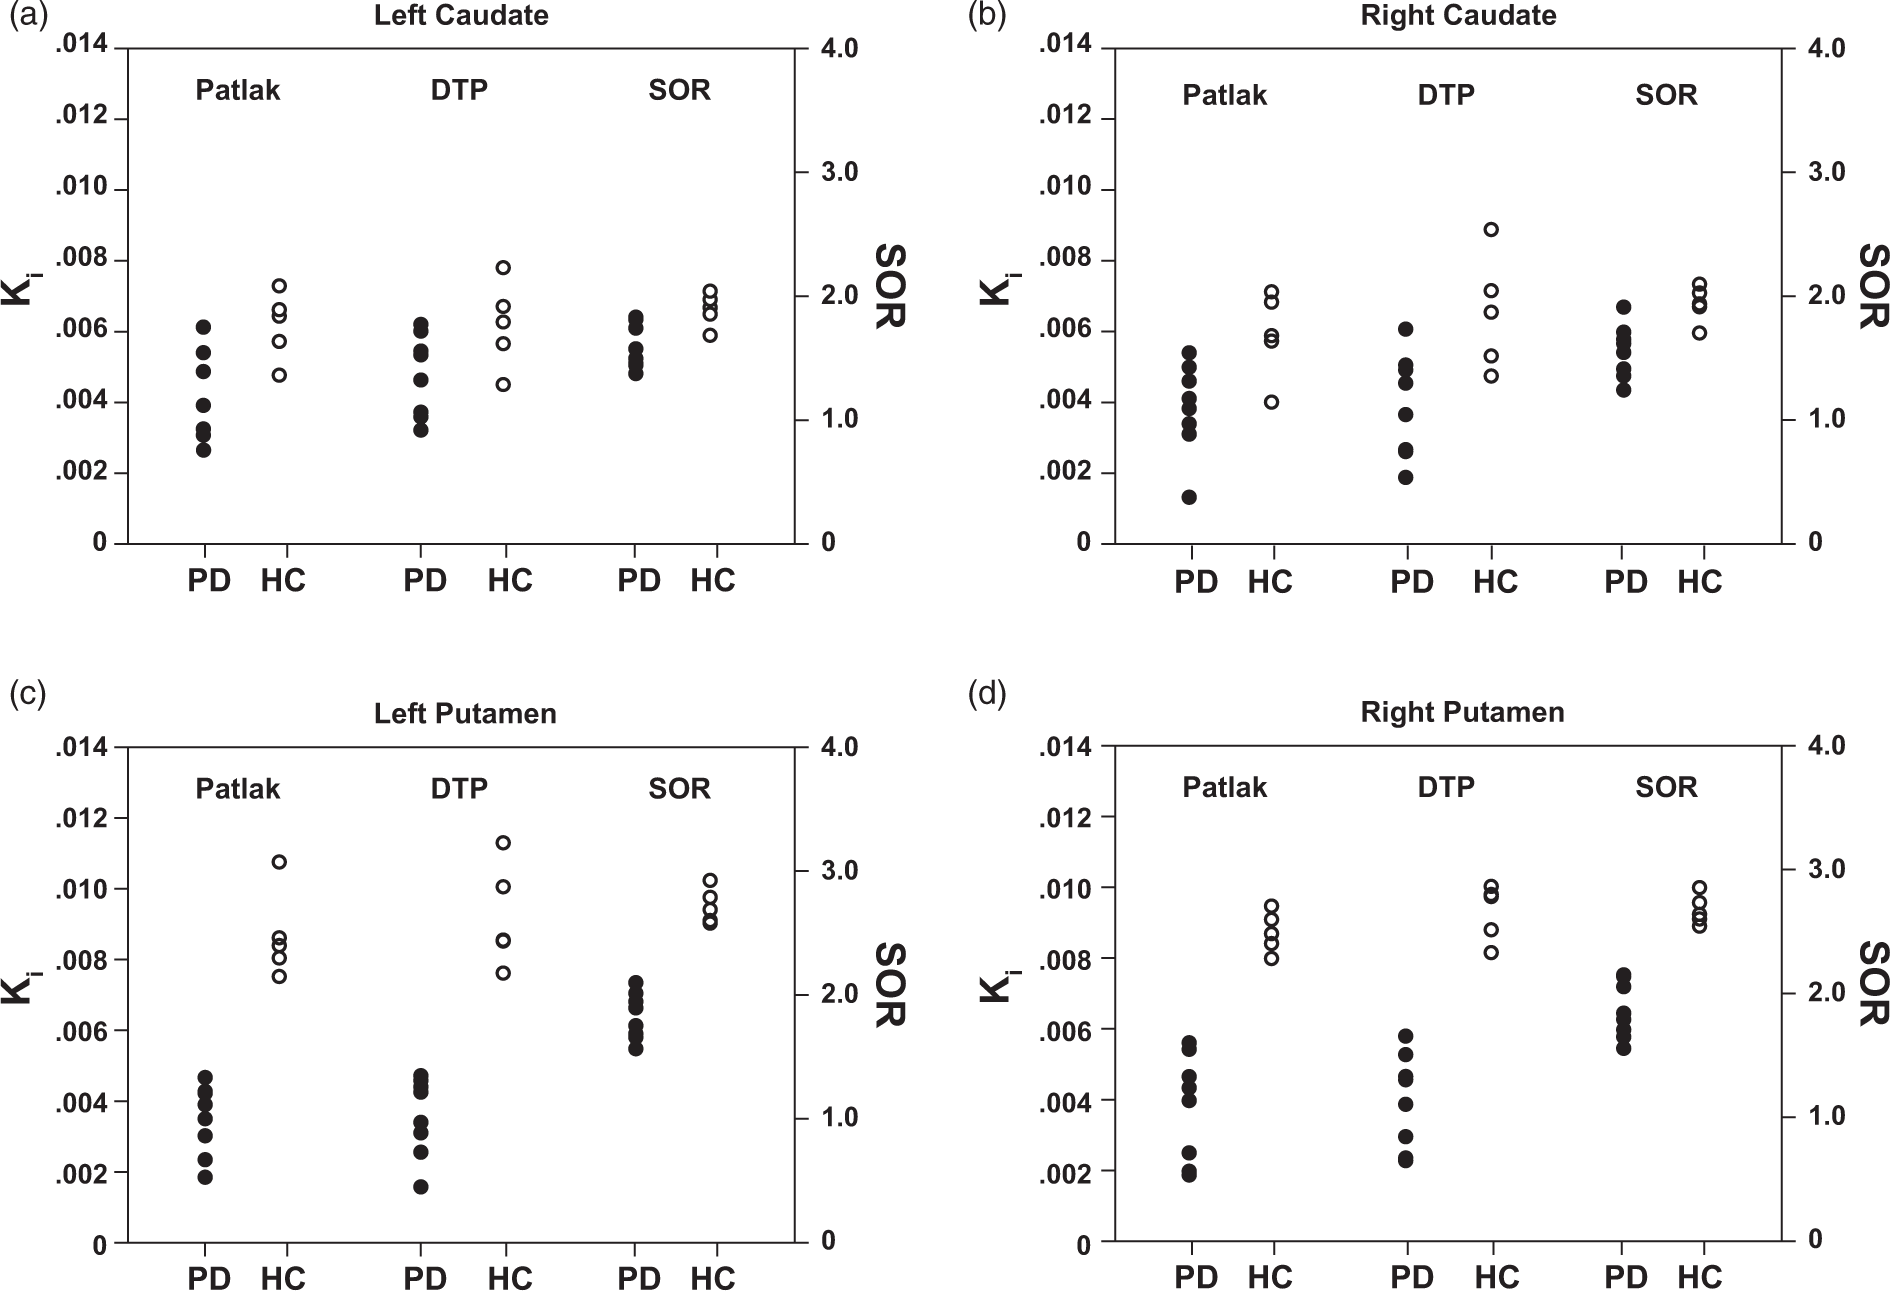
Linear discriminant analysis for all three methods. Linear discriminant analysis per region demonstrating the classification of the different groups based on each method. All three methods are able to classify HC and PD with a 100% accuracy based on the quantification results for the putamen (c, d) while an overlap between groups is observed for the caudate region (a, b).
Discussion
Although dynamic PET imaging may contribute to a more comprehensive understanding of underlying physiological processes, simple and short acquisition protocols are more suited for clinical routine.
24
Consequently, static PET scans at late time points after tracer injection are favoured over long dynamic scanning protocols. However, static scans do not provide dynamic information, which might be of importance for detecting subtle changes during treatment or for monitoring disease progression. A dual time point approach aims at bringing together the advantages of static PET imaging with the ability to estimate the appropriate quantitative dynamic parameters. This study extended the mathematical derivation of a dual time point approach previously developed for [18F]-FDG
9
to a reference tissue model DTPREF for quantifying irreversible tracer binding. Its implementation is simple and utilizes only (a) two static scans at different time points p.i. and (b) a population-based average of the normalized area under the curve of the tracer uptake in the reference region for the time interval between the start of the scan and the first time point p.i.. Based on the information of two static scans, DTPREF has as its main outcome the influx or trapping rate constant
In the case of [18F]-FDOPA, the corresponding trapping rate relates to the striatal dopamine storage capacity. The comparison between the trapping rates estimated from both the DTPOCC method and the standard PGAOCC using occipital cortex as reference region showed good correspondence between the methods (Figure 2 and Table 1). The correlation and linear regression analysis demonstrated an overall strong correlation between the two methods as well as a slope close to one, therefore validating the DTPREF approximation. Nevertheless, the correlation was consistently higher for the putamen, and the estimates for the caudate region seemed to show greater variability. Such regional differences in correlations between DTPOCC and standard PGAOCC are in agreement with other studies comparing quantification methods for [18F]-FDOPA brain PET.12,25 Specifically for the DTPOCC approach, these regional differences could be explained by the smaller VOI size and the limited count statistics of the caudate nucleus compared to the putamen. Whereas a standard PGAOCC uses multiple time frames for the quantification, DTPOCC only takes into account two time frames, making it more sensitive to noise and small misalignments.
When evaluating quantification methods for [18F]-FDOPA brain PET, previous studies have pooled left and right regions, in contrast to the methodological approach of this study. While our results showed no statistical significance between left and right
An important parameter affecting the performance of the presented methods is the interval of the time frames chosen for the quantification. Previous studies suggest [18F]-FDOPA can only be considered as a truly irreversible tracer until 90 min after injection (or earlier in disease states).14,28,29 We applied PGAOCC and DTPOCC to intervals with the final frame starting earlier and later than 90 min p.i in order to evaluate the performance of the quantification methods for different tracer kinetics. The results of the linear regression (Table 1) and the Bland–Altman analysis (Table 2) suggested that both methods are providing comparable estimates despite possible deviations from true irreversible tracer kinetics. However, the Bland–Altman results revealed a wide range for the 95% limits of agreement, although the average bias remained under 7% for all regions and time intervals. This wide range for the limits of agreement was caused by two very small
An important characteristic of the DTPOCC method is the use of a population average
To contextualize the DTPOCC approximation with a clinically used simplified approach, the performance of SOR was also assessed. Results showed that the slope of the linear regression analysis between SOR and
Nonetheless, all methods were able to classify HC and PD with 100% accuracy. However, SOR seemed to better discriminate the two groups, showing a generally higher F ratio for all regions compared to PGAOCC and DTPOCC (Table 3). The results of this study regarding the comparison between SOR and
In general, unlike PGAREF, the DTPREF method relies on information from only two time frames instead of the whole TAC. Consequently, the approximation is more sensitive to noise than PGAREF. Hence, frame durations and reconstruction algorithms need to be choosen appropriately in order to minimize bias. Moreover, the patient is repositioned in the PET system for the acquisition of the second time point, which turns image registration between the two time points mandatory. In current clinical practice, [18F]-FDOPA brain PET imaging is performed on PET/CT systems such that the low-dose CT scan of each PET/CT scanning session can easily be used to coregister the PET data of the two time points, independent of potential differences in the PET emission patterns between the two scans.
The DTPOCC protocol provides a reduction in scanning time ranging from 90 to 120 min to approximately 30 min without compromising dynamic information. Based on our results, we suggest the acquisition of two static 10 min frames at 40 min and 90 min p.i. for DTPOCC quantification of [18F]-FDOPA brain PET imaging. This would translate into approximately 30 min of free camera time between the two consecutive time points (taking into account an extra 5 min for patient positioning in between scans). This interval could be used for an extra whole body PET scan or the scanning of one time point of another DTPOCC [18F]-FDOPA brain scanning protocol, which would significantly increase patient throughput. With current state of the art PET systems, 31 even shorter static acquisitions could be considered due to the higher PET system sensitivity, further reducing the scanning time. Our results suggest that DTPOCC imaging of [18F]-FDOPA uptake in the brain is an enhanced combination of static imaging and dynamic information, representing a valuable, simplified quantification of brain dopaminergic function in both PD patients and HC. The DTPOCC method is also able to avoid long acquisition protocols and therefore increase patient comfort. This is especially important in the context of an older population, as is the general case for PD patients. Moreover, shorter scans are preferable for PD patients since they reduce the chance of head movement during the image acquisition, therefore increasing image quality and quantitative accuracy.
The reference tissue dual time point method DTPOCC was able to reliably estimate the trapping rate
Footnotes
Funding
The author(s) received no financial support for the research, authorship, and/or publication of this article.
Acknowledgements
The authors would like to personally acknowledge David Vallèz García and Luis Eduardo Juárez Orozco for their support and contribution to the statistical analysis of the results.
Declaration of conflicting interests
The author(s) declared no potential conflicts of interest with respect to the research, authorship, and/or publication of this article.
Authors’ contributions
Isadora L Alves and Michel Koole jointly developed the concept and design of the manuscript. Antoon Willemsen and Ana Maria Marques da Silva contributed greatly to the discussion of the method and its assumptions. Sanne K Meles and Klaus L Leenders strongly contributed to the discussion of the application of the method and its clinical relevance. Isadora L Alves wrote the first draft and searched for relevant articles. Rudi Dierckx, Michel Koole, Antoon Willemsen, Ana Maria Marques da Silva, Sanne K Meles and Klaus L Leenders reviewed the choice of references, tables and figures and edited the initial draft and every subsequent draft.